
 Open Access Article
 This Open Access Article is licensed under a
 Creative Commons Attribution 3.0 Unported Licence
Solvation energies from atomic surface site interaction points†
Emily
Gross‡
a,
Mark D.
Driver‡
 b,
Areesha
Saif
b,
Oliver N.
Evans
b and
Christopher A.
Hunter
*b
b,
Areesha
Saif
b,
Oliver N.
Evans
b and
Christopher A.
Hunter
*b
aDepartment of Chemistry, University of Regensburg, Universitaetsstrasse 31, 93053 Regensburg, Germany
bYusuf Hamied Department of Chemistry, University of Cambridge, Lensfield Road, Cambridge CB2 1EW, UK. E-mail: herchelsmith.orgchem@ch.cam.ac.uk
First published on 9th April 2025
Abstract
The surface site interaction model for liquids at equilibrium (SSIMPLE) is a method for calculating thermodynamic properties in a fluid phase based on the use of surface site interaction points (SSIP) to represent all of the non-covalent interactions that molecules make with the environment. Interactions between the SSIPs of two different molecules are governed by a non-polar term and a polar term. Here the formulation originally made for room temperature liquids is generalized to any temperature. We show that the non-polar interaction term is temperature independent while the polar interaction term depends on temperature. This formulation was used to develop a description of the temperature dependence of fluid phase density in terms of an expansion energy, which is based on net intermolecular SSIP interactions. The method is shown to accurately model the temperature dependence of experimentally measured association constants for the formation of 1![[thin space (1/6-em)]](https://www.rsc.org/images/entities/char_2009.gif) :1 H-bonded complexes in carbon tetrachloride. The atomic interaction point (AIP) version of the SSIP descripiton of 171 different compounds was used in SSIMPLE to calculate room temperature liquid densities that are in good agreement with experimental data. Since non-covalent interactions in the vapour phase can be treated in the same way as liquid phase interactions, SSIMPLE can also be used to calcuate vapour–liquid equilibria (VLE). Experimental VLE data for 196 binary mixtures of 30 miscible compounds was collected, and SSIMPLE was shown to reproduce the experimental behaviour well.
:1 H-bonded complexes in carbon tetrachloride. The atomic interaction point (AIP) version of the SSIP descripiton of 171 different compounds was used in SSIMPLE to calculate room temperature liquid densities that are in good agreement with experimental data. Since non-covalent interactions in the vapour phase can be treated in the same way as liquid phase interactions, SSIMPLE can also be used to calcuate vapour–liquid equilibria (VLE). Experimental VLE data for 196 binary mixtures of 30 miscible compounds was collected, and SSIMPLE was shown to reproduce the experimental behaviour well.
Introduction
In multicomponent mixtures comprised of different phases in thermodynamic equilibrium, the composition of one phase may be different from the other. Data on vapour–liquid equilibria (VLE), which are dependent on temperature and pressure, can thus be used in processes like distillation, extraction, and purification to separate components.1 Because collecting VLE data from experiments requires extensive measurements, it is desirable to develop computational tools for predicting phase compositions.2–6Empirical approaches are either based on the creation of equations of state (EoS) or on quantitative structure property relationships (QSPR). EoS approaches have been in development for nearly two centuries, since Clapeyron first proposed the ideal gas law,7 and the development of EoS for the description of real gases has been an area of active research since the first equation by van der Waals.8–11 QSPR approaches use the correlation of a series of molecular descriptors to physical properties. The UNIFAC approach is a group contribution method, which was first applied to the generation of relationships to predict VLE and liquid–liquid equilibria (LLE) in 1977.12 Iterative improvements in the descriptions of the fragments have led to increased accuracy in the predictions.13–18
First principles methods based on quantum mechanics have also been used to develop models for predicting VLE. The sigma-profile description of molecules generated by COSMO19 has been used in the creation of semi-empirical relationships to predict VLE and phase diagrams. COSMO-RS has been used to calculate activity coefficients,2,20 and free energies in pure and mixed solvents as a function of temperature.6,21–28 Molecular simulation of liquid–vapour systems can be used to predict phase properties through propagation of the components through phase space. Monte Carlo (MC),29–32 molecular dynamics (MD),33–36 and dissipative particle dynamics (DPD)37–40 have all been used to predict phase compositions. Statistical associating fluid theory (SAFT) is a methodology for including the effects of association into a given theory and develop EoS to describe VLE and LLE.41–43 SAFT extends the thermodynamic perturbation theory developed by Wertheim44,45 to incorporate the treatment of mixtures.31,39–41 The SAFT approach can be used in MC simulations39 and MD simulations31,32 and has been applied to alkanes and polymer mixtures.46–53
The surface site interaction model for liquids at equilibrium (SSIMPLE) provides solvation energies based on the description of molecules as a set of surface site interaction points (SSIP) calculated using DFT.54 The dimensions of an SSIP are defined based on the 0.002 e bohr−3 electron density isosurface of a water molecule, assuming that water should be represented by one SSIP for each of the four H-bonding sites. Each SSIP is assigned an interaction parameter, εi, which is equivalent to the experimentally measured H-bond donor parameter (α) for sites with positive electrostatic potential or the H-bond acceptor parameter (−β) for sites with negative electrostatic potential.55 The H-bond scales were defined such that the product -αβ (or εiεj) corresponds to a free energy change for the interaction of two SSIPs at room temperature in units of kJ mol−1. Empirical relationships between experimentally determined H-bond parameters and the calculated molecular electrostatic potential surface (MEPS) can be used to obtain an SSIP description of any molecule as described previously.56
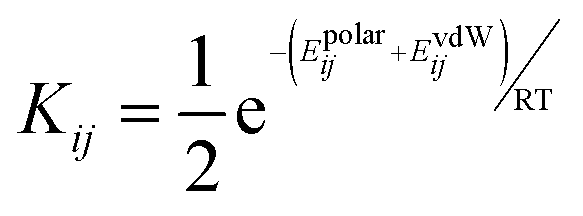
To describe a liquid phase in SSIMPLE, interactions between SSIPs are treated in a pairwise manner. The association constant for the interaction between SSIP i and SSIP j, Kij, is given by eqn (1).
 | (1) |
The interaction energy is made up of a polar term, Epolarij, which is equal to the product εiεj, and a non-polar term, EvdWij, which is the energy of the van der Waals interaction between two SSIPs, previously determined to be −5.6 kJ mol−1 based on VLE data for non-polar molecules.54 van der Waals interactions between non-polar molecules are a linear function of surface area,57 so by choosing a description that gives all SSIPs the same surface area footprint, a constant value can be used for EvdWij. In the SSIP approach, the difference between different atom types is described by differences in the number of SSIPs rather than a variable van der Waals interaction parameter.54 The liquid phase is treated as a Boltzmann ensemble of all possible SSIP interactions, and the matrix of Kij values calculated using eqn (1) can be used to determine the speciation of intermolecular contacts for any mixture of solvents and solutes. The free energy of solvation of SSIP i, ΔGS(i), calculated using eqn (2) corresponds to the free energy of transfer of SSIP i from a dilute vapour where there are no SSIP interactions.
 | (2) |
The first term in eqn (2) describes the interactions made by SSIP i with the other SSIPs in the liquid. The second term in eqn (2) corrects for the increased probability of interaction between SSIPs when they are confined to a condensed phase.54 Summation of ΔGS(i) over all SSIPs in a molecule yields the free energy of solvation of the molecule, ΔGS. This approach has been used to successfully predict phase transfer free energies for a wide range of different solutes between two liquid phases.58
SSIMPLE requires the concentrations of all species to be known and is only applicable at room temperature, because the interaction parameters, εi, were empirically parameterised using measurements of the free energy changes for formation of 1:1 complexes at 298 K. Here, we describe a generalisation of the SSIMPLE method to include the temperature dependence of SSIP interactions and vapour–liquid equilibria.
Temperature dependence of SSIP interactions
In order to obtain some insight into the temperature dependence of SSIP interactions, we will use experimental data on the enthalpy of solvation for a vapour condensing into a liquid as defined by Ben-Naim, ΔH* (Fig. 1).59,60 Since ΔH* is an equilibrium measurement that is only possible at temperatures at which the liquid exists, the temperature axis in Fig. 1 is plotted relative to the melting temperature. For rigid non-polar molecules such as methane and argon, which have no conformational degrees of freedom, the value of ΔH* is approximately constant (±0.2 kJ mol−1) over the entire liquid temperature range. This result suggests that the non-polar interaction term in eqn (1), EvdWij, should be treated as temperature independent. The behaviour of water in Fig. 1 is quite different: the value of ΔH* is not only much more negative than for the non-polar molecules, but also strongly temperature dependent. Water has a similar surface area to argon and methane, so the contribution to ΔH* from non-polar interactions is similar. It is the polar H-bonding interactions in water that lead to the large attractive interaction energies, but the extent of H-bond formation decreases with temperature. This result suggests that the polar interaction term in eqn (1), Epolarij, should be treated as temperature dependent. | ||
| Fig. 1 Temperature dependence of ΔH* for argon (black), methane (red) and water (blue). ΔT is the increase in temperature relative to the melting temperature. | ||
Fig. 2 provides an interpretation of these observations. The bound state is represented by two different species. Molecular rotation within the bound state can cause the loss of the directional polar interactions formed in the H-bonded state, whilst maintaining van der Waals interactions in the non-H-bonded state. Molecular translation breaks all interactions, leading to the free state. Non-polar contacts are temperature-independent, because these interactions are not affected by temperature-induced rotational motion, but the contribution from polar interactions depends on the relative populations of the non-H-bonded and H-bonded states, which are sensitive to temperature. If the relative populations of the two bound states in Fig. 2 are determined by a Boltzmann distribution, the temperature-dependence of the polar interaction term in eqn (1), Epolarij, is given by eqn (3).
 | (3) |
 | ||
| Fig. 2 Depiction of the three states that describe the interaction of two water molecules. In the free state, there are no interactions, and there is no restriction to motion. In the bound state, directional H-bonding interactions, can be broken if there is sufficient rotational energy. Non-directional van der Waals contacts remain in the non-H-bonded complex. SSIPs are represented as red and blue sites on the van der Waals surface. | ||
Since the value of Epolarij(T) is known at 298 K for any pairwise SSIP interaction, eqn (3) can be solved to obtain the value of Epolarij(0). In practice, a lookup table of Epolarij(0) values is more straightforward to implement.
To assess the validity of this temperature-dependent formulation of the pairwise SSIP interaction energy, we compare calculated equilibrium constants with experimental data measured at different temperatures for the formation of 1:1 complexes that make a single H-bond, i.e. a single SSIP contact.61–94 The ratios of the association constants experimentally measured in carbon tetrachloride at 293 K and 323 K were obtained for complexes of different solutes with known experimental values of the H-bond parameters, α and β. The H-bond parameters were used as the SSIP values, εi and εj, for the two solutes, and eqn (3) was used in SSIMPLE to calculate the equilibrium constants for the solute-solute interactions, as described previously.95 The calculated and experimental results are compared in Fig. 3. Although there is considerable scatter, the correlation in Fig. 3 validates the proposed formulation for the temperature dependence of SSIP interactions.
 | ||
| Fig. 3 Comparison of experimental measurements of the ratio of association constants at two different temperatures with the corresponding values calculated with SSIMPLE and eqn (3) for 169 1:1 complexes in carbon tetrachloride. | ||
Temperature dependence of fluid phase densities
The density of a liquid is temperature dependent. As the temperature increases, the density decreases, with a corresponding increase in vapour pressure. For non-polar molecules the total number density of molecules (i.e. the concentration) in the vapour and the liquid phases, ρ, obeys the law of rectilinear diameter, if the pressure is maintained at the saturated vapour pressure (eqn (4)).96,97 | (4) |
 | (5) |
The zero point number density, ρ0, corresponds to the most concentrated state, which in practice is never reached because the liquid freezes. The lowest possible number density, ρc, occurs at the critical point, when vapour and liquid number densities are both equal (eqn (6)).57
 | (6) |
Thermal expansion results in the incorporation of additional void volume, such that the total number density of the liquid and vapour phases decreases with increasing temperature. The expansion energy which governs this process, Eexp, is the average energy required to break interactions between molecules. The expansion energy can be decomposed into contributions from non-polar van der Waals interactions, EvdWexp, and polar interactions, Epolarexp, in the same way as the pairwise SSIP interactions EvdWij and Epolarij that define Kij in eqn (1).
We can use non-polar molecules to examine the relationship between the expansion energy and the total van der Waals interaction energy available to a molecule in the condensed phase. At the critical temperature, Tc, the liquid and vapour number densities are both equal to ½ ρc. Substitution of eqn (5) and (6) into eqn (4) provides a relationship between the expansion energy and the critical temperature (eqn (7)).
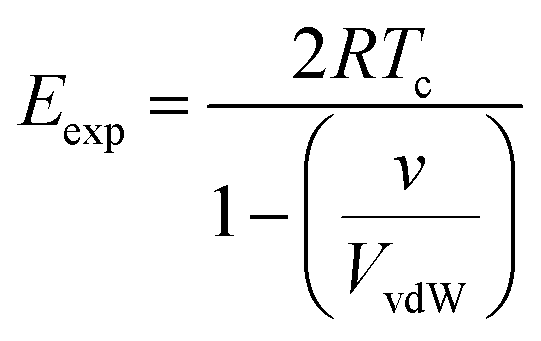 | (7) |
Values of Eexp were obtained for 190 alkanes by using the experimental values of Tc and calculated values of VvdW in eqn (7) (see ESI† for details). Fig. 4 shows the relationship between Eexp and the number of SSIPs per molecule, N, which was calculated from the surface area of the 0.002 e bohr−3 electron density isosurface. Although there is some variation, eqn (8), plotted in black in Fig. 4, provides a reasonable description of the data.
 | (8) |
 | ||
| Fig. 4 Relationship between the expansion energy Eexp and the number of SSIPs N for 190 alkanes. The black line is eqn (8). | ||
If all SSIPs were paired, then there would be N/2 interactions, and the total van der Waals interaction energy would be ½ NEvdWij. The energy barrier to expansion for alkanes is half of this total, but reduced by an additional factor of (1 + N/12), such that there is an upper limit of −3EvdWij on the value of Eexp for large N (the asymptote in Fig. 4).
In order to determine the contribution that polar interactions make to the expansion energy, the experimental temperature dependence of the total number density of water in the liquid and vapour phases was examined. An apparent value of the expansion energy, Eappexp, can be computed using the experimental values of ρl and ρv in eqn (4) (eqn (9)).
 | (9) |
Fig. 5 shows that Eappexp changes significantly with temperature for water, i.e. water does not obey the law of rectilinear diameter. The value of Eappexp increases dramatically at low temperatures, where H-bonded states are more highly populated. The more H-bonding interactions are made, the greater the energy barrier to pulling molecules apart in the expansion process.
 | ||
| Fig. 5 Relationship between apparent expansion energy Eappexp calculated using eqn (9) and temperature for water. | ||
It is possible to calculate the extent of H-bond formation in the liquid or vapour phase of water as a function of temperature using SSIMPLE. However, the equilibrium constant for pairwise interactions between SSIPs involves contributions from both van der Waals interactions and polar interactions (Eqn (1)). In order to determine the population of the bound state that is H-bonded in Fig. 2, the total population of the bound state calculated using SSIMPLE must be compared with the population of the bound state that is non-H-bonded, which can be calculated using just the van der Waals term in eqn (1) (i.e. by setting Epolarij = 0). For SSIPs that only make van der Waals interactions, the probability that a H-bonded or a non-H-bonded state is populated would be equal because the energy difference is zero. The extent to which polar interactions perturb these populations can therefore be determined using eqn (10) to calculate the fraction of the bound state that is H-bonded in the liquid and vapour phases, ϕlb and ϕvb.
 | (10) |
 | (11) |
Since SSIPs that make only van der Waals interactions can be considered equivalent, the speciation of SSIP contacts for a phase containing only non-polar molecules is described by eqn (12), which can be solved to obtain an analytical expression for ψvdWf (eqn (13)).
| [i] = [if] + 2KvdW[if]2 | (12) |
 | (13) |
It is possible to use the temperature dependent formulation of Kij in eqn (1) in conjunction with the experimental number densities of the liquid and vapour phases of water to calculate the speciation in both phases as a function of temperature using SSIMPLE. The fraction of bound states that are H-bonded in the liquid and vapour phases, ϕlb and ϕvb, from eqn (10) can then be used to obtain the total fraction of bound states that are H-bonded for the vapour–liquid system, ϕb, using eqn (14).
 | (14) |
Fig. 6 shows that the value of Eappexp calculated from the experimental data for water is closely related to the fraction of the bound state that is H-bonded, ϕb, calculated using SSIMPLE. The line of best fit through the data obtained above 313 K has a correlation coefficient of R2 = 0.9996. The four lower temperature datapoints in Fig. 6 deviate from this line, presumably because there is a change in the structure of the liquid as it approaches the freezing point due to the geometric constraints imposed by highly H-bonded networks i.e. there is a decrease in density associated with formation of ice-like structures.
 | ||
| Fig. 6 Relationship between apparent expansion energy Eappexp for water and the fraction of the bound state that is H-bonded calculated using SSIMPLE and the experimental number densities of the liquid vapour phases, fb. Black dotted line is the straight line of best fit without the four lowest temperature points (R2 = 0.9996). | ||
The line of best fit in Fig. 6 has a slope of 5.3 kJ mol−1 and an intercept of 2.1 kJ mol−1. These values can be compared with the value of EvdWexp calculated using eqn (8) for a molecule with four SSIPs that makes only van der Waals interactions (4.2 kJ mol−1) and with the total polar interaction energy for a water molecule at the zero point (twice Epolarij(0) for a water–water H-bond, which is −25.6 kJ mol−1). Some of the values of Eappexp are two to three times larger than these energies. In order to obtain an expression for Eappexp that is consistent for both polar and non-polar molecules, it is required that if polar interactions were to make no contribution to the expansion energy of water, then ϕb would be 0.5 and Eappexp would be equal to EvdWexp, i.e. 4.2 kJ mol−1. Noting that the intercept in Fig. 6 is exactly half of 4.2 kJ mol−1, these conditions are satisfied by eqn (15).
 | (15) |
The value of Epolarexp can therefore be determined from the slope of the line of best fit in Fig. 6, as 6.4 kJ mol−1, which is a quarter of the total polar interaction energy for water at the zero point, i.e. the polar interaction energy per SSIP at the zero point. These results suggest that a suitable formulation of the expansion energy involves the sum of the van der Waals term given by eqn (8) and the polar interaction energy per SSIP at the zero point calculated using eqn (16).
 | (16) |
In order to calculate Epolarexp, we therefore require a method to determine which SSIPs interact at the zero point. The hierarchical SSIP pairing strategy described previously for cocrystal prediction is used.98 In this approach, all SSIP interactions are assumed to be independent and free to find the best partner, such that there are no steric constraints on contacts, no packing effects, and no cooperativity between sites that are close in space on the surface of a molecule. This means that the best H-bond donor pairs with the best H-bond acceptor, and the second best H-bond donor with the next best H-bond acceptor etc. Any remaining SSIPs of the same sign that have not been paired are assumed to not form polar interactions, and therefore do not contribute.
Eqn (15) shows that the contribution of polar interactions to the expansion energy is weighted by the fraction of bound states that are H-bonded, i.e the fraction of polar interactions that are actually made at any given temperature determines how much polar interaction is available to oppose expansion. The denominator in eqn (15) can be rationalised by reformulating eqn (4) that was used for non-polar molecules as eqn (17) for polar molecules.
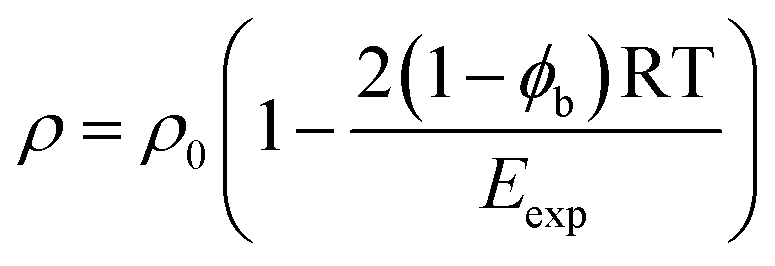 | (17) |
| Eexp = EvdWexp + ϕbEpolarexp | (18) |
The 2(1 − ϕb) term in eqn (17) is a factor that scales the input of thermal energy that drives expansion. For molecules that make only van der Waals interactions, this term is equal to one, so eqn (17) becomes identical to eqn (4). For molecules that make polar interactions, this term is less than one. When polar interactions are present, some of the thermal energy goes into rotational motion that breaks directional H-bonding interactions, and the rest goes into translational motion that leads to expansion (see Fig. 2). In effect, the polar interactions must be broken before expansion can take place, so the amount of thermal energy that goes into expansion is proportional to the population of bound states that are non-H-bonded.
Density of the liquid phase
The applicability of eqn (17) to a wide range of different compounds was tested using experimental data for the densities of pure liquids at room temperature and pressure. We recently reported an improved description of the surfaces of organic molecules based on atomic interaction points (AIP), and this version of the SSIP approach was used in the calculations below.99 Although the SSIP and AIP descriptions of organic molecules are closely related, there are some differences: the assignment of AIPs is based on electron density isosurfaces of individual atoms, whereas SSIPs are assigned based on the electron density isosurface of the entire molecule; the number of AIPs is determined by atom types rather than the total surface area of the molecule; AIPs that are used to represent smaller surface areas are treated as either half of an SSIP or a quarter of an SSIP. It is possible to use the AIP description in SSIMPLE to calculate speciation of contacts and solvation energies by aggregating fractional AIPs into single SSIPs. For example, the top and bottom face of a carbon atom in a π-system are described by two half AIPs. These two AIPs can therefore be combined into a single SSIP, which is assigned an interaction parameter, εi, that is the average of the two AIP interaction parameters. All other fractional AIPs can be aggregated in a similar manner to obtain an SSIP version of the AIP description for use in SSIMPLE (see ESI† S5 for details).The total number of SSIPs obtained by this procedure, NAIP, may differ from the total number of SSIPs calculated using the total surface area of the molecule. Since the number of SSIPs is important for an accurate description of the non-polar van der Waals contribution to the solvation energy, a correction is applied to solvation energies calculated using the AIP description in SSIMPLE (Eqn (19)).
 | (19) |
For common solvents that are liquids at room temperature and pressure, the vapour pressure is sufficiently low that we can assume ρv = 0 and ρl = ρ. An iterative algorithm was used to find the number density of the liquid that satisfies eqn (17). The number density of the liquid was initially set at ρc calculated using eqn (6). The SSIMPLE algorithm was then used to calculate the speciation of SSIP contacts and hence the fraction of bound states that are H-bonded, ϕb. Eqn (17) was then used to calculate a new number density. The average of the new and initial number densities was used in the SSIMPLE algorithm for the next iteration of this process, gradually concentrating the liquid until the number density converged.
Fig. 7 compares the experimentally measured densities of 171 liquids at 298 K (see ESI† S1 for details) with the calculated values. The agreement is generally excellent, and the RMSE of 0.87 M is largely down to the two outliers indicated in Fig. 7, hydrogen peroxide and hydrazine. For both of these liquids, the calculated density is significantly lower than the experimental value. This discrepancy could be due to inaccuracies in the calculated SSIP values, which are not polar enough, or due to cooperative multipoint interactions between molecules which are not considered in the SSIMPLE approach, which treats all SSIPs as independent.
 | ||
| Fig. 7 Relationship between the experimentally measured densities at 298.15 K, ρexp, and the values calculated using eqn (17), ρcalc, for 171 liquids (RMSE = 0.87 M). The two outliers are hydrazine and hydrogen peroxide. | ||
Density of the vapour phase
Interactions in the vapour phase can be treated in the same way as the liquid phase, so SSIMPLE can be used to calculate solvation energies of molecules in the vapour phase as well as the liquid phase. Experimental data on the transfer of alkanes from the vapour phase into alkane solvents shows that the description of phase equilibria requires an additional free energy contribution, C0.100 Solvation energies calculated for liquid and vapour phases using SSIMPLE can therefore be used to obtain the fraction of molecules in the vapour phase using eqn (20), and hence the number density of the liquid phase using eqn (4).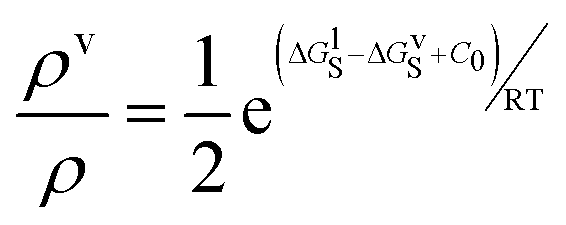 | (20) |
The value of C0 can be estimated from experimental data. For some liquids, e.g. water and toluene, C0 was found to be approximately zero at room temperature,97 and if we assume that this value does not change significantly with temperature, eqn (20) can be used to estimate the distribution of molecules between the liquid and vapour phases for the pure fluids at the saturated vapour pressure. An iterative algorithm was used to solve eqn (20) for the density of the vapour phase in equilibrium with the liquid phase. The number density of the vapour phase was initially set to zero, and the number density of the liquid phase was initially set to ρ, which was calculated as described above. The speciation of SSIP contacts in the liquid was used to calculate ΔGlS, and the number density of the vapour phase was calculated using eqn (20) starting with ΔGvS = 0. The new number density of the vapour phase was used to obtain a new number density for the liquid phase using eqn (4). SSIMPLE was then used to calculate the speciation of SSIP contacts in both phases, and the solvation energies were used in eqn (20) to obtain the number density of the vapour phase for the next iteration of this process, gradually concentrating the vapour and diluting the liquid until the number densities converged.
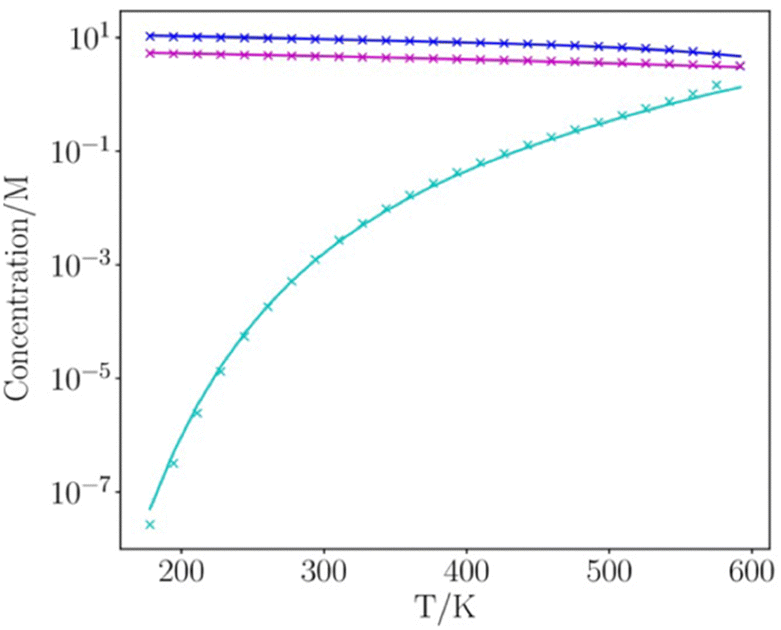
Fig. 8 and 9 show the results for water and toluene calculated for the entire liquid temperature range. The calculated mean density of the two phases, ½ ρ, is in excellent agreement with the experimental data for all temperatures. The temperature dependence of the number densities of the liquid and vapour phases are also reproduced well by the calculation. The only significant deviations between calculation and experiment occur for temperatures that are close to the critical point, where the liquid structure begins to break down.
 | ||
| Fig. 8 Temperature-dependence of the density of water (ρl for the liquid phase in blue, ρv for the vapour phase in cyan, and the average density of the two phases, ½ ρ, in magenta). Experimental data are shown as crosses and values calculated using SSIMPLE are shown as lines. | ||
 | ||
| Fig. 9 Temperature-dependence of the density of toluene (ρl for the liquid phase in blue, ρv for the vapour phase in cyan, and the average density of the two phases, ½ ρ, in magenta). Experimental data are shown as crosses and values calculated using SSIMPLE are shown as lines. | ||
Phase composition of binary mixtures
SSIPs are treated as independent interaction sites in the SSIMPLE approach, which means that the treatment of mixtures is no different from the treatment of pure liquids. Extensive temperature-dependent data are available on binary mixtures of liquids, and these experimental measurements were used to test the description of solvation in liquid mixtures. Experimental VLE data for binary mixtures was collected from DETHERM101 (see ESI† S7 for details). In order to compare solvation energies for the same compounds in multiple solvent environments, VLE datasets for 196 binary mixtures of 30 miscible liquids were used. The compounds include a range of functional groups and encompass non-polar solvents, polar aprotic solvents and polar protic solvents as indicated in Table 1. The values of C0 for these compounds were estimated by comparing the vapour pressure of the pure liquid obtained from the Antoine equation (P in eqn (21)) with the vapour density calculated using SSIMPLE with C0 set to zero, ρv0. Since the vapour can be treated as an ideal gas if the vapour pressure is low, the value of C0 is obtained using eqn (22). | (21) |
 | (22) |

|
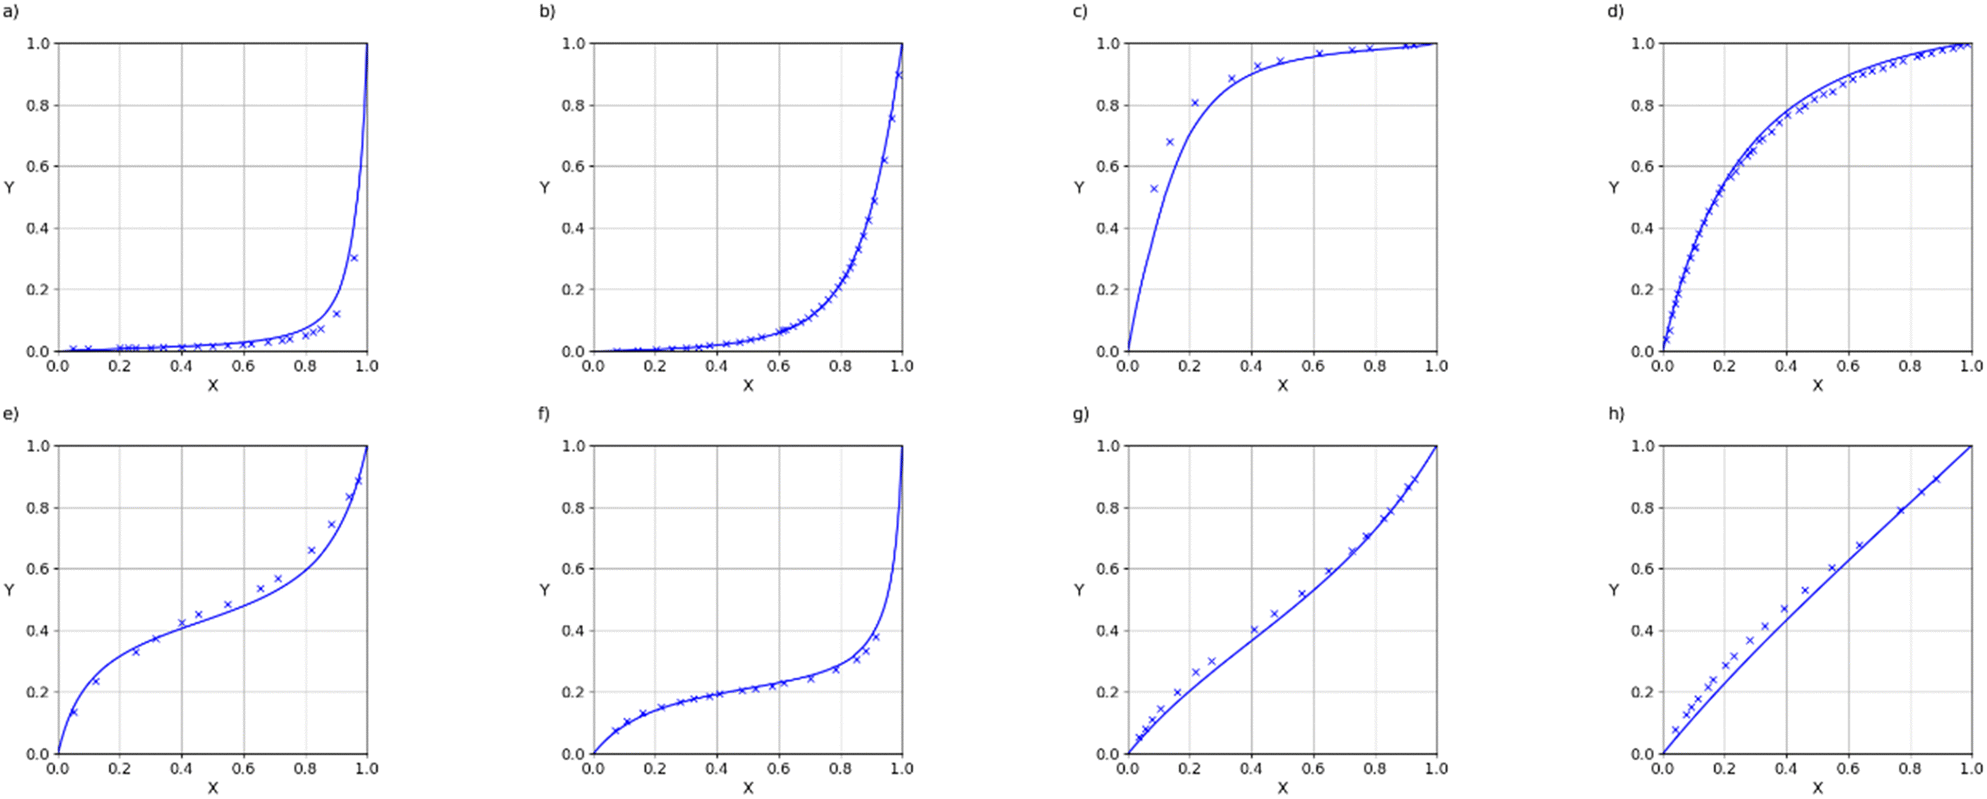
Assuming that the C0 values are independent of the composition of the phases, these parameters can be used in SSIMPLE to calculate number densities in the two components of the vapour phase by solving eqn (20) for the binary mixture using the iterative procedure described above for VLE. The SSIMPLE vapour density is calculated at the saturated vapour pressure when the liquid and vapour pressure are in equilibrium, but the experimental values were measured at pressures of 101325–101330 Pa. When the saturated vapour pressure is low, intermolecular interactions in the gas phase are negligible, so although the density of the vapour is reduced at lower pressures, the composition is unaffected. VLE data for binary mixtures are presented in the form of X–Y plots, where X(A) is the mole fraction of component A in the liquid phase, and Y(A) is the mole fraction of component A in the gas phase. Fig. 10 illustrates typical results for mixtures of two compounds that contain the same functional groups. These mixtures show close to ideal behaviour (X = Y), which is well-reproduced by the SSIMPLE calculation (see ESI† S8 for more examples). Fig. 11 shows examples of binary mixtures of dissimilar compounds. In some cases, there are significant deviations from ideality, which are again well-described by the calculated values.
 | ||
| Fig. 10 VLE of binary mixtures of two similar components: (a) 2-propanol and 1-propanol (RMSE = 0.0131), (b) dichloromethane and chloroform (RMSE = 0.0356), (c) benzene and toluene (RMSE = 0.0290), (d) acetone and 2-butanone (RMSE = 0.0047). Experimental data are shown as crosses and values calculated using SSIMPLE are shown as lines. X is the liquid phase composition of component 1 and Y is the vapour phase composition of component 1. | ||
 | ||
| Fig. 11 VLE of binary mixtures of two dissimilar components: (a) dimethyl sulfoxide and ethyl acetate (RMSE = 0.0410), (b) 1-butanol and diethyl ether (RMSE = 0.0134), (c) dichloromethane and acetic acid (RMSE = 0.0881), (d) 2-butanone and chlorobenzene (RMSE = 0.0120), (e) acetic acid and toluene (RMSE = 0.0230), (f) n-octane and 2-propanol (RMSE = 0.0122), (g) n-hexane and tetrahydrofuran (RMSE = 0.0272), (h) diisopropyl ether and ethyl acetate (RMSE = 0.0446). Experimental data are shown as crosses and values calculated using SSIMPLE are shown as lines. X is the liquid phase composition of component 1 and Y is the vapour phase composition of component 1. | ||
The agreement between the SSIMPLE calculation and the experimental data was evaluated using the RMSE of the vapour phase composition (Y), and the results are tabulated in Table 1. The average RMSE between calculation and experiment across the entire dataset is 7.6%. The examples in Fig. 10 and 11, which have RMSE values that range from 1% to 9%, illustrate the quality of the predictions obtained using of SSIMPLE. Fig. 12 shows the X–Y plots for the three binary mixtures with largest values of RMSE (21%). The results in Table 1 are organised so that compounds with similar functional groups can be compared, but it is difficult to discern any clear patterns. The values of RMSE appear to be slightly higher for the chlorinated solvents. Two of the 21% RMSE examples in Fig. 12 involve chloroform, but there are other chloroform mixtures with low values of RMSE: acetic acid 6% and dichloromethane 4%.
 | ||
| Fig. 12 VLE of binary mixtures that show the largest discrepancy between calculation and experiment: (a) 1-octanol and n-pentane (RMSE = 0.2097), (b) chloroform and diisopropyl ether (RMSE = 0.2061), (c) chloroform and acetone (RMSE = 0.2099). Experimental data are shown as crosses and values calculated using SSIMPLE are shown as lines. X is the liquid phase composition of component 1 and Y is the vapour phase composition of component 1. | ||
Conclusions
The surface site interaction model for liquids at equilibrium (SSIMPLE) describes non-covalent interactions by representing molecules as a set of independent surface site interaction points (SSIP). Interactions between SSIPs on two different molecules are calculated through a non-polar term, which describes the van der Waals interactions, and a polar term, which describes directional interactions like H-bonding. The parameters that appear in the polar term are obtained from ab initio calculations of molecular electrostatic potential surfaces while the van der Waals term is a constant based on the surface area of an SSIP.Here the SSIMPLE approach is generalized to a temperature-dependent form. The polar interactions are temperature-dependent and can be described using a Boltzmann distribution between two different bound states for the interaction of two SSIPs. In one bound state, polar directional interactions are made, and in the other bound state, rotational motion breaks these interactions, leaving only the non-polar interaction. The approach provides an accurate description of the effect of temperature on experimentally measured association constants for the formation of 1:1 H-bonded complexes in carbon tetrachloride. This formulation has been extended to describe the temperature dependence of the density of the fluid phase in terms of an expansion energy, which is made up of a constant non-polar contribution and a temperature-dependent polar contribution. The method shows very good agreement with the experimentally determined densities of 171 different liquids at room temperature.
Since non-covalent interactions in the vapour phase can be treated in the same way as in the liquid phase, the speciation of SSIP interactions can be used to calculate solvation free energies in both phases. However, treatment of vapour–liquid equilibria requires an additional compound-dependent free energy that is currently only available from experimental measurements. Using these empirical parameters, SSIMPLE was used to make accurate predictions of vapour–liquid equilibria for 196 binary mixtures at different temperatures. The temperature-dependent version of SSIMPLE described here thus represents a promising general method for predicting the equilibrium and solvation properties of liquids.
The generality of the approach stems from the fact that the calculations are based on the calculated ab initio molecular electrostatic potential surfaces of the molecules together with a relatively small number of empirically established parameters:
1. The van der Waals interaction energy between two SSIPs is 0.3 kJ mol−1 Å−2, based on experimental VLE data for noble gases, alkanes and perfluorocarbons.54
2. The relationship between the polarity of an SSIP and the calculated MEPS, based on experimental data on H-bonded complexes in carbon tetrachloride.53,99
3. The packing coefficient, r, and the zero point void, v, are 90% and 5.0 Å3, based on experimental data on noble gases.57
4. The relationship between the number of SSIPs in a molecule and the non-polar component of the fluid phase expansion energy, based on experimental data on alkanes described here.
The resulting speciation of SSIP interactions in a phase follows directly from these parameters. An additional empirical correction is required to describe vapour–liquid equilibria, but this free energy term can be estimated using the Antoine coefficients for pure compounds. Predictions for liquid and vapour densities, solvation energies, partition coefficients, and solute association constants can thus be made for a wide range of compounds.
Author contributions
The manuscript was written through contributions of all authors.Data availability
All supporting data is provided in the ESI.†Conflicts of interest
There are no conflicts to declare.Acknowledgements
We acknowledge financial support from the EPSRC (EP/M506485/1) and the German Science Foundation (DFG, RTG 2620, project 426795949).Notes and references
- R. H. Perry, Perry's Chemical Engineers’ Handbook, McGraw-Hill, New York, 7th edn, 1997 Search PubMed.
- B. Kolbe and J. Gmehling, Fluid Phase Equilib., 1985, 23, 213–226 Search PubMed.
- M. M. Abbott, Fluid Phase Equilib., 1986, 29, 193–207 CrossRef CAS.
- T. Laursen and S. I. Andersen, J. Chem. Eng. Data, 2003, 48, 1085–1087 Search PubMed.
- S. Nebig, R. Bölts and J. Gmehling, Fluid Phase Equilib., 2007, 258, 168–178 CrossRef CAS.
- R. Kato and J. Gmehling, J. Chem. Thermodyn., 2005, 37, 603–619 CrossRef CAS.
- B. P. É. Clapeyron, J. Ec. Polytech., 1834, 14, 153–190 Search PubMed.
- J. D. van der Waals, PhD Thesis, University of Leiden, 1873 Search PubMed.
- Y. S. Wei and R. J. Sadus, AIChE J., 2000, 46, 169–196 Search PubMed.
- A. Anderko, Fluid Phase Equilib., 1990, 61, 145–225 CrossRef CAS.
- J. O. Valderrama, Ind. Eng. Chem. Res., 2003, 42, 1603–1618 CrossRef CAS.
- A. Fredenslund, J. Gmehling and P. Rasmussen, Vapor-Liquid Equilibria Using UNIFAC: A Group-Contribution Method, Elsevier, 1st edn, 1977, p. 392 Search PubMed.
- S. Skjold-Jorgensen, B. Kolbe, J. Gmehling and P. Rasmussen, Ind. Eng. Chem. Process Des. Dev., 1979, 18, 714–722 CrossRef.
- T. Holderbaum and J. Gmehling, Fluid Phase Equilib., 1991, 70, 251–265 CrossRef CAS.
- J. Gmehling, J. Li and M. Schiller, Ind. Eng. Chem. Res., 1993, 32, 178–193 CrossRef CAS.
- R. Wittig, J. Lohmann and J. Gmehling, Ind. Eng. Chem. Res., 2003, 42, 183–188 CrossRef CAS.
- Ionic Liquids, ed. R. D. Rogers and K. R. Seddon, American Chemical Society, Washington, DC, 2002 Search PubMed.
- Ionic Liquids in Synthesis, ed. P. Wasserscheid and T. Welton, Wiley, 2007 Search PubMed.
- A. Klamt and G. Schüürmann, J. Chem. Soc., Perkin Trans. 2, 1993, 799–805 RSC.
- A. Klamt and F. Eckert, Fluid Phase Equilib., 2000, 172, 43–72 CrossRef CAS.
- A. Klamt and F. Eckert, Fluid Phase Equilib., 2004, 217, 53–57 CrossRef CAS.
- A. Klamt, J. Phys. Chem., 1995, 99, 2224–2235 CrossRef CAS.
- A. Klamt, V. Jonas, T. Bürger and J. C. W. Lohrenz, J. Phys. Chem. A, 1998, 102, 5074–5085 CrossRef CAS.
- S.-T. Lin and S. I. Sandler, Ind. Eng. Chem. Res., 2002, 41, 899–913 CrossRef CAS.
- F. Eckert and A. Klamt, AIChE J., 2002, 48, 369–385 Search PubMed.
- R. P. Gerber and R. D. P. Soares, Ind. Eng. Chem. Res., 2010, 49, 7488–7496 CrossRef CAS.
- R. Xiong, S. I. Sandler and R. I. Burnett, Ind. Eng. Chem. Res., 2014, 53, 8265–8278 CrossRef CAS.
- N. D. Austin, N. V. Sahinidis and D. W. Trahan, Chem. Eng. Sci., 2017, 159, 93–105 CrossRef CAS.
- J. A. Barker and R. O. Watts, Chem. Phys. Lett., 1969, 3, 144–145 CrossRef CAS.
- D. A. Kofke, Mol. Phys., 1993, 78, 1331–1336 CrossRef CAS.
- G. C. A. M. Mooij, D. Frenkel and B. Smit, J. Phys.: Condens. Matter, 1992, 4, L255–L259 CrossRef.
- M. G. Martin and J. I. Siepmann, J. Phys. Chem. B, 2002, 103, 4508–4517 CrossRef.
- W. Chapman, K. Gubbins, G. Jackson and M. Radosz, Fluid Phase Equilib., 1989, 52, 31–38 CrossRef CAS.
- W. G. Chapman, K. E. Gubbins, G. Jackson and M. Radosz, Ind. Eng. Chem. Res., 1990, 29, 1709–1721 CrossRef CAS.
- B. H. Morrow and J. A. Harrison, Energy Fuels, 2019, 33, 848–858 CrossRef CAS.
- M. Veit, S. K. Jain, S. Bonakala, I. Rudra, D. Hohl and G. Csányi, J. Chem. Theory Comput., 2019, 15, 2574–2586 CrossRef CAS PubMed.
- R. D. Groot and P. B. Warren, J. Chem. Phys., 1997, 107, 4423–4435 CrossRef CAS.
- I. Pagonabarraga and D. Frenkel, J. Chem. Phys., 2001, 115, 5015–5026 CrossRef CAS.
- J. C. Shillcock and R. Lipowsky, J. Chem. Phys., 2002, 117, 5048–5061 CrossRef CAS.
- S. Yamamoto, Y. Maruyama and S.-A. Hyodo, J. Chem. Phys., 2002, 116, 5842–5849 CrossRef CAS.
- W. G. Chapman, K. E. Gubbins, C. G. Joslin and C. G. Gray, Fluid Phase Equilib., 1986, 29, 337–346 CrossRef CAS.
- E. A. Müller and K. E. Gubbins, Ind. Eng. Chem. Res., 2001, 40, 2193–2211 CrossRef.
- K. E. Gubbins, Fluid Phase Equilib., 2016, 416, 3–17 CrossRef CAS.
- M. S. Wertheim, J. Stat. Phys., 1984, 35, 35–47 CrossRef.
- M. S. Wertheim, J. Stat. Phys., 1984, 35, 19–34 CrossRef.
- S. Rahman, O. Lobanova, G. Jiménez-Serratos, C. Braga, V. Raptis, E. A. Müller, G. Jackson, C. Avendaño and A. Galindo, J. Phys. Chem. B, 2018, 122, 9161–9177 CrossRef CAS PubMed.
- V. Papaioannou, T. Lafitte, C. Avendaño, C. S. Adjiman, G. Jackson, E. A. Müller and A. Galindo, J. Chem. Phys., 2014, 140, 054107 CrossRef PubMed.
- J. Jover, A. Galindo, G. Jackson, E. A. Müller and A. J. Haslam, Mol. Phys., 2015, 113, 2608–2628 CrossRef CAS.
- J. Gross and G. Sadowski, Ind. Eng. Chem. Res., 2001, 40, 1244–1260 CrossRef CAS.
- J. Gross and G. Sadowski, Ind. Eng. Chem. Res., 2002, 41, 5510–5515 CrossRef CAS.
- T. Lafitte, A. Apostolakou, C. Avendaño, A. Galindo, C. S. Adjiman, E. A. Müller and G. Jackson, J. Chem. Phys., 2013, 139, 154504 CrossRef PubMed.
- J. T. Cripwell, S. A. M. Smith, C. E. Schwarz and A. J. Burger, Ind. Eng. Chem. Res., 2018, 57, 9693–9706 CrossRef CAS.
- I. Polishuk and J. M. Garrido, J. Mol. Liq., 2019, 291, 111321 CrossRef CAS.
- C. A. Hunter, Chem. Sci., 2013, 4, 1687–1700 RSC.
- C. A. Hunter, Angew. Chem., Int. Ed., 2004, 43, 5310–5324 CrossRef CAS PubMed.
- C. S. Calero, J. Farwer, E. J. Gardiner, C. A. Hunter, M. Mackey, S. Scuderi, S. Thompson and J. G. Vinter, Phys. Chem. Chem. Phys., 2013, 15, 18262–18273 Search PubMed.
- C. A. Hunter, Chem. Sci., 2013, 4, 834–848 RSC.
- M. C. Storer and C. A. Hunter, Chem. Soc. Rev., 2022, 51, 10064–10082 RSC.
- A. Ben-Naim, J. Phys. Chem., 1978, 82, 792–803 CrossRef CAS.
- A. Ben-Naim, Solvation Thermodynamics, Plenum Press, New York, NY, USA, Springer, Berlin/Heidelberg, Germany, 1987 Search PubMed.
- Å. Austerheim, T. Gramstad, C. Moberg, G. D. Daves, Jr., S. C. T. Svensson and B. Wigilius, Acta Chem. Scand., 1985, 39b, 583–587 CrossRef.
- U. Blindheim and T. Gramstad, Spectrochim. Acta, Part A, 1969, 25, 1105–1113 CrossRef CAS.
- U. Blindheim and T. Gramstad, Spectrochim. Acta, 1965, 21, 1073–1079 CrossRef CAS.
- A. J. Dale and T. Gramstad, Spectrochim. Acta, Part A, 1972, 28, 639–650 CrossRef CAS.
- J. Ekrene and T. Gramstad, Spectrochim. Acta, Part A, 1972, 28, 2465–2469 CrossRef CAS.
- N. Futsaeter and T. Gramstad, Spectrochim. Acta, Part A, 1980, 36, 1083–1088 CrossRef.
- T. Gramstad and K. Tjessem, J. Mol. Struct., 1978, 48, 147–151 CrossRef CAS.
- T. Gramstad, Spectrochim. Acta, Part A, 1970, 26, 741 CrossRef CAS.
- T. Gramstad and W. Fuglevik, Spectrochim. Acta, 1965, 21, 503–509 CrossRef CAS.
- T. Gramstad and H. Storesund, Spectrochim. Acta, Part A, 1970, 26, 426–428 CrossRef CAS.
- T. Gramstad and G. van Binst, Spectrochim. Acta, 1966, 22, 1681–1696 CrossRef CAS.
- T. Gramstad, Spectrochim. Acta, 1964, 20, 729–731 Search PubMed.
- T. Gramstad, Spectrochim. Acta, 1963, 19, 1698 CrossRef CAS.
- T. Gramstad, Spectrochim. Acta, 1963, 19, 497–508 Search PubMed.
- T. Gramstad, Spectrochim. Acta, 1963, 19, 829–834 CrossRef CAS.
- T. Gramstad, Spectrochim. Acta, 1963, 19, 1363–1369 CrossRef CAS.
- T. Gramstad, Spectrochim. Acta, 1963, 19, 1391–1392 CrossRef CAS.
- T. Gramstad and E. D. Becker, J. Mol. Struct., 1970, 5, 253–261 CrossRef CAS.
- T. Gramstad, S. L. Buchwald, J. F. Richardson, A. Hallberg, J. Alvhäll, R. Svenson, M. Greune, J. Weidlein, A. Nasiri and Y. Okada, Acta Chem. Scand., 1993, 47, 68–71 CrossRef CAS.
- T. Gramstad and W. J. Fuglevik, Spectrochim. Acta, 1965, 21, 343–344 CrossRef CAS.
- T. Gramstad, W. J. Fuglevik, L. Lipschitz and J. T. Nielsen, Acta Chem. Scand., 1962, 16, 2368–2372 CrossRef CAS.
- T. Gramstad, W. J. Fuglevik, A. Salmenperä, A. Block-Bolten, J. M. Toguri and H. Flood, Acta Chem. Scand., 1962, 16, 1369–1377 CrossRef CAS.
- T. Gramstad, A. Haaland, K.-G. Martinsen, J. Vogt, I. Grenthe, K. Li, R. K. Milanova, H. Nakata, A. Nasiri and T. Tsuda, Acta Chem. Scand., 1993, 47, 985–989 CrossRef CAS.
- T. Gramstad, S. Liaaen-Jensen, S. V. Meshkov, H. Lönnberg, M. Dahlqvist, M. M. Kady and S. B. Christensen, Acta Chem. Scand., 1992, 46, 1087–1091 CrossRef CAS.
- T. Gramstad and Ø. Mundheim, Spectrochim. Acta, Part A, 1972, 28, 1405–1413 CrossRef CAS.
- T. Gramstad, V. Mutt and L. G. Sillén, Acta Chem. Scand., 1961, 15, 1337–1346 CrossRef CAS.
- T. Gramstad and T. Olsen, Spectrochim. Acta, Part A, 1974, 30, 2121–2131 CrossRef.
- T. Gramstad and O. R. Simonsen, Spectrochim. Acta, Part A, 1976, 32, 723–730 CrossRef.
- T. Gramstad, S. I. Snaprud, A. Salmenperä, A. Block-Bolten, J. M. Toguri and H. Flood, Acta Chem. Scand., 1962, 16, 807–819 CrossRef CAS.
- T. Gramstad, S. I. Snaprud, A. Salmenperä, A. Block-Bolten, J. M. Toguri and H. Flood, Acta Chem. Scand., 1962, 16, 999–1014 CrossRef CAS.
- T. Gramstad, L. J. Stangeland, F. Radner, M. Merchán, B. O. Roos, P. Pietikäinen, H. Setälä, M. Trætteberg, A. Nasiri and T. Tsuda, Acta Chem. Scand., 1993, 47, 605–609 CrossRef CAS.
- T. Gramstad and K. Tjessem, J. Mol. Struct., 1977, 41, 231–242 CrossRef CAS.
- T. Gramstad, K. Tjessem, C. Ullenius, M. M. Mishrikey, C. R. Enzell, J.-E. Berg and A.-M. Pilotti, Acta Chem. Scand., 1977, 31b, 345–353 CrossRef.
- T. Gramstad and O. Vikane, Spectrochim. Acta, Part A, 1972, 28, 2131–2139 CrossRef CAS.
- M. D. Driver, M. J. Williamson, J. Cook and C. A. Hunter, Chem. Sci., 2020, 11, 4456–4466 RSC.
- L. Cailletet and E. C. Mathias, C. R. Acad. Sci., 1886, 102, 1202 Search PubMed.
- L. Cailletet and E. C. Mathias, C. R. Acad. Sci., 1887, 104, 1563 Search PubMed.
- D. Musumeci, C. A. Hunter, R. Prohens, S. Scuderi and J. F. McCabe, Chem. Sci., 2011, 2, 883 RSC.
- M. C. Storer, K. J. Zator, D. P. Reynolds and C. A. Hunter, Chem. Sci., 2023, 15, 160–170 RSC.
- D. P. Reynolds, M. C. Storer and C. A. Hunter, Chem. Sci., 2021, 12, 13193–13208 RSC.
- J. Gmehling, U. Onken, W. Arlt, P. Grenzheuser, U. Weidlich, B. Kolbe and J. Rarey, DECHEMA Chemistry Data Series, Gesellschaft für Chemische Technik und Biotechnologie, 1991. Available at https://psds.ac.uk/detherm (accessed March 2024) Search PubMed.
- C. Antoine, C. R. Acad. Sci., 1888, 107, 681–684 Search PubMed 778–780, 836–837.
Footnotes |
| † Electronic supplementary information (ESI) available: Details on the convergence criteria and SSIP descriptions used for calculations, data on pure liquid concentrations, thermal expansion information, association constant data, VLE data for single component systems, details on the conversion of AIPs to SSIPs, information on the experimental VLE data, VLE X-Y plots. See DOI: https://doi.org/10.1039/d5cp00635j |
| ‡ These authors contributed equally. |
| This journal is © the Owner Societies 2025 |