
 Open Access Article
 This Open Access Article is licensed under a
 Creative Commons Attribution 3.0 Unported Licence
Online acoustic emission sensing of rechargeable batteries: technology, status, and prospects
Inti
Espinoza Ramos†
*a,
Amina
Coric†
b,
Boyang
Su
 c,
Qi
Zhao
c,
Lars
Eriksson
b,
Mattias
Krysander
b,
Annika
Ahlberg Tidblad
ad and
Leiting
Zhang
*a
c,
Qi
Zhao
c,
Lars
Eriksson
b,
Mattias
Krysander
b,
Annika
Ahlberg Tidblad
ad and
Leiting
Zhang
*a
aDepartment of Chemistry – Ångström Laboratory, Uppsala University, SE-751 21 Uppsala, Sweden. E-mail: inti.espinoza-ramos@kemi.uu.se; leiting.zhang@kemi.uu.se
bVehicular Systems, Department of Electrical Engineering, Linköping University, SE-581 83 Linköping, Sweden
cDepartment of Civil and Environmental Engineering, The Hong Kong Polytechnic University, Hong Kong SAR, China
dVolvo Car Corporation, SE-405 31, Gothenburg, Sweden
First published on 5th August 2024
Abstract
Online acoustic emission (AE) sensing is a nondestructive method that has the potential to be an indicator of battery health and performance. Rechargeable batteries exhibit complex mechano-electrochemical behaviors during operation, such as electrode expansion/contraction, phase transition, gas evolution, film formation, and crack propagation. These events emit transient elastic waves, which may be detected by a piezoelectric-based sensor attached to the battery cell casing. Research in this field is active and new findings are generated continuously, highlighting its potential and importance of further research and development. This Review provides a comprehensive analysis of AE sensing in rechargeable batteries, aiming to describe the underlying mechanisms and potential applications in battery monitoring and diagnostics.
 Inti Espinoza Ramos | Inti Espinoza Ramos is a first-year PhD student at the Department of Chemistry – Ångström Laboratory, Uppsala University, under the supervision of Dr Leiting Zhang. His research focuses on battery health monitoring using online acoustic emission sensing. Prior to starting his PhD, Inti earned a Master's degree in Chemical Engineering with specialization in Material Sciences from Uppsala University. |
 Leiting Zhang | Dr Leiting Zhang is an assistant professor at the Department of Chemistry – Ångström Laboratory, Uppsala University (Sweden). He received his PhD degree in 2018 from The Hong Kong University of Science and Technology (China), under joint supervision with the Collège de France (France). Before joining Uppsala University, he was a postdoc researcher at Paul Scherrer Institute (Switzerland). His current research interests include mechanistic understanding of aqueous batteries, development and application of advanced operando characterization techniques, and high-throughput robotic screening of battery electrolytes and electrodes. |
1 Introduction
Rechargeable batteries are accelerating the energy transition of our society. The demand for effective monitoring of battery health is critical to designing high-performance, enduring, and safe energy storage devices for electric vehicles (EVs) and grid energy storage. Operando characterizations offer valuable insights into the battery's health during operation. However, they often rely on invasive methods, necessitating access to internal battery structures or bulky characterization equipment, hence limiting their commercial applicability.Acoustic emission (AE) sensing1 has emerged as a promising nondestructive and cost-effective technique, allowing for online monitoring of the battery health. Here, online sensing refers to continuously or periodically monitoring and collecting data from the system in real-time. AE signals may originate from phase transition, particle cracking, electrode fracture, gas bubble bursting, and film formation. By applying the AE technique, it is possible to identify AE events in real time without interrupting the normal function of the battery cell. Several studies have explored the use of AE sensing with electrochemical performance metrics to estimate and predict the state of charge (SOC), state of health (SOH), etc., of commercial cells.2,3 These cells, used in real applications, often have a complex cell format. Transient elastic waves generated within these cells must travel through various materials and mediums to reach the sensor. This variation in materials complicates wave propagation, making it more challenging to accurately assess AE response. Hazards such as thermal runaway, short circuits, and capacity fade highlight the need for a battery diagnostic technique. AE can correlate its signals with degradation phenomena, enabling timely interventions. Once integrated into a battery management system, it can provide early warnings and improve overall battery safety and performance. This includes operating and measuring AE parameters alongside other measurements during abnormal events, such as heat,4 mechanical loading,5–7 and electrical abuse.8 Aging indicators, such as absolute energy and cumulative hits, can be used as intermediate variables to estimate and predict the SOH of a battery.9
The aim of this Review is to present a state-of-the-art summary of the AE technique for battery health monitoring. It begins by introducing the principles and experimental practices of the technique. Then, it dives into various battery chemistries for which the AE technique has proven effective in identifying critical mechano-electrochemical degradation processes, including Na–S, Ni–MH, Li-ion, Na-ion, and Li–S batteries. Finally, the paper highlights several remaining challenges for the development of the AE technique for battery health monitoring and offers a roadmap for future research and possible directions to better cope with more complex real-world scenarios, such as commercial battery cells for EVs.
2 Introduction to acoustic emission
AE sensing is a nondestructive technique used to detect transient elastic waves produced by the rapid release of energy from localized sources within a material. It has been widely implemented for health monitoring of engineering structures and materials such as bridges, concrete, rocks, and pressure vessels.10–13 AE sensing has also shown tremendous potential for studying chemical and electrochemical systems,14 including crystal growth,15 solid deposition and dissolution,16 corrosion17 and gas bubble bursting.18 Recently, the technique has been applied to study rechargeable batteries, aiming to diagnose battery health and understand battery degradation mechanisms. The process for detecting and analyzing AEs from batteries involves several steps, illustrated in Fig. 1.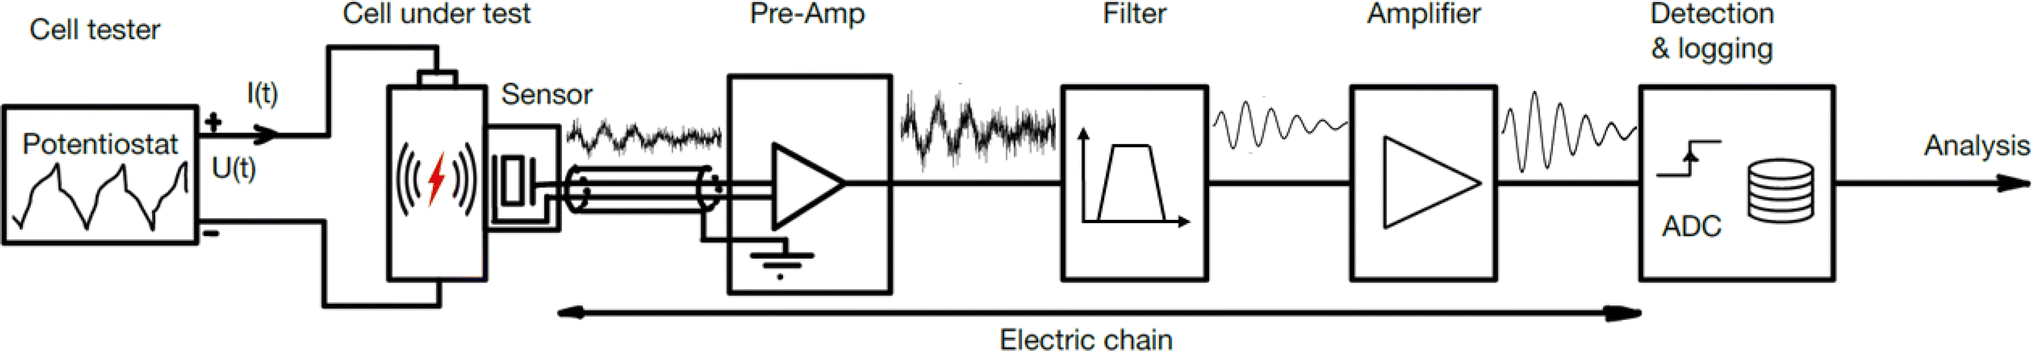 | ||
| Fig. 1 The sensor chain for detecting and analyzing acoustic emissions from battery cells in research and development. | ||
(1) The cell tester, often a potentiostat, runs the test program charging and discharging the battery cell. (2) Inside the cell, some mechanical event causes the device to emit an elastic wave. (3) The AE sensor detects the wave and converts the mechanical energy into an electrical signal. (4) The signal is enhanced by a pre-amplifier. (5) The signal might be filtered with a band- or low-pass filter to reduce noise. (6) Optionally, a second amplifier may further amplify the signal to a suitable level for the data logging system. (7) A detection system monitors and records the signal. Alternatively, if a trigger condition is met, the logger stores the event. The entire setup can be placed inside an acoustic chamber19–21 to isolate it from background noise. Alternatively, the cell can be placed on a vibration-isolated pad to reduce disturbances from vibrations.
The following subsections will cover the chain of components used in research on AE sensing in batteries. First, the signal sources, comprised of the cell tester, the cell, the sensor, and their mechanical connection, are discussed. Then, the attention turns to the instrumentation with sensors, amplifiers, and filters. Finally, the signal processing for detection and analysis is discussed.
2.1 Electrochemical testing
As aforementioned, several processes can cause a rechargeable battery to emit AE signals while it is in use. To mimic the operation of a battery while maintaining controlled conditions a cell tester, performing electrochemical cycling of battery cells, is often used. Cells are commonly cycled using either constant current (CC) or constant current constant voltage (CCCV) protocols. The C-rates are typically below C/2, with C/10 being most common for Li-ion batteries, where C/n refers to fully charge or discharge the cell in n hours. Depending on the research focus, cells are mostly cycled for fewer than 10 cycles. However, some studies cycle cells 100 times4,22,23 or more,2,3,24 also applying higher C-rates up to 2C. Alternatively, cyclic voltammetry has also been used to study the performance and AEs of battery cells.25,262.2 Acoustic emission sensor
A typical AE sensor is comprised of a piezoelectric material, connector, wear plate, and housing. The most common piezoceramic used in a sensor is lead zirconate titanate (PZT) for its high sensitivity and low cost.27 The sensors are mostly either resonant or wideband. The former ones have a high sensitivity around a narrow frequency range, while the latter ones possess a flatter response over broader frequency ranges.27 These sensors convert the time-varying mechanical perturbation forces F(t) that come from the elastic waves to an electric charge Q(t) = KF(t), where K is the sensor sensitivity.Choe,28 Lee,29 Kircheva,25,26,30 and Villevieille31 used a piezoelectric resonant sensor by Physical Acoustic Co. The majority of the sensors had a resonant frequency of 150 kHz and operated within a frequency range of 50–200 kHz. Schweidler19,20,32 used a differential wideband sensor also from Physical Acoustics Co, which has a wider operating frequency range of 125–1000 kHz.
2.3 Sensor placement and coupling
For coin cells, the sensor is attached to the casing on the side adjacent to the electrode of interest, from here on referred to as the working electrode. If two sensors are used, one is located at each side of the cell surface.25,26 For Swagelok-type cells, the sensor is pressed against the plunger in contact with the working electrode. For cylindrical cells, an aluminum fixture is required to hold the cell with better transmission of the acoustic wave to the sensor.2,22 Silicone grease is often used as a couplant to improve signal transmission and enhance contact between the cell and the sensor.2,21–23,33–37 Contact can also be improved by applying pressure with springs,22,34,38 rubber bands,39 or an acrylic jig.28,29,36,402.4 Electric chain
As illustrated in Fig. 1, an electric chain converts the electric charge Q(t) emitted by the sensor into a voltage that can be detected and logged in the data acquisition system. The elements in the chain treat the signal and secure its transmission from the acoustic sensor to the data logger. The elements of this chain are described below.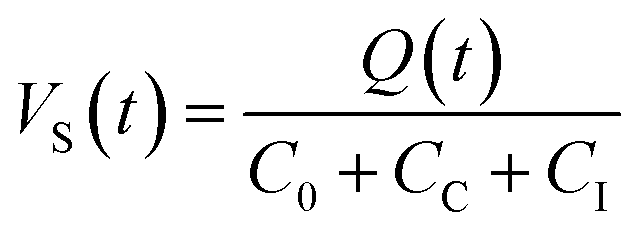 | (1) |
The resistance in the cables will dampen the transmission. Therefore, it is desirable to also keep the resistance as low as possible. Moreover, excessive cable capacitance will together with the resistance cause an attenuation of the high frequencies relative to the low. There are sensors with built-in preamplifiers (and filters) in the housing to circumvent this issue. In this way, electromagnetic interference (EMI) and radio frequency interference (RFI) can be minimized.
| VF = VS(t)GPGM | (2) |
2.5 Detection and logging
To detect and record a valid AE event, also known as a hit, the signal is monitored and recording is performed when the signal has exceeded a detection threshold. An alternative approach is to continuously monitor AE signals and filter out hits during post-processing. The threshold is typically measured in decibels (dBs). The relation between the amplitude A in dB and voltage is expressed by the following equation:43 | (3) |
For data detection and logging, the most common acquisition systems are provided by Physical Acoustic Co.4,19,20,23,28–32,35,41,42 The signals are processed using corresponding software provided by the same manufacturer. Other groups have used equipment from Alazartech,38 Vallen Systeme,2 or simply an oscilloscope22,34 for data acquisition.
2.6 Signal processing
After the AE data are recorded, it is digitally filtered and then analyzed in both time and frequency domains. A typical filtered waveform is shown in Fig. 2, characterized by the following parameters: | ||
| Fig. 2 Features of typical AE waveform. | ||
• Duration (μs): the time the AE signal exceeds the threshold, from the first threshold crossing until the last.
• Counts: the number of times the threshold is exceeded during the duration of the hit.
• Amplitude (dB or V): The peak value of the AE hit.
• Rise time (μs): the time it takes for the hit to reach peak amplitude.
• Energy: the integral of the squared voltage over the duration of the signal.
• Peak frequency (Hz): the point at which maximum magnitude is observed in the frequency spectrum.
It is worth noting that the energy of AE signals can also be defined as the integral of the squared rectified waveform envelope, or the total area under the curve of the rectified signal envelope. This definition is also applicable when referring to signal strength. Cumulative counts,28,36,38 cumulative hits4,19–21,23,25,32,40,41 (or hit rate), and cumulative AE energy (CAEE).31 are common ways to analyze the results, since AE events are released discontinuously. When comparing results from different cells, it is advisable to compare the relative hits or normalized hits instead of the absolute numbers due to variations in the setup, especially in the sensor-cell connection41 or the amount of active electrode material (mass or area).
To analyze the signal in the frequency domain, discrete Fourier transform (DFT) can be performed on the sampled data. The transformed signal describes the frequencies of the original signals and the extent to which they are present. Fast Fourier transform (FFT), an efficient algorithm for computing the DFT and its inverse, is used in the majority of the studies. The transformed signal can be analyzed in the frequency spectrum or power spectrum, representing the amplitude and power of the frequencies, respectively. From the frequency spectra, the frequency peaks can be obtained and power is obtained by squaring the FFT amplitudes. The dominant frequency19,20,26,28,29,32,35,37,41 is a critical parameter, often used to classify the signals into two or three distinct types for further analysis. Analyzing the frequency spectrum can also help remove noise.
The FFT-transformed signals do not contain information in the time domain. To study the frequency variations with respect to time, a short-time Fourier transform (STFT) can be performed. This involves applying the DFT to small segments of the signal in the time domain and visualize it in a time-frequency plot, often referred to as a spectrogram.
Another way to study the time-frequency representation of a signal is to apply wavelet transform (WT) technique. By decomposing the signal into wavelets, this transform captures both high- and low-frequency components with a high resolution. The obtained time-frequency plot is called a scalogram, or a wavelet contour map, and an example is shown in Fig. 5. Both the scalogram and spectrogram have different colors to indicate the intensity of the frequency components over time.
2.7 Clustering
Different phenomena emit AE signals with distinct characteristics. The aim is to distinguish between these AE signals and, consequently, the underlying phenomena. Once the mentioned parameters have been extracted, they can be used to group the signals, either manually through visual inspection or using learning methods.Manual clustering involves analyzing and grouping data based on the previously mentioned parameters. A scatter plot, also known as a cross-plot, is created by plotting two parameters against each other. The visualization helps to identify correlations or trends more clearly. For example, in some studies, cross-plots of duration vs. amplitude,28 energy vs. rise time,45 seen in Fig. 4, or amplitude vs. energy29 have shown distinct clusters, aiding in differentiating various types of AE signals. This way, the signals with similar characteristics can be grouped. Performing FFT on the grouped signals allows for analyzing the corresponding frequencies and identifying further trends.
As mentioned before, the peak frequency is a common parameter on which signals with similar peak frequencies are grouped. Signal classification can be made for the entire cycle, during charge/discharge, or for different stages within the charge/discharge process.
The method above is common employed for AE signals, but it is challenging to consider more than a few parameters at a time. Manual clustering can also be difficult if the AE signals are similar. Since the obtained data are described by a large number of features or parameters, learning methods can be used instead. Learning methods use techniques within machine learning to identify patterns and structures in complex datasets. The methods are either supervised, or unsupervised. The supervised method requires data in which the labels are known for the learning model. The unsupervised learning on the other hand, uses unlabeled data, so no labels are known beforehand. Within unsupervised learning, clustering methods such as k-means, and Density-Based Spatial Clustering of Applications with Noise (DBSCAN) are commonly used. For supervised learning, some common classification methods are support vector machine and decision tree.
Before training the model, a dimension reduction method such as the principal component analysis (PCA) can be applied to transform the data into principal components (PCs) that capture the most significant variance. PCA is performed by representing each AE hit as a vector with corresponding parameters and then finding a new set of PCs that simplifies the analysis. These PCs have no physical meaning but are just a linear combination of the original set.35
Once the data are clustered, either manually or through a learning method, the AE signals can be distinguished and attributed to specific phenomena as elaborated below.
3 Application of AE to battery monitoring
This section examines the use of AE sensing across different battery chemistries. Building on earlier discussions of AE principles and experimental practices, it now focuses on specific applications in the field of rechargeable batteries. Understanding these AE phenomena provides deeper insights into the internal processes affecting battery health and performance. This section concludes with a summary of all battery chemistry studies in Table 1. The cell format “inhouse” refers to cells prepared in the lab for the purpose of the study.| Year/ref | Positive electrode | Negative electrode | AE origin | Complementary tool | Cell format | Electrolyte |
|---|---|---|---|---|---|---|
| Na–S batteries | ||||||
| (1978)46 | S | Na | Crack growth | — | Inhouse | β-Alumina |
![[thin space (1/6-em)]](https://www.rsc.org/images/entities/char_2009.gif) |
||||||
| Ni–MH batteries | ||||||
| (1998)47 | Ni | Pd | Gas generation | — | Inhouse | NaOH solution |
| (2011)45 | Ni | LaNi5 | Particle cracking, phase transition | SEM | Inhouse | KOH solution |
| (2012)48 | Ni | MgNi, LaNi5 | Particle cracking, phase transition | — | Inhouse | KOH solution |
| (2013)49 | Ni | LaNi5 | Particle cracking, phase transition | SEM | Inhouse | KOH solution |
| (2013)50 | Ni | MgNi-alloys | Particle cracking, phase transition | SEM | Inhouse | KOH solution |
| (2015)51 | Ni | LaNi5 | Particle cracking, phase transition | SEM | Inhouse | KOH solution |
| (2007)52 | Ni | NiMnAlCo, TiCrVNi | Particle cracking | SEM | Inhouse | KOH solution |
| (2006)53 | (Ni(OH)2/, NiOOH) | NiMnAlCo | Particle cracking | SEM | Inhouse | KOH solution |
| (2008)54 | Pt | LaNi5, MgNi | Particle cracking | — | Inhouse | KOH solution |
|
||||||
| Li-ion batteries | ||||||
| (2011)38 | HOPG | Li-metal | Gas evolution, phase transition, particle cracking | — | Inhouse | 1 M LiPF6 in EC:DEC |
| (2011)25 | Graphite | Li-metal | Gas evolution, phase transition, particle cracking | EIS | Coin | 1 M LiPF6 in EC:PC:DMC + VC |
| (2001)55 | Graphite | Li-metal | Gas evolution, phase transition, particle cracking | XRD, operando dilatometry | — | 1 M LiClO4 in PC alt. PC:DME |
| (2015)28 | LCO | Graphite | Gas generation (SEI), cracking | SEM | Coin | (did not specify) |
| (2021)2 | LCO | Graphite | Cracking | — | 18650 |
Commercial |
| (2010)21 | Si | Li-metal | Si particle cracking | SEM | Coin | 1.2 M LiPF6 in EC:EMC |
| (2011)33 | Si | Li-metal | Si particle cracking | SEM, XRD | Coin | 1.2 M LiPF6 in EC:EMC |
| (2011)56 | Si | Li-metal | Si particle cracking | SEM, stress analysis, mechanical modeling | (Did not specify) | LiPF6 in EC/EMC |
| (2015)35 | Si | Li-metal | Si particle cracking | SEM | Swagelok | 1 M LiPF6 in EC:DMC |
| (2016)42 | Si | Li-metal | Si particle cracking | SEM, operando dilatometry | Swagelok | 1 M LiPF6 in EC:DMC |
| (2018)23 | Si–C | Li-metal | Si particle cracking | DEMS | Coin | LP57 |
| (1984)57 | Al | LiAl | Phase transition, cracking, fragmentation | Mechanical modeling | Inhouse | LiCl + KCl (molten) |
| (2013)26 | LiMnO2 | LiAl | Phase transition, cracking, fragmentation | SEM, XRD | Coin | (did not specify) |
| (2023)29 | LMO | Al–Lix | Phase transition, cracking, fragmentation | SEM, XRD | Coin | 1 M LiClO4 in PC/DME |
| (2010)31 | NiSb2 | Li-metal | Structural and morphological change | SEM | Swagelok | LiPF6 in EC/DMC |
| (2021)32 | HEO | Li-metal | Cracking, bulk/surface restructuring, film formation (SEI) | SEM | Coin | LP57 |
| (2022)20 | LiHEOF | Li-metal | Cracking, bulk/surface restructuring, film formation (SEI) | SEM | Coin | LP57 |
| (2012)39 | LCO | Li-metal | Grain boundary microfracture | Mechanical modeling | Coin | 1.2 M LiPF6 in alkyl carbonates |
| (2019)5 | NCM | Si | Delamination, interlayer slip, cracking | Mechanical bending | 18650 |
Commercial |
| (2019)4 | LCO, NMC | Graphite | Microcracking | SEM, EIS | Coin | 1 M LiPF6 in EC:DEC:DMC |
| (2021)58 | NCM | Graphite | — | Machine learning | 18650 |
Commercial |
| (2022)8 | NCM | Graphite | — | Temperature measurement | 18650 |
Commercial |
| (2023)3 | LCO | Graphite | Cracking | — | 18650 |
Commercial |
| (2023)59 | LFP | Graphite | Cracking | — | Pouch | Commercial |
| (2024)7 | NCM | Graphite | Shear fracture, local buckling, tensile break | Compression loading | 18650 |
Commercial |
| (2020)19 | LNO | Li-metal | Particle fracture, film formation (SEI) | SEM, EIS | Coin | LP57 |
| (1997)40 | MnO2 | Li-metal | Particle fracture | — | Coin | 1 M LiClO4 in PC:DME |
| (2014)60 | LMO, LMNO | Li-metal | Phase transition, particle fracture | SEM, XRD | Coin | LP40 |
| (2024)61 | — | — | Electrode expansion, cracking | Machine learning, CT | 21700 |
Commercial |
|
||||||
| Na-ion batteries | ||||||
| (2023)41 | NTMO | Na-metal | Intragranular cracks | SEM, operando XRD | Coin | 1 M NaClO4 in EC:DMC:PC |
|
||||||
| Li–S batteries | ||||||
| (2019)37 | S | Li-metal | Dissolution of sulfur | SEM | Coin | 1 M LiTFSI in TEGDME and DIOX |
3.1 Na–S batteries
The study of high-temperature sodium-sulfur batteries as energy storage solutions dates back to the 1960s. One of the earliest AE studies on batteries was conducted by Worrell and Redfern in 1978, in which the breakdown of the β-alumina ceramic electrolyte was monitored by the AE technique.46 The experimental apparatus is given in Fig. 3. Mechanical deterioration within the β-alumina membrane during sodium ion transport generates stress waves, which are guided through an α-alumina rod to the AE transducer, giving further indication of ceramic cracking. While the accuracy of the AE measurement was limited by the data acquisition capability of the hardware, qualitative assessments still confirmed that the mechanical degradation correlated with the current density applied, and subcritical crack growth was the main failure mechanism of the β-alumina solid-electrolyte, which eventually led to sodium dendrite penetration and battery cell failure. It was also concluded that the AE technique was able to predict impending material failure at an early stage, which opened the door to operando monitoring of battery chemistries and materials.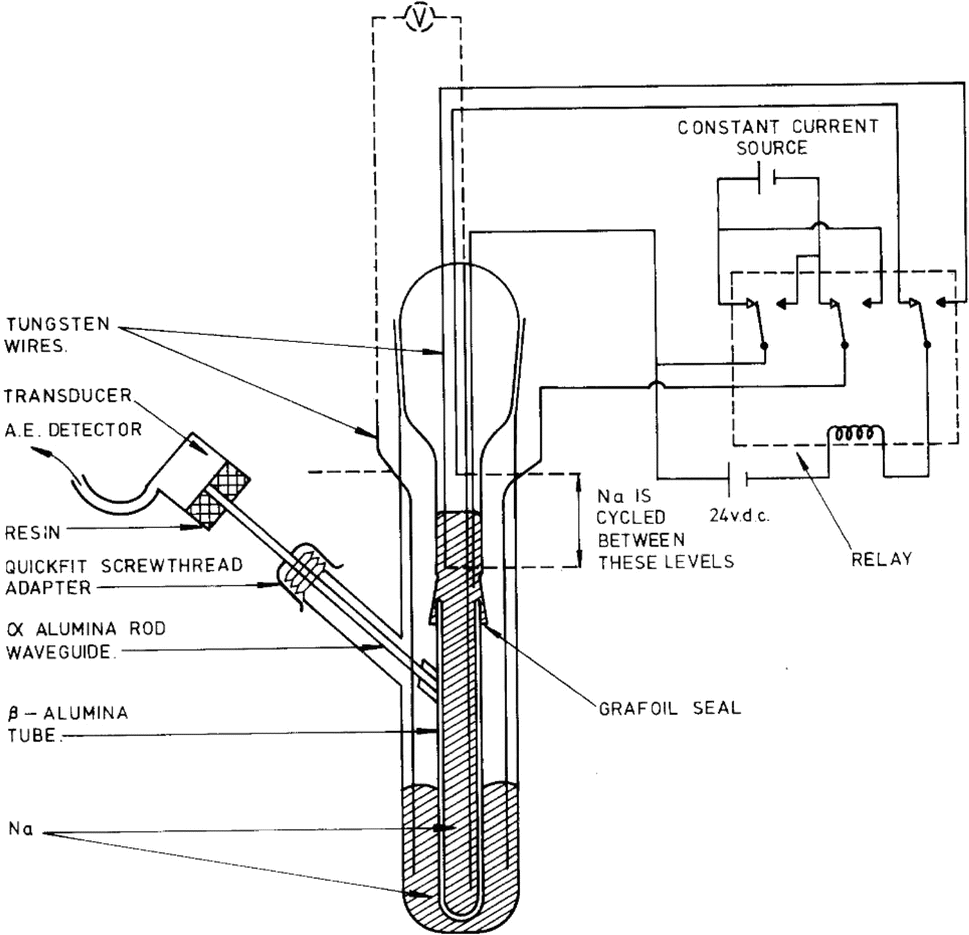 | ||
| Fig. 3 Apparatus for AE sensing in high-temperature Na–S batteries. Reproduced with permission from ref. 46. Copyright 1978, Springer Science. | ||
3.2 Ni–MH batteries
Prior to the commercialization of lithium-ion batteries in 1991, alkaline nickel–metal hydride (Ni–MH) batteries had been extensively studied. One of the main technical hurdles deals with the irreversible pulverization of the negative electrode, i.e., hydrogen storage alloys. Upon repeated hydrogen absorption–desorption, the electrochemical activity of the negative electrode will quickly diminish, while the parasitic hydrogen evolution reaction (HER) will take over, leading to performance degradation. Apart from (electro)chemical processes, mechanical cracking/disintegration, and gas evolution are acoustically emissive, which can be captured by the AE technique. A series of studies have focused on the understanding of decrepitation mechanisms of negative electrode materials, such as Pd, LaNi5, MgNi, TiCr0.3V1.8Ni0.3, and their derivatives.45,47–54,62 Two kinds of distinct AE waveforms have been consistently observed as depicted in Fig. 4a and b. Type P1 is characterized by short rise time (<30 μs) and duration (<100 μs), relatively high peak frequency (250–350 kHz), and is assigned to particle cracking. Type P2 possesses a long rise time (up to 200 μs) and duration (up to 250 μs) with a relatively low peak frequency (80–150 kHz), and is assigned to the hydrogen evolution reaction. By cross-referencing the AE features with the respective potential profiles, Etiemble et al. assigned the P1-type signals observed in a LaNi5 alloy to early particle cracking induced by the α-to-β phase transition.45 The same signals obtained in a MgNi alloy were, however, triggered by gassing-induced agglomerates breakdown, as confirmed by concomitant hydrogen evolution signals (P2) towards the end of the charge, as shown in Fig. 4c and d. This study highlights the unique advantage of conducting AE measurements to unveil complex decrepitation mechanisms in Ni–MH batteries. | ||
| Fig. 4 (a) Typical waveforms and (b) waveform distributions of P1- and P2-type events. Electrode potential and acoustic activity as functions of time for (c) LaNi5-based and (d) MgNi electrodes. Reproduced with permission from ref. 45. Copyright 2011, Elsevier. | ||
3.3 Li-ion batteries
The following subsections will delve into the application of AE sensing in more complex and widely used Li-ion batteries, building on the insights gained from Na–S and Ni–MH studies. This section will highlight the monitoring of critical mechano-electrochemical events, such as gas evolution, particle cracking and solid-electrolyte interphase (SEI) formation.Gas evolution resulting from solvent reduction has been identified as one of the main sources of AE signals. The burst of gas bubbles in the liquid electrolyte will release elastic waves that can be captured by an AE sensor. Matsuo et al. collected AE signals from a water electrolysis cell, using graphite as the working electrode.38 The majority of the recorded AE waveforms (95%) showed a characteristic frequency below ca. 130 kHz, which was then ascribed by the authors to gas evolution. The signal continuously spanned upon cycling but was most intensive during the first charge. Ohzuku et al. also concluded that the acoustic events in the SEI formation region were predominantly due to gas bubbles in LiClO4-based electrolyte, but did not provide further information about features of the captured AE signals.55 Later, Choe et al. classified AE signals with long duration (up to 60 ms) and low amplitude (below 38 dB) as gas evolution from the graphite anode, the frequency of which was between 81 and 120 kHz.28 Such a frequency was also close to the value reported for H2 bubbles generated by metal corrosion (100 kHz).63 In addition, Kircheva et al. observed that both the cumulated AE hits and the absolute energy increased sharply during the SEI formation region (0.9–0.4 V vs. Li+/Li0) in the first charge, which could be associated with gas formation.25 To establish a correlation between interfacial processes and electrochemical properties, cyclic voltammetry (CV) and electrochemical impedance spectroscopy (EIS) analyses were conducted. The CV tests in Fig. 5d clearly demonstrated a synchronized jump of AE hits and energy at the onsite of the SEI formation. From the EIS measurements, it was found that highly resistive passivation films would result in high levels of AE energy, suggesting that AE sensing could be a handy tool to assess the quality of the formation cycle (Fig. 5e). However, since no peak frequency information was given, it is hard to assign the AE signal to a specific process (film deposition or gas evolution).
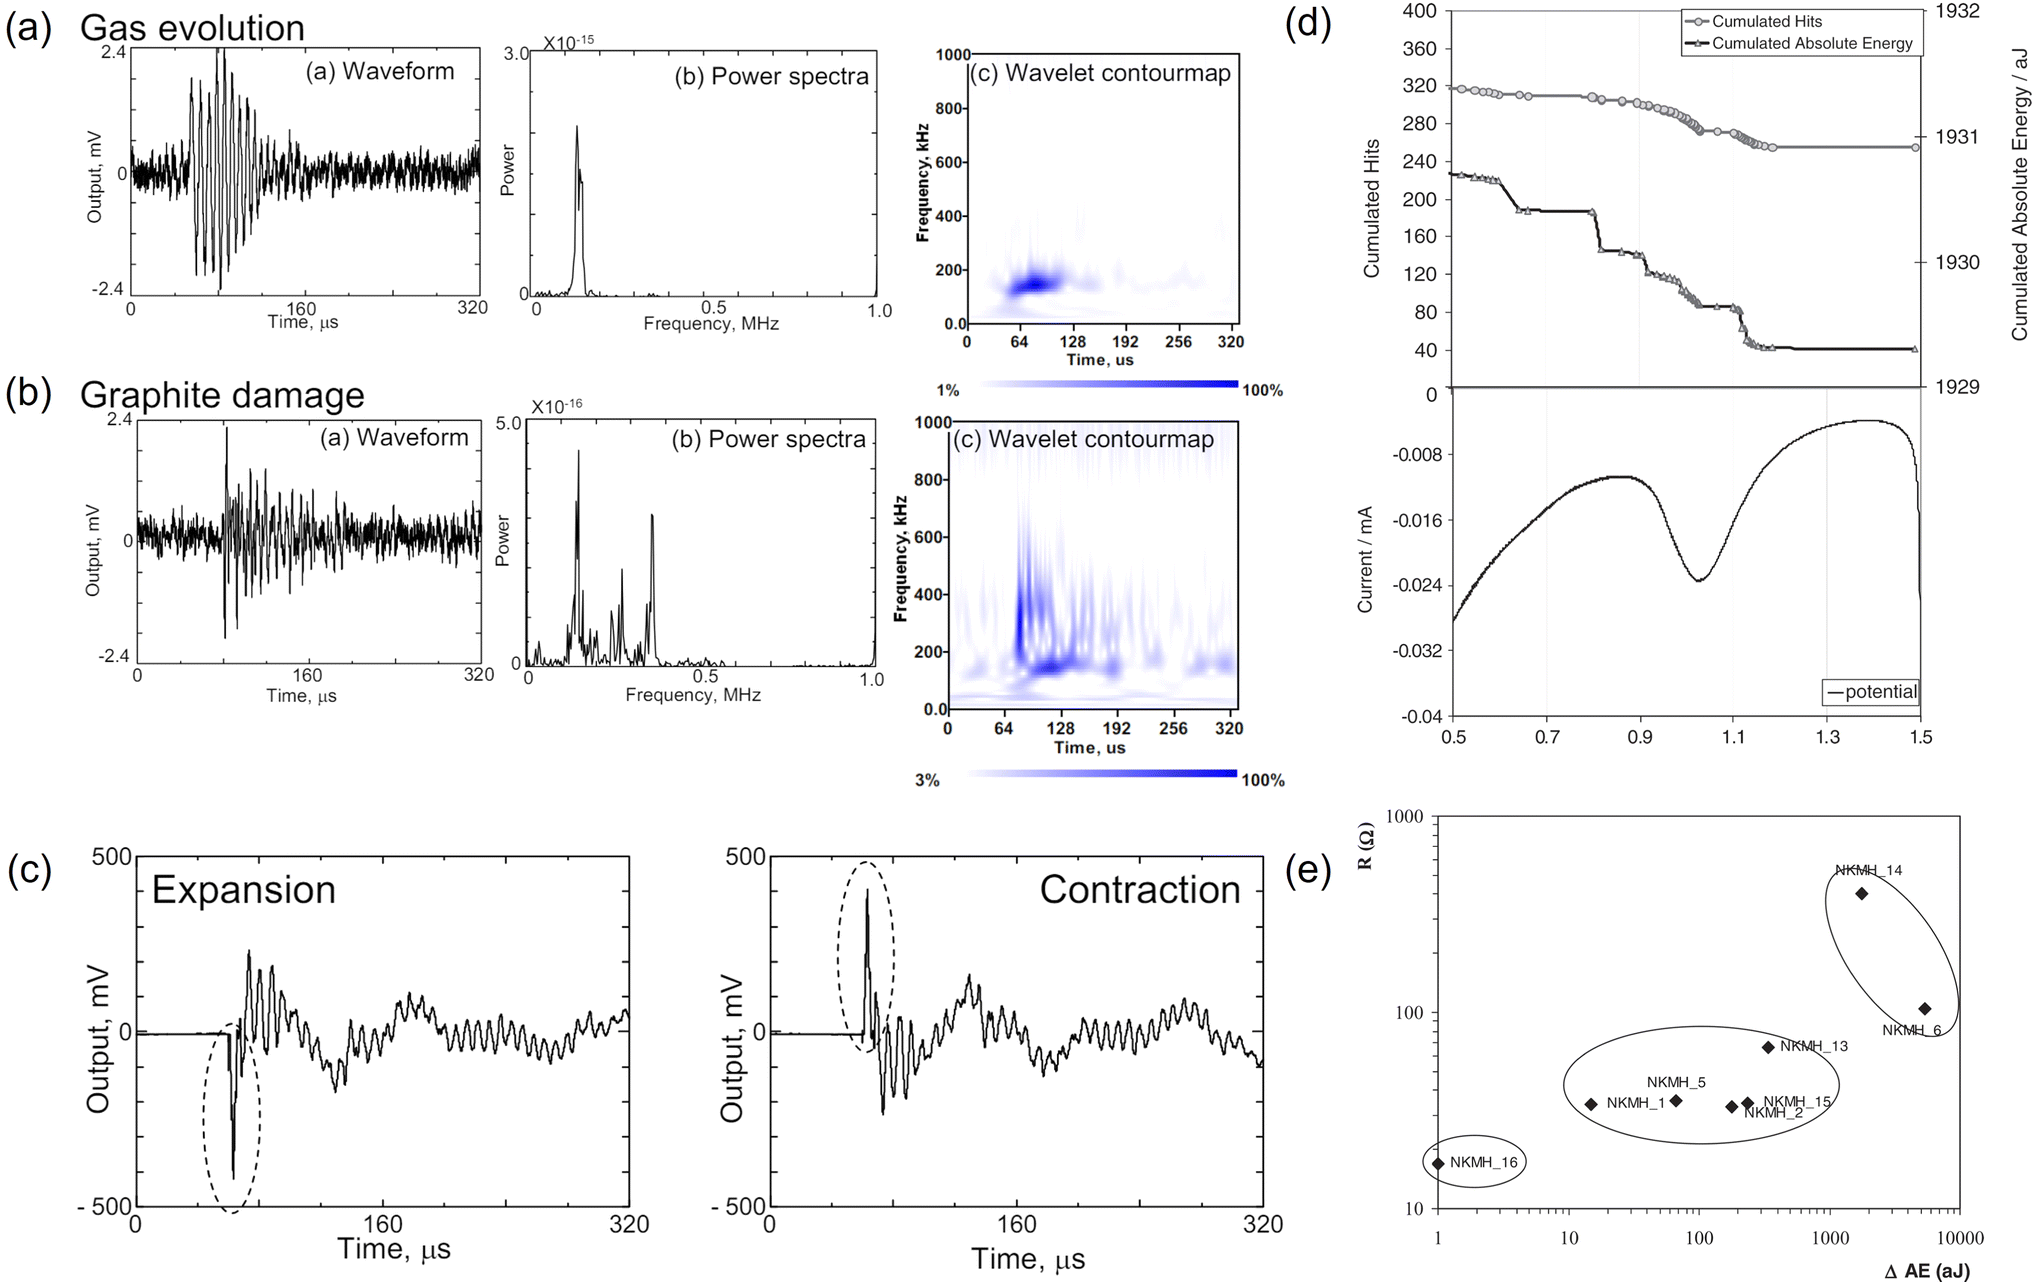 | ||
| Fig. 5 Characteristic waveform, power spectra, wavelet contour map of (a) gas evolution and (b) graphite damage. (c) Representative waveforms produced by graphite distortion. Reproduced with permission from ref. 38. Copyright 2011, The Japan Society of Mechanical Engineers. (d) Comparison of AE signals and cyclic voltammogram of a graphite/lithium cell. (e) Correlation between AE energy variation and the resistance of the passivation film. Reproduced with permission from ref. 25. Copyright 2012, The Electrochemical Society. | ||
Particle cracking and fracturing also contribute to active AE signals. Matsuo et al. mimicked the damage of graphite by inducing mechanical fracture of graphite using the Vickers indentation method.38 The resulting AE signals had a wide-band frequency component (up to 500 kHz) and a short rise time, as shown in Fig. 5a, which were sufficiently different from that generated by gas evolution. Such a feature was also captured during the electrochemical cycling of a graphite/Li half-cell and was attributed to graphite damage (e.g., fracture, exfoliation).
It is worth noting that graphite expansion/contraction during cycling could also emit AE signals but to a lesser extent. By closely analyzing the corresponding AE waveforms, Matsuo et al. found that a positive peak signal reflected the contraction of graphite and a negative peak signal corresponded to the expansion of graphite as depicted in Fig. 5c.38 Kircheva et al. reported that the most diluted lithium stage (above 0.13 V vs. Li+/Li0) was not AE active, while stage 2L–stage 2 and stage 2–stage 1 presented significant AE activity.25 It was hypothesized that modifications in the crystalline structure of graphite could release AE signals, and so was the local defect breakdown in the highly lithiated graphite (more energetic). The authors also observed that the discharge process (delithiation) generated fewer AE signals than the charging process (lithiation), suggesting the latter was acoustically more energetic.
The operando AE testing of Si anodes has been mainly conducted by the groups of Daniel,21,33,56 Roué,35,42 and Brezesinski.23 Most AE signals have been observed in the first cycle, consistent with the well-known first-cycle irreversibility of the material. However, there is a significant variation in the individual AE activities among the reported studies, which is likely due to the different properties of silicon particles used in the respective work.
The group of C. Daniel pioneered the use of AE testing to study the mechanical and electrochemical degradation of Si electrodes in the early 2010s. They mainly used −100 + 325 mesh crystalline Si particles (99.999%, Alfa Aesar) as the active material, with an average diameter of ca. 100 μm. The average frequency was around 385 kHz. Complementary scanning electron microscopy (SEM) images revealed that large cracks already formed after the first charge. as shown in Fig. 6a.21 Continuum mechanics modeling was incorporated to depict the brittle fracture of the Si anode, and the results were compared with experimental AE data.56 A “stress-safe” threshold diameter of ca. 10 μm was calculated, based on the model. Experimentally, Si particles with less than 44 μm in diameter already registered an insignificant amount of AE signals. It is also worth mentioning that a modified coin-cell setup was developed by the group, which could run operando X-ray diffraction and AE simultaneously.33 As shown in Fig. 6b, the AE sensor was attached to the “anode” side (Li) of the coin cell, which was able to collect AE data transmitted from the Si electrode. The primary frequency component of the AE signals was around 280 and 340 kHz. However, the cell seemed to suffer from low stack pressure, which resulted in compromised cycling performance of the Si anode and the corresponding AE activity.
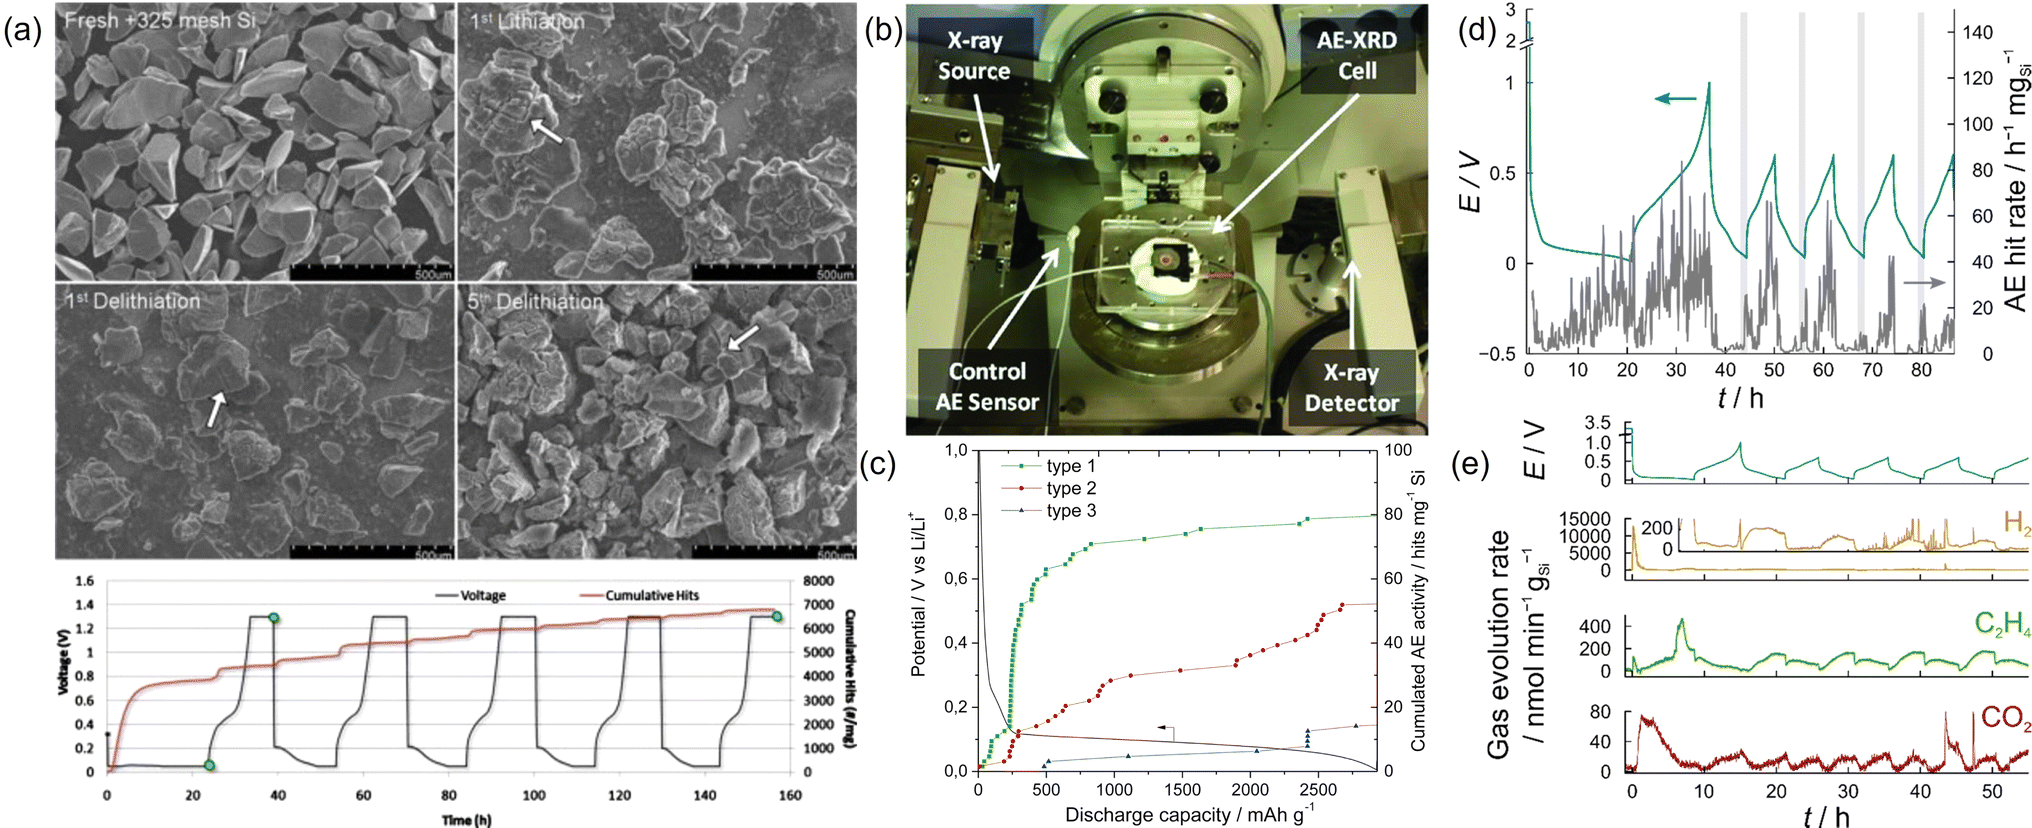 | ||
| Fig. 6 (a) SEM images and voltage-cumulative hits-time diagram of Si electrodes. Reproduced with permission from ref. 21. Copyright 2010, The Electrochemical Society. (b) Setup for operando XRD-AE experiments. Reproduced with permission from ref. 33. Copyright 2011, AIP Publishing. (c) Evolution of electrode potential and cumulated AE activity as a function of discharge capacity. Reproduced with permission from ref. 35. Copyright 2015, Elsevier. (d) Voltage-AE hit rate diagram of a Si/C composite electrode. (e) Gas evolution results of a Si/C composite electrode. Reproduced with permission from ref. 23. Copyright 2018, American Chemical Society. | ||
Following the previous study, the group of L. Roué conducted the AE study on micrometric Si materials (99.9%, Alfa Aesar, 1–5 μm).35 The recorded quantity of the AE signals was only ∼1/20 of the previous studies, which was attributed to the different cell formats (Swagelok vs. coin cells) and significantly reduced particle sizes (∼2 μm vs. ∼130 μm). For signal processing, the authors used PCA to reduce the dimensionality and extract key information from the obtained AE data. Unsupervised (statistical) clustering and manual partition were conducted to separate them into different clusters. Three populations were identified, with distinctive parameters, as depicted in Fig. 6c. Type 1 signals had high peak frequency (∼700 kHz) and were mainly collected during the SEI formation region and the initial stage of Si lithiation. The AE signals in this region were assumed to originate from microcracks formed at the surface of Si particles. Type 2 signals had medium peak frequency (∼400 kHz) and were detected throughout the lithiation process. The authors assigned them to the growth of large/longer cracks across the particles and/or in the composite film. Type 3 signals had low peak frequency (∼200 kHz) with the lowest cumulated activity. They mainly appeared when the electrode potential reached 60 mV, during which the crystalline Li15Si4 phase was formed. In a subsequent study, the group further investigated the impact of nano-sized Si particles (median size Dn50 of 230 nm and 85 nm) on AE activities.42 Unexpectedly, the authors found that the decrease in Si particle size resulted in a compromised mechanical stability and cyclability of the electrode. Much higher AE activities were recorded for the Si electrode with smaller particle size, which, based on the complementary electrochemical dilatometry measurements, should result from a more intense film cracking and exfoliation from the current collector. Increasing the binder mass ratio from 8% to 14.5% and/or increasing the molar weight of the CMC binder from 90 k to 700 k could indeed improve the capacity retention.
To take full advantage of the high capacity of silicon and the high cyclability of graphite, silicon–carbon composite anodes have been proposed for a balanced performance. The group of Brezesinski investigated the particle fracture/mechanical degradation of core–shell-type Si/C composite particles (average size 28 ± 9 nm) by AE measurements.23 Interestingly, consistently higher AE activities during discharge (delithiation) than during charge (lithiation) were recorded, while the opposite was observed in all previous studies, as shown in Fig. 6d. The authors argued that the composition, morphology, and microstructure of the active material should all affect the mechanical properties of the electrode, hence the AE behavior. Having access to the differential electrochemical mass spectrometry (DEMS) technique, the authors explored the possible impact of gas evolution on AE. The time-dependent evolution profiles of H2, C2H4, and CO2 are plotted in Fig. 6e, which can be attributed to the reduction of water, ethylene carbonate, and other electrolyte components (trace), respectively. However, potential-dependent AE activity was not observed in the measurement, suggesting that gassing does not directly impact the AE activity in this study.
The AE activities of LiAl anodes in commercial coin-type full-cells were later reported by Kircheva et al.26 and Lee et al.29 In both cases, most AE events were recorded close to the end of the discharge, owing to continuous swelling with Li-content increase. The cracking and pulverization of the Al–Lix alloy anode, resulting from lattice mismatch between the surface and bulk during the crystalline phase transitions from Al to β-LiAl was proposed as the main AE source from the anode. However, the contribution from the cracking and fragmentation of the cathode (LixMnO2 in these cases) could not be isolated.
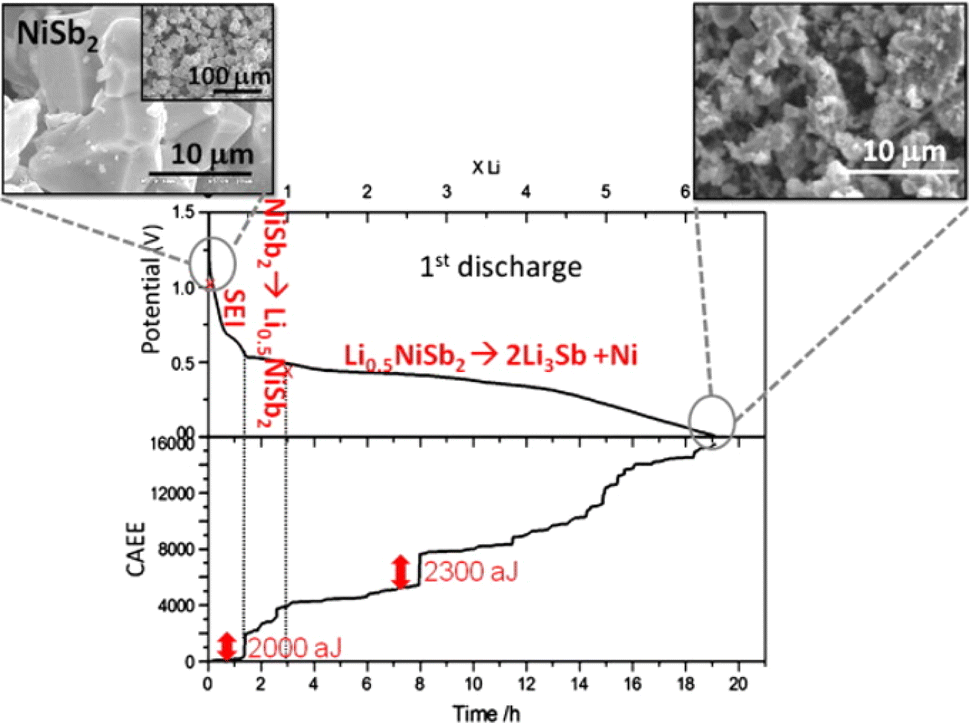 | ||
| Fig. 7 Voltage profile and cumulated AE energy of NiSb2/Li cell as functions of time. Reproduced with permission from ref. 31. Copyright 2010, Elsevier. | ||
Schweidler et al. investigated the acoustic behaviors of (Co0.2Cu0.2Mg0.2Ni0.2Zn0.2)O.32 In the first charge (lithiation), no AE signals were recorded until 0.3 V, below which the AE hit rate and cumulative amount increased sharply, as shown in Fig. 8. The conversion reaction and the SEI formation were attributed as the AE sources. Apart from the main AE signals in the first charge, the remaining acoustic activity was mainly detected during discharge (delithiation), which agreed with the mechano-electrochemical model proposed by Barai et al.64 Moreover, the authors clustered AE signals into three groups based on their peak frequencies: AE 1 (100–200 kHz, surface/bulk restructuring), AE 2 (200–300 kHz, growth of larger cracks and/or SEI formation), and AE 3 (300–600 kHz, particle cracking/fracture). Since no AE activity with peak frequency > 600 kHz was recorded, by referring to ex situ SEM images and other literature, the authors concluded that “high entropy” could be effective in stabilizing the active material.
 | ||
| Fig. 8 (a) Distribution of peak frequencies of an HEO electrode. (b) Voltage profile and corresponding cumulated hits for different peak frequency ranges. (c) Contour plot of peak frequency as a function of time. Reproduced with permission from ref. 32. Copyright 2021, Nature Portfolio. | ||
The same group also studied the acoustic behaviors of a cathode-equivalent HEO, namely Lix(Co0.2Cu0.2Mg0.2Ni0.2Zn0.2)OFx, or LiHEOF.20 The same trend was observed-main AE signals were recorded towards the end of the delithiation. In addition, the authors also observed a positive correlation between the AE activities collected between 4.6 V (charge)–3.7 V (subsequent discharge) and high-potential gas evolution (H2, O2, CO2, CO, and POF3) by DEMS, which was not the case for the anode-equivalent HEO.
The degradation of LCO was also studied in commercial coin-type LCO/carbon full-cells by Choe et al.28 The authors attributed AE signals with short duration and high amplitude in the range of 121–160 kHz to the microcracking of the cathode. Ex situ SEM images were taken to support the claim. The same group also evaluated the high-temperature storage of LCO-containing coin-type full-cells, and spotted a positive correlation between AE signals obtained at 85 °C storage (with a peak frequency of 150 kHz) and microcrack formation of the cathode material (revealed by ex situ SEM).4 It was postulated that HF released by the thermal decomposition of the electrolyte salt LiPF6 would attack the cathode material and lead to microcracking.
 | ||
| Fig. 9 (a) Voltage profile of the initial cycle of an LNO half-cell. (b) Low-voltage and (c) high-voltage regions Nyquist plots of the EIS data. Reproduced with permission from ref. 19. Copyright 2020, Wiley-VCH. | ||
 | ||
| Fig. 10 (a) Discharge profiles and (b) corresponding AE hit rates of MnO2. Reproduced with permission from ref. 40. Copyright 1997, The Electrochemical Society. Voltage profiles and cumulative AE hits of (c) LiMn2O4 and (d) LiMn1.5Ni0.5O4. Reproduced with permission from ref. 60. Copyright 2014, The Electrochemical Society. | ||
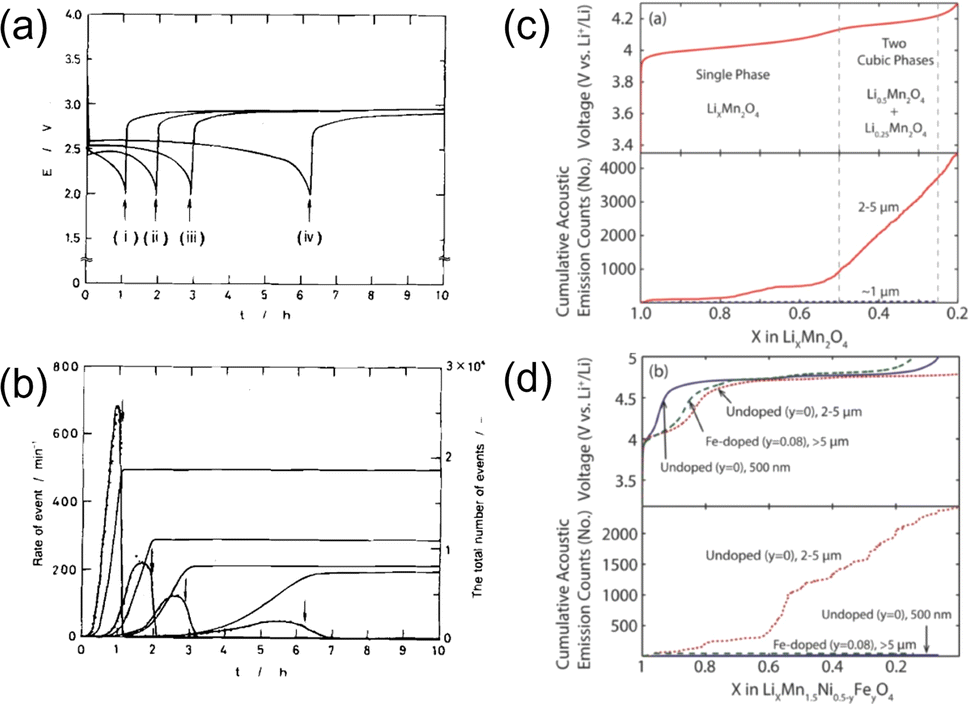
Woodford et al. reported the AE activity of spinel phases.60 They demonstrated that lattice parameter misfit resulting from first-order cubic-to-cubic phase transitions, such as in LMO and LMNO, would generate coherency stresses and lead to cycling-induced fracture. Two design strategies were proposed to circumvent this issue. One was to prepare materials with crystallite sizes below a critical value (∼1.1 μm for LMO), and the other was to employ lattice doping to suppress the misfitting first-order transition, as shown in Fig. 10c and d. Both strategies were experimentally proven effective, yet doping was more favored, as nanosizing materials would inevitably increase the surface area and promote other side reactions (manganese dissolution, electrolyte decomposition, etc.).
3.4 Na-ion batteries
Sodium-ion batteries are promising complements to their Li-ion counterpart, with a higher emphasis on sustainability, cost-effectiveness, and wide resource distribution. Dreyer et al. studied the acoustic behaviors of several Na-containing layered oxides with different configurational entropy.41 It was experimentally demonstrated that introducing more elements to the transition metal layer could alter the phase transition behavior from biphasic to solid-solution, with a distinct change of AE activities collected from the Na half-cells as depicted in Fig. 11. Principal component analysis of AE signals was coupled with operando X-ray diffraction (XRD) and post-mortem SEM techniques. Three groups of AE events (denoted as AE1, AE2, and AE3) were identified based on their peak frequencies (Fig. 11a–d). AE1 was assigned to the decomposition of surface impurities. To distinguish AE2 and AE3 signals, Rietveld refinement was conducted to extract unit cell volumes and lattice parameters of the high-entropy oxides (Fig. 11e). It was found that increasing the configurational entropy of the oxides would result in an increase in the share and total number of AE3 hits and decrease of the AE2 hits. With corresponding ex situ SEM images, the authors correlated the intermediate AE peak frequency (AE2, 200–300 kHz) to the formation of intragranular cracks and high-frequency signals (AE3, >300 kHz) to intergranular cracking and propagation. | ||
| Fig. 11 (a) Normalized hit count (solid) and hits per cycle (hollow) of various layered oxides. (b)–(d) Corresponding voltage profiles and cumulative hits of type AE1 (gray), AE2 (red), and AE3 (green). (e) Changes in c lattice parameters calculated from operando XRD measurements. Reproduced with permission from ref. 41. Copyright 2023, IOP Publishing. | ||
3.5 Li–S batteries
Conversion-type Li–S batteries are another promising next-generation battery chemistry, offering staggering theoretical specific capacity (1675 mA h g−1) and specific energy (3518 W h kg−1). However, polysulfide dissolution and up to 80% volume change during cycling limit the battery lifetime and the practical implementation of the chemistry. To explore optimal electrode compositions and configurations, Lemarié et al. investigated the impact of electrode binders (PVdF and CMC) and current collectors (Al foil and non-woven carbon paper) on the electrochemical cycling and the AE activities of sulfur-based half-cells.37 The best combination was identified to be using CMC binder and porous 3D carbon paper. Unlike previous AE studies, only scarce AE signals were recorded in all four combinations (PVdF/Al, CMC/Al, PVdF/CP, and CMC/CP), as shown in Fig. 12, with a consistent peak frequency of ∼300 kHz. The highest AE activity was observed at the beginning of the discharge (lithiation), corresponding to the initial dissolution of sulfur particles. The electrochemical conversion to polysulfide (Li2S) is accompanied by morphological changes (volume changes/material redistribution) and mechanical stress. Depending on the combination of binder and current collector, these changes may affect the adhesion and mechanical properties of the electrode, influencing its ability to withstand mechanical stress. This, in turn, impacts the amount of AE response related to mechanical disintegration during discharge. The formation of large pores and collapse of the electrode structure were observed in ex situ SEM images. The formation and consumption of Li2S particles were not acoustically active, which might be due to the nanometric size of these particles.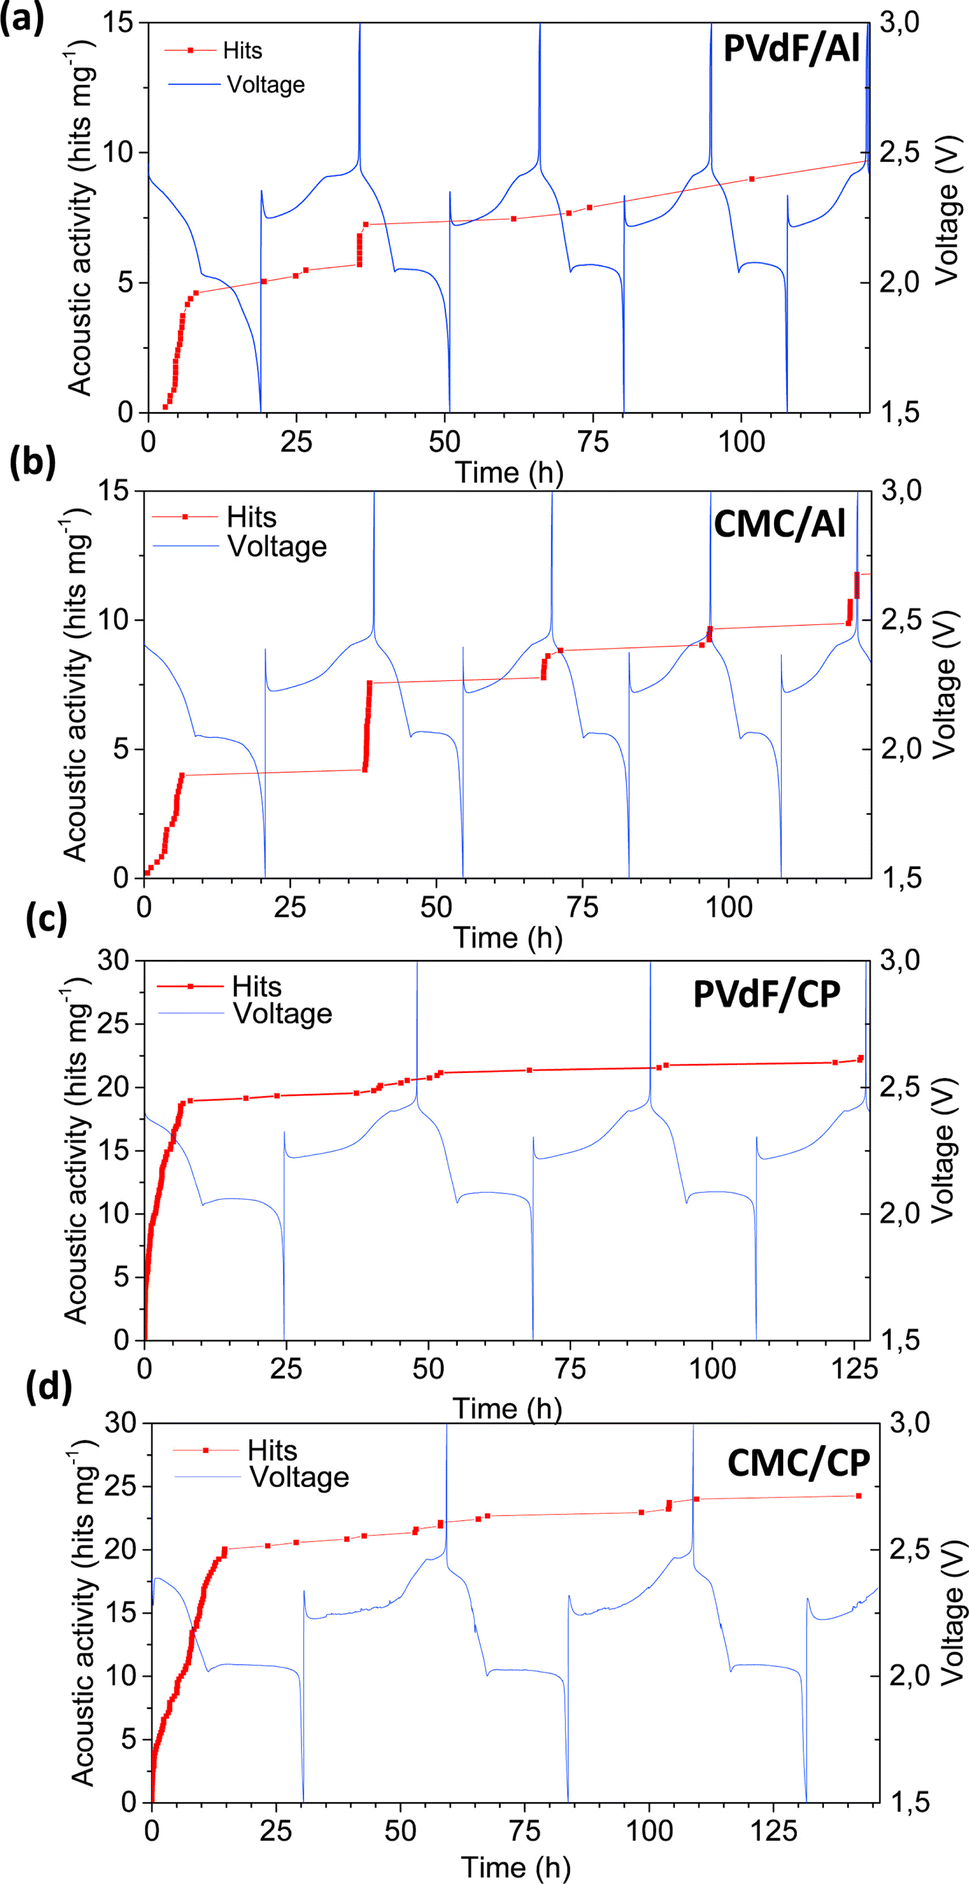 | ||
| Fig. 12 (a)–(d) Acoustic activities and voltage profiles of Li–S cells with different binder/current collector combinations. Reproduced with permission from ref. 37. Copyright 2019, Elsevier. | ||
4 Challenges and outlook
4.1 Multicomponent battery chemistry
The sophisticated chemistry and geometry of batteries, particularly commercial full-cells, present specific challenges. In full-cells, it is imperative to take into account the contributions from two acoustically active materials and their mechano-electrochemical interactions with other cell components, such as electrolyte, separator, conductive carbon, binder, casing, etc., and cell geometry (prismatic, cylindrical, and pouch cells). Each factor contributes to the overall AE response, making it difficult to deconvolute contributions from each electrode and pinpoint specific degradation mechanisms. This paramount complexity requires a comprehensive understanding of the fundamental AE activity of each cell component to link AE events with their respective origins. One effective approach is to work with model systems, such as coin-type half-cells, which offer standardized stack pressure and cell component geometry. Since the acoustic contribution from the lithium counter electrode has been reported as insignificant compared to the working electrode,19 the contribution of individual electrodes can be well isolated. Alternatively, using electrodes with negligible volume change (“zero-strain”), such as spinel-type Li4Ti5O12, should also exclude the contribution from the counter electrode. Following a stepwise increase in the complexity of the cell geometry will allow a rigorous assessment of AE activities for cell components.4.2 Signal acquisition and processing
Unlike more robust and macroscopic systems such as concretes, metals, and rocks, battery systems, especially those containing nanosized active materials (e.g., lithium iron phosphate), emit much fewer AE signals with much lower absolute energy. In addition, since multiple mechanical, chemical, and electrochemical degradation processes are taking place simultaneously inside batteries, it is challenging to adapt to the optimal data acquisition setting to capture different types of AE waveforms. So far, the battery AE analysis has only been conducted sporadically, with no consensus agreed on the optimal setup or settings, such as wideband sensor type, pre-amplifier gain, set dB threshold, and analog/digital filter boundaries. Such inconsistency may lead to scattered results published so far, as the same type of electrode material may yield different AE features, e.g., distinct peak frequencies or AE energy for the same appointed degradation processes.23,35,42 Therefore, standardizing testing parameters and data acquisition conditions are critical to establishing reproducible and meaningful AE measurements.Once the AE data have been recorded, characteristic AE test parameter variations (i.e., hit rate, energy, amplitude, and peak frequency) integrated with synchronized electrochemical characterization are used to deduce mechano-electrochemical degradation of electrode material with the fundamental understanding of electrochemical behavior. However, classic signal processing methods face limitations in accurately isolating and identifying specific degradation mechanisms to decouple AE events, owing to the structural and chemical complexity of the battery. The integration of machine learning (ML) may help address these challenges. Developed algorithms can operate in higher dimensions, providing more precise discrimination of AE features to help deduce specific degradation processes, such as using both supervised and unsupervised ML models to categorize and correlate AE signals with degradation phenomena.61 In other fields, it has been successfully applied, as noted by the works of Kilic et al. and Ciaburro et al., where ML has been combined with AE for various applications including AE from powder bed additive manufacturing process or delamination process of pouch cell electrodes.58,65,66
4.3 Complementary validation methods
While operando AE testing sheds light on the mechanical degradation inside batteries, it does not provide conclusive information regarding the underlying mechanism, necessitating its coupling with complementary characterizations to fully depict the complex scenario. For example, the SEI formation during the reduction of negative electrodes, such as graphite and Si, includes both gas evolution and film formation within a narrow potential (and time) window. AE waveforms emitted by different sources will be recorded altogether by the sensor, making it complicated to deconvolute the individual mechanical event.Currently, the verification of mechano-electrochemical AE sources relies heavily on complementary SEM images, which reveal the microstructural changes of electrode particles after cycling. However, the technique can only be done ex situ, making the precise cross-reference less straightforward. Instead, operando techniques have also been conducted by several groups, such as operando XRD,33,41in situ EIS,4,19operando dilatometry,42,55 and DEMS.20,23 Dynamic changes in structure, resistance, pressure, and gas evolution help describe the fundamental processes taking place on an atomistic/molecular level. Preferably, when multiple operando techniques can be conducted on the same cell, the correlation would be more consistent. For instance, coupling operando XRD and AE has been demonstrated to study Si anodes, in which the authors correlated the number of cumulative AE hits with the relative crystallinity and the lattice strain of the Si electrode, the latter two being derived from the Rietveld refinement of the collected XRD diffractograms.33 There is an arsenal of physicochemical techniques available, such as electrochemical quartz-crystal microbalance (EQCM),67 X-ray computed tomography (CT),68operando attenuated total reflection infrared spectroscopy (ATR-FTIR),69 and Raman spectroscopy,70 to name a few. Other smart sensing technologies, such as ultrasound71 and optical sensing72 have recently demonstrated their versatility for battery monitoring. They can be readily integrated with AE for complementary determination of mechano-electrochemical events inside batteries.
4.4 Future perspectives
The implementation of online AE sensing offers exciting opportunities to study battery states with dynamic insights. Enabling the experimental estimation of the battery SOH. Extensive research is being conducted to adapt AE for monitoring battery abuse scenarios that might occur in real-life applications, such as mechanical bending tests5–7 or induced external short circuits.8 To handle the massive amount of data obtained from the technique, developing and adapting machine learning techniques will be necessary for real-time battery state estimation.Manufacturing aspects, such as the lamination process of electrodes during cell production, have incorporated the use of ML to process the vast amount of AE signals collected during cell fabrication.58 Additionally, a recent study has implemented ML to gather and distinguish AE patterns for pristine and aged cell cycles, correlating them with electrochemical behavior.61 This approach allows for the creation of fast-charging protocols or closed-loop control systems, which help balance the trade-off between battery utilization and degradation rate. Ultimately, collaboration among academia, industry, and regulatory sectors will guide the integration of non-destructive AE sensing into the battery management system for more accurate diagnosis and prognosis of batteries in future EVs.
From a research viewpoint, AE sensing will provide new perspectives on advancing future battery chemistries and technologies, such as solid-state batteries (SSBs).73,74 In these devices, a nonflammable solid electrolyte, either ceramic or polymeric, replaces the conventional organic-based liquid electrolyte to power the battery cell. Solid electrolytes have minimal elastic deformation, meaning they are more prone to mechanical strain at the electrode–electrolyte interface from volume changes during cycling. They can only accommodate these changes through displacement or irreversible deformation, such as plastic deformation or cracking of the composite particles. Consequently, the repeated expansion and contraction of cathode active materials during charge and discharge likely result in contact loss at the solid electrolyte–cathode interface, impeding lithium-ion transport.75,76 On the anode side, lithium metal can be implemented as the negative electrode, which increases the specific energy of the SSBs. However, dendrite formation and growth may still persist, calling for new insights into lithium plating mechanisms under high pressure.77 Overall, while the chemical stability of solid electrolytes has been extensively investigated so far, the understanding of their mechanical behaviors requires more complementary information,78 which can be readily extracted from online AE sensing.
Other advanced battery chemistries, such as aqueous batteries and metal-air batteries, may also emit AE signals during operation. In particular, when air and water are involved in electrochemical reactions, such as oxygen reduction, oxygen evolution, and hydrogen evolution, AE sensing can be used to detect possible gassing behaviors, aiding in the analytical assessment of the electrolyte stability in these systems. The non-destructive AE testing will be an excellent complementary technique, in combination with mechano-electrochemical modeling studies,9,23,39,56,64,79 to monitor the mechanical properties of cell components in real-time, detect detrimental effects such as microcracks and delamination, monitor material deformation, and localize the source of mechanical events.
5 Conclusion
In conclusion, applying online AE sensing in rechargeable batteries marks a significant advancement in battery health monitoring and diagnostics. This nondestructive technique enables real-time monitoring of complex mechano-electrochemical behaviors during battery operation, enhancing the prediction of the battery SOC and SOH, thus contributing to safer and more efficient energy storage solutions. The effectiveness of AE sensing has been demonstrated across various battery chemistries, including Na–S, Ni–MH, Li-ion, Na-ion, and Li–S batteries. However, transitioning from laboratory studies to commercial applications presents challenges such as integrating AE sensors into existing battery management systems, developing standardized data interpretation protocols, and ensuring sensor reliability under diverse conditions. Future research should address these challenges, innovate sensor design, and optimize data analysis techniques to maximize the potential of AE sensing in real-world applications. This will pave the way for the widespread adoption of AE technology, enhancing the performance, longevity, and safety of rechargeable batteries in electric vehicles and grid energy storage systems. As the demand for efficient energy storage grows, online AE sensing will be crucial in advancing battery technology and supporting a sustainable energy future.Data availability
No primary research results, software or code have been included and no new data were generated or analyzed as part of this review.Conflicts of interest
There are no conflicts to declare.Acknowledgements
The authors acknowledge the Swedish Energy Agency (grant number 2023-00990 and 2023-00126), the Swedish Research Council (grant number 2022-03856), and the ÅForsk Foundation (grant number 23-372) for financial support and STandUp for Energy for base funding.Notes and references
- J. Huang, S. T. Boles and J.-M. Tarascon, Nat Sustainability, 2022, 5, 194–204 CrossRef.
- K. Zhang, J. Yin and Y. He, Sensors, 2021, 21, 712 CrossRef CAS PubMed.
- K. Wang, Q. Chen, Y. Yue, R. Tang, G. Wang, L. Tang and Y. He, Nondestr. Test. Eval., 2023, 38, 480–499 CrossRef CAS.
- J. Y. Kim, Z. L. Wang, S. M. Lee and J. W. Byeon, Microelectron. Reliab., 2019, 100–101, 113363 CrossRef CAS.
- W. Hao, Z. Yuan, Y. Xu, S. Zhu, H. Chen and D. Fang, J. Power Sources, 2019, 444, 227323 CrossRef CAS.
- W. Hao, Z. Yuan, D. Li, Z. Zhu and S. Jiang, J. Energy Storage, 2021, 41, 102894 CrossRef.
- Z.-X. Huang, X.-C. Zhang, N.-N. Liu, L.-R. Gu, L.-Q. An and W. Zhou, Eng. Failure Anal., 2024, 163, 108594 CrossRef CAS.
- N. Zhou, X. Cui, C. Han and Z. Yang, Energies, 2022, 15, 1775 CrossRef CAS.
- N. Beganovic and D. Söffker, J. Energy Resour. Technol., 2019, 141, 041901 CrossRef.
- A. Pollock and B. Smith, Non-Destr. Test., 1972, 5, 348–353 CrossRef.
- T. Kishi, M. Ohtsu and S. Yuyama, Acoustic Emission-Beyond the Millennium, 2000, pp. 187–213 Search PubMed.
- D. Lockner, Int. J. Rock Mech. Min. Sci. Geomech. Abstr., 1993, 883–899 CrossRef.
- C. Ennaceur, A. Laksimi, C. Herve and M. Cherfaoui, Int. J. Pressure Vessels Piping, 2006, 83, 197–204 CrossRef CAS.
- P. D. Wentzell and A. P. Wade, Anal. Chem., 1989, 61, 2638–2642 CrossRef CAS.
- X. Wang, Q. Xie and Y. Huang, Nanotechnol. Rev., 2021, 10, 596–604 CrossRef CAS.
- S. Ramadan and H. Idrissi, Desalination, 2008, 219, 358–366 CrossRef CAS.
- Y. P. Kim, M. Fregonese, H. Mazille, D. Feron and G. Santarini, Corros. Sci., 2006, 48, 3945–3959 CrossRef CAS.
- S. Husin, A. Addali and D. Mba, Proc. Inst. Mech. Eng., Part E, 2012, 226, 79–88 CrossRef.
- S. Schweidler, M. Bianchini, P. Hartmann, T. Brezesinski and J. Janek, Batteries Supercaps, 2020, 3, 1021–1027 CrossRef.
- S. Schweidler, S. L. Dreyer, B. Breitung and T. Brezesinski, Coatings, 2022, 12, 402 CrossRef CAS.
- K. Rhodes, N. Dudney, E. Lara-Curzio and C. Daniel, J. Electrochem. Soc., 2010, 157, A1354 CrossRef CAS.
- S. Komagata, N. Kuwata, R. Baskaran, J. Kawamura, K. Sato and J. Mizusaki, ECS Trans., 2010, 25, 163–167 CrossRef CAS.
- A. Schiele, B. Breitung, A. Mazilkin, S. Schweidler, J. Janek, S. Gumbel, S. Fleischmann, E. Burakowska-Meise, H. Sommer and T. Brezesinski, ACS Omega, 2018, 3, 16706–16713 CrossRef CAS PubMed.
- W. Methani, E. Pál, S. Lipcsei, D. Ugi, Z. Pászti, I. Groma, P. Jenei, Z. Dankházi and R. Kun, Batteries, 2022, 8, 80 CrossRef CAS.
- N. Kircheva, S. Genies, D. Brun-Buisson and P.-X. Thivel, J. Electrochem. Soc., 2011, 159, A18–A25 CrossRef.
- N. Kircheva, S. Genies, C. Chabrol and P. X. Thivel, Electrochim. Acta, 2013, 88, 488–494 CrossRef CAS.
- Y. He, M. Li, Z. Meng, S. Chen, S. Huang, Y. Hu and X. Zou, Mech. Syst. Signal Process., 2021, 148, 107146 CrossRef.
- C.-Y. Choe, W.-S. Jung and J.-W. Byeon, Mater. Trans., 2015, 56, 269–273 CrossRef CAS.
- S.-M. Lee, J.-Y. Kim, J. Lee and J.-W. Byeon, J. Mater. Res. Technol., 2023, 24, 5235–5249 CrossRef CAS.
- P. X. Thivel, N. Kircheva, S. Tant, B. Legros, S. Genies and S. Rosini, Acoustic Methods as a Tool for Management of Electrochemical Process of Energy, 2012 Search PubMed.
- C. Villevieille, M. Boinet and L. Monconduit, Electrochem. Commun., 2010, 12, 1336–1339 CrossRef CAS.
- S. Schweidler, S. L. Dreyer, B. Breitung and T. Brezesinski, Sci. Rep., 2021, 11, 23381 CrossRef CAS PubMed.
- K. Rhodes, M. Kirkham, R. Meisner, C. M. Parish, N. Dudney and C. Daniel, Rev. Sci. Instrum., 2011, 82, 075107 CrossRef PubMed.
- T. Fukushima, S. Kato, N. Kuwata and J. Kawamura, ECS Trans., 2014, 62, 215–222 CrossRef CAS.
- A. Tranchot, A. Etiemble, P. X. Thivel, H. Idrissi and L. Roué, J. Power Sources, 2015, 279, 259–266 CrossRef CAS.
- C.-Y. Choi and J.-W. Byeon, J. Korean Soc. Nondestruc. Test., 2013, 33, 198–204 CrossRef.
- Q. Lemarié, F. Alloin, P. Thivel, H. Idrissi and L. Roué, Electrochim. Acta, 2019, 299, 415–422 CrossRef.
- T. Matsuo, M. Uchida and H. Cho, J. Solid Mech. Mater. Eng., 2011, 5, 678–689 CrossRef.
- W. H. Woodford, W. C. Carter and Y.-M. Chiang, Energy Environ. Sci., 2012, 5, 8014 RSC.
- T. Ohzuku, H. Tomura and K. Sawai, J. Electrochem. Soc., 1997, 144, 3496–3500 CrossRef CAS.
- S. L. Dreyer, R. Zhang, J. Wang, A. Kondrakov, Q. Wang, T. Brezesinski and J. Janek, J. Phys.: Energy, 2023, 5, 035002 Search PubMed.
- A. Tranchot, H. Idrissi, P. X. Thivel and L. Roué, J. Power Sources, 2016, 330, 253–260 CrossRef CAS.
- C. U. Grosse, M. Ohtsu, D. G. Aggelis and T. Shiotani, Acoustic Emission Testing: Basics for Research–Applications in Engineering, Springer Nature, 2021 Search PubMed.
- F. Sarasini and C. Santulli, Natural Fibre Composites, Elsevier, 2014, pp. 273–302 Search PubMed.
- A. Etiemble, H. Idrissi and L. Roué, J. Power Sources, 2011, 196, 5168–5173 CrossRef CAS.
- C. Worrell and B. Redfern, J. Mater. Sci., 1978, 13, 1515–1520 CrossRef CAS.
- R. Ramesh, C. K. Mukhopadhyay, T. Jayakumar and B. Raj, Scr. Mater., 1998, 38(4), 661–665 CrossRef CAS.
- A. Etiemble, H. Idrissi, S. Meille and L. Roué, J. Power Sources, 2012, 205, 500–505 CrossRef CAS.
- A. Etiemble, S. Rousselot, W. Guo, H. Idrissi and L. Roué, Int. J. Hydrogen Energy, 2013, 38, 7169–7177 CrossRef CAS.
- A. Etiemble, H. Idrissi and L. Roué, Int. J. Hydrogen Energy, 2013, 38, 1136–1144 CrossRef CAS.
- A. Etiemble, P. Bernard, H. Idrissi and L. Roué, Electrochim. Acta, 2015, 186, 112–116 CrossRef CAS.
- H. Inoue, R. Tsuzuki, S. Nohara and C. Iwakura, J. Alloys Compd., 2007, 446–447, 681–686 CrossRef CAS.
- H. Inoue, R. Tsuzuki, S. Nohara and C. Iwakura, Electrochem. Solid-State Lett., 2006, 9, A504 CrossRef CAS.
- S. Didier-Laurent, H. Idrissi and L. Roué, J. Power Sources, 2008, 179, 412–416 CrossRef CAS.
- T. Ohzuku, N. Matoba and K. Sawai, J. Power Sources, 2001, 97, 73–77 CrossRef.
- S. Kalnaus, K. Rhodes and C. Daniel, J. Power Sources, 2011, 196, 8116–8124 CrossRef CAS.
- G. Staikov, P. Yankulov, K. Mindjov, B. Aladjov and E. Budevski, Electrochim. Acta, 1984, 29, 661–665 CrossRef CAS.
- R. Leithoff, N. Dilger, F. Duckhorn, S. Blume, D. Lembcke, C. Tschöpe, C. Herrmann and K. Dröder, Batteries, 2021, 7, 19 CrossRef CAS.
- Z. Wang, X. Zhao, H. Zhang, D. Zhen, F. Gu and A. Ball, J. Energy Storage, 2023, 64, 107192 CrossRef.
- W. H. Woodford, W. C. Carter and Y.-M. Chiang, J. Electrochem. Soc., 2014, 161, F3005–F3009 CrossRef CAS.
- A. Fordham, S.-B. Joo, R. E. Owen, E. Galiounas, M. Buckwell, D. Brett, P. Shearing, R. Jervis and J. B. Robinson, J. Electrochem. Soc., 2024, 171(7), 070521 CrossRef.
- A. Etiemble, H. Idrissi and L. Roué, Int. J. Hydrogen Energy, 2014, 39, 10169–10174 CrossRef CAS.
- M. Fregonese, H. Idrissi, H. Mazille, L. Renaud and Y. Cetre, Corros. Sci., 2001, 43, 627–641 CrossRef CAS.
- P. Barai and P. P. Mukherjee, J. Electrochem. Soc., 2014, 161, F3123–F3136 CrossRef CAS.
- A. Kilic, B. Oral, D. Eroglu and R. Yildirim, J. Energy Storage, 2023, 73, 109057 CrossRef.
- G. Ciaburro and G. Iannace, Appl. Sci., 2022, 12, 10476 CrossRef CAS.
- X. Hou, L. Zhang, N. Gogoi, K. Edström and E. J. Berg, Small, 2024, 20, 2308577 CrossRef CAS PubMed.
- X. Lu, A. Bertei, D. P. Finegan, C. Tan, S. R. Daemi, J. S. Weaving, K. B. O'Regan, T. M. Heenan, G. Hinds and E. Kendrick, et al. , Nat. Commun., 2020, 11, 2079 CrossRef CAS PubMed.
- T. Melin, R. Lundström and E. J. Berg, J. Phys. Chem. Lett., 2024, 15, 2537–2541 CrossRef CAS PubMed.
- E. Flores, P. Novák and E. J. Berg, Front. Energy Res., 2018, 6, 82 CrossRef.
- C. Bommier, W. Chang, Y. Lu, J. Yeung, G. Davies, R. Mohr, M. Williams and D. Steingart, Cell Rep. Phys. Sci., 2020, 1, 100035 CrossRef.
- J. Huang, L. Albero Blanquer, J. Bonefacino, E. R. Logan, D. Alves Dalla Corte, C. Delacourt, B. M. Gallant, S. T. Boles, J. Dahn, H.-Y. Tam and J.-M. Tarascon, Nat. Energy, 2020, 5, 674–683 CrossRef CAS.
- H. Huo, M. Jiang, Y. Bai, S. Ahmed, K. Volz, H. Hartmann, A. Henss, C. V. Singh, D. Raabe and J. Janek, Nat. Mater., 2024, 23, 543–551 CrossRef CAS PubMed.
- S. Kalnaus, N. J. Dudney, A. S. Westover, E. Herbert and S. Hackney, Science, 2023, 381, eabg5998 CrossRef CAS PubMed.
- W. Zhang, D. Schröder, T. Arlt, I. Manke, R. Koerver, R. Pinedo, D. A. Weber, J. Sann, W. G. Zeier and J. Janek, J. Mater. Chem. A, 2017, 5, 9929–9936 RSC.
- T. Shi, Y.-Q. Zhang, Q. Tu, Y. Wang, M. Scott and G. Ceder, J. Mater. Chem. A, 2020, 8, 17399–17404 RSC.
- Q. Tu, L. Barroso-Luque, T. Shi and G. Ceder, Cell Rep. Phys. Sci., 2020, 1, 100106 CrossRef.
- L. R. Mangani and C. Villevieille, J. Mater. Chem. A, 2020, 8, 10150–10167 RSC.
- W. H. Woodford, Y.-M. Chiang and W. C. Carter, J. Mech. Phys. Solids, 2014, 70, 71–83 CrossRef CAS.
Footnote |
| † These authors contributed equally to this work. |
| This journal is © The Royal Society of Chemistry 2024 |