 Open Access Article
Cold sprayed WO3 and TiO2 electrodes for photoelectrochemical water and methanol oxidation in renewable energy applications
Christoph
Haisch
a,
Jenny
Schneider
a,
Manuel
Fleisch
a,
Henning
Gutzmann
b,
Thomas
Klassen
bc and
Detlef W.
Bahnemann
*ad
aInstitut für Technische Chemie, Leibniz Universität Hannover, Callinstrasse 5, D-30167 Hannover, Germany. E-mail: bahnemann@iftc.uni-hannover.de
bInstitute of Materials Technology, Helmut Schmidt University, Holstenhofweg 85, D-22043 Hamburg, Germany
cInstitute of Materials Technology, Helmholtz-Zentrum Geestacht, Max-Planck-Str. 1, D-21465 Geestacht, Germany
dLaboratory “Photoactive Nanocomposite Materials” (Director), Saint-Petersburg State University, Ulyanovskaya str.1, Peterhof, Saint-Petersburg, 198504 Russia. E-mail: detlef.bahnemann@spbu.ru
First published on 29th August 2017
Abstract
Films prepared by cold spray have potential applications as photoanodes in electrochemical water splitting and waste water purification. In the present study cold sprayed photoelectrodes produced with WO3 (active under visible light illumination) and TiO2 (active under UV illumination) on titanium metal substrates were investigated as photoanodes for the oxidation of water and methanol, respectively. Methanol was chosen as organic model pollutant in acidic electrolytes. Main advantages of the cold sprayed photoelectrodes are the improved metal–semiconductor junctions and the superior mechanical stability. Additionally, the cold spray method can be utilized as a large-scale electrode fabrication technique for photoelectrochemical applications. Incident photon to current efficiencies reveal that cold sprayed TiO2/WO3 photoanodes exhibit the best photoelectrochemical properties with regard to the water and methanol oxidation reactions in comparison with the benchmark photocatalyst Aeroxide TiO2 P25 due to more efficient harvesting of the total solar light irradiation related to their smaller band gap energies.
1. Introduction
Since the first attempts concerning photoelectrochemical water splitting by Fujishima and Honda in 1972 there has been a tremendous development in the field of heterogeneous photocatalysis.1 A wide variety of semiconductor films have been investigated during the past 40 years and titanium dioxide was found to be the most stable and powerful photocatalyst leading to the degradation of organic compounds.2,3 The degradation of organic pollutants combined with the reduction of water yielding molecular hydrogen is an important application for photoelectrochemical cells. A considerable amount of research has been done regarding the decomposition of persistent organic chemicals which are present as pollutants in industrial and household wastewater.4,5 In this work tungsten oxide and titanium dioxide photoanodes prepared by cold spray were investigated in the well-known reference systems of water oxidation and methanol degradation (as a model pollutant), respectively. The aim of the work is the development of a chemically stable photoanode for the industrial scale oxidation of organic pollutants.The technique of cold spray has previously been employed for the preparation of photoelectrodes. Initially, cold sprayed TiO2 layers on metal surfaces were characterized by Kliemann et al. in 2011.6 Emmler et al. and Herrmann-Geppert et al. performed investigations of cold sprayed TiO2 and Fe2O3 photoelectrodes for photoelectrochemical water oxidation in 2013 and 2016, respectively.7,8 Ivanova et al. employed TiO2 cold sprayed films on metal substrates for the photocatalytic degradation of organic acids.9 However, to the best of our knowledge WO3 films prepared by cold spray have not been investigated so far. Compared to other coating techniques employed to prepare WO3 films like doctor blade,10 magnetron sputtering,11 atomic layer deposition,12 spray pyrolysis,13 and solvothermal deposition,14 the cold spray technique readily enables an upscaling for the manufacturing of mechanically stable films on metal substrates to an industrial scale with variable electrode sizes.
One disadvantage of employing TiO2 as a photocatalyst is its large band gap energy of 3.0 eV (rutile) which corresponds to an absorption of light with wavelengths ≤413 nm resulting in the utilization of only a very small part of the incoming sunlight (4%–5%). Since the early works by Hodes et al.15 and separately by Butler et al.16,17 tungsten trioxide has been considered as an alternative and promising photoanode material. The smaller optical band gap of tungsten oxide (2.6 eV) allows a more efficient harvesting of the total solar light irradiation due to some visible light absorption. Despite the smaller band gap, the valence band position of tungsten oxide18 is still matching the redox potentials for the four hole oxidation of water (H2O/O2, 1.23 V vs. NHE, pH 0), the one hole oxidation of water (H2O/˙OH, 2.73 V vs. NHE, pH 0) and the one hole oxidation of methanol (CH3OH/˙CH2OH, 1.45 V vs. NHE, pH 0).19 Like for TiO2 the energetic position of the valence band is determined according to the location of oxygen 2p-orbitals with an energy of 2.94 V vs. NHE.20 In 2001, the photoelectrochemical degradation of methanol in acidic solution has been evaluated for highly transparent WO3 films prepared by the deposition from colloidal tungstic acid solutions.21
In this work tungsten oxide and titanium dioxide photoanodes were investigated in the well-known reference systems of water oxidation and methanol degradation, respectively. The activity of the photoelectrodes was investigated by determining the incident photon to current efficiency (IPCE) and by chopped light voltammetry (CLV) in acidic media in the presence and in the absence of methanol. The CLV measurements were carried out under simulated solar AM 1.5-global irradiation.
2. Experimental section
2.1 Materials
All chemicals were of analytical grade and used as received without further purification. Tungsten oxide was obtained from Sigma-Aldrich. Concentrated sulfuric acid and methanol were obtained from Carl Roth Company. Aeroxide TiO2 P25 and VP Aeroperl P25/20 (both TiO2: 80% anatase and 20% rutile22) were obtained from Evonik Industries AG. Titanium metal substrates were obtained from ThyssenKrupp Schulte GmbH.2.2 Preparation of electrodes
Photoanodes of TiO2 and WO3 were prepared by two methods, screen printing and cold spray. For the screen printing method, P25 was employed and corresponding pastes were prepared as described in the literature.23 The pastes were coated on substrates of Ti metal and FTO (fluorine-doped tin oxide SnO2:F) glass and subsequently annealed at 450 °C for 2 hours. For the cold spray technique, Aeroxide TiO2 P25 had to pass an agglomeration process to match the requirements for cold spray. The resulting VP Aeroperl P25/20 powders (Evonik Industries AG) provide the desired flowability, which usually requires particle sizes above 10 μm and spherical particles.These P25/20 agglomerates show flattening and partial breaking after the cold spray process.7 The cold spray process was performed with the HSU CGT Kinetiks 8000 prototype by using nitrogen as process gas at a temperature of 800 °C and a pressure of 4 MPa. A type 24 WC-Co nozzle and a powder feeder PF4000 (CGT, Cold Gas Technology GmbH) were employed. The traverse speed of the spray gun was 240 mm s−1 and the powder feed rates were 0.16 g s−1 and 0.47 g s−1 for TiO2 and WO3, respectively. Within the cold spray process the solid powders were accelerated in the N2 gas stream to very high velocities towards the Ti metal substrates at a stand-off distance of 60 mm.
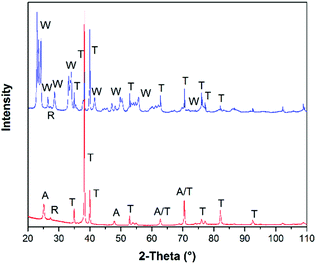
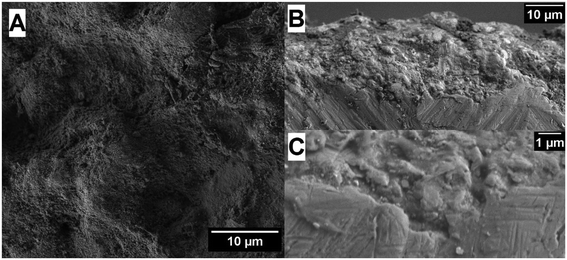
The name of the so called “cold spray” technique derives from the comparison to other common thermal spray techniques like plasma spray or high velocity oxygen fuel (HVOF), where relatively high temperatures of at least 2000 °C are applied during the spray process to the particles. In contrast to this, the process gas temperatures of the cold spray method usually do not exceed the employed 800 °C. After the nitrogen process gas has passed the smallest cross section of the Laval nozzle used in cold spray, the gas temperature decreases strongly in the diverging section.24 Under the used spray conditions, the nitrogen gas has a temperature of around 150 °C when it leaves the nozzle. It should also be noted here that the solid semiconductor particles are only exposed to the hot nitrogen process gas on a time scale of a few milliseconds until they reach the metal substrate. Consequently, no phase transformations could be observed and the crystallographic structure of the semiconductor powder could be preserved. Accordingly, the presence of a predominant anatase phase was confirmed by X-ray diffraction (XRD) measurements (Fig. 2) of the cold sprayed P25 films. In the cold spray process the powder particles show pseudo-deformation upon impact, presumably by a fracture and fusion mechanism leaving residual cracks, while the metal substrates deform plastically and the interface area is stretched out.25 As a result, an intimate contact is formed and the metal oxide is bonded to the metal substrate as illustrated in Fig. 1. No change in TiO2 modification during the cold spray process could be observed because the particle's dwell time in the gas stream is very short.6–8 An SEM image of a cold sprayed P25/20 photoanode film on a titanium substrate is shown in Fig. 4. The cold sprayed electrodes were also annealed at 450 °C for 2 hours in air to facilitate direct comparison with the screen-printed electrodes.
2.3 Materials characterisation
The optical properties of the powders and the deposited films were determined using UV-Vis diffuse reflectance spectroscopy (Varian Cary 100 Bio). The structural and morphological properties of the films were analysed using X-ray diffraction (Bruker D8 Advance) and scanning electron microscopy (JEOL JSM-6700F) with a LEI detector (Lower Secondary Electron Image).2.4 Electrochemical and photoelectrochemical measurements
The measurements were carried out with a three compartment cell consisting of a working (photo-) electrode (WE), a Pt wire counter electrode (CE) and a Ag/AgCl reference electrode (RE). 0.1 M KCl solution was used as electrolyte for Mott–Schottky capacitance analysis. The Mott–Schottky measurement was carried out at a single frequency of 10 Hz. This frequency was derived from an electrochemical impedance measurement over a wide frequency range where the imaginary part of the impedance was found to be purely capacitive. In this work the flatband potentials and donor densities of the photoanodes were calculated from the resulting Mott–Schottky plots (C−2vs. applied potential). 0.5 M acid solution (H2SO4) was used as the electrolyte for the photoelectrochemical measurements. This system provides the most useful information for comparing TiO2 and WO3 photoelectrodes, as WO3 itself is not stable at pH values higher than 5. The photocurrents were measured using a Zennium potentiostat and a PECC-2 photoelectrochemical cell (Zahner-Elektrik GmbH & Co. KG). The light source was a solar simulator (LOT-Quantum Design GmbH) with a 300 W Xe lamp and an AM 1.5-global filter providing an intensity of 680 W m−2 in the regime of 280–1000 nm. The intensity of the lamp was measured with a SpectraRad xpress spectral irradiance meter (BWTEK Inc.). During the chopped light voltammetry (CLV) measurements the illumination source was chopped on and off with a frequency of 200 mHz. After the photoelectrochemical oxidation experiments samples were taken from the electrolyte for directly monitoring the produced formaldehyde as the expected main product of the methanol oxidation. Upon the addition of the Nash reagent (0.02 M acetylacetone, 0.05 M acetic acid, 2 M ammonium acetate) to the samples formaldehyde will react to form 3,5-diacetyl-1,4-dihydro-2,6-lutidine (DDL), which can be detected by fluorescence spectroscopy.26,27 The DDL containing samples were excited with a wavelength of 405 nm and showed an emission peak at 510 nm. This emission was used to calculate the concentration of the produced formaldehyde from the photo-oxidation of methanol. For the photoelectrochemical efficiency measurements a tuneable LED light source array system TLS03 (Zahner-Elektrik GmbH & Co. KG) was employed. The efficiencies were received as wavelength depended photocurrent efficiencies (A W−1) and incident photon to current efficiencies (IPCE; %), while only the latter will be shown in this work since the information provided by both values is identical. The IPCE was calculated using the following eqn (1): | (1) |
3. Results
3.1 Electrode characterization
XRD diffraction patterns of TiO2 und WO3 photoelectrodes prepared by the cold spray technique are shown in Fig. 2.All diffraction peaks on the XRD pattern could be addressed to the expected materials WO3, rutile TiO2, anatase TiO2, and Ti metal by DIFFRAC.EVA software from Bruker Corporation. The cold spray technique has the advantage that only the carrier gas N2 is needed to form a coating. No other additives such as binders or solvents are required for the film preparation. Hence, both types of electrodes show distinct diffraction peaks of the titanium metal substrate and of the employed semiconductor powders. The XRD pattern of the TiO2 electrode shows reflexes from both, the anatase 2Θ: 25.1° (110), 2Θ: 47.9° (200), and the rutile modification 2Θ: 27.2° (110) as expected, since P25/20 consists of about 80% anatase and 20% rutile.22 Two diffraction peaks (2Θ: 62.8° and 70.4°) could only be addressed to anatase or titanium metal, because both patterns have overlaying reflexes at these angles. WO3 shows a considerable number of very close multiple diffraction peaks in the regimes of 2Θ: 23–24°, 33–34°, 44–63°, and 67–83°. These reflexes partially overlap with titanium metal reflexes with higher intensity as displayed in the diffractogram (see Fig. 2, blue curve). At 2Θ: 27.3° (110) the diffraction peak of the thermodynamically most stable TiO2 modification rutile was observed in both diffractograms. This is an indication for the presence of a TiO2 passivation layer on the surface of the Ti metal substrate for both photoanodes. However, during the impact process, the particles have a very high kinetic energy, so that the agglomerates can be assumed to penetrate the thin TiO2 passivation layer of the Ti metal substrate.8 After the coating processes the investigated electrodes were annealed at 450 °C for 2 hours in air. The Ti metal substrate was only partially oxidized as the deposited semiconductor material layer covers the Ti metal substrate, while the FTO substrate was not oxidized at all.
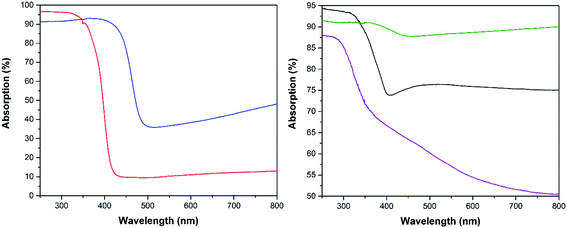
The absorption spectra of the employed semiconductor powders and of the cold sprayed photoelectrodes are shown in Fig. 3 (left side). The absorption edge of the yellow-green WO3 powder (blue curve) is about ∼70 nm red shifted compared to the white TiO2 powder (red curve). From the spectra it is obvious that the WO3 powder is able to harvest the visible light much more efficiently while the TiO2 powder shows about 5% higher absorption in the UV regime. A similar trend was observed in the absorption spectra of the cold sprayed photoelectrodes (Fig. 3, right side). Moreover, it is obvious from the spectra that the cold sprayed TiO2/Ti (black curve) and WO3/Ti (green curve) photoelectrodes absorb much more of the incident visible light as compared to the semiconductor powders. This behaviour is attributed to the Ti metal substrates and the dark colourations of the photoelectrodes.
The optical band gap of powders and electrodes were determined from diffuse reflectance measurements employing the Tauc equation.28 Tungsten trioxide powder has an optical band gap Eg of 2.6 eV (λos ≈ 477 nm) while the tungsten trioxide electrode has an optical band gap of 2.76 eV (+6.15%) which is slightly higher. The same effect is observed for the TiO2 photoelectrodes. The optical band gap of the P25/20 powder is 3.0 eV (λos ≈ 413 nm) and the optical band gap of the electrode is 3.13 eV (+4.33%). It is worth to mention here that the optical properties of the powders and electrodes were studied under the same experimental conditions. There are big changes in the visible light absorption as presented in Fig. 3 following the cold spray preparation method. Above the band edges there is an increased visible range absorption. This can be attributed to the effect of the Ti substrate (purple curve), which is absorbing more than 50% of the incident light irradiation. Moreover there was also a colour change of the WO3 powder from yellow-green to dark grey and a colour change of TiO2 from white to light blue-grey after the cold spray process. These observed colour changes and band gap broadenings are attributed to an increased oxygen vacancy density produced in the film by the high temperature treatment during the cold spray and the additional calcination processes. Consequently, the absorption edge of the semiconductor films is blue shifted, resulting in a widening of the optical band gap energy according to the Burstein–Moss effect.29,30
As second method for the preparation of the electrodes, the screen printing technique has also been applied. This technique is well known as an easy and highly reproducible method for the fabrication of electrodes with film thicknesses in the same order of magnitude as that of the cold sprayed electrodes. However, the surfaces of the screen printed films show very different characteristics considering morphology, transparency, and film thickness distribution.23,31,32 The employed TiO2 screen printed films were transparent, highly porous and had a well-defined film thickness of 2.9 ± 0.1 μm due to the fixed mesh scale of the employed screen. They were attached to the FTO glass substrate via a binder.
Electron microscopy images reveal that the cold spray technique is leading to a plastic deformation of the employed smooth metal substrate (Fig. 4). Additional SEM images and studies of the impact morphologies of cold sprayed TiO2 layers are given in the literature.6 The impact of the powder particles with high velocities generates heat resulting in bonding as well as in a partial break-up of the P25 agglomerates, namely P25/20.7,8 The metal oxides are bonded to the metal substrate without the assistance of any additive or binder that might affect the photocatalytic process. Nevertheless, the coupling of film and substrate could even be improved by additional calcination leading to higher cycle stability for the electrodes prepared by both techniques. The cold sprayed films have a rough surface with broad film thickness distribution of 1–10 μm on each electrode.6 The Fig. 4B and C display cross-sectional SEM images of the fabricated cold sprayed electrodes. A complete film coverage of the metal substrates could be achieved employing the cold spray method.
Fig. 5 shows electron microscopy images of the semiconductor particles in the film. The images reveal that the particle sizes of the TiO2 particles in the screen printed film are smaller than the particle sizes in the cold sprayed TiO2 film, as expected from P25/20. The morphology of screen printed TiO2 films is well described in the literature.23,31,32 For screen printed P25 photoanodes prepared under very similar conditions surface areas of 52 m2 g−1, porosities of 52% and an average pore diameter of 21.8 mm were reported.31 The SEM image of the cold sprayed film, on the other hand, shows that the particles are sintered to a very dense film with no visible porosity. This will generally lead to lower surface areas, but at the same time to improved electrical conductivity compared to the screen printed film.
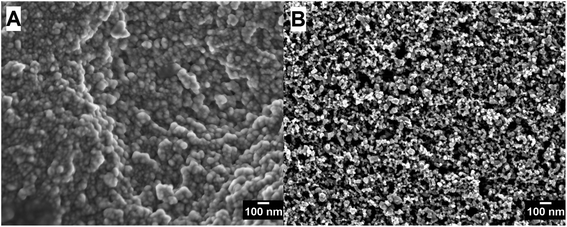 | ||
| Fig. 5 (A) SEM image of a cold sprayed TiO2 (P25/20) film on Ti metal substrate. (B) SEM image of a screen printed TiO2 (P25) film on FTO substrate. | ||
3.2 Photoelectrochemical oxidation of water and methanol
The photoelectrodes were investigated employing the well-known reference systems of water and methanol oxidation.33 Hence, the observed photocurrents for all photoelectrochemical measurements can be attributed to water or methanol oxidation, respectively. The accumulation of four long lived oxidizing equivalents (holes) is necessary for the water oxidation reaction leading to the formation of molecular oxygen with a redox potential of 1.23 V vs. NHE:34| 2H2O + 4h+ → O2 + 4Haq+ | (2) |
It should be noted here that the two hole oxidation of water leads to the formation of hydrogen peroxide (H2O2) via
| 2H2O + 2h+ → H2O2 + 2Haq+ | (3) |
The oxidation mechanism of methanol is even more complicated as methanol is oxidized in three steps to the final oxidation product, carbon dioxide, as shown in eqn (4)–(6):35
| CH3OH + 2h+ → HCHO + 2Haq+ | (4) |
| HCHO + H2O + 2h+ → HCOOH + 2Haq+ | (5) |
| HCOOH + 2h+ → CO2 + 2Haq+ | (6) |
In principle, each step requires two electron–hole pairs, that is, the absorption of two photons. Often, the reactions are initiated by the transfer of one hole to the reactant forming a very reactive intermediate which will further react via certain reaction pathways to the respective product. For example, the first reaction of CH3OH with one hole results in the formation of a hydroxymethyl radical ˙CH2OH as intermediate (CH3OH/˙CH2OH, 1.45 V vs. NHE, pH 0).19 This radical is able to inject an electron into the conduction band of the semiconductor, a process called “current doubling”,36 leading to the formation of formaldehyde. However, in the presence of O2 in the system ˙CH2OH is more likely to react with O2 to produce formaldehyde as well.
After the coating processes the investigated screen printed and cold sprayed photoelectrodes were annealed in air at 450 °C for 2 hours. For the screen printed electrodes this is necessary for removing terpineol and ethyl cellulose added as binders to the screen printing paste from the semiconductor film. Otherwise, no stable photocurrent could be observed from these photoanodes. For the cold sprayed photoelectrodes it was found that the annealing process leads to a partial oxidation of the uncoated parts of the Ti substrate. This could also be observed in voltammetry measurements, as cold spray photoelectrodes without subsequent heat treatment show additional oxidizing currents. Moreover, the stable photocurrent densities of the calcined cold sprayed photoelectrodes were increased as compared with the untreated cold spray electrodes. This could be attributed to the reduction of defects. The donor densities for both, the screen printed (ND = 7.06 × 1019 cm−3) and the cold sprayed (ND = 1.43 × 1019 cm−3) TiO2 photoelectrodes were found to be similar.
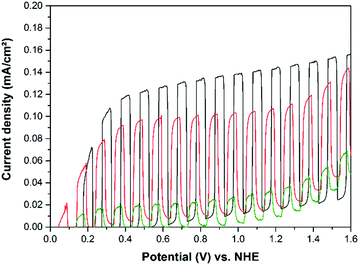
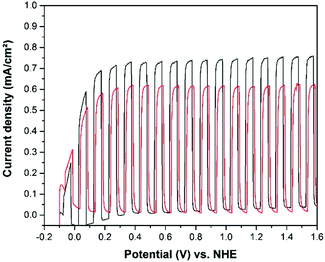
The current–potential curves for water and methanol oxidation are shown in Fig. 6 and 7, respectively. These measurements reveal that the preparation of photoelectrochemically active cold sprayed TiO2 films on Ti metal substrates was successful. The photocurrents that could be achieved with cold sprayed TiO2 photoelectrodes for water oxidation are shown in Fig. 6, by the red curve. For a better comparison of the different film preparation methods TiO2 was also screen printed on Ti metal substrates. The results for the water oxidation photocurrents show that screen printing on metal substrates (green curve) is not practicable as the powder is apparently just homogenously distributed on the thin TiO2 passivation layer of the Ti metal. During the photoelectrochemical cycling the TiO2 passivation layer might act as an additional barrier for the electron flow at the interface of the semiconductor and the metal, resulting in a quite low photoelectrochemical activity. Consequently, screen printing of TiO2 films was carried out on FTO glass substrates as well.
When comparing the photoelectrochemical activities of the TiO2 films deposited by different methods, the obtained results for water oxidation (Fig. 6) show highest activies for the screen printed TiO2 films on FTO glass (black curve) as compared to the other techniques employed here. The photocurrent achieved by the non-porous cold sprayed photoanodes are slightly lower (red curve). The higher photoelectrochemical activities of screen printed TiO2 electrodes (Fig. 6–9) are attributed to their higher surface areas and porosities, as shown in Fig. 5.
Recently, it was reported that the observed photocurrent from photoanodes in 1 M H2SO4 could be partially assigned to the anodic oxidation of sulfate (SO42−) from the electrolyte to persulfate (S2O82−).10 Consequently, the concentration of the electrolyte was reduced to 0.5 M H2SO4 and the cold sprayed TiO2 on titanium metal and the screen printed TiO2 on FTO photoanodes were also tested for methanol (model pollutant) oxidation, as displayed in Fig. 7. The measured photocurrent densities increased by more than 300% compared to the methanol free system. Moreover, the anodic photocurrent is almost stable over the whole potential region from 0.2–1.6 V vs. NHE. This indicates a very high reaction rate for the methanol oxidation on the TiO2 surface. Measurements at higher light intensities than the solar AM 1.5-G irradiation reveal that the photocurrent is apparently limited by the light intensity above 0.2 V vs. NHE.
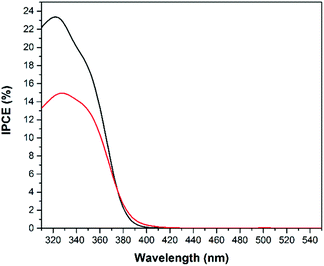
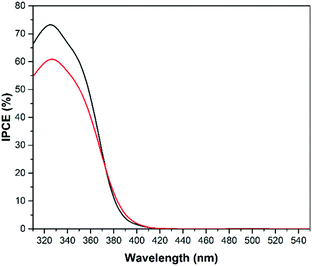
The IPCE spectra (displayed in Fig. 8 and 9) measured for the TiO2 photoelectrodes show a photocurrent onset of around 410 nm, in good agreement with the reported band gap energy of TiO2 and the observed absorption edge (Fig. 3).1 However, the apparent visible light absorption introduced into the TiO2 films by the cold spray method was not able to contribute to any enhancement of the photocatalytic efficiency in the visible light regime. Consequently, the change in the visible light absorption of the electrode (Fig. 3) should be assigned mostly to the metal substrate, which is not contributing to the photoelectrochemical activity of the semiconductor film. For the screen printed photoanodes (black curves) the efficiencies for water and methanol oxidation at the optimal wavelength of 325 nm are about 8% and 13% higher, respectively. As discussed above, this is attributed to the higher surface area of the screen printed films.23,31,32
When methanol is added to the acidic electrolyte the incident photon to current efficiency at the optimal wavelength of 325 nm is about 50% and 45% higher for screen printed and cold sprayed photoanodes, respectively, in good agreement with the photocurrent measurements shown in Fig. 6 and 7. These observations indicate that TiO2 is a much better photocatalyst for environmental water cleaning applications than for photoelectrochemical water splitting.3 However, the IPCE measurements reveal that UV light irradiation is needed in order to obtain notable photoelectrochemical activities on TiO2 photoelectrodes.
It was found that WO3 photoelectrodes exhibit higher activities upon illumination with regard to the water and methanol oxidation reactions as compared with the benchmark photocatalyst Aeroxide TiO2 P25. Both, the photocurrent densities (Fig. 10 and 12) and the IPCEs (Fig. 13 and 14) were found to be higher on the tungsten oxide electrodes than on all investigated TiO2 P25 electrodes. This is readily explained by the red shift in the absorption edge of WO3 of ∼70 nm and by an improved coupling of the Ti metal substrate and the photocatalyst WO3 film prepared by cold spray. Nevertheless, it is worth to mention here that TiO2 photoelectrodes perform better at relatively low potentials (≤0.6 V vs. NHE) due to earlier photocurrent onsets for water and methanol oxidation. Another advantage of the cold sprayed WO3 photoelectrodes might derive from their higher donor density of ND = 4.04 × 1022 cm−3 compared to the donor density of the cold sprayed TiO2 film (ND = 1.43 × 1019 cm−3).
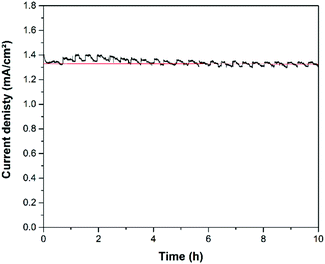
Based upon observations made during the measurements it is evident that the observed photocurrent density originates from the oxidation of water or methanol, respectively, and not from the photocorrosion of the semiconductor layers. First of all, while large photocurrent densities were obtained, there was no observable dissolution of the semiconductor film from the photoanode. The investigated photoanodes were cycled several times until the chopped light curves (Fig. 10 and 12) were obtained. Assuming that the hypothetical dissolution of WO3 occurs by a two electron transfer, this should result in the dissolution of a large amount of powder and in a change in the observed photocurrent. However, the observed changes in current (<5%) and weight of the film on the substrate (<3.5%; with an average weight of the WO3 film: ∼1.87 mg) were quite low. In order to verify the photochemical stability of the Ti/WO3 photoanode long-term polarization measurements were made. Fig. 11 displays the current density at anodic polarization at 1 Volt vs. NHE. During the measuring time of 10 hours there is a variation of the photocurrent of less than 100 μA. After 6 hours the current density reaches a value of 1.33 mA cm−2 that remains stable until the end of the measurement. During the measurement a gas formation (CO2) could be observed at the photoanode, which is responsible for the repetitive waves in the current density curve.
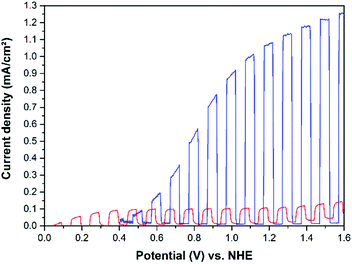
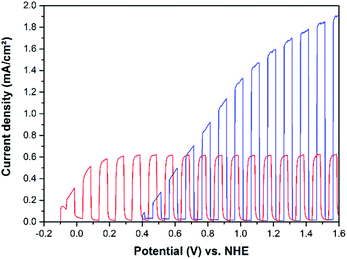
The current–potential curves illustrated in Fig. 10 clearly show that cold sprayed WO3 electrodes exhibit the highest photocurrents for the oxidation of water in acidic electrolytes. The photoelectrochemical performance of the TiO2 photoelectrode is comparably low when no organic compound is available as h+ acceptor in the system. The same trend is observed for the methanol oxidation as shown in Fig. 12. Upon methanol addition to the electrolyte the WO3 on the Ti photoelectrode exhibits the highest activity and the highest absolute increase in the photocurrent density (+0.65 mA cm−2) detected in this work. Nevertheless, the relative increase in photocurrent density for methanol as compared with water oxidation is higher on the TiO2 electrodes as shown in Table 1.
| Electrode | Photocurrent (mA cm−2) | Photocurrent (mA cm−2) with methanol |
|---|---|---|
| WO3 on Ti metal (CS) | 1.25 | 1.90 |
| Increase: +52% | ||
| TiO2 on Ti metal (CS) | 0.14 | 0.63 |
| Increase: +350% | ||
| TiO2 on FTO (SP) | 0.16 | 0.76 |
| Increase: +375% | ||
When comparing the light current curves from Fig. 10 and 12 with those shown in Fig. 6 and 7 it is obvious that cold sprayed WO3 and TiO2 photoelectrodes behave completely different upon illumination. The light currents of the TiO2 photoelectrodes are reaching a stable current density at comparable low potentials, e.g. 0.2 V vs. NHE for methanol oxidation. In contrast, the WO3 photoelectrodes show a photocurrent which is continuously increasing with the applied potential up to 1.6 V vs. NHE.
In both systems that is with and without methanol the photocurrent onset of the TiO2 electrodes is shifted to more negative potentials compared to WO3. Methanol is oxidized by TiO2 with a relatively stable photocurrent density over the entire positive potential region with a photocurrent onset of about −0.1 V vs. NHE. The water oxidation starts about 0.05 V vs. NHE, while the photocurrent onset of the WO3 electrode is about 0.4 V vs. NHE, both for water and for methanol oxidation. The observed photocurrent onsets of around 0.4 V vs. NHE are very consistent with literature values reported for thick and thin film TCO/WO3 photoanodes in acidic media.10,11,21,39 The observed photocurrent onset potentials are slightly more positive than the measured flat-band potentials of the cold sprayed electrodes. They were calculated from Mott–Schottky plots to be EFB = −0.35 ± 0.05 V vs. NHE for Ti/TiO2 and EFB = 0.24 ± 0.04 V vs. NHE for Ti/WO3. The values for the flat-band potentials are similar to reported values obtained by the suspension method, employing redox couples for the estimation of the flat-band potentials. The flat-band potential of TiO2 P25 suspensions were measured employing methylviologen,40 whereas the Cu2+/Cu+ redox couple was used to determine the flat-band potentials of WO3 suspensions.41
Due to the initial increase of the photocurrent density it is estimated that the photocurrent for WO3 in Fig. 12 completely arises from the oxidation of methanol, and not from oxidation of water. The initial slope of the illuminated current curve between 0.4 and 0.6 V vs. NHE for the WO3 photoanode is much higher for the system with methanol (2.05 mA V−1 cm−2) compared to the system without methanol (0.84 mA V−1 cm−2), in good agreement with the fact, that methanol is oxidized more easily than water. The same photocurrent onsets of WO3 electrodes were reported for measurements carried out in sulfuric acid electrolytes in the absence of methanol10,15 and in different acidic electrolytes in the presence of methanol.21,42
Moreover formaldehyde, the main product of the photo-oxidation process of methanol, was monitored by fluorescence spectroscopy with the help of the Nash reagent after measuring chopped light current–potential curves, as displayed in Fig. 12.26,27 The TiO2 cold sprayed photoanode was cycled five times between photocurrent onset and 1.6 V vs. NHE and the WO3 cold sprayed photoanode was also cycled five times between photocurrent onset and 1.6 V vs. NHE for comparable results. After these measurements samples from both electrolytes were analysed. From the fluorescence analysis total amounts of formaldehyde of 0.993 μmol and 1.736 μmol were produced from methanol photo-oxidation by Ti/TiO2 and Ti/WO3 photoanodes, respectively. Considering that the light was regularly chopped on and off during the measurement this leads to formaldehyde production rates of 0.0023 μmol s−1 (Ti/TiO2) and 0.0053 μmol s−1 (Ti/WO3). Additionally, the theoretically produced amounts of formaldehyde were calculated from the area of the anodic currents vs. the time of the measured CLV plots. If assuming, that all measured anodic current arises from the oxidation of methanol to formaldehyde a total amount of formaldehyde of 0.944 μmol and 1.921 μmol should have been produced from methanol photo-oxidation by Ti/TiO2 and Ti/WO3 photoanodes, respectively. The WO3 photoanode produced slightly less formaldehyde (1.736 μmol) than expected from the total anodic current (1.921 μmol). The yield of formaldehyde from photocurrent is above 90%. The additional photocurrent is attributed to the oxidation of formaldehyde and the oxidation of formic acid, as CO2 gas evolution was observed during the long-term experiment in Fig. 11. The TiO2 photoanode produced slightly more formaldehyde (0.993 μmol) than expected from the total anodic current (0.944 μmol). This small difference (±5%) can be addressed to the inaccuracy of both measurements. However, from the analysis of the electrolyte after the measurement it is clear that formaldehyde is the main product of the photo-oxidation of methanol on cold sprayed photoelectrodes.
The displayed results from the photocurrent measurements indicate that methanol oxidation generally occurs more easily on the surface of TiO2 when illuminated with UV light, whereas WO3 is surely the better photocatalyst for water oxidation. This observation is supported by the IPCE spectra shown in Fig. 13 and 14.
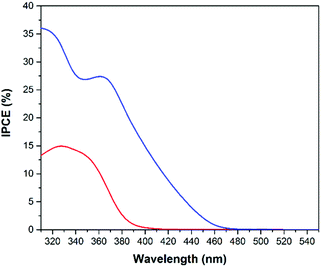
Besides stability and current density, another important property of a suitable photoanode is the ability to absorb as much light from the solar spectrum as possible. The absorption spectra of the powders (Fig. 3) show that compared with TiO2 the absorption edge of WO3 is shifted ∼70 nm towards longer wavelengths. This shift improves the photoelectrochemical efficiency of WO3 for solar light harvesting as displayed in Fig. 13 and 14 by the IPCE spectra. As expected, the IPCE of the photoanodes increased around the absorption edges of 480 and 410 nm for the WO3 and TiO2 materials, respectively. Similar IPCE photoresponses have been reported for WO3 film photoelectrodes.12,39 The presence of two IPCE peaks for the WO3 electrode are explained by the fact that the titanium metal substrate is covered with a thin TiO2 passivation layer on its surface. For a better comparison of the overall photoelectrochemical efficiencies the geometrical areas under the photocurrent efficiency (A W−1) curves (data not shown) were calculated. These absolute values indicate the overall efficiencies of the photoanodes to employ incident photons from solar light irradiation for the desired oxidation processes. They are found to be 8.22 A nm W−1 (Ti/WO3 electrode) and 2.32 A nm W−1 (Ti/TiO2 electrode). In accordance with the observed photocurrents the highest overall water oxidation efficiencies were achieved with the cold sprayed WO3 photoanodes.
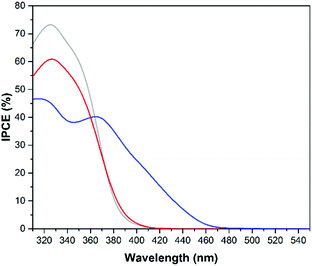
The situation is different when methanol is added to the system as displayed in Fig. 14. The IPCEs clearly show that the catalytic water oxidation occurs more easily at a WO3 surface whereas methanol oxidation occurs more easily on the TiO2 surface. The IPCE data from the screen printed TiO2 on FTO electrode were also added for comparison (light grey). The IPCE of the TiO2 transparent film electrode for methanol oxidation has a maximum of 73% at 325 nm which is around 30% higher than the maximum efficiency of the cold sprayed WO3 electrode. Nevertheless, the overall IPCE for methanol oxidation is still higher on WO3 photoanodes due to the visible light activity of tungsten oxide. The geometrical areas of the photocurrent efficiency curves (data not shown) for methanol oxidation were calculated to be 12.27 A nm W−1, 11.50 A nm W−1, and 9.41 A nm W−1 for the electrodes made of cold sprayed Ti/WO3, screen printed FTO/TiO2, and cold sprayed Ti/TiO2, respectively.
4. Discussion
Time resolved investigations have shown that photogenerated charge carriers in TiO2 recombine within nanoseconds if they are not separated from each other, e.g., by an electric field.41 In a photoelectrochemical cell the driving force for charge carrier separation is provided by the band bending and/or the external bias.44 All photoelectrodes investigated here exhibit a bend bending at the semiconductor–electrolyte interface and another band bending at the metal–semiconductor interface depending on the respective work functions of the metal substrate and the semiconductor film. The latter is of more importance when comparing cold sprayed Ti/TiO2 and Ti/WO3 photoelectrodes with different metal–semiconductor junctions and their effects on the charge carrier recombination rate.As this work has been performed with n-type semiconductors the electron affinities are almost equal to the work functions of the semiconductors. When comparing the cold sprayed electrodes the work function of titanium metal (ΦM = 4.33 eV)34 is constant, but there are differences in the electron affinities of the employed semiconductors. Butler et al. calculated the electron affinities of TiO2 and WO3 to be 4.33 eV and 5.13 eV, respectively.45 For the cold sprayed Ti/TiO2 metal–semiconductor junction a Schottky contact is assumed in the literature.46,47 However, there is almost no barrier at the metal–semiconductor interface (ΔΦ ≈ 0 eV) of Ti/TiO2, rather indicating the presence of an ohmic contact at this junction. For the cold sprayed Ti/WO3 junction a Schottky contact with a barrier height of ΔΦ ≈ 0.8 eV is readily calculated.17 The resulting energy band behaviour is schematically shown in Fig. 15.
However, in an electrochemical device a Schottky barrier generally presents a parasitic resistance to current flow that lowers the performance of the system. Within this work higher photocurrents were found for the Ti/WO3 anode with the expected Schottky junction, as displayed in Fig. 12. An explanation could derive from the high doping level of the WO3 photoelectrode of ND = 4.04 × 1022 cm−3. At high donor densities the depletion layer thickness becomes very small which allows a tunnelling of charge carriers through the junction resulting in high electrical conductivity, equal to that of an ohmic contact. For the TiO2 photoelectrode a lower donor density of ND = 1.43 × 1019 cm−3 was observed.
The effect of metal–semiconductor junctions on the photocatalytic activity has also been discussed in the literature.48,49 Dai et al. investigated the electron transfer of TiO2 films on transparent conductive oxides and metal substrates.48 The observed differences in photocatalytic activities were addressed to the different metal–semiconductor junctions. When an ohmic contact exists between the phases, there is no barrier for the electrons to migrate between the semiconductor and the metal. This interface would lead to a higher charge carrier recombination rate in the semiconductor, because both, electrons and holes can migrate from the metal to the photocatalyst film thus reducing the photocatalytic activity. On the other hand, a high Schottky barrier at the metal–semiconductor surface is promoting the photocatalytic efficiencies by a more effective charge carrier separation due to the band bending. The migration of electrons from the metal to the semiconductor surface is energetically inhibited. Consequently, the lifetime of photogenerated charge carriers is expected to be improved.48,49 Within this work the same trends of the metal–semiconductor junctions have been observed. The measured formaldehyde production rates of 0.0023 μmol s−1 and 0.0053 μmol s−1 were found for Ti/TiO2 and Ti/WO3 photoanodes, respectively.
Nevertheless, the penetration depth of the incident light, the depletion layer width, and the film thicknesses of the photoelectrodes have to be taken into account as well. The optical penetration depths (1/α) in WO3 are about 1 μm at 380 nm, 2.2 μm at 420 nm, and 4.5 μm at 440 nm matching more or less the photoelectrode film thicknesses of 1–10 μm for the cold sprayed and 2.9 μm for the screen printed photoelectrodes.37 The penetration depth of UV light (350 nm) in TiO2 is comparable with 1/α ≈ 2 μm.50 However, like for TiO2,43 the small charge carrier mobility and short charge carrier diffusion length in WO3 will lead to a high recombination rate.17 It is mainly the charge carriers generated within the depletion layer that will contribute to the observed photocurrent. The depletion layer thickness of about 0.75 μm for a WO3 film is comparably small in contrast to the film thicknesses and the optical penetration depths.37 Therefore, the effect of charge carrier separation by bend bending in the metal–semiconductor depletion layer should be rather small because of the thick semiconductor films.51
For (highly doped) n-type semiconductors the flat-band potentials are a direct indication of the conduction band positions.20 Consequently, the conduction band position of the investigated photoanodes are almost equal to the obtained flat-band potentials. By this means the conduction band position of the investigated Ti/TiO2 photoanode is ∼0.59 V more negative than the conduction band of the Ti/WO3 electrode. The difference of the conduction band positions also has an impact on the anodic photocurrent onsets for water and methanol oxidation. A photocurrent can only be measured at the photoanode (WE), if the reduction of H+ takes place simultaneously at the platinum wire cathode (CE). Due to the low conduction band position of WO3 compared to TiO2, there is a need of additional 0.4 V external bias (≈photocurrent onset) to run the overall reaction in the photoelectrochemical cell.
When comparing the substrates FTO glass and Ti metal it has to be taken into account that the latter is not light-transmissive, but at the same time reveals some big advantages such as lower sheet resistance and higher mechanical stability. However, the particle to substrate bonding has to be taken into account because this strongly depends on the employed coating technique. The most important difference between the substrates is the thin passivation layer of TiO2 on the Ti metal surface which can act as a barrier between the photocatalyst and the metal back contact. When the screen printing method is employed for metal substrates the semiconductor powder is homogeneously distributed on the oxide layer of the Ti metal. The nanostructure of the film enables the electrolyte passing to the substrate and thus dissolves the coated film. It was observed that the bonding of screen printed TiO2 particles to FTO glass is electrochemically more stable compared to screen printing on Ti metal as detachment of the particles is hindered. The situation is different when cold spray is used to prepare the photoelectrodes. Within this process semiconductor particles are accelerated to high velocities in the N2 gas stream, shot through the passivation layer of the metal and directly bonded to the substrate (Fig. 1).7,8 The outcome is an improved electrical contact of the photocatalyst particles with the metal back contact and a higher mechanical stability of the semiconductor films compared to the other coating techniques. Consequently, an improved electrical conductivity between semiconductor film and metal substrate will result in higher photoelectrochemical activity.
Moreover, according to the optical properties of the semiconductor films (Fig. 3) the cold sprayed photoelectrodes show the Burstein–Moss effect.29,30 The high amount of oxygen vacancies is responsible for the colour change and might promote the conductivity of the electrode by n-type doping. The thick semiconductor films compared to the penetration depth of the incident light, ensure that all of the light is absorbed by the photocatalyst film and not by the metal back contact.
However, despite of the very practicable preparation method the photoelectrochemical conversion efficiencies of cold spray Ti/WO3 photoanodes still need to be improved to contest with recently published efficiencies of 1–2 μm thin film FTO/WO3 photoanodes measured with comparable parameters. For sol–gel prepared FTO/WO3 photoanodes IPCEs of max. 65% water oxidation efficiency at 400 nm in 1 M H2SO4 and at 1.5 V vs. RHE were reported.52 The photocurrent efficiencies of spin coated FTO/WO3 photoanodes reach a similar IPCE maximum at 360 nm in 0.1 M H2SO4 and at 1.74 V vs. NHE for water oxidation.39 The lower photocurrent efficiencies for the cold sprayed Ti/WO3 photoanodes are attributed to the higher film thickness, as well as to the less nanoporous structure. Nevertheless, it should be mentioned that the reported IPCEs were measured at much higher external potentials compared to this work (1 V vs. NHE). In contrast to other visible light active photoanode materials like α-Fe2O3 the WO3 photoanodes have the advantage of a less anodic photocurrent onset potential.53 Moreover, reported studies of charge carrier dynamics show that for WO3 photoanodes, in contrast to α-Fe2O3 photoanodes, there is no positive effect on the photohole lifetime by applying external bias in water oxidation systems.39,54 Consequently, there is no need of increasing the photohole lifetime in WO3 photoanodes by applying an external bias.
5. Conclusion
In this study TiO2 and WO3 electrodes were fabricated using the cold spray technique. For comparison, additional photoelectrodes of TiO2 P25 were prepared with the screen printing method. The as-prepared electrodes were calcinated at 450 °C in air for 2 h. It has been shown that cold spraying produces mechanically and photoelectrochemical stable films without the need of any additive or binder. Regarding the photoelectrochemically water oxidation activity of the photoanodes, the highest photocurrents were observed for cold sprayed WO3 on titanium metal substrates in the potential range of 0.6–1.6 V vs. NHE. Cold sprayed TiO2 photoelectrodes, on the other hand, displayed better photocurrent onsets and thus higher photoelectrochemical activity in the low potential range from 0.0–0.6 V vs. NHE. When methanol was added to the acidic electrolytes as model pollutant for waste water, all observed current densities further increased upon simulated solar irradiation. Consequently, the application of water purification seems more suitable for the investigated photoanodes.However, the biggest advantage of cold sprayed WO3/Ti compared to cold sprayed TiO2/Ti and screen printed TiO2/FTO was revealed during the incident photon to current efficiency measurements. The absorption edge of WO3 is shifted ∼70 nm to the red, allowing a more efficient harvesting of the total solar light irradiation. Consequently, the photocurrent onset is shifted to longer wavelengths as well, resulting in higher IPCEs in the regime of UVA and visible light (310–780 nm) of +3.50% and +0.47% compared to the most active TiO2 photoelectrode for water and methanol oxidation, respectively. Moreover, it could be shown that the cold spray technique is capable of producing mechanically and chemically stable photoelectrodes that showed longer lifetimes for photoelectrochemical measurements than the laboratory scale screen printed anodes. The results show that cold sprayed tungsten trioxide is a promising material for use as photoanode in photoelectrochemical cells.
Conflicts of interest
There are no conflicts to declare.Acknowledgements
The authors wish to thank Stephanie Melchers for carrying out the SEM measurements and H. C. Starck GmbH for the cooperation in the present study. The authors gratefully acknowledge financial support from the Federal Ministry of Education and Research BMBF (Project “DuaSol” No. 03SF0482C and 03SF0482).References
- A. Fujishima and K. Honda, Nature, 1972, 238, 37 CrossRef CAS PubMed.
- K. Hashimoto, H. Irie and A. Fujishima, Jpn. J. Appl. Phys., 2005, 44, 8269 CrossRef CAS.
- S.-Y. Lee and S.-J. Park, J. Ind. Eng. Chem., 2013, 19, 1761 CrossRef CAS.
- D. Bahnemann, Solar Energy, 2004, 77, 445 CrossRef CAS.
- M. A. Oturan and J.-J. Aaron, Crit. Rev. Environ. Sci. Technol., 2014, 44, 2577 CrossRef CAS.
- J.-O. Kliemann, H. Gutzmann, F. Gärtner, H. Hübner, C. Borchers and T. Klassen, J. Therm. Spray Technol., 2011, 20, 292 CrossRef CAS.
- T. Emmler, H. Gutzmann, P. Hillebrand, M. Schieda, R. Just, F. Gärtner, P. Bogdanoff, I. Herrmann-Geppert and T. Klassen, Proc. SPIE, 2013, 8822, 88220C–882201 CrossRef.
- I. Herrmann-Geppert, P. Bogdanoff, T. Emmler, T. Dittrich, J. Radnik, T. Klassen, H. Gutzmann and M. Schieda, Catal. Today, 2016, 260, 140 CrossRef CAS.
- I. Ivanova, J. Schneider, H. Gutzmann, J.-O. Kliemann, F. Gärtner, T. Klassen, D. Bahnemann and C. B. Mendive, Catal. Today, 2013, 209, 84 CrossRef CAS.
- S. Reinhard, F. Rechberger and M. Niederberger, ChemPlusChem, 2016, 81, 935 CrossRef CAS.
- V. S. Vidyarthi, M. Hofmann, A. Savan, K. Sliozberg, D. König, R. Beranek, W. Schuhmann and A. Ludwig, Int. J. Hydrogen Energy, 2011, 36, 4724 CrossRef CAS.
- R. Liu, Y. Lin, L.-Y. Chou, S. W. Sheehan, W. He, F. Zhang, H. J. M. Hou and D. Wang, Angew. Chem., 2011, 123, 519 CrossRef.
- A. Enesca, A. Duta and J. Schoonman, Thin Solid Films, 2007, 515, 6371 CrossRef CAS.
- F. Amano, D. Li and B. Ohtani, J. Electrochem. Soc., 2011, 158, K42 CrossRef CAS.
- G. Hodes, D. Cahen and J. Manassen, Nature, 1976, 260, 312 CrossRef CAS.
- M. A. Butler, R. D. Nasby and R. K. Quinn, Solid State Commun., 1976, 19, 1011 CrossRef CAS.
- M. A. Butler, J. Appl. Phys., 1977, 48, 1914 CrossRef CAS.
- M. Gratzel, Nature, 2001, 414, 338 CrossRef CAS PubMed.
- C. Wang, R. Pagel, D. W. Bahnemann and J. K. Dohrmann, J. Phys. Chem. B, 2004, 108, 14082 CrossRef CAS.
- D. E. Scaife, Solar Energy, 1980, 25, 41 CrossRef CAS.
- C. Santato, M. Ulmann and J. Augustynski, J. Phys. Chem. B, 2001, 105, 936 CrossRef CAS.
- B. Ohtani, O. O. Prieto-Mahaney, D. Li and R. Abe, J. Photochem. Photobiol., A, 2010, 216, 179 CrossRef CAS.
- S. Ito, P. Chen, P. Comte, M. K. Nazeeruddin, P. Liska, P. Péchy and M. Grätzel, Prog. Photovoltaics, 2007, 15, 603 CAS.
- T. Stoltenhoff, H. Kreye and H. J. Richter, J. Therm. Spray Technol., 2002, 11, 542 CrossRef CAS.
- T. Klassen, F. Gärtner and H. Assadi, in High Pressure Cold Spray: Principles and Applications, ASM International, 2016, p. 17 Search PubMed.
- T. Nash, Biochem. J., 1953, 55, 416 CrossRef CAS PubMed.
- S. B. Jones, C. M. Terry, T. E. Lister and D. C. Johnson, Anal. Chem., 1999, 71, 4030 CrossRef CAS.
- J. Tauc, R. Grigorovici and A. Vancu, Phys. Status Solidi B, 1966, 15, 627 CrossRef CAS.
- E. Burstein, Phys. Rev., 1954, 93, 632 CrossRef CAS.
- T. S. Moss, Proc. Phys. Soc., London, Sect. B, 1954, 67, 775 CrossRef.
- S. Burnside, S. Winkel, K. Brooks, V. Shklover, M. Grätzel, A. Hinsch, R. Kinderman, C. Bradbury, A. Hagfeldt and H. Pettersson, J. Mater. Sci.: Mater. Electron., 2000, 11, 355 CrossRef CAS.
- D. S. Tsoukleris, A. I. Kontos, P. Aloupogiannis and P. Falaras, Catal. Today, 2007, 124, 110 CrossRef CAS.
- J. Tang, J. R. Durrant and D. R. Klug, J. Am. Chem. Soc., 2008, 130, 13885 CrossRef CAS PubMed.
- D. R. Lide, The 84th Edition of the CRC Handbook of Chemistry and Physics, 2004 Search PubMed.
- T. Kawai and T. Sakata, J. Chem. Soc., Chem. Commun., 1980, 80, 694 RSC.
- N. Hykaway, W. M. Sears, H. Morisaki and S. R. Morrison, J. Phys. Chem., 1986, 90, 6663 CrossRef CAS.
- C. Santato, M. Ulmann and J. Augustynski, Adv. Mater., 2001, 13, 511 CrossRef CAS.
- R. Sivakumar, A. Moses Ezhil Raj, B. Subramanian, M. Jayachandran, D. C. Trivedi and C. Sanjeeviraja, Mater. Res. Bull., 2004, 39, 1479 CrossRef CAS.
- V. Cristino, S. Marinello, A. Molinari, S. Caramori, S. Carli, R. Boaretto, R. Argazzi, L. Meda and C. A. Bignozzi, J. Mater. Chem. A, 2016, 4, 2995 CAS.
- W. Macyk, G. Burgeth and H. Kisch, Photochem. Photobiol. Sci., 2003, 2, 322 CAS.
- M. T. Nenadovic, T. Rajh, O. I. Micic and A. J. Nozik, J. Phys. Chem., 1984, 88, 5827 CrossRef CAS.
- W. Li, J. Li, X. Wang, J. Ma and Q. Chen, Int. J. Hydrogen Energy, 2010, 35, 13137 CrossRef CAS.
- D. W. Bahnemann, M. Hilgendorff and R. Memming, J. Phys. Chem. B, 1997, 101, 4265 CrossRef CAS.
- Z. Zhang and J. T. Yates, Chem. Rev., 2012, 112, 5520 CrossRef CAS PubMed.
- M. A. Butler and D. S. Ginley, J. Electrochem. Soc., 1978, 125, 228 CrossRef CAS.
- C. Wang, L. Yin, L. Zhang and R. Gao, J. Phys. Chem. C, 2010, 114, 4408 CAS.
- P. A. Mini, A. Sherine, K. T. Shalumon, A. Balakrishnan, S. V. Nair and K. R. V. Subramanian, Appl. Phys. A, 2012, 108, 393 CrossRef CAS.
- W. Dai, X. Wang, P. Liu, Y. Xu, G. Li and X. Fu, J. Phys. Chem. B, 2006, 110, 13470 CrossRef CAS PubMed.
- J. Freitag and D. W. Bahnemann, ChemPhysChem, 2015, 16, 2670 CrossRef CAS PubMed.
- C. Kormann, D. W. Bahnemann and M. R. Hoffmann, J. Phys. Chem., 1988, 92, 5196 CrossRef CAS.
- K. Yazawa, H. Kamogawa and H. Morisaki, Int. J. Hydrogen Energy, 1979, 4, 205 CrossRef CAS.
- R. Solarska, A. Krolikowska and J. Augustynski, Angew. Chem., Int. Ed., 2010, 49, 7980 CrossRef CAS PubMed.
- K. Sivula, F. Le Formal and M. Grätzel, ChemSusChem, 2011, 4, 432 CrossRef CAS PubMed.
- S. R. Pendlebury, M. Barroso, A. J. Cowan, K. Sivula, J. Tang, M. Grätzel, D. Klug and J. R. Durrant, Chem. Commun., 2011, 47, 716 RSC.
| This journal is © The Royal Society of Chemistry 2017 |


