
 Open Access Article
 This Open Access Article is licensed under a
 Creative Commons Attribution 3.0 Unported Licence
Facile fabrication of a portable PANI-NFs/c-MWCNT nano-composite electrochemical sensor for gefitinib: application to human plasma†
Hadir
Borg
 *abcd,
Fathalla
Belal
c and
Mohammed E.
Draz
d
*abcd,
Fathalla
Belal
c and
Mohammed E.
Draz
d
aInstitute of Physical Chemistry and Electrochemistry, Leibniz Universität Hannover, Callinstraße 3A, 30167, Hannover, Germany. E-mail: hadir.borg@pci.uni-hannover.de
bLaboratory of Nano and Quantum Engineering, Leibniz Universität Hannover, Schneiderberg 39, 30167, Hannover, Germany
cDepartment of Pharmaceutical Analytical Chemistry, Faculty of Pharmacy, University of Mansoura, Mansoura, 35516, Egypt
dDepartment of Pharmaceutical Chemistry, Faculty of Pharmacy, Delta University for Science and Technology, Gamasa, Egypt
First published on 18th October 2022
Abstract
A novel potentiometric solid contact (SC) sensor was developed to determine the anticancer drug gefitinib by employing a polyaniline nanofibers/carboxylated multi-walled carbon nanotube (PANI-NFs/c-MWCNT) nano-composite as an ion to electron transducer. The FDA approved gefitinib as the first line treatment of non-small cell lung cancer (NSCLC) that represents 90% of lung carcinomas. The PANI-NFs/C-MWCNT nano-composite was synthesized and characterized using Fourier transform infrared spectroscopy (FTIR) and transmission electron microscopy (TEM). Twenty-three polyvinyl chloride (PVC) based sensors were fabricated through a systematic approach using different plasticizers and cationic exchangers to investigate their effects on the performance of the developed sensors. The incorporation of calix[8]arene (CX-8) notably enhanced the sensitivity of the developed sensor, confirmed by the docking study. The optimized sensor attained a fast and stable Nernstian slope of 29.14 mV per decade over the concentration range from 1.0 × 10⁻² to 1.5 × 10⁻⁶ M with a LOD of 1.0 × 10⁻⁶ M. The proposed method represents the first potentiometric sensor for GEF assay according to the authors' knowledge. It was validated as per the IUPAC guidelines and efficiently applied to determine GEF in its tablets and human plasma. This encourages quality control, bioavailability, and clinical centers to utilize the portable GEF sensor in its routine analysis.
1. Introduction
Globally, lung cancer represents the primary cause of death among the other types of cancers. Small cell lung cancer (SCLC) and non-SCLC are the main types of lung cancer. NSCLC represents the majority of lung carcinomas by up to 90%.1 The FDA approved gefitinib (GEF), N-(3-chloro-4-fluorophenyl)-7-methoxy-6-(3-morpholin-4-ylpropoxy)quinazolin-4-amine (Fig. S1†) as the first line treatment of NSCLC.2 It is a selective epidermal growth factor tyrosine kinase (EGFR-TK) inhibitor.3 Recently, researchers discovered that the combination of GEF with other chemotherapeutic agents significantly improves both progression-free survival (PFS) and overall survival (OS) in NSCLC.4–6Several methods were reported for the determination of GEF in human body fluids such as HPLC-UV,7 HPLC-MS/MS8,9 and UHPLC-MS/MS10 with the absence of any electrochemical methods for its determination. The reported methods required extensive sample preparation and extraction procedures which significantly affect the certainty of the method and variance of the results. In addition, they need complex instruments, perilous chemicals, well-trained personnel, and extended analysis time, which negatively affect the environment.
In contrast, electrochemical techniques present a brilliant solution for easy and sensitive detection of analytes without prior sample preparations using selective, sustainable, and portable electrochemical sensors.11 Potentiometric ion selective electrodes (ISEs) are considered a good alternative for routine analysis of drugs because they have many merits such as simplicity and cost-effectiveness and do not require sophisticated instrumentation. Moreover, ISEs adopt eco-friendly trends by reducing the reliance on hazardous chemicals and energy consumption.12 Moreover, the above-mentioned desirable characteristics boosted the adoption of ISEs in many biological and medical applications.3
A glassy carbon electrode (GCE) is a good candidate as a solid contact (SC) electrode in electroanalysis because of its good electrical conductivity and low reactivity, and it is not harmful to samples with small volumes,13,14 so many potentiometric studies have employed it as a SC-ISE.15–17
SC-ISEs provide several benefits, but there are also some limitations, including issues with reproducibility, membrane stability, and potential drift due to formation of a water layer at the interface between the solid contact surface and membrane.18 This layer works as an electrolyte reservoir that alters the sample composition and destabilizes the standard potential.18 A hydrophobic electron transducer interlayer such as conducting polymers or carbon nanotubes (CNTs) should be added at this interface to avoid formation of this water layer. Theoretically, SC-ISEs require an electron transducer layer to provide operationally stable potentials.19
The superior position among the conducting polymers has been held by polyaniline (PANI) due to its high conductivity, ease of synthesis, high stability, and good redox reversibility so it has a wide range of interesting applications.20,21 PANI usually suffers from low capacitance and medium hydrophobicity (the water contact angle (WCA) of PANI is usually <90°). The WCA is a measure of hydrophobicity i.e. a larger WCA indicates higher hydrophobicity and superhydrophobic surfaces have WCA >150°.20,22 PANI should be nanostructured or combined with other conducting materials to enhance the hydrophobicity and electrochemical properties.20,22 Recently, preparation of PANI and CNTs as a nanocomposite has received significant attention owing to the synergistic effects of this combination.21
CNTs got significant attention in modification of the electrode surface due to their high conductivity, high mechanical strength, and high specific area.23 Single-walled carbon nanotubes (SWCNTs) and multi-walled carbon nanotubes (MWCNTs) are the main types of CNT.18 MWCNTs manifest important properties over SWCNTs such as huge surface area, high conductivity, ease of chemical modifiability, and their capacity to accelerate the rate of electron transfer on the electrode surface. Thus, they can be utilized either alone or in a nanocomposite combination in the fabrication of sensors and biosensors.23–27 The surface of MWCNTs can be easily modified by certain chemical groups that improve the electrochemical activity, reduce the surface fouling, and ease the polymerization reactions on their surface.28 Carboxylation of the MWCNT surface improves the interaction with PANI and promotes the electrochemical properties of the nanocomposite.29 It was reported that a more planar conformation of PANI was attained when polymerization occurs in the presence of MWCNTs. In addition the electrical conductivity was significantly improved when PANI and MWCNTs were combined as a nanocomposite.29 Furthermore, the surface of the electrode modified with the PANI/c-MWCNTs nanocomposite exhibits super hydrophobicity with a large WCA – may reach to 140° – that prevents water accumulation at the GCE/membrane interface19,21
Herein, the first potentiometric sensor was developed and validated for the determination of GEF in tablets and human plasma samples based on a solid contact glassy carbon electrode coated with polyaniline nanofibers/carboxylated multi-walled carbon nanotube (PANI-NFs/c-MWCNT) nano-composite to enhance its conductivity, stability, and sensitivity to reach the plasma level. Unlike the traditional liquid membrane sensors, the solid contact sensor has improved detection limits and a prolonged lifetime because it eliminates the effect of trans-membrane fluxes of the inner filling solution.30,31
Furthermore, we utilized the benefits of the host-guest chemistry of improved sensitivity and selectivity32 by incorporating different β cyclodextrin and calixarene derivatives in polyvinyl chloride (PVC) cocktail matrices and studied their effects on the sensor performance. Throughout the study, green chemistry regulations were followed to ensure the greenness of the proposed method.
2. Experimental
2.1. Chemicals and reagents
The gefitinib pure material (certified purity of >99.0%) was obtained from Pfizer Inc. (New York, USA). Tetrahydrofuran (THF, ≥99.8% for HPLC), sulfuric acid (95–97%), hydrochloric acid (37%), nitric acid (≥65%), high molecular weight polyvinyl chloride (PVC), ammonium reineckate (ARK, >93.0%), sodium tetraphenylborate (TPB, >99.5%), phosphomolybdic acid hydrate (PM, ACS reagent), phosphotungstic acid hydrate (PT, reagent grade), dibutyl phthalate (DBP, 99.0%), tri-cresyl phosphate (TCP), dioctyl phthalate(DOP, >99.5%), dibutyl sebacate (DBS, >97.0%), (2-hydroxypropyl)-β-cyclodextrin (HP-β-CD), and carboxymethyl-β-cyclodextrin (CM-β-CD) were all purchased from Sigma-Aldrich (Steinheim, Germany). 2-Nitrophenyl phenyl ether (NPPE, 99.0%), 2-nitrophenyl n-octyl ether (NPOE, 98.0%), calix[8]arene (CX-8, 97.0%) and multi-walled carbon nanotubes (MWCNTs) were purchased from Alfa Aesar (Kandel, Germany). β-Cyclodextrin (β-CD, >98%) was purchased from AcrosOrganics (Geel, Belgium). Ammonium persulphate (>98%) was obtained from Loba Chemie Pvt. Ltd. (Mumbai, India). Aniline was obtained from El Nasr Pharmaceutical Chemicals Co. (Cairo, Egypt). All chemicals and reagents were of analytical grade and used without further modification. Ultrapure water (Milli-Q with a resistivity of 18.2 MΩ cm) was used to synthesize and purify PANI-NFs and PANI-NFs/MWCNTs, and double distilled water was used during the study. Iressa® Tablets (LOT# PT177) were purchased from a local pharmacy. Plain pooled human plasma samples were obtained from Mansoura University Hospitals (Mansoura, Egypt) and kept frozen until use after gentle thawing.2.2 Apparatus
A Jenway bench top model 3510 potentiometer (Staffordshire, UK) and a Thermo Orion 900200 Ag/AgCl double junction reference electrode from ThermoFisher Scientific no. 801201-001 (Waltham, USA) were used for potentiometric measurements. A Jenway pH glass electrode no. 924005 was used for pH measurement and a glassy carbon electrode from CH Instruments (Austin, USA) was used as the working electrode. A Nicolet™ iS™ 10 FT-IR Spectrometer from ThermoFisher Scientific was used to record the Fourier transform infrared (FTIR) spectra of MWCNTs, c-MWCNTs, PANI-NFs and PANI-NFs/c-MWCNTs samples in the range of 400–4000 cm−1 (Waltham, USA). A JEOL JEM-2100 transmission electron microscope (TEM) was used to characterize the prepared nano-composite.2.3. Standard solutions
A stock solution containing 0.01 M GEF was prepared by dissolving 0.224 g GEF in 50 mL of 0.01 M acetate buffer pH 3. Serial dilutions were then prepared to obtain different concentrations of GEF in the range from 1.0 × 10⁻³ to 1.0 × 10⁻⁷ M. For the pH study, 1 M NaOH and 1 M HCl solutions were used to change the pH of the studied solutions.2.4. Procedure
![[thin space (1/6-em)]](https://www.rsc.org/images/entities/char_2009.gif) :3 mixture (4 M nitric acid: 10 M sulphuric acid) for 18 hours at room temperature. The mixture was diluted with deionized water and washed four times by filtration through a 0.45 μm millipore membrane filter until neutralized. Finally, the obtained carboxylated MWCNTs (c-MWCNTs) were dried overnight in an oven at 55–60 °C.
:3 mixture (4 M nitric acid: 10 M sulphuric acid) for 18 hours at room temperature. The mixture was diluted with deionized water and washed four times by filtration through a 0.45 μm millipore membrane filter until neutralized. Finally, the obtained carboxylated MWCNTs (c-MWCNTs) were dried overnight in an oven at 55–60 °C.
PANI-NFs were synthesized chemically according to the procedure reported by Bora et al.34 with slight modifications. Two separate solutions of aniline monomers (1.46 mL) and ammonium persulphate (0.913 g) were prepared individually in 50 mL of 1 M HCL. Both solutions were kept at 0–5 °C for 30 minutes before mixing and stirring vigorously for 30 seconds. Finally, the reaction mixture was kept undisturbed at 0–5 °C overnight, washed with deionized water several times and then dried in an oven overnight.
The PANI-NFs/c-MWCNT nano-composite was prepared by in situ polymerization of aniline in the presence of c-MWCNTs.33 According to the same procedure,34 6% w/w of c-MWCNTs was the optimum concentration.
 | (1) |
The potential of each solution was recorded before and after the addition of 1 mL 10−2M GEF and then the following equation was applied:
 | (2) |
The molar concentration of each sample solution (Cx) was calculated by recording the potential difference (ΔE) after the addition of a certain volume of standard solution (Vs) of a known molar concentration (Cs) to a certain volume of sample solution (Vx). S is the slope (mV per decade) of GEF calibration measured directly before the determination. The experiment was repeated six times, and a mean% recovery was obtained.
3. Results and discussion
Chemists are always looking for rapid, simple, and eco-friendly analytical methods to be an excellent alternative to the classical ways that harm the environment and consume our resources. Potentiometric ion selective electrodes (ISEs) provide a perfect opportunity to achieve these goals through the determination of analytes rapidly and efficiently in complex matrices without the need for prior preparation or derivatization steps.15 In this sense, we developed and optimized the first portable electrochemical sensor to assay GEF in pharmaceutical formulations and human plasma samples directly.3.1. Sensor fabrication and optimization
The potentiometric response was mainly controlled by ion exchangers, plasticizers, and ionophores incorporated in the PVC membrane. A plasticized PVC matrix is an ideal candidate for potentiometric sensing due to the network that permits ionic species to move freely in the membrane, thereby promoting membrane conductance.15 We have designed a systematic model described in Fig. 1 and more detail in Table S1† to assess the different factors that contribute directly to the selectivity and sensitivity of the fabricated sensors, such as types and ratios of ion exchangers and plasticizers, the thickness of the membrane, ionophores, and ion to electron transducers. Tailoring the PVC membrane component type and fine-tuning their concentrations can achieve the desired electrode performance. The GCE was used as the electrode support. It is characterized by good conductivity, minimum background current, sufficient rigidity, and a wide potential range.39 The polyaniline (PANI) conducting polymer was chemically deposited34 over the shiny surface of the GCE by drop casting a 20 μL suspension (5 mg mL−1) in water and left to dry for one hour at room temperature. This transducer layer at the GCE/membrane interface enhances conductivity and gives operationally stable potentials.19 Twenty-three different sensors were designed with carefully balanced membrane components, and their performance characteristics were investigated in terms of the slope, linear range, and correlation coefficient. Fig. 1 and Table S1† depict the performance characteristics of the various designed sensors. | ||
| Fig. 1 Systematic study for the performance characteristics (slopes, pLOQ and correlation coefficients) of the developed sensors. | ||
GEF has a basic nature (pKa, 7.5) and therefore ionizes progressively and carries two positive charges as the pH falls.40 So, all optimization processes were performed in acetate buffer pH 3.0 to ensure the cationic bivalency.
Ion exchangers are lipophilic counter-ions confined to the PVC membrane to impart ionic sites into the membrane structure. These ionic sites can improve the sensor perm-selectivity that reduces the interference from oppositely charged ions (Donnan's exclusion effect).41 Furthermore, the conductivity of a plasticized membrane relies mainly on the extent of the mobility of these lipophilic ions.42 In addition, the chosen ion exchangers should have acceptable lipophilicity in the membrane to prevent leaching into the aqueous sample phase, affecting the sensors' longevity.30 They can also improve analyte extraction through the membrane, catalyzing membrane sensitivity.43
The cationic prem-selectivity of the developed sensors was exerted by the addition of four different cationic exchangers, PM, PT, ARK and TPB (sensors 1–4), while adopting TCP as a plasticizer (Table S1†) and (Fig. 1). All of them exhibited the same linear response in the range of 1.23 × 10⁻⁴ to 1 × 10⁻² M GEF. Sensor no. 1, which contained TPB, was selected in further studies because it showed the highest slope and correlation coefficient.
The main constituent of a PVC membrane is the solvent mediator (plasticizer). It generally represents two-thirds of membrane composition. It has a vital dual role; first, it preserves the elasticity of the PVC membrane and prevents its cracking. Second, it solubilizes the lipophilic components of the PVC membrane and ensures high mobility of ions that promotes conductivity. Thus, plasticizer perspiration worsens the performance of the membrane and significantly reduces its lifetime.41 The polarity of the plasticizers influences the selectivity of the sensors. The less polar plasticizers such as DBP or TCP are more selective to monovalent cations, while the highly polar ones such as NPOE or NPPE are more convenient for divalent cations.42
Six plasticizers with various polarities were studied, viz. DBP, TCP, DOP, DBS, NPPE and NPOE (sensors 1 and 5–9) (Table S1,†Fig. 1). The sensors with highly polar plasticizers (NPPE and NPOE) exhibited the best results with a comparable slope of 26.50 and 26.46, respectively. However, sensor no. 7 containing NPOE showed a higher correlation coefficient.
The PVC to plasticizer ratio significantly impacts the degree of salt dissociation and the ionic mobilities and subsequent conductivity of the PVC membrane.42 We investigated two PVC: plasticizer ratios 1:2 and 1:4 (sensors no. 6 and 7 and 10 and 11). In addition, the best results regarding lower quantification limits were obtained using the ratio 1:2 (Table S1†). Increasing the proportion of the plasticizer by employing the ratio 1:4 (sensors no. 10 and 11) leads to deterioration of the potentiometric response, signal drifting, and shortened lifetime of the sensors due to perspiration of the membrane components in the aqueous phase.41
The thickness of the PVC membrane influenced the conductivity and sensitivity of the PVC membrane because these plasticized membranes have similar properties to ionic conductors.44 Hence, the study examined the effect of three membrane thicknesses (80 μm; sensor no. 12, 100 μm; sensor no. 7, and 120 μm; sensor no. 13). The sensor's best performance was achieved using a 100 μm membrane thickness. However, 80 and 120 μm showed lower slope and correlation coefficient values (Table S1†).
Ionophores are considered the molecular recognition sites of the sensors. They can form host–guest electrostatic interactions with the analyte ions, promoting their transfer across the hydrophobic membrane.41 Ionophore-anchored sensors attain high selectivity by forming inclusion complexes between the extracted analytes and ionophores instead of the ion exchanger-anchored sensors that depend entirely on the solvation-free energy of estimated ions in both phases.45 They increase the lipophilicity of the ion exchanger by complexing most of its counter-ions, thus decreasing its exudation into the aqueous phase.46 Therefore, they maintain longevity, enhance sensitivity, and improve response stability.47
The effect of four hosting ionophores: CX-8, β-CD, HP-β-CD and CM-β-CD, on the sensor performance was investigated (Fig. 1 and Table S1,† sensors 14–21). The selected ionophores typically participate in a variety of significant functions. First, they are retained in the sensing membrane due to high lipophilicity. They have several polar functional groups that form a basket shape, accounting for molecular recognition, while the other hydrophobic moieties are congruent with the solvent intermediate.45 Cyclodextrins are considered well-defined molecular receptors because their chemical structure implements an inclusion cavity that can facilitate complexation with a wide range of guest molecules through the formation of hydrogen bonding, van der Waals forces and hydrophobic interactions.48
Calixarenes are an important category of host molecules because they can be easily amended and widely utilized in supramolecular chemistry. They are known as ‘macrocycles with infinite possibilities'.49 They form a cup-like structure with a polar cavity that accommodates more interactions than cyclodextrins.15 They bind with the guest ions through various interactions such as π–π, electrostatic interactions and cation–π, and hydrogen bonding, making them unique scaffolds for cation receptors.50 Each ionophore was investigated for two ratios (1:1 and 2:1) regarding the TPB ion exchanger with 100 μm membrane thickness and NPOE as the plasticizer (Table S1,† sensors 14–21). The best performance was achieved using sensor no. 18, which incorporated CX-8 with a ratio of 2:1 CX-8: PT (Table S1† and (Fig. 1).
The results were confirmed by docking the least energetic conformer of GEF into the cavity of CX-8 using the Auto Dock and PyMOL software. The docking results illustrated that GEF was well fitted into the CX-8 cavity, as indicated by the relatively low docking score (S = −5.09), which proved a highly stable complex.51,55 In addition, CX-8 forms hydrogen bonding with GEF, stabilizing the inclusion complex, as shown in Fig. 2.
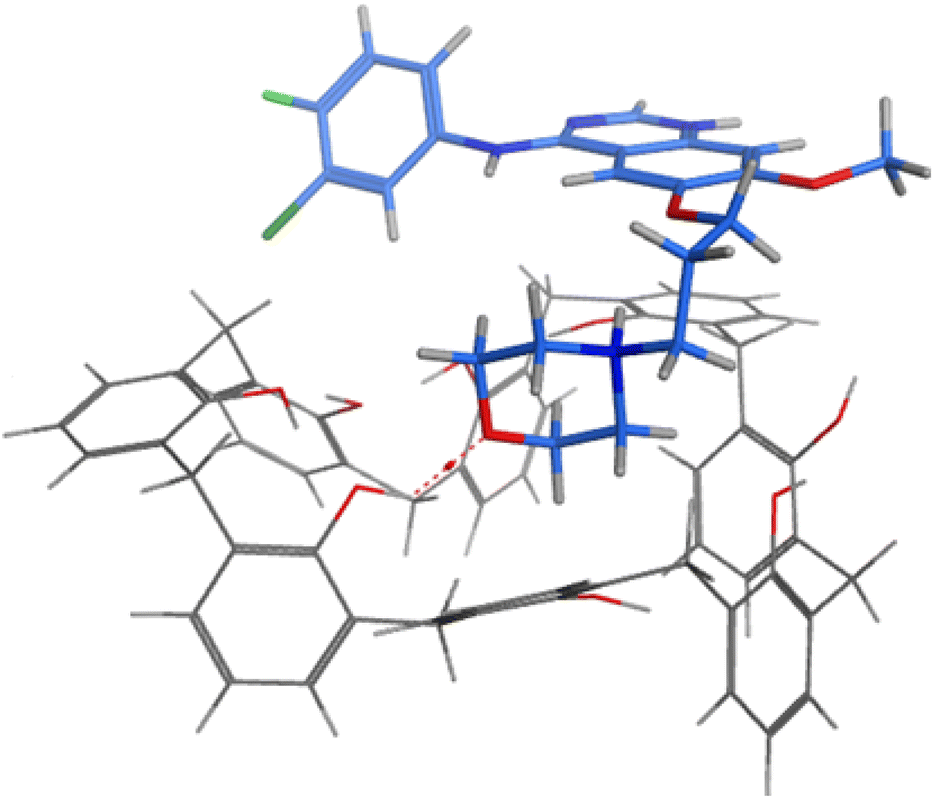 | ||
| Fig. 2 3D docking of gefitinib (in blue color) bonded with a hydrogen bond (dashed red color) in the cavity of calix[8]arene (in grey color). | ||
Adopting nanomaterials like PANI-NFs and MWCNTs as ion to electron transducers considerably enhances the development of SC-ISEs. They promote resilience and miniaturization and lead to the development of entirely calibration-free sensors.52 Incorporating ion to electron transducer materials increases the electrical signals' stability, decreases the potential drift, and enhances the reproducibility of the potentiometric response due to their superb chemical and electrical properties.53 The hydrophobicity of these materials prevents or reduces the formation of an aqueous layer at the electrode/membrane interface. This water film's presence irreversibly worsens the sensors' potential stability and sensitivity because they act as reservoirs for primary ions that diffuse throughout the conditioning and may leach into the dilute sample during the measurements. The sustained growth of the water film may lead to the delamination of the sensing membrane and destroy the sensors.52 The nanostructured nature of PANI-NFs and MWCNTs provides a large surface area to the sensing membrane, which develops a large double capacitance layer that promotes the ion to electron transduction process – leading to a short response time – and stabilizes the potential.53 They act as an asymmetric capacitor with electrons (holes) in the walls of MWCNTs or through the polymer chain in the PANI-NFs on one side and the primary ions of the sensing membrane on the other side.53 The performance of the developed sensors was evaluated by deposition of different ions onto the electron transducers such as the PANI conducting polymer (Table S1,† sensors 1–21), c-MWCNTs (Table S1,† sensor 22), and PANI-NFs/c-MWCNT nano-composite (Table S1,† sensor 23) over the surface of the GCE before depositing the PVC sensing membrane. The PANI-NFs were chemically synthesized over the prepared c-MWCNTs to form the nano-composite PANI-NFs/c-MWCNTs, as mentioned in Section 2.4.1. TEM images and FT-IR spectra showed and confirmed the steps of formation of the PANI-NFs/c-MWCNT nano-composite (Fig. 3 and 4). Modifying the GCE with the PANI-NFs/c-MWCNT nano-composite (sensor no. 23) relatively enhances the slope, sensitivity, and correlation coefficient, as shown in (Fig. 1) and (Table S1†). The obtained results encourage the analysts to adopt the PANI-NFs/c-MWCNT nano-composite as an ion to electron transducer for the GCE.
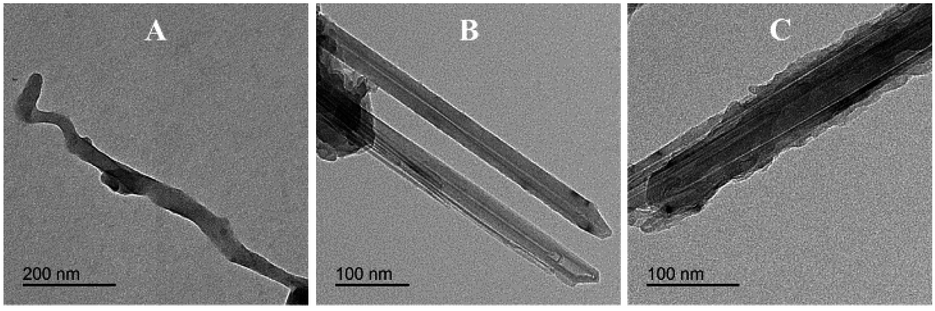 | ||
| Fig. 3 TEM images of (A) polyaniline nanofibers (PANI-NFs). (B) Carboxylated multi-walled carbon nanotubes (c-MWCNTs). (C) Polyaniline nanofibers/carboxylated multi-walled carbon nanotubes (PANI-NFs/c-MWCNTs). | ||
 | ||
| Fig. 4 FT-IR spectra of (a) MWCNTs, (b) c-MWCNTs, (c) PANI-NFs and (d) PANI-NFs/c-MWCNTs. | ||
Ultimately, the optimized sensor was fabricated using TPB as a cation exchanger, NPOE as a plasticizer and CX-8 as an ionophore with a 100 μm thick PVC membrane deposited over the GCE modified in advance with the PANI-NFs/c-MWCNT nano-composite. The developed sensor exhibited a Nernstian response for GEF with a sufficiently low LOD of 1.0 × 10⁻⁶ M to determine GEF in plasma (Fig. S2†).
3.2. Effect of pH
A pH study was performed on the optimized sensor 23 (pH range 2–10) to evaluate its response at two concentrations of GEF, 1 × 10⁻³ and 1 × 10⁻² M GEF. A stable response was observed over the pH range of 2.5–5. The sensor's response was gradually decreased at pH >5 due to the formation of a GEF-free base. Also, the response is greatly affected at pH <2.5 due to the interference of hydronium ions, as shown in (Fig. 5).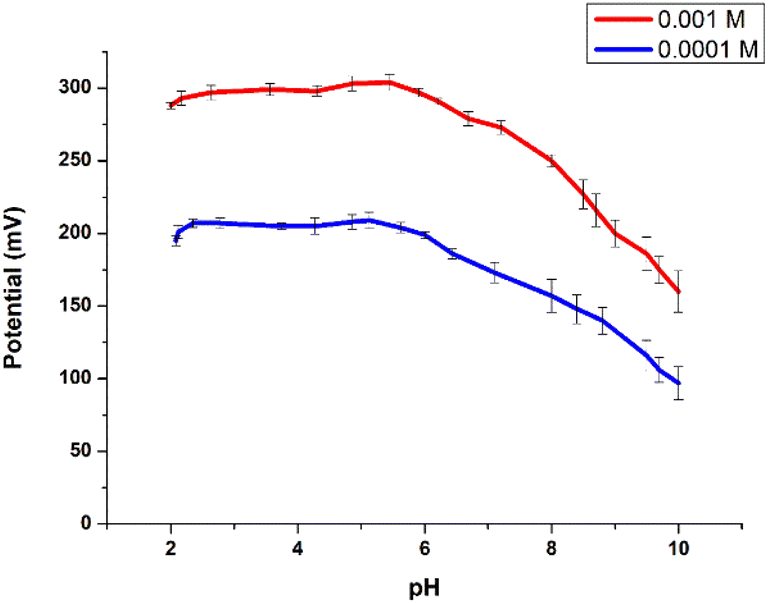 | ||
| Fig. 5 The potential-pH profile for 0.0001 and 0.001 M GEF standard solutions. | ||
3.3. Dynamic response time and the lifetime of the sensor
The dynamic response time curve is an essential parameter for ISE characterization because it determines the time consumed to establish the sensor's equilibrium potential and response stability. The dynamic response time of the optimized sensor was evaluated using IUPAC guidelines36 through a regular change of the GEF concentration and monitoring the time required to reach a stable response. The sensor reaches the equilibrium potential within 6 ± 1 second after each concentration change and becomes stable within ±1 mV (Fig. 6). The lifetime (storage stability) of the optimized sensor was assessed by repeating the calibration curve weakly under normal operational conditions and calculating the slope each time. The optimized sensor exhibited a steady slope ±1 mV per decade for 30 days. After this period, a significant decrease in the slope was noted. The sensor was reserved in 1 × 10⁻² M GEF standard solution when not in use. | ||
| Fig. 6 Dynamic response curve of the optimized sensor no. 23. | ||
3.4. Sensor selectivity
A separate solution method35 was employed to study the effect of commonly interfering substances encountered in tablet additives and physiological fluids on the performance of the proposed sensor. Table S2† shows the calculated selectivity coefficients KPotGEF,I values. The results indicated that the proposed sensor demonstrated sufficient selectivity for GEF rather than for other interferants. This may be due to incorporating CX-8 into the membrane sensor that facilitates GEF's penetration rather than other species.3.5. Method validation
According to ICH recommendations,54 validation parameters were calculated and are illustrated in Table 1. Different concentrations of standard GEF were determined using the developed sensor to assess the linearity, then the calibration graph was plotted (Fig. S2†), and the linear regression equation was computed. The correlation coefficient value was close to unity, expressing good linearity, as shown in Table 1. Three different concentrations (1.1 × 10⁻³, 1.2 × 10⁻⁴ and 1.3 × 10⁻⁵ M) within the linearity range of GEF were determined and then the % recoveries were calculated from the corresponding regression equation. Acceptable% recoveries and SD values were obtained, indicating good accuracy (Table 1). The precision of the developed method was assessed by analyzing the previous concentrations thrice on the same day to determine the repeatability and on three successive days to evaluate the intermediate precision. In addition, good % recoveries and RSD values were attained, as shown in Table 1. Furthermore, the limit of detection (LOD) was estimated at the intersection mark of the extrapolated line of the calibration curve as it complies with IUPAC recommendations.36 Finally, the developed sensor manifests a remarkably low concentration, as shown in .| Parameter | Optimized sensor responsea | |
|---|---|---|
| a Average of five determinations. b % RSD for the recovery of three different concentrations, repeated thrice within the same day. c % RSD for the recovery of three different concentrations, repeated thrice in three successive days. d Limit of detection calculated according to the IUPAC guidelines. | ||
| Concentration range (mol L−1) | 1.0 × 10⁻² to 1.5 × 10⁻⁶ | |
| Linearity | Slope | 29.14 |
| Intercept | 321.08 | |
| Correlation coefficient | 0.9990 | |
| Accuracy (mean ± SD) | 99.76 ± 0.76 | |
| Precision (RSD%) | Repeatabilityb | ±0.44 |
| Intermediate precisionc | ±1.09 | |
| LODd (mol L−1) | 1.0 × 10⁻⁶ | |
| Response time (s) | 6 | |
| Working pH range | 2.5–5 | |
| Lifetime (days) | 30 | |
3.6. Potentiometric determination of GEF in commercial tablets
The proposed sensor was successfully applied for the potentiometric determination of GEF in its tablet dosage form. GEF was extracted and measured in 0.01 M acetate buffer at pH 3. The percent recovery shown in Table 2 is the average of the results of six different samples. According to the ICH recommendations,54 the proposed method can determine GEF in its tablet dosage form with an acceptable % recovery.| Dosage form | Taken (mol L−1) | Founda (mol L−1) | Amount of standard added (mol L−1) | Found (mol L−1) | % recoverya | % RSD |
|---|---|---|---|---|---|---|
| a Results are average of six measurements. | ||||||
| Iressa® tablet | 1.00 × 10⁻³ | 0.99 × 10⁻³ | — | — | 99.62 | ±4.01 |
| 1.96 × 10⁻⁴ | 1.93 × 10⁻⁴ | 98.41 | ±0.65 | |||
| 3.77 × 10⁻⁴ | 3.81 × 10⁻⁴ | 101.04 | ±0.92 | |||
| 5.36 × 10⁻⁴ | 5.35 × 10⁻⁴ | 99.89 | ±0.82 | |||
3.7. Potentiometric determination of GEF in human plasma
The proposed sensor was also successfully applied to determine GEF directly in spiked human plasma samples without prior extraction or sample pretreatment steps. The results (Table 3) show that the proposed sensor can determine GEF in spiked human plasma over a wide concentration range with satisfactory % recovery and RSD values.4. Conclusions
The presented study developed and validated the first electrochemical sensor to determine one of the most frequently prescribed anticancer drugs, GEF, in its pharmaceutical formulation and plasma. The potentiometric solid contact sensor was fabricated using TPB as a cationic exchanger and NPOE as a plasticizer. The optimized sensor employed the PANI-NFs/c-MWCNT nano-composite as an ion to electron transducer to enhance long-term stability, sensitivity, and fast response by preventing water layer accumulation at the PVC/GCE interface and speeding up the ion to electron transduction process. The host–guest supramolecular chemistry was exploited to enhance the selectivity and sensitivity by incorporating CX-8 as an ionophore. GEF is well fitted in the cavity of CX-8 through hydrogen bonding, confirmed by the docking study. The proposed potentiometric method presents a very simple design and green approach with no need of sample preparation, complex instrumentation, or qualified personnel. Thanks to the advantages provided by ISEs, the proposed method can effectively face the other time-consuming, expensive, and sophisticated methods for the routine analysis of GEF in quality control laboratories, pharmacokinetics, and clinical aspects studies.Author contributions
Conceptualization, F. B. and M. E. D.; methodology, M. E. D.; validation, H. B.; formal analysis, H. B. and M. E. D.; investigation, H. B.; resources, F. B. and M. E. D.; writing—original draft preparation, H. B.; writing—review and editing, M. E. D. and F. B.; supervision, F. B. and M. E. D.; funding acquisition, F. B. All authors have read and agreed to the published version of the manuscript.Conflicts of interest
The authors declare no conflict of interest.Acknowledgements
This work was financially supported by the fund offered by Mansoura University, Mansoura, Egypt. The code number of the project: Mu-pharm-18-7. Open access funding enabled and organized by Projekt DEAL.Notes and references
- J. R. Molina, P. Yang, S. D. Cassivi, S. E. Schild and A. A. Adjei, Mayo Clin. Proc., 2008, 83, 584–594 CrossRef PubMed.
- European Pharmacopoeia, European directorate for the quality of medicines & healthcare (EDQM), Strasbourg 2013 Online version, Council of Europe, Strasbourg, 7th edn, 2013 Search PubMed.
- A. F. M. M. Rahman, H. M. Korashy and M. G. Kassem, in Profiles of Drug Substances, Excipients and Related Methodology, Elsevier, London, 2014, vol. 39, pp. 239–264 Search PubMed.
- Q. Zhao, K. Sun, X. Lei and L. Cai, Medicine, 2020 Search PubMed.
- Y. Lou, J. Xu, Y. Zhang, J. Lu, T. Chu, X. Zhang, H. Wang, H. Zhong, W. Zhang and B. Han, Target. Oncol., 2020, 1–10 Search PubMed.
- Y. Hosomi, S. Morita, S. Sugawara, T. Kato, T. Fukuhara, A. Gemma, K. Takahashi, Y. Fujita, T. Harada and K. Minato, J. Clin. Oncol., 2020, 38, 115–123 CrossRef CAS PubMed.
- H. Borg, D. Zámbó, H. Elmansi, H. M. Hashem, J. J. Nasr, M. I. Walash, N. C. Bigall and F. Belal, Nanomaterials, 2020, 10, 1196 CrossRef CAS PubMed.
- M. Zhao, C. Hartke, A. Jimeno, J. Li, P. He, Y. Zabelina, M. Hidalgo and S. D. Baker, J. Chromatogr. B: Anal. Technol. Biomed. Life Sci., 2005, 819, 73–80 CrossRef CAS PubMed.
- S. Guan, X. Chen, F. Wang, S. Xin, W. Feng, X. Zhu, S. Liu, W. Zhuang, S. Zhou and M. Huang, J. Pharm. Biomed. Anal., 2019, 172, 364–371 CrossRef CAS PubMed.
- Y. Lv, Y. Sun, J. Fu, L. Kong and S. Han, Biomed. Chromatogr., 2017, 31, e3806 CrossRef PubMed.
- K. Dziąbowska, E. Czaczyk and D. Nidzworski, in Biosens. Technol. Detect. Pathog. A Prosp. Way Rapid Anal, Books on Demand, Germany, 2018 Search PubMed.
- X. Zhang, H. Ju and J. Wang, Electrochemical Sensors, Biosensors and Their Biomedical Applications, Academic Press, London, 2011 Search PubMed.
- Y. Yi, G. Weinberg, M. Prenzel, M. Greiner, S. Heumann, S. Becker and R. Schlögl, Catal. Today, 2017, 295, 32–40 CrossRef CAS.
- J. Reedijk and K. Poeppelmeier, in V1 Main-Group Elem., Incl. Noble Gases V2 Transition Elem., Lanthanides and Actinides V3 Bioinorganic Fundam. and Appl.: Metals in Nat. Living Syst. and Metals in Toxicology and Med. V4 Solid-State Mater., Incl. Ceramics and Minerals V5 Porous Mater., Elsevier Ltd., 2013, pp. 1–7196 Search PubMed.
- M. E. Wahba, D. El Wasseef, A. S. Saad and M. E. Draz, RSC Adv., 2021, 11, 12833–12844 RSC.
- J. Lenik and J. Nieszporek, Sens. Actuators, B, 2018, 255, 2282–2289 CrossRef CAS.
- M. E. Draz, H. W. Darwish, I. A. Darwish and A. S. Saad, Food Chem., 2021, 346, 128911 CrossRef CAS PubMed.
- M. A. Tantawy, H. A. El Fiky, A. M. Badawey, M. F. Abd El Ghany and N. V. Fares, J. Electrochem. Soc., 2021, 168, 056506 CrossRef CAS.
- E. Zdrachek and E. Bakker, Anal. Chem., 2018, 91, 2–26 CrossRef PubMed.
- N. Parveen, N. Mahato, M. O. Ansari and M. H. Cho, Composites, Part B, 2016, 87, 281–290 CrossRef CAS.
- A. Madhan Kumar and Z. M. Gasem, Prog. Org. Coatings, 2015, 78, 387–394 CrossRef CAS.
- H. Ding, C. Zhu, Z. Zhou, M. Wan and Y. Wei, Macromol. Rapid Commun., 2006, 27, 1029–1034 CrossRef CAS.
- Ö. S. Bölükbaşı, B. B. Yola, H. Boyacıoğlu and M. L. Yola, Food Chem. Toxicol., 2022, 163 DOI:10.1016/j.fct.2022.112994.
- N. Özcan, H. Medetalibeyoglu, O. Akyıldırım, N. Atar and M. L. Yola, Mater. Today Commun., 2020, 23, 1–9 Search PubMed.
- N. Özcan, C. Karaman, N. Atar, O. Karaman and M. L. Yola, ECS J. Solid State Sci. Technol., 2020, 9, 121010 CrossRef.
- M. L. Yola and N. Atar, Anal. Bioanal. Chem., 2021, 413, 2481–2492 CrossRef CAS PubMed.
- M. L. Yola, N. Atar and N. Özcan, Nanoscale, 2021, 13, 4660–4669 RSC.
- M. A. Mohamed, A. S. Saad, S. H. Koshek and M. R. El-Ghobashy, New J. Chem., 2018, 42, 9911–9919 RSC.
- S. B. Kondawar, M. D. Deshpande and S. P. Agrawal, Int. J. Compos. Mater., 2012, 2, 32–36 Search PubMed.
- H. M. A. Shawish, A. M. Khedr, K. I. Abed-Almonem and M. Gaber, Talanta, 2012, 101, 211–219 CrossRef PubMed.
- S. Mathison and E. Bakker, Anal. Chem., 1998, 70, 303–309 CrossRef CAS.
- A. S. Saad and H. M. Essam, Electroanalysis, 2019, 31, 2224–2231 CrossRef CAS.
- T. M. Le Hoa, Diam. Relat. Mater., 2018, 89, 43–51 CrossRef.
- A. Bora, K. Mohan, D. Pegu, C. B. Gohain and S. K. Dolui, Sens. Actuators, B, 2017, 253, 977–986 CrossRef CAS.
- C. Fry and S. Langley, Ion-selective Electrodes for Biological Systems, CRC Press, Florida, USA, 2002 Search PubMed.
- Y. Umezaw, P. Buhlmann, K. Umezawa, K. Tohda and S. Amemiya, Pure Appl. Chem., 2000, 72, 1851–2082 CrossRef.
- D. A. Skoog, D. M. West, F. J. Holler and S. R. Crouch, Fundamentals of Analytical Chemistry, Cengage learning, Belmont, USA, 9th edn, 2013 Search PubMed.
- E. W. Baumann, Anal. Chim. Acta, 1968, 42, 127–132 CrossRef CAS.
- A. S. Saad, N. S. Ismail, N. S. Gaber and E. S. Elzanfaly, J. Electrochem. Soc., 2021, 168, 17504 CrossRef CAS.
- M. H. Cohen, G. A. Williams, R. Sridhara, G. Chen, W. D. McGuinn, D. Morse, S. Abraham, A. Rahman, C. Liang, R. Lostritto, A. Baird and R. Pazdur, Clin. Cancer Res., 2004, 10, 1212–1218 CrossRef CAS PubMed.
- E. Bakker, P. Bühlmann and E. Pretsch, Chem. Rev., 1997, 97, 3083–3132 CrossRef CAS PubMed.
- R. D. Armstrong and G. Horvai, Electrochim. Acta, 1990, 35, 1–7 CrossRef CAS.
- E. M. G. Santos, A. N. Araújo, C. M. C. M. Couto and M. C. B. S. M. Montenegro, J. Pharm. Biomed. Anal., 2006, 42, 535–542 CrossRef CAS PubMed.
- A. S. Saad, I. A. Naguib, M. E. Draz, H. E. Zaazaa and A. S. Lashien, J. Electrochem. Soc., 2018, 165, H764–H769 CrossRef CAS.
- E. Bakker, in Encyclopedia of Analytical Sciences, Elsevier, 2nd edn, 2005, pp. 509–514 Search PubMed.
- M. Telting-Diaz and E. Bakker, Anal. Chem., 2001, 73, 5582–5589 CrossRef CAS PubMed.
- P. Bühlmann and L. D. Chen, Supramol. Chem., 2012 DOI:10.1002/9780470661345.smc097.
- M. T. Ragab, M. K. Abd El-Rahman, N. K. Ramadan, N. A. El-Ragehy and B. A. El-Zeany, Talanta, 2015, 138, 28–35 CrossRef CAS PubMed.
- M. K. Abd El-Rahman and A. M. Mahmoud, RSC Adv., 2015, 5, 62469–62476 RSC.
- L. Baldini, F. Sansone and A. Casnati, Cation Complexation by Calixarenes, Elsevier Inc., 2013 Search PubMed.
- M. A. Mansour, A. M. AboulMagd and H. M. Abdel-Rahman, RSC Adv., 2020, 10, 34033–34045 RSC.
- Y. Shao, Y. Ying and J. Ping, Chem. Soc. Rev., 2020, 49, 4405–4465 RSC.
- A. M. Mahmoud, M. K. A. El-rahman, M. R. Elghobashy and M. R. Rezk, J. Electroanal. Chem., 2015, 755, 122–126 CrossRef CAS.
- Eur. Agency Eval. Med. Prod. Int. Comm. Harmon. Switz.
- M.E. Draz, I.A. Naguib and A.S. Saad, J. Electroanal. Chem., 2021 DOI:10.1016/j.jelechem.
Footnote |
| † Electronic supplementary information (ESI) available. See DOI: https://doi.org/10.1039/d2ay01426b |
| This journal is © The Royal Society of Chemistry 2022 |