
The influence of chemical degradation during dietary exposures to fish on biomagnification factors and bioaccumulation factors†
Jon A.
Arnot
 *ab and
Donald
Mackay
c
*ab and
Donald
Mackay
c
aARC Arnot Research and Consulting, 36 Sproat Ave., Toronto, ON M4M 1W4, Canada. E-mail: jon@arnotresearch.com
bDepartment of Physical & Environmental Sciences, University of Toronto Scarborough, 1265 Military Trail, Toronto, ON M1C 1A4, Canada
cChemical Properties Research Group, Department of Chemistry, Trent University, Peterborough, ON K9L 0G3, Canada
First published on 22nd December 2017
Abstract
The chemical dietary absorption efficiency (ED) quantifies the amount of chemical absorbed by an organism relative to the amount of chemical an organism is exposed to following ingestion. In particular, ED can influence the extent of bioaccumulation and biomagnification for hydrophobic chemicals. A new ED model is developed to quantify chemical process rates in the gastrointestinal tract (GIT). The new model is calibrated with critically evaluated measured ED values (n = 250) for 80 hydrophobic persistent chemicals. The new ED model is subsequently used to estimate chemical reaction rate constants (kR) assumed to occur in the lumen of the GIT from experimental dietary exposure tests (n = 255) for 165 chemicals. The new kR estimates are corroborated with kR estimates for the same chemicals from the same data derived previously by other methods. The roles of kR and the biotransformation rate constant (kB) on biomagnification factors (BMFs) determined under laboratory test conditions and on BMFs and bioaccumulation factors (BAFs) in the environment are examined with the new model. In this regard, differences in lab and field BMFs are highlighted. Recommendations to address uncertainty in ED and kR data are provided.
Environmental significanceBiotransformation is a key process mitigating bioaccumulation; however, there are significant knowledge gaps in the extent of chemical biotransformation in biota and the environment and hence significant uncertainty in chemical evaluations. We have developed a new model for simulating chemical uptake efficiencies into fish following dietary exposure and calibrated and evaluated this model with evaluated experimental measurements. Further, we have derived a new database of chemical primary transformation rate constants corresponding to the dietary exposure pathway. We have incorporated the new dietary absorption efficiency model into commonly used fish bioaccumulation models to demonstrate the impact of chemical transformation rates on bioaccumulation factors (BAFs) and biomagnification factors (BMFs). Finally, we have compared lab simulations for BMFs with field simulations for BMFs highlighting key differences when considering these different BMFs for decision-making. We believe the new model, database and findings are broadly applicable and will provide valuable insights for interpreting and applying bioaccumulation data for contaminant assessment and management. |
1. Introduction
Bioaccumulation data are used for chemical hazard, exposure and risk assessment.1–4 For hydrophobic organic chemicals in the aquatic environment dietary exposures can be the dominant route of exposure to fish,5 particularly for persistent chemicals.6,7 Chemicals with octanol–water partition coefficients (KOW; unitless) greater than about 105 are shown to have biomagnification potential in fish and aquatic food webs in the absence of biotransformation;8,9 however, biotransformation rates are a key determining factor of actual bioaccumulation in fish10–13 and food webs.14–16 Chemical degradation processes in the lumen and epithelial tissues of the gastrointestinal tract (GIT) are recognized17–23 and can also mitigate bioaccumulation in fish.24,25 Degradation rate data in the GIT and models for incorporating this information have the potential to improve model predictions for chemical assessments and to provide mechanistic insights into bioaccumulation processes.The chemical dietary absorption efficiency (ED or AE or α; unitless) quantifies the amount of chemical absorbed by the organism relative to the amount of chemical the organism is exposed to in the GIT following ingestion.26,27 The absorption efficiency can be determined from dietary bioaccumulation experiments such as the Organization for Economic Coordination and Development (OECD) 305 test guideline27 and is a parameter in bioaccumulation and toxicokinetic models for fish.26,28–34 Empirical models for ED have been developed from regressions of measured ED against KOW for persistent organic pollutants (POPs) in various species.35–38 These empirical models are commonly applied in bioaccumulation34,39 and exposure models.40,41 Empirical KOW–ED models for persistent chemicals do not account for possible degradation rates in the GIT that can occur for non-persistent chemicals following dietary ingestion. Databases of ED for fish have been developed.34,42 Models for including and estimating rates of chemical degradation in the GIT (kR or kGM; h−1) have been developed.24,25,43 Previous modelling work has explored the role of kR on lab BCFs and lab BMFs for a few select chemicals,24 but not environmentally relevant field BAFs and BMFs in which organisms are co-exposed to chemical in the water and the diet simultaneously. Models can be used to extrapolate laboratory data to field conditions;44 however, comparisons of measured and modelled lab and field BMFs are limited.
In this study we develop, parameterize and apply a new model to quantify chemical processes in the GIT to estimate ED and kR. The new ED model is first presented and then calibrated and evaluated with measured ED data for POPs and is compared with other empirical models for fish. The mechanistic nature of the model is exploited to estimate kR for chemicals that have been subject to experimental testing following similar methods as the calibration dataset. The new estimates of kR are compared to existing kR estimates derived from other methods for the same chemicals. The new ED model is incorporated into bioaccumulation models to explore the role of chemical degradation in the GIT on lab and field BMFs and field BAFs.
2. Methods
2.1 Theory and terminology
Bioaccumulation assessment endpoints discussed in this study are presented in the ESI-1.† The models described below are expressed in terms of chemical fugacity. Briefly, fugacity (f; Pa) describes the escaping tendency of a chemical in a particular phase45 or compartment such as the GIT. The fugacity capacity (Z; mol Pa−1 m−3) quantifies the capacity of a particular phase to store a chemical under defined conditions. The relationship between chemical concentration (C; mol m−3) and f is a function of Z as C = fZ. Transport processes in fugacity terms are expressed by D values (mol Pa−1 h−1) that are analogous to conventional rate constants (k; h−1). Chemical flux (N; mol h−1) is then a product of f and D. Characteristic times τ (h) are 1/k or VZ/D, where V is the volume of the compartment (m3).The ED parameter quantifies chemical transfer from the GIT to the blood (hepatic portal vein) and the oral bioavailability parameter (F; dimensionless) quantifies chemical transfer from the GIT to systemic circulation following chemical transport and potential biotransformation in the liver. If chemical degradation rates in the GIT and liver are negligible relative to other rates in the GIT and the liver, ED and F are equivalent values. For chemicals subject to sufficient biotransformation in the liver and/or degradation in the lumen or tissues of the GIT, F will be less than ED. Historically most fish dietary bioaccumulation testing has been conducted with POPs such as polychlorinated biphenyls (PCBs). While ED is a satisfactory descriptor for both absorption and oral bioavailability for persistent chemicals (i.e., chemical transformation reaction rates are negligible in the lumen of the GIT, perfused GIT tissue, liver and other compartments), F is a more appropriate description for “ED data” reported in the literature for chemicals that are subject to degradation and transformation before systemic circulation.
Fig. 1 illustrates a series of conceptual models that can be formulated into mathematical expressions to quantify chemical transport in an organism following dietary exposure. The different models reflect different objectives and the knowledge required to reliably quantify these processes. Fig. 1A represents a model in which the organism and the GIT are considered to be a single compartment with a common fugacity fWB to which a single reaction loss rate is applicable (e.g., NRWB; mol h−1). The ED parameter is included in the dietary uptake rate (ND) and the egestion rate (NE) equations in these models. The model described in Fig. 1B separates the lumen of the GIT from the rest of the body. Different fugacities can apply to each compartment fF and fG and there are two reaction loss rates for each compartment. In this two-compartment model ED is NGF/ND. Significant reactive loss in the GIT compartment (NRG) reduces the flux of chemical into the fish (NGF) and hence lowers ED from its potential value in the absence of reaction. Fig. 1C illustrates a further refined model in which the liver is considered as a separate compartment from the rest of the body and there is one fugacity for each compartment: fF, fG, fL. Multi-compartment physiologically-based pharmacokinetic models (PBPK), e.g., ref. 46–49, further separate the body into additional anatomical compartments such as the kidney, gill, muscle, adipose, etc. The model in Fig. 1C and PBPK models allow for possible first-pass effects in which the chemical is biotransformed in the liver after absorption from the GIT before systemic circulation. In the three-compartment model ED is NGL/ND and F is NLF/ND. Significant reactive loss in the GIT compartment (NRG) or the liver (NRL) reduces the flux of chemical into systemic circulation.
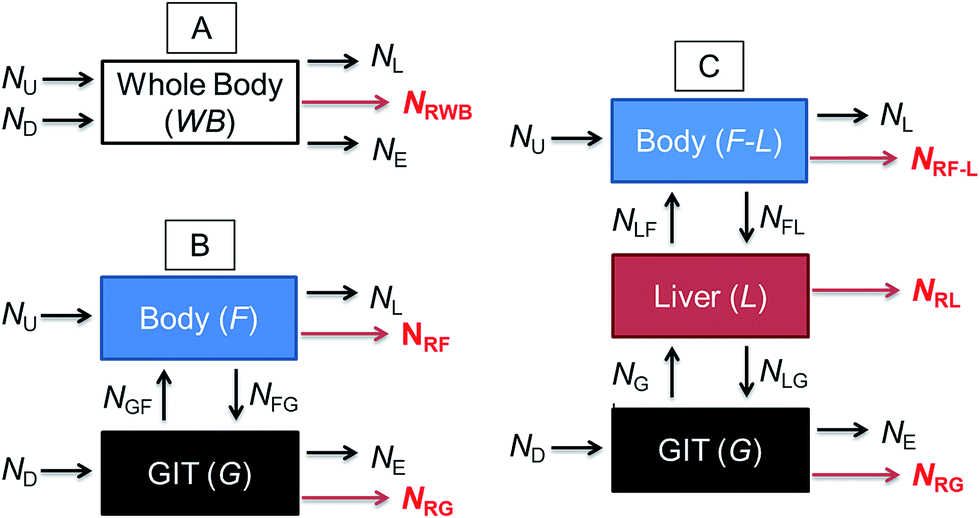 | ||
| Fig. 1 Three different conceptual models and associated chemical flux parameters (N; mol d−1) for chemical uptake from water (U) and the diet (D) into an organism and elimination to the water from respiration (L) and egestion (E). Chemical loss rates from reaction (degradation) are noted by red text and red arrows. Model (A) considers the organism to consist of one “body” compartment that includes the gastrointestinal tract (GIT) and for which a single reaction loss rate (NRWB) occurs. Model (B) separates the lumen of the GIT and the rest of the body and includes chemical transport between the two compartments and for which there are reaction loss rates (NRG and NRF) for each. Model (C) further separates the liver from the rest of the body and includes chemical fluxes between the three compartments and for which there are reaction loss rates (NRG, NRL and NRF-L) for each. | ||
OECD 305 test guidelines suggest whole body measurements (i.e., including the GIT and liver)27 for the determination of the BMF and toxicokinetic parameters; however, the guidelines state that “specific tissues (e.g. muscle, liver) can be sampled, if desired and another option is that the GIT can be removed and analyzed separately at the end of the exposure phase and at days 1 and 3 of depuration”. Relatively few fish dietary bioaccumulation studies have separated the GIT from the fish e.g., ref. 24, 50 and 51, and the liver and GIT from the fish e.g., ref. 52–54. In cases where the GIT is removed, this includes perfused tissue, not only the lumen (cavity) of the GIT and associated microflora and secreted enzymes. Approximately 40% of fish dietary toxicokinetic data generated to-date have been derived from homogenization of the entire fish (including liver and GIT).42 Thus it is not possible to separate ED from F in most existing fish bioaccumulation data and it is not possible to discriminate between NRG and NRL and NRWB. Methods to calculate toxicokinetic parameters in the OECD 305 dietary test guidelines and one-compartment fish models commonly used for bioaccumulation assessment cannot differentiate between ED and F because the models do not include a compartment for the liver and hepatic blood flow rates. The focus of this paper is on ED data and models that can be used to parameterize and refine one-compartment fish bioaccumulation and toxicokinetic models (Fig. 1A).
2.2 Current fish ED regression models
After ingestion, chemicals can be transported (actively and passively) from the GIT to the bloodstream through a series of aqueous and organic phases.55 A common model used to quantify ED is the two resistance (or two ‘film’) model,35,56–58 and correlations for ED values measured in fish33,35 have been developed in the form:| 1/ED = A + BKOW | (1) |
![[thin space (1/6-em)]](https://www.rsc.org/images/entities/char_2009.gif) KOW 8 and higher. Fig. ESI-1† illustrates several ED–KOW empirical regression models reviewed by Barber.34 Significant differences between the empirical models (Fig. ESI-1†) reflect the differences in the selection of data used in the regressions and the general variability and uncertainty in measured and predicted ED.
KOW 8 and higher. Fig. ESI-1† illustrates several ED–KOW empirical regression models reviewed by Barber.34 Significant differences between the empirical models (Fig. ESI-1†) reflect the differences in the selection of data used in the regressions and the general variability and uncertainty in measured and predicted ED.
2.3 New fish ED model
The new ED model simulates the chemical absorption process in terms of relative process rates. The model can be incorporated into one-compartment mass balance bioaccumulation and toxicokinetic models to refine predictions for chemicals subject to degradation during the complex series of events following dietary exposure. The model addresses chemical uptake in terms of kinetic (uptake and reaction) and partitioning processes and bioavailability in the GIT. The model is derived in chemical fugacity terms and also presented in terms of rate constants, corresponding characteristic times and relative efficiencies.Conceptually, a chemical enters the GIT in a matrix comprised of aqueous and organic phases at an initial (time zero) fugacity (f0) prior to digestion. Following ingestion the fugacity of the chemical in the food changes and the chemical has three ultimate potential fates: (1) absorption into the body, (2) fecal egestion, or (3) degradation (reaction). As a result of digestion processes in the GIT, the volume and gut contents of the ingested matrix change over time and the fugacity may increase, i.e., gastrointestinal magnification may occur. For simplicity, it is assumed that the ingested matrix is comprised of two sub-phase volumes, i.e., water (VW; m3) and organic matter (VO; m3). These two volumes are further assumed to represent post-digestion volumes, i.e., fecal matter following digestion and absorption of the ingested food. The total fecal volume (VT) is then VW + VO and the total fecal Z-value (ZT) is a function of the relative proportions and fugacity capacities of both phases, i.e., ZT = (VWZW + VOZO)/VT. The flow rates of aqueous and organic matter from the GIT into the organism as a result of digestion processes are represented as GW and GO with units of m3 h−1. It is assumed that the fugacity (or dissolved concentration) in the aqueous phase provides the “driving force” for diffusion from the GIT into the organism.
First, assuming no chemical degradation in the GIT, the absorption of chemical from the GIT as a function of time can be expressed in fugacity terms by the following differential equation:
| (VTZT)df/dt = −DAf | (2) |
| df/f = −(DA/VTZT)dt | (3) |
Integration gives:
| lnf = −(DA/VTZT)t + x | (4) |
| ln(fE/f0) = −DAt/VTZT | (5) |
| fE/f0 = exp(−DAt/VTZT) | (6) |
| ln(1 − ED) = −DAt/VTZT | (7) |
| ED = 1 − exp(−DAt/VTZT) | (8) |
This equation shows the limiting properties that when t = 0, then ED = 0, and at long values of t and high values of DA/VTZT, ED approaches 1 (or 100%). In terms of rate constants the equivalent equation is:
| ED = 1 − exp(−kAt) | (9) |
| ED = 1 − exp(−τG/τA) | (10) |
If there is simultaneous chemical degradation in the GIT, an additional parameter is required to quantify this process; namely a reaction rate constant (kR), D-value (DR), or characteristic time (τR), depending on the formulation of the equations, e.g.:
| f/f0 = exp(−(kA + kR)t) | (11) |
The fraction egested is exp(−(kA + kR)t) and can be referred to as the egestion efficiency (EE) and the fraction absorbed and reacted is 1 − exp(−(kA + kR)t), or in terms of efficiencies ED + ER, where ER is the reaction efficiency. If degradation and absorption do not occur simultaneously but sequentially in whole or in part, the fractions absorbed and degraded will vary depending on the sequence but this obviously requires more detailed information on relative rates and locations within the GIT. In the absence of such information the simplest expedient is to assume simultaneous absorption and degradation in the model. The relative rates of absorption and reaction are thus proportional to kA and kR, e.g.:
| ED = [kA/(kA + kR)][1 − exp(−(kA + kR)t)] | (12) |
We can use D values to explain DA (and kA and τA) using the two resistance model and thus the dependence on KOW. For example, when there is negligible degradation:
| τA = 1/kA = VTZT/DA = (VWZW + VOZO)(1/GOZO + 1/GWZW) | (13) |
Dividing the numerator and denominator by ZW and replacing ZO/ZW with KOW the equation becomes:
| τA = 1/kA = VTZT/DA = (VW + VOKOW)(1/GOKOW + 1/GW) | (14) |
Following model calibration to ED values for persistent chemicals (kR is assumed 0) and kAs (and τAs) are calculated for a range of KOW, kR for less persistent chemicals can be estimated as:
| τR = 1/kR = α/(1 − α/τG) | (15) |
2.4 Model parameterization and calibration
The model is parameterized using estimates for τR, τG, VO, VW, GO, and GW and by calibration to measured ED data for persistent chemicals; hence, kR is assumed to be negligible (10−12 h−1); therefore, τR is 1012 h. Given the highly dynamic conditions for the food ingestion and digestion process, it is difficult to obtain a single value for the gut characteristic (residence or transit) time τG. We estimate the gut characteristic time τG as V/G where V is the volume of the GIT (m3) and G is the flow rate for the gut contents (m3 h−1), i.e., ingested food, digesting food, bile salts, microflora, feces, etc. This approach assumes the chemical can be absorbed throughout the GIT, whereas the true “effective residence time” for chemical absorption may be shorter. The volume fraction of the entire GIT is about 3–5% the whole fish and an initial value of 3.3% v/v was assumed for the effective volume of the GIT (sum volume fractions for pyloric ceca, upper intestine, lower intestine).47 Historically, fish in laboratory tests are fed daily at rates typically ranging from 1–3% body weight on a dry weight basis (median = 2% body weight per day).42 Different assumptions can be made regarding the amount of water co-ingested with the diet and the densities of the dietary components (e.g., ref. 24). An equal volume of water is assumed ingested with the administered fish food and the densities of all ingested components are 1 kg L−1 (e.g., ref. 24) corresponding to a wet weight volumetric ingestion rate of about 4% body weight per day. The initial τG is thus about 20 h or 0.83 d which corresponds to a kG of 1.2 d−1.The VO and VW parameters can be calculated based on measured or estimated lipid and water volume fractions in the feces. In the current application we employ a version of the dietary digestion sub-model in the AQUAWEB33 fish bioaccumulation model. The digestion model is parameterized with median values from a large collection of dietary bioaccumulation testing data (10 g fish; 15 °C)42 to estimate VO and VW from typical dietary bioaccumulation experiments. The VO parameter was estimated to be 3.37 × 10⁻⁹ m3 from the median lipid equivalent contents reported from the feeding studies (14%42) and the fish digestion model.33 Based on the same approach VW was estimated to be 1.11 × 10⁻⁷ m3. Values for GO and GW have been derived from small fish using dietary feeding studies in the 1980s35 ranging in value from about 2.42 × 10⁻¹² to 3.33 × 10⁻¹⁰ (average = 8.63 × 10⁻¹¹ m3 h−1) and from about 5.83 × 10⁻⁵ to 8.25 × 10⁻³ (average = 2.12 × 10⁻³ m3 h−1), respectively. The median ratio of reported GW/GO values is 2.44 × 107.35 Average estimates of 8.63 × 10⁻¹¹ and 2.12 × 10⁻³ were selected for the transport parameters GO and GW, respectively. The initial parameters for model calibration are summarized in Table 1.
| Parameter | Symbol (units) | Initial | Calibrated |
|---|---|---|---|
| Reaction residence time | τ R (h) | 1012 | 1012 |
| GIT residence time | τ G (h) | 20 | 20 |
| Volume of octanol equivalent in the feces | V O (m3) | 3.37 × 10⁻⁹ | 3.37 × 10⁻⁹ |
| Volume of water in the feces | V W (m3) | 1.11 × 10⁻⁷ | 1.11 × 10⁻⁷ |
| Flow rate of organic matter from the GIT into the organism | G O (m3 h−1) | 8.63 × 10⁻¹¹ | 1.19 × 10⁻¹⁰ |
| Flow rate of water from the GIT into the organism | G W (m3 h−1) | 2.12 × 10⁻³ | 2.12 × 10⁻² |
An evaluated database of measured EDs42 as well as another dataset of measured EDs25 form the basis of the data used in this study. The data were critically reviewed in an effort to address experimental variability and uncertainty. The ED data and the process for selecting relevant and reliable ED data are summarized in ESI-2.† The new ED model calibration dataset (Table ESI-1†) primarily consists of PCBs, which are poorly transformed, and other selected persistent chemicals that are poorly biotransformed in fish providing 250 measured EDs. The KOWs for PCBs reported by Hawker and Connell59 were used for model calibration. For other chemicals, measured KOWs were selected preferentially to predicted values.60 The KOW in the calibration set range from logKOW 4.5 to 8.2. While temperature can influence chemical partitioning, we did not include any temperature correction to KOW.
The model was calibrated to the empirical dataset using the Solver function in Microsoft Excel® to obtain the minimal sum square error between observed and predicted ED values. The τR, τG, VO, VW parameters remained fixed and the GW parameter and the ratio between GO and GW were allowed to vary to allow for changes to GO. The GO and GW parameters were selected for calibration because they cannot be measured directly. The calibrated empirical estimates for GO and GW are shown in Table 1.
2.5 Estimating kR
Following eqn (15), the new model can be used to obtain estimates for kR for less persistent chemicals when “ED,Xs” are derived experimentally under exposure conditions similar to the calibration dataset. The criteria outlined for the selection of data for model calibration (ESI-2†) were also followed to obtain a database of ED,X values (n = 255) from which preliminary estimates of kR were calculated. Given the structure of the new ED model, kR is assumed to occur in the lumen of the GIT before the chemical is absorbed into the epithelium and tissues of the GIT. However, a key uncertainty with the kR estimates is that the measured ED,X data do not have sufficient resolution to truly determine where these reactions may be occurring because they are obtained from whole body homogenates. These preliminary rate estimates are perhaps best considered in relative terms, rather than absolute.2.6 Simulating field BAFs and field and lab BMFs
The new ED model was coded into bioaccumulation models to compare the new ED model with previous ED regression models on calculated field BAFs (i.e., CFish/CWater) and lab and field BMFs (i.e. CFish/CDiet). The new model was also used to examine the role of kR and biotransformation rate constants (kB,N; d−1, normalized to 10 g body weight at 15 °C61) on calculated BAFs and BMFs. The models were parameterized for a set of hypothetical neutral organic chemicals comprising a range of hydrophobicity (ranging in logKOW from 0 to 12).
The AQUAWEB model33 has been tested and applied in various ecosystems, e.g., ref. 15, 33 and 62–64 and laboratory tests, e.g.ref. 10, 42 and 65–67. The AQUAWEB model also forms the basis of the KABAM model used in US EPA pesticide evaluations.68 The calibrated ED model was coded into the AQUAWEB model that was then subsequently parameterized to calculate field BAFs and BMFs for a fish (0.01 kg; 5% lipid content) in an assumed environment consuming prey (5% lipid content) that is at equilibrium with the surrounding water. The same conditions were used to parameterize the model to simulate lab BMFs in which there was only exposure to the fish from the diet (no chemical exposure or uptake from the water). The simulations compare the model output with the previous and new ED sub-models and for various assumptions of biotransformation rates in the fish and degradation rates in the GIT.
The BAF-QSAR model32 incorporated in the BCFBAF module of the United States Environmental Protection Agency's EPI Suite™ software4,69 calculates BAFs in three general trophic levels of fish.4,70 The ED parameter is a variable in the BAF-QSAR model. The BAF-QSAR is calibrated to measured BAFs from the environment using assumed representative ecological parameters and requires only KOW and kB,N as model input parameters to simulate BAFs, thus providing environmentally relevant bioaccumulation hazard information for screening assessments. The newly calibrated ED model was coded into an Excel spreadsheet version of the BAF-QSAR model (http://www.arnotresearch.com) that was subsequently used to calculate BAFs in upper trophic level fish and compare the results with the previous and new ED models with different assumptions for biotransformation rates in the fish and degradation rates in the GIT.
3. Results and discussion
3.1 Comparison of ED models with measured data
Fig. 2 compares the calibrated ED model (black line; τG = 20 h) with the evaluated calibration dataset. Fig. 2 also includes three regression models: Gobas et al., 1988;35 Arnot and Gobas, 2004;33 and Lo et al., 2015.24 All of the models show a plateau in ED at about 50% for chemicals with logKOW > ∼4 and <∼6. For chemicals with logKOW > ∼6 there is a decrease in ED with increasing KOW. The decrease at higher KOW can be explained in kinetic terms by the increased mass transfer resistance of highly hydrophobic chemicals through aqueous diffusion barriers such as the unstirred water layer in the GIT. The new model shows a decrease in ED for chemicals with logKOW < ∼3. This decrease cannot currently be corroborated with measured data because there are no measured ED data for chemicals with low KOW; however, the mechanistic explanation for this decrease is the increased mass transfer resistance of highly water soluble chemicals through the organic phases of the GIT (i.e., membranes). Similar decreases in ED with decreasing KOW have been observed and modelled with human data.71 The influence of lower ED on fish at lower KOW is insignificant because the uptake of low KOW chemicals from food is much slower than uptake of chemicals from water. It is challenging to obtain reliable measurements of ED in fish for lower KOW chemicals (i.e., logKOW < ∼3) because elimination from the gill to the water is relatively fast, e.g., gill elimination half-lives ∼≤1 h in a 10 g fish.42
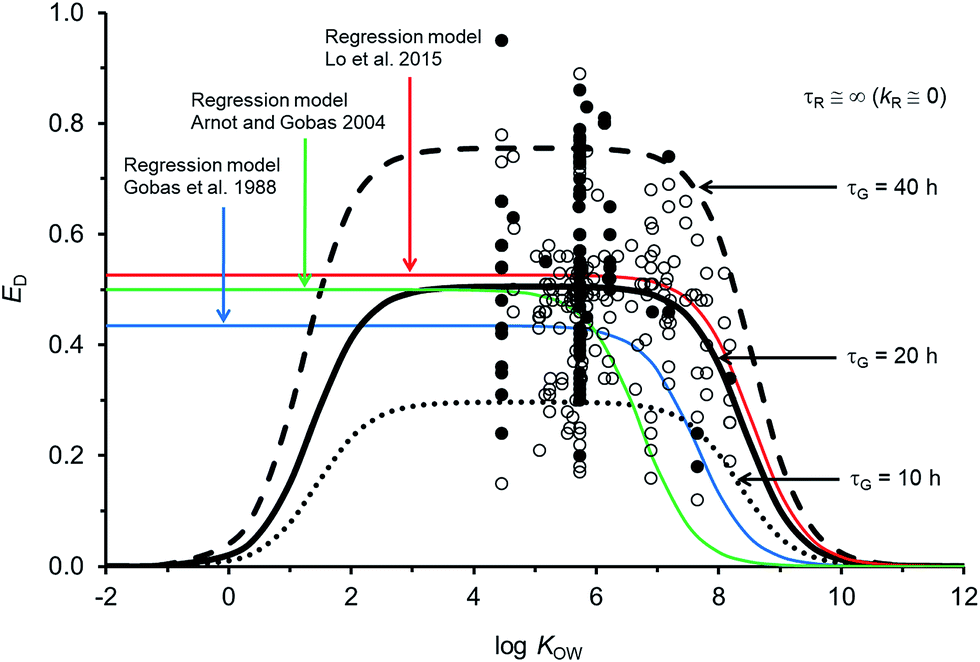 | ||
| Fig. 2 Model predictions and 250 measurements of dietary chemical absorption efficiency (ED) for persistent organic chemicals in fish as a function of the octanol–water partition coefficient (KOW). Black and grey circles are considered high confidence and moderate confidence values, respectively. Three regression models are presented24,33,35 and the new ED model illustrating changes to ED due to changes in the gastrointestinal tract characteristic (residence) time τG. | ||
For chemicals with logKOW > 4, the new model is similar to a recent regression model.24 Both newer models show generally higher ED at moderate and high KOW compared to the earlier regression models.33,35 For a persistent chemical with a logKOW of 8 the more recent models show ED values about 3–10 times higher than the previous ED–KOW regressions.33,35 For chemicals with a logKOW of around 9 the more recent models suggest ED values about 5–30 times higher than the previous regression models. Many of the chemicals used to develop the earlier regression models were high KOW chlorinated dioxins; some of which are subject to biotransformation.61,72 If significant degradation of these chemicals occurs, the true potential ED values for persistent high KOW chemicals would be higher than the reported ED values from those studies. Dioxin data were not included in the new model or in the recent ED–KOW regression model.24,39,67 Reliable quality ED data for persistent chemicals with logKOW > 8.2 do not currently exist; hence, uncertainty in the models may be significant for chemicals with logKOW > ∼8. Additionally, KOW is an input parameter and there are few reliable measurements of KOW for chemicals with logKOW > ∼8. The mechanistic and theoretical basis of the new ED model and its calibration to evaluated data provides some confidence in the model's application with an appreciation of the uncertainty at very high KOW. Very hydrophobic chemicals can establish high body burdens in fish but the uptake time is prolonged thus the residence time of the chemical in the fish will be long. Even very slow rates of biotransformation and growth dilution will then become significant.
3.2 Model sensitivity and uncertainty
The sensitivity of simulated ED as a function of changes to model parameters was examined. The gut residence time of the digesta is an uncertain variable and a function of the feeding rate. If the assumed volume for the GIT is the same and the feeding rate doubles (i.e., ∼8% bw d−1) τG is 10 h (dashed black line in Fig. 2). If the actual effective volume of the GIT for chemical absorption is smaller and the flow rate is the same, then τG will also be shorter. Conversely if the assumed volume of the GIT is larger or the feeding rate is smaller, all else being equal τG will be larger (e.g., τG = 40 h, dashed black line in Fig. 2). Following changes to τG the model can be re-fit with changes to GW and GO to approximate general empirical trends.The uncertainty in empirically derived ED (e.g., Fig. 2) for persistent chemicals is recognized, e.g., the OECD 305 ring trials27,73 and is difficult to reconcile without extensive examination of the raw experimental data. Fig. 2 shows that despite efforts to address experimental variability and uncertainty in selection of the calibration dataset, variability in the measured data remains large. For example, there are 34 EDs for hexachlorobenzene (HCB) ranging from 0.20 to 0.86 (median = 0.54). Following the OECD 305 kinetic methods for calculating ED,27 errors in the measured total elimination rate constants can result in errors in ED. Specifically, overestimates of the total elimination rate constant (underestimation of half-life) can result in overestimates of ED and underestimates of the actual administered dose can result in overestimates of ED. Overestimating the initial concentration assumed to be in the organism after the dietary exposure phase (C0) can also result in overestimates of ED. The root mean square error between the calibrated model predictions and observations is 0.15 and there is no bias in model error as a function of KOW (Fig. ESI-2,† plot of residuals). The high variability in ED data is a cause for concern and in view of the importance of ED as a parameter influencing bioaccumulation and biomagnification, there is a regulatory incentive to define the process of obtaining ED more consistently.
3.3 Estimating kR
The new ED model was used to estimate kR from a dataset of ED,X values that were obtained following testing methods that are similar to those of the calibration dataset (ESI-2†). Fig. 3A summarizes the distribution of 255 new kR estimates that range from about 0.015 to 84 d−1 (corresponding to reaction half-lives of 0.0082 to 47 d). Table ESI-2† lists the kR estimates. The chemicals in the new kR database include hydrocarbons (linear and polycyclic aromatics), phthalate esters, fungicides, dioxins, furans, brominated flame retardants, and various other halogenated organics. The chemicals range in logKOW from about 2.8 to 9.0 and molar mass of 120.2 to 959.2 g mol−1. Fig. 3B compares the new kR estimates with previous estimates of kR (referred previously as kGM)25 with 78 data points for 75 different chemicals showing very good agreement across 3.75 orders of magnitude of kR. Previous estimates of kR (kGM)25 were obtained using a 2-compartment model (i.e., Fig. 1B). Conceptually the differences between the previous approach and the current approach is that in the current approach kR is assumed to occur before absorption in the gut epithelium, whereas in the 2-compartment model it is explicitly possible for chemical transport from the perfused tissues of the fish to the GIT where it could be subject to degradation in the lumen. The greatest differences between the two methods of kR (kGM) estimation were for 4 chemicals with slow rates of degradation <∼0.2 d−1 (Fig. 3B, bottom left corner). The general agreement using two different approaches for kR estimation provides confidence in the estimates, including the empirical estimates selected to parameterize the new model. To improve kR estimation, future experiments should use standardized testing methods (i.e., OECD 305) that include benchmark chemicals to address inherent variability.24,74
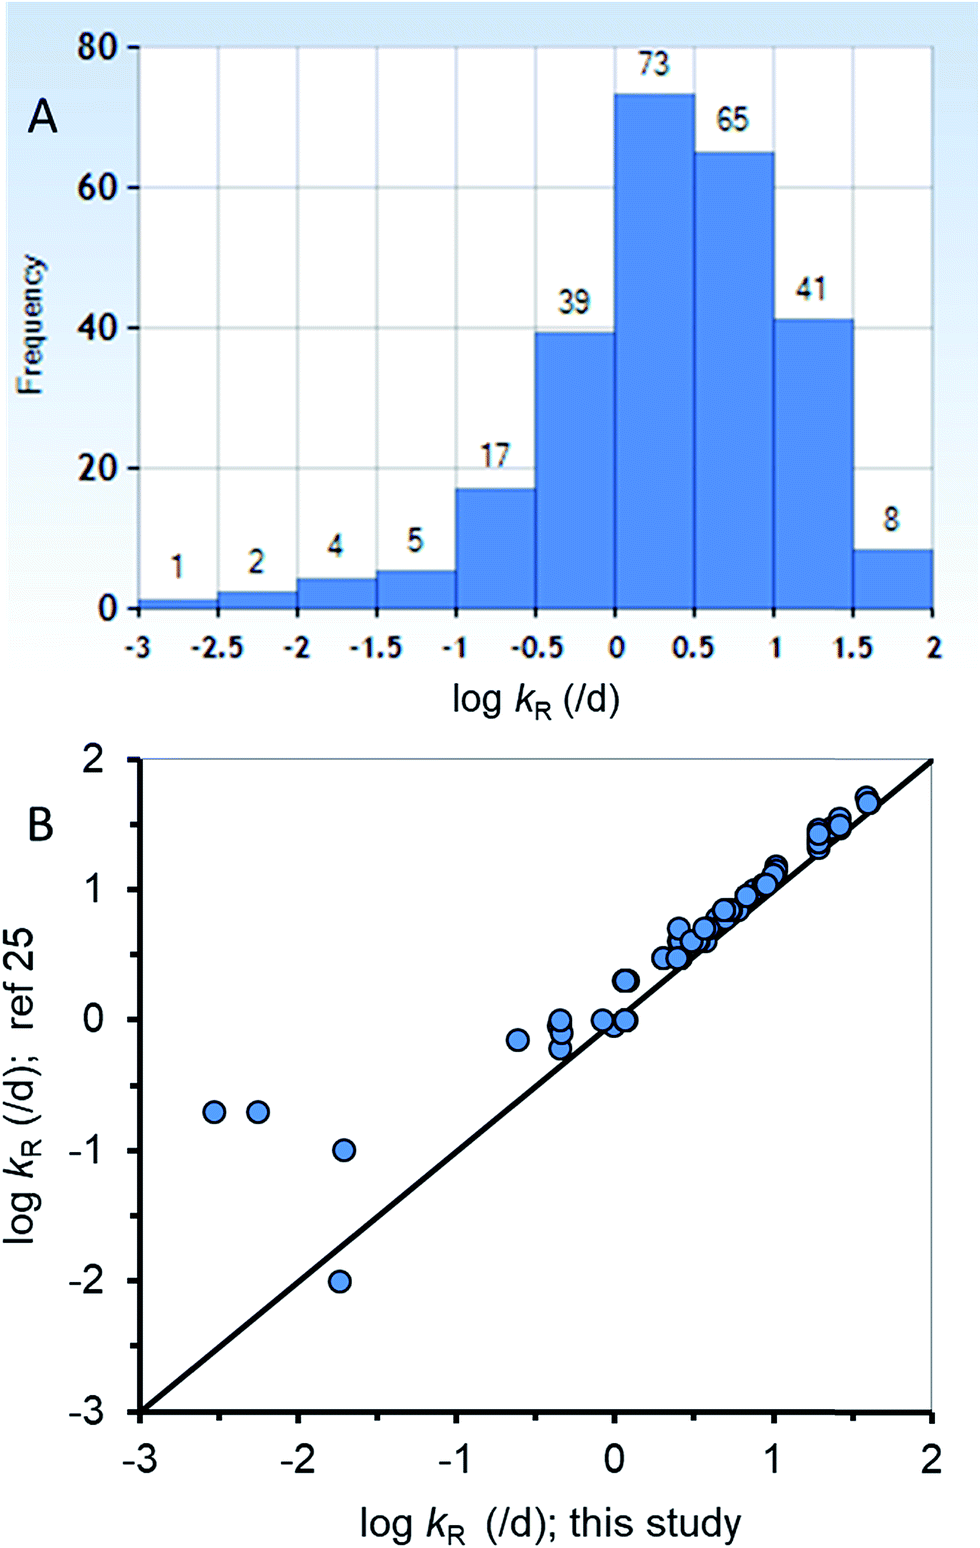 | ||
| Fig. 3 (A) A histogram of the new biotransformation rate (kR) database (n = 255) and (B) corroboration of the new kR estimates with other previous estimates25 for a subset of the new database (n = 78). | ||
The estimated kRs cannot be associated with specific degradation process(es) (e.g., biodegradation by microorganisms, hydrolysis, biotransformation from the secretion of enzymes, biotransformation in the epithelial tissue) or the precise location(s) of these processes (e.g., lumen, tissues, first pass effect in the liver). Because these rates are not being measured directly they are assumed and other factors could also be highly relevant. In particular, if there are key determinants other than KOW that significantly influence chemical absorption efficiency (e.g., steric factors, or negligible solubility in water or organic phases, or active processes for absorption or secretion) the kR estimates for these chemicals will be suspect.
3.4 Simulating field BAFs and field and lab BMFs
Fig. 4 illustrates AQUAWEB model33 predicted field BAFs for a lower trophic level fish for a range of KOW and a range of assumed kB and kR values. Fig. ESI-3† illustrates the BCFBAF model predictions for BAFs in an upper trophic level fish. One difference in model output between Fig. 4A (and ESI-3A†) and Fig. 4B (and ESI-3B†) is that rates for kR are considered in the latter figures. The original ED model used in the bioaccumulation models is included in Fig. 4A and ESI-3A.† The new ED model shows higher BAFs at higher KOW compared to the BAFs using the original ED model, particularly when biotransformation rates are very slow. In Fig. 4BkR is assumed equal to kB,N for most calculations. There are some differences with respect to bioaccumulation hazard classification with slight decreases in BAFs when kR ∼ kB,N. When kB,N is about 0.5 per day, the BAFs are near or below the criterion of 5000 L kgww−1 regardless of kR. There are notable differences in potential bioaccumulation hazard categorization if kR ≫ kB,N. For example, if kB,N and kR are about 0.1 d−1 then chemicals with logKOW > ∼5 and <∼9 would have BAFs >5000 L kg−1; however, if kR is about 100 times faster than kB,N (0.1 d−1) then all of the chemicals would have BAFs <5000 L kg−1 under these simulated conditions.
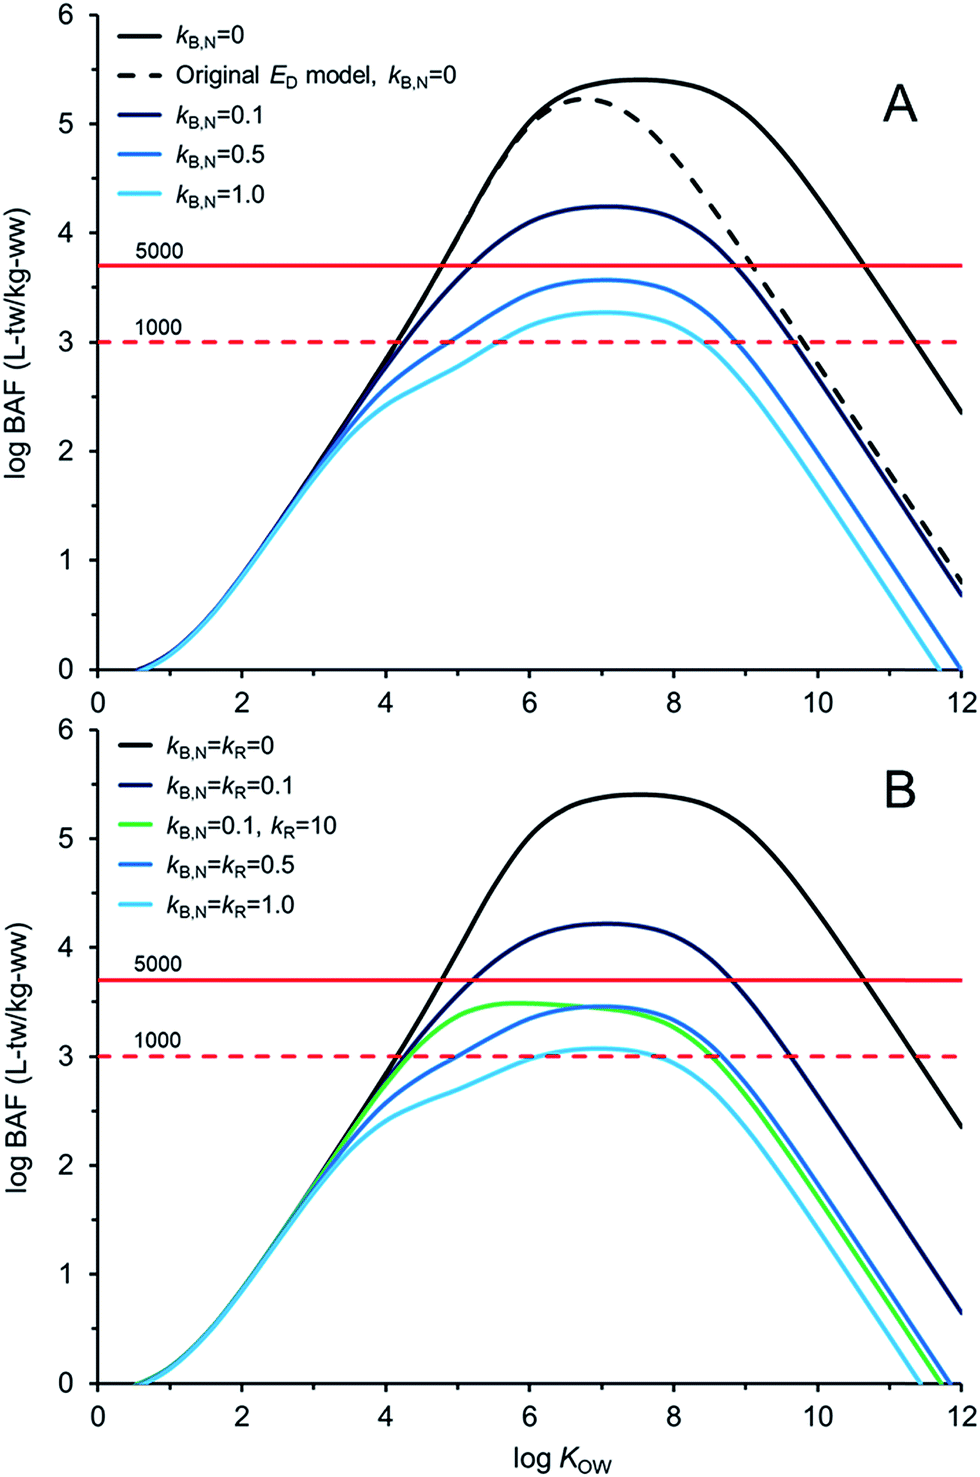 | ||
| Fig. 4 Bioaccumulation factor (BAF) calculations as a function of the octanol–water partition coefficient (KOW). (A) Assumptions for fish biotransformation rate constants (kB,N; d−1) and degradation in GIT assumed negligible, and (B) assumptions for degradation rate constants in the GIT kR, i.e., kR = kB,N and kR = 100kB,N. BAF criteria of 1000 and 5000 L kg−1 are presented. BAFs are based on total water (tw) concentrations (dissolved and sorbed). | ||
Fig. 5 compares AQUAWEB model calculations for the BMF for the same fish simulated in Fig. 4 for a range of hypothetical chemicals under field and lab conditions. In these examples kR is assumed equal to kB,N for all calculations. The BMF threshold of 1 kglw kglw−1 is included to illustrate the combination of some chemical properties and degradation rates that result in different bioaccumulation hazard classifications. Fig. 5A simulates a field BMF in which the diet is at equilibrium with the water and the fish is simultaneously exposed to chemical in both media and Fig. 5B simulates a laboratory BMF in which the fish is only exposed to chemical in the diet (no chemical in the water).
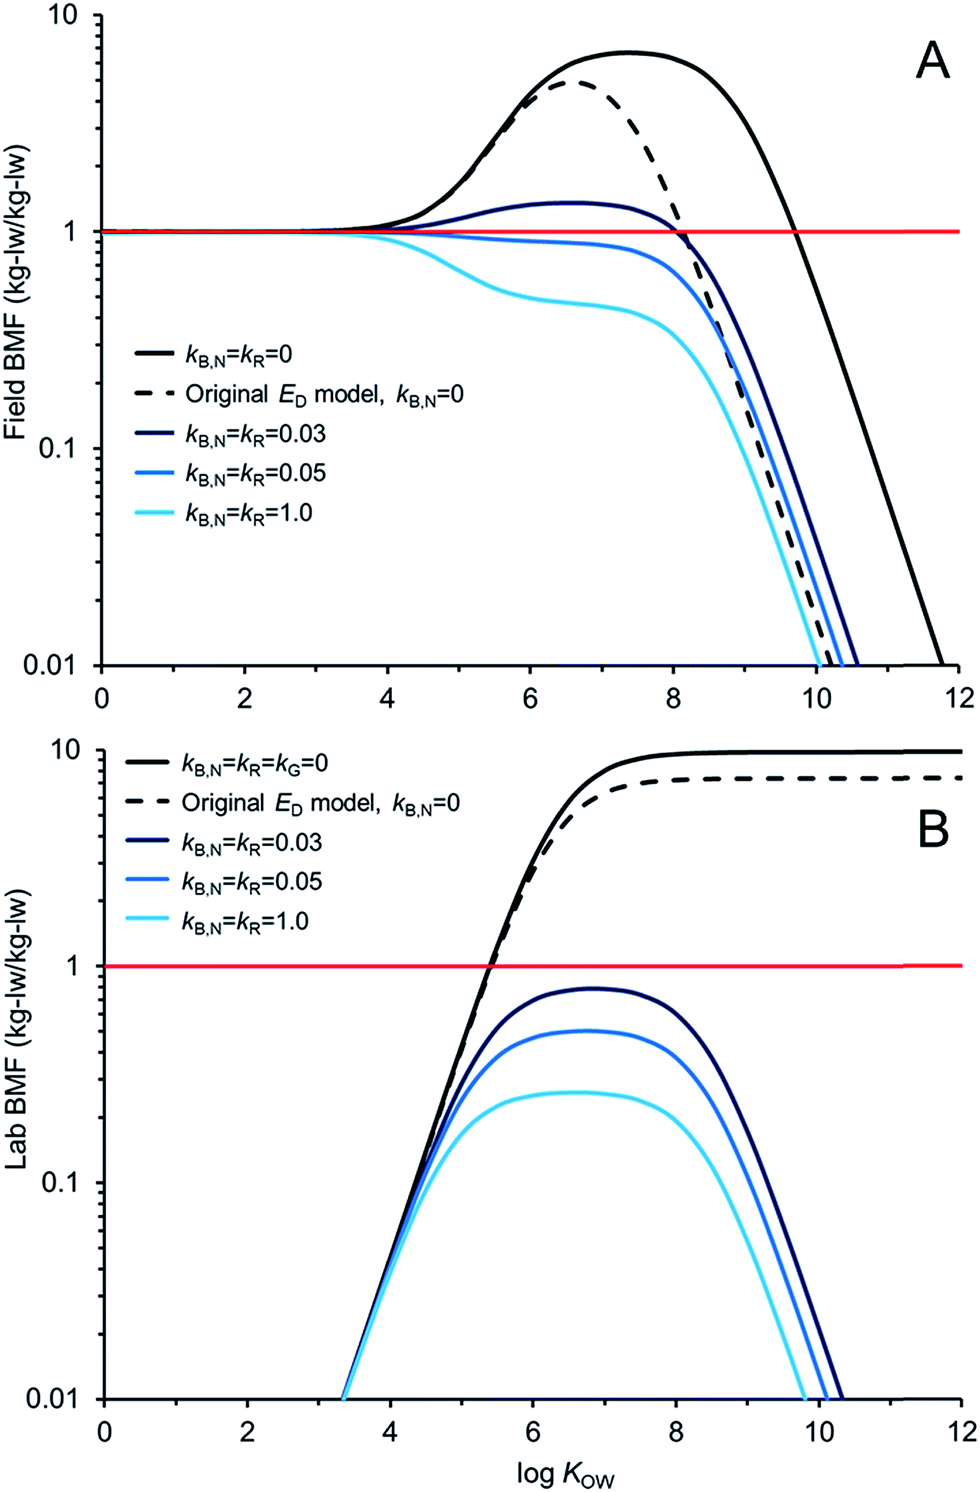 | ||
| Fig. 5 Biomagnification factor (BMF, lipid weight ratios) calculations as a function of the octanol–water partition coefficient (KOW) and assumptions for fish biotransformation rate constants (kB,N; d−1) and degradation rate constants in the GIT kR. (A) Field BMFs: the diet is at equilibrium with the water, and (B) lab BMFs: fish is only exposed to chemical in the diet (no water exposure). All lab simulations include growth correction, i.e., kG = 0, whereas the field BMFs include simulated growth rates (kG ≅ 0.0022 d−1 in this case). A BMF criterion of 1 is presented (red line). | ||
Fig. 5A shows how the field BMF is higher at higher KOW when the new ED model is considered (reflecting differences between the new and old ED models shown in Fig. 2). Furthermore the maximum field BMF (kB,N = kR = 0) under the assumed conditions (i.e., 10 g fish; 15 °C; kG = 0.0022 d−1) with the new ED model is about 6.7 compared to about 5 with the earlier ED model and the upper range of KOW corresponding with BMFs >1 increases from about 8.5 to 10. Fig. 5A suggests that for this specific predator–prey relationship a kB,N of about 0.05 per day results in BMFs ≤1 for all neutral hydrophobic organic chemicals. When kR is about 0.05 d−1 the impact on ED is relatively small, i.e., in the logKOW range of ∼4 to ∼6.5 ED decreases from about 51% to 50%. Hence, in these cases, the decrease in biomagnification hazard classification is a result of kB,N not kR. The role of kR on bioaccumulation endpoints may be more significant if kR ≫ kB,N (e.g., Fig. 4B).
Fig. 5B shows how the laboratory BMF is also higher at higher KOW when the new ED model is considered compared to previous models for ED. These simulated lab BMFs are growth corrected as recommended in OECD guidelines,27i.e., the growth rate constant in the model (kG) is set to zero. There are no declines in maximum BMF values at higher KOW as occurs when there is some growth even in the absence of biotransformation (Fig. 5A), see also.42 The maximum lab BMF (kB,N = kR = kG = 0) under the assumed conditions with the new ED model is about 10 as compared to about 7 with the earlier ED model. The maximum lab BMF compared is higher than the maximum field BMF primarily due to growth correction, i.e., “kG = 0” for the lab BMF.
There are notable differences between modelled field BMFs (Fig. 5A) and lab BMFs (Fig. 5B) for the “same fish”. At lower KOW the influence of chemical uptake from the water results in field BMFs ∼1 for chemicals with logKOW < ∼4 regardless of the assumed biotransformation rates. BMFs in the field approximate unity at lower KOW because the predator, prey and water are near equilibrium (no fugacity gradient from fish to water). Chemical exchange kinetics between the water and the organism are relatively fast and equilibrium is approximated. However, the lab BMFs are <1 at lower KOW because the fish is not simultaneously exposed to chemical in the water and it can efficiently eliminate chemical to its surrounding environment because of the fugacity gradient from fish to water. For poorly biotransformed chemicals, field BMFs exceed 1 (biomagnification hazard criterion) at a lower KOW than lab BMFs because of the co-exposure to chemical in the water. Essentially the decreased fugacity gradient between the fish and the water in the environment reduces the flux of chemical from the fish to the water. This in turn shifts the BMF threshold to a lower KOW than would be observed in the laboratory. Furthermore, the reduced chemical flux from the organism to the water also influences the degree of biotransformation required to lower concentrations in the organism at higher KOW. For example, in the lab setting a kB,N = kR of 0.03 d−1 is sufficient to reduce BMFs for all chemicals <1; whereas chemicals with logKOW > ∼4.5 and <∼8.0 still show some biomagnification under environmental conditions with this rate of biotransformation. All else being equal, slightly faster rates of biotransformation may be required in the field than in the lab to lower BMFs. Predictions of ED values corresponding to lab BMFs <1 (e.g., ED ≤ 0.1325) should further consider field exposure conditions for field BMFs.
Mass balance models can be used to translate toxicokinetic and bioaccumulation parameters derived from laboratory studies to field conditions with information for exposure water concentrations to simulate environmentally relevant exposure conditions. The relative ratio of the chemical concentrations in the diet and the water and the relative uptake rates constants (or fluxes, e.g., NU and ND in Fig. 1A) can be different at different trophic levels and these can be simulated with models and corroborated through field studies. The depicted rate constants and relationships between KOW, BMF and BAF in Fig. 4 and 5 are a function of specific conditions including fish mass (volume), water temperature, lipid contents, trophic position and organic carbon content in the water (for BAFs) among others. Hence extrapolating the rate constants directly to other conditions requires the revision of parameters to reflect the appropriate situation.
Finally, it is worth mentioning that the BMFs and BAFs in these figures are, by definition, at steady-state. For persistent, high KOW chemicals total elimination rates are very slow and the time to approach steady-state may take several years often exceeding the lifespan of the organism.
4. Conclusions
There are relatively few measured ED data compared to the number of chemicals requiring evaluation. The new ED model provides a mechanistic basis for simulating chemical absorption after dietary ingestion of chemicals in fish. The model can be used to generate hypotheses to test the influence of flow rates, digestion efficiencies, diet composition, and other related factors on ED. Calibration to an evaluated database (n = 250) of measured EDs for persistent chemicals provides some confidence in the model's application for bioaccumulation and exposure assessments; however, the underlying variability in the data (and hence uncertainty in the models) requires consideration. The model simulations indicate the role of kR on the BMF and BAF can be important for bioaccumulation hazard screening, only when kR ≫ kB. The present study illustrates some combinations of KOW, kR and kB,N and possible outcomes for bioaccumulation assessment and there are thousands of such combinations for various trophic levels. The new database of 255 kRs may lead to the subsequent development and evaluation of quantitative structure–activity relationships (QSARs) to predict kR. Obtaining additional reliable quality ED, F and kR data from laboratory tests for a range of chemical structures would expand the “chemical space” of the current kR database and increase the applicability domain of subsequent QSARs.Models that do not explicitly include a liver compartment such as AQUAWEB,33 BCFBAF32 and others e.g., ref. 24, 30 and 74, cannot explicitly simulate first-pass effects or determine precisely where degradation is occurring throughout the dietary exposure pathway through to systemic circulation. Multi-compartment PBPK models, e.g.ref. 13 and tissue specific analyses (i.e., lumen of the GIT, perfused GIT tissues/epithelium, liver, other tissues) are required to differentiate compartment-specific rates of degradation. Future studies that combine tissue-specific in vitro biotransformation rate measurements with PBPK models may better determine details that cannot be obtained using the present methods. The application of in vitro tests and appropriate extrapolation models will provide insights into the relative rates of reaction in the GIT and liver; however, for GIT experiments it will also be important to further determine whether the reactions are occurring in the lumen, i.e., microflora and excreted enzymes, or in the epithelial tissues where biotransformation enzymes are produced and located.
There are merits and limitations of the new ED model and the associated kR estimates. The new ED model is readily implemented in bioaccumulation and toxicokinetic models such as AQUAWEB and BCFBAF. The revised models require only the additional kR parameter, if kR data are deemed necessary to refine the model calculations and chemical assessments. This may be particularly beneficial when more complex multi-compartment models are not available or are not readily parameterized. If kR data are not available the ED model will provide conservative calculations (assuming no significant degradation in the GIT) appropriate for initial screening assessments. One-compartment models are highly relevant because predators consuming prey in the environment ingest entire organisms, including their GIT. Also, most field and laboratory measurements are based on whole body concentrations (including the GIT). One-compartment models are sufficient to address bioaccumulation assessments for many chemicals; however, in some cases more resolved models and data may be required to address uncertainty. A tiered framework could be developed by including different levels of model complexity (e.g., Fig. 1) that can be used based on the assessment contexts (problem formulation, uncertainty, outcomes) and data availability. Furthermore, comparisons of output from a suite of models can be used to hypothesize when more sophisticated models and more measured data are required and could thus systematically guide testing and research.
Conflicts of interest
There are no conflicts to declare.Acknowledgements
We acknowledge funding support for this work provided by ILSI-Health and Environmental Sciences Institute (HESI) and Environment and Climate Change Canada. We thank HESI project monitoring team members (Mark Bonnell, Tom Parkerton, Lawrence Burkhard, Dan Merckel, Michelle Embry, Kent Woodburn and Ken Drouillard) for comments on earlier drafts.References
- Government of Canada, Canadian Environmental Protection Act, Canada Gazette Part III, 1999 Search PubMed.
- Environment Canada, Guidance Manual for the Categorization of Organic and Inorganic Substances on Canada's Domestic Substances List, Existing Substances Branch, Environment Canada, Ottawa, ON, 2003 Search PubMed.
- European Parliament, Regulation (EC) 1907/2006 of the European Parliament and of the council of 18 December 2006 concerning the Registration, Evaluation, Authorisation and Restriction of Chemicals (REACH), establishing a European Chemicals Agency, amending Directive 1999/45/EC and repealing Council Regulation (EEC) 793/93 and Commission Regulation (EC) 1488/94 as well as Council Directive 76/769/EEC and Commission Directives 91/155/EEC, 93/67/EEC, 93/105/EC and 2000/21/EC, Official Journal of the European Union, 30.12.2006. L 396/1-849, 2006 Search PubMed.
- J. Costanza, D. G. Lynch, R. S. Boethling and J. A. Arnot, Use of the bioaccumulation factor to screen chemicals for bioaccumulation potential, Environ. Toxicol. Chem., 2012, 31, 2261–2268 CrossRef CAS PubMed.
- P. Qiao, F. A. P. C. Gobas and A. P. Farrell, Relative contributions of aqueous and dietary uptake of hydrophobic chemicals to the body burden in juvenile rainbow trout, Arch. Environ. Contam. Toxicol., 2000, 39, 369–377 CrossRef CAS PubMed.
- R. V. Thomann, J. P. Connolly and T. F. Parkerton, An equilibrium model of organic chemical accumulation in aquatic food webs with sediment interaction, Environ. Toxicol. Chem., 1992, 11, 615–629 CrossRef CAS.
- K. E. Clark, F. A. P. C. Gobas and D. Mackay, Model of organic chemical uptake and clearance from fish from food and water, Environ. Sci. Technol., 1990, 24, 1203–1213 CrossRef CAS.
- L. P. Burkhard, J. A. Arnot, M. R. Embry, K. J. Farley, R. A. Hoke, M. Kitano, H. A. Leslie, G. R. Lotufo, T. F. Parkerton, K. G. Sappington, G. T. Tomy and K. B. Woodburn, Comparing laboratory- and field-measured biota-sediment accumulation factors, Integr. Environ. Assess. Manage., 2012, 8, 32–41 CrossRef CAS PubMed.
- F. A. P. C. Gobas, W. de Wolf, L. P. Burkhard, E. Verbruggen and K. Plotzke, Revisiting bioaccumulation criteria for POPs and PBT assessments, Integr. Environ. Assess. Manage., 2009, 5, 624–637 CrossRef CAS PubMed.
- J. A. Arnot, D. Mackay and M. Bonnell, Estimating metabolic biotransformation rates in fish from laboratory data, Environ. Toxicol. Chem., 2008, 27, 341–351 CAS.
- L. P. Burkhard, Factors influencing the design of bioaccumulation factor and biota-sediment accumulation factor field studies, Environ. Toxicol. Chem., 2003, 22, 351–360 CAS.
- W. de Wolf, W. Seinen and J. L. M. Hermens, Biotransformation and toxicokinetics of trichloroanilines in fish in relation to their hydrophobicity, Arch. Environ. Contam. Toxicol., 1993, 25, 110–117 CrossRef CAS.
- J. W. Nichols, P. N. Fitzsimmons and L. P. Burkhard, In vitro–in vivo extrapolation of quantitative hepatic biotransformation data for fish. II. Modeled effects on chemical bioaccumulation, Environ. Toxicol. Chem., 2007, 26, 1304–1319 CrossRef CAS PubMed.
- D. Mackay, A. K. D. Celsie, J. A. Arnot and D. E. Powell, Processes influencing chemical biomagnification and trophic magnification factors in aquatic ecosystems: Implications for chemical hazard and risk assessment, Chemosphere, 2016, 154, 99–108 CrossRef CAS PubMed.
- J. Kim, F. A. P. C. Gobas, J. A. Arnot, D. E. Powell, R. M. Seston and K. B. Woodburn, Evaluating the roles of biotransformation, spatial concentration differences, organism home range, and field sampling design on trophic magnification factors, Sci. Total Environ., 2016, 551–552, 438–451 CrossRef CAS PubMed.
- D. M. Walters, T. D. Jardine, B. S. Cade, K. A. Kidd, D. C. G. Muir and P. Leipzig-Scott, Trophic magnification of organic chemicals: A global synthesis, Environ. Sci. Technol., 2016, 50, 4650–4658 CrossRef CAS PubMed.
- U. Fagerholm, Prediction of human pharmacokinetics-gut-wall metabolism, J. Pharm. Pharmacol., 2007, 59, 1335–1343 CrossRef CAS PubMed.
- K. M. Kleinow, M. O. James, Z. Tong and C. S. Venugopalan, Bioavailability and biotransformation of benzo(a)pyrene in an isolated perfused in situ catfish intestinal preparation, Environ. Health Perspect., 1998, 106, 155–166 CrossRef CAS PubMed.
- T. Sousa, R. Paterson, V. Moore, A. Carlsson, B. Abrahamsson and A. W. Basit, The gastrointestinal microbiota as a site for the biotransformation of drugs, Int. J. Pharm., 2008, 363, 1–25 CrossRef CAS PubMed.
- S. Cavret, Intestinal metabolism of PAH: in vitro demonstration and study of its impact on PAH transfer through the intestinal epithelium, Environ. Res., 2005, 98, 22–32 CrossRef CAS PubMed.
- C. M. Butt, D. C. G. Muir and S. A. Mabury, Biotransformation of the 8:2 fluorotelomer acrylate in rainbow trout. 2. In vitro incubations with liver and stomach S9 fractions, Environ. Toxicol. Chem., 2010, 29, 2736–2741 CrossRef CAS PubMed.
- P. A. Van Veld, Absorption and metabolism of dietary xenobiotics by the intestine of fish, Rev. Aquat. Sci., 1990, 2, 185–203 CAS.
- M. O. James, C. J. Marth and L. Rowland-Faux, Slow O-demethylation of methyl triclosan to triclosan, which is rapidly glucuronidated and sulfonated in channel catfish liver and intestine, Aquat. Toxicol., 2012, 72–82 CrossRef CAS PubMed.
- J. C. Lo, D. A. Campbell, C. J. Kennedy and F. A. P. C. Gobas, Somatic and gastrointestinal in vivo biotransformation rates of hydrophobic chemicals in fish, Environ. Toxicol. Chem., 2015, 34, 2282–2294 CrossRef CAS PubMed.
- J. C. Lo, D. J. Letinski, T. F. Parkerton, D. A. Campbell and F. A. P. C. Gobas, In vivo biotransformation rates of organic chemicals in fish: relationship with bioconcentration and biomagnification factors, Environ. Sci. Technol., 2016, 50, 13299–13308 CrossRef CAS PubMed.
- W. A. Bruggeman, L. B. J. M. Matron, D. Kooiman and O. Hutzinger, Accumulation and elimination kinetics of di-, tri-, and tetra chlorobiphenyls by goldfish after dietary and aqueous exposure, Chemosphere, 1981, 10, 811–832 CrossRef CAS.
- OECD, OECD Guidelines for Testing Chemicals. Test No. 305: Bioaccumulation in Fish: Aqueous and Dietary Exposure, Organization for Economic Co-operation and Development, Paris, 2012 Search PubMed.
- R. V. Thomann, Bioaccumulation model of organic chemical distribution in aquatic food chains, Environ. Sci. Technol., 1989, 23, 699–707 CrossRef CAS.
- M. C. Barber, L. A. Suarez and R. R. Lassiter, Modelling bioaccumulation of organic pollutants in fish with an application to pcbs in Lake Ontario salmonids, Can. J. Fish. Aquat. Sci., 1991, 48, 318–337 CrossRef CAS.
- M. Hauck, H. W. M. Hendriks, M. A. J. Huijbregts, A. M. J. Ragas, D. van de Meent and A. J. Hendriks, Parameter uncertainty in modeling bioaccumulation factors of fish, Environ. Toxicol. Chem., 2011, 30, 403–412 CrossRef CAS PubMed.
- F. A. P. C. Gobas, A model for predicting the bioaccumulation of hydrophobic organic chemicals in aquatic food-webs: Application to Lake Ontario, Ecol. Modell., 1993, 69, 1–17 CrossRef CAS.
- J. A. Arnot and F. A. P. C. Gobas, A generic QSAR for assessing the bioaccumulation potential of organic chemicals in aquatic food webs, QSAR Comb. Sci., 2003, 22, 337–345 CAS.
- J. A. Arnot and F. A. P. C. Gobas, A food web bioaccumulation model for organic chemicals in aquatic ecosystems, Environ. Toxicol. Chem., 2004, 23, 2343–2355 CrossRef CAS PubMed.
- M. C. Barber, Dietary uptake models used for modeling the bioaccumulation of organic contaminants in fish, Environ. Toxicol. Chem., 2008, 27, 755–777 CAS.
- F. A. P. C. Gobas, D. C. G. Muir and D. Mackay, Dynamics of dietary bioaccumulation and faecal elimination of hydrophobic organic chemicals in fish, Chemosphere, 1988, 17, 943–962 CrossRef CAS.
- G. A. Moser and M. S. McLachlan, Modeling digestive tract absorption and desorption of lipophilic organic contaminants in humans, Environ. Sci. Technol., 2002, 36, 3318–3325 CrossRef CAS PubMed.
- K. G. Drouillard and R. J. Norstrom, Dietary absorption efficiencies and toxicokinetics of polychlorinated biphenyls in ring doves following exposure to Aroclor (R) mixtures, Environ. Toxicol. Chem., 2000, 19, 2707–2714 CrossRef CAS.
- B. C. Kelly, F. A. P. C. Gobas and M. S. McLachlan, Intestinal absorption and biomagnification of organic contaminants in fish, wildlife, and humans, Environ. Toxicol. Chem., 2004, 23, 2324–2336 CrossRef CAS PubMed.
- B. C. Kelly, M. G. Ikonomou, J. D. Blair, A. E. Morin and F. A. P. C. Gobas, Food web-specific biomagnification of persistent organic pollutants, Science, 2007, 317, 236–239 CrossRef CAS PubMed.
- J. A. Arnot and D. Mackay, Policies for chemical hazard and risk priority setting: can persistence, bioaccumulation, toxicity and quantity information be combined?, Environ. Sci. Technol., 2008, 42, 4648–4654 CrossRef CAS PubMed.
- G. Czub and M. S. McLachlan, A food chain model to predict the levels of lipophilic organic contaminants in humans, Environ. Toxicol. Chem., 2004, 23, 2356–2366 CrossRef CAS PubMed.
- J. A. Arnot and C. L. Quinn, Development and evaluation of a database of dietary bioaccumulation test data for organic chemicals in fish, Environ. Sci. Technol., 2015, 49, 4783–4796 CrossRef CAS PubMed.
- R. Xiao, J. A. Arnot and M. MacLeod, Towards an improved understanding of processes controlling absorption efficiency and biomagnification of organic chemicals by fish, Chemosphere, 2015, 138, 89–95 CrossRef CAS PubMed.
- H. Selck, K. Drouillard, K. Eisenreich, A. A. Koelmans, A. Palmqvist, A. Ruus, D. Salvito, I. Schultz, R. Stewart, A. Weisbrod, N. W. van den Brink and M. van den Heuvel-Greve, Explaining differences between bioaccumulation measurements in laboratory and field data through use of a probabilistic modeling approach, Integr. Environ. Assess. Manage., 2012, 8, 42–63 CrossRef CAS PubMed.
- D. Mackay, Multimedia Environmental Models: The Fugacity Approach - Second Edition, Lewis Publishers, Boca Raton, FL, 2001 Search PubMed.
- J. W. Nichols, A physiologically based toxicokinetic model for dietary uptake of hydrophobic organic compounds by fish: I. Feeding studies with 2,2′,5,5′-tetrachlorobiphenyl, Toxicol. Sci., 2004, 77, 206–218 CrossRef CAS PubMed.
- J. W. Nichols, A physiologically based toxicokinetic model for dietary uptake of hydrophobic organic compounds by fish: II. Simulation of chronic exposure scenarios, Toxicol. Sci., 2004, 77, 219–229 CrossRef CAS PubMed.
- J. W. Nichols, J. M. McKim, M. E. Andersen, M. L. Gargas, H. J. Clewell III and R. J. Erickson, A physiology based toxicokinetic model for the uptake and disposition of waterborne organic chemicals in fish, Toxicol. Appl. Pharmacol., 1990, 106, 433–447 CrossRef CAS PubMed.
- J. W. Nichols, J. M. McKim, G. J. Lien, A. D. Hoffman and S. L. Bertelsen, Physiologically based toxicokinetic modeling of three chlorinated ethanes in rainbow trout (Oncorhynchus mykiss), Toxicol. Appl. Pharmacol., 1991, 110, 374–389 CrossRef CAS PubMed.
- F. A. P. C. Gobas, J. R. McCorquodale and G. D. Haffner, Intestinal absorption and biomagnification of organochlorines, Environ. Toxicol. Chem., 1993, 12, 567–576 CrossRef CAS.
- K. Woodburn, K. Drottar, J. Domoradzki, J. Durham, D. McNett and R. Jezowski, Determination of the dietary biomagnification of octamethylcyclotetrasiloxane and decamethylcyclopentasiloxane with the rainbow trout (Oncorhynchus mykiss), Chemosphere, 2013, 93, 779–788 CrossRef CAS PubMed.
- B. J. Konwick, A. W. Garrison, J. K. Avants and A. T. Fisk, Bioaccumulation and biotransformation of chiral triazole fungicides in rainbow trout (Oncorhynchus mykiss), Aquat. Toxicol., 2006, 80, 372–381 CrossRef CAS PubMed.
- G. T. Tomy, V. P. Palace, T. Halldorson, E. Braekevelt, R. Danell, K. Wautier, B. Evans, L. Brinkworth and A. T. Fisk, Bioaccumulation, biotransformation, and biochemical effects of brominated diphenyl ethers in juvenile lake trout (Salvelinus namaycush), Environ. Sci. Technol., 2004, 38, 1496–1504 CrossRef CAS PubMed.
- C. S. Wong, F. Lau, M. Clark, S. A. Mabury and D. C. G. Muir, Rainbow trout (Oncorhynchus mykiss) can eliminate chiral organochlorine compounds enantioselectively, Environ. Sci. Technol., 2002, 36, 1257–1262 CrossRef CAS PubMed.
- W. L. Hayton, Rate-limiting barriers to intestinal drug absorption: a review, J. Pharmacokinet. Biopharm., 1980, 8, 321–334 CrossRef CAS PubMed.
- G. L. Flynn and S. H. Yalkowsky, Correlation and prediction of mass transport across membranes I: Influence of alkyl chain length on flux-determining properties of barrier and diffusant, J. Pharm. Sci., 1972, 61, 838–852 CrossRef CAS PubMed.
- G. L. Flynn, S. H. Yalkowsky and T. J. Roseman, Mass transport phenomena and models: theoretical concepts, J. Pharm. Sci., 1974, 63, 479–510 CrossRef CAS PubMed.
- A. J. Hendriks, A. van der Linde, G. Cornelissen and D. T. H. M. Sijm, The power of size. 1. Rate constants and equilibrium ratios for accumulation of organic substances related to octanol-water partition ratio and species weight, Environ. Toxicol. Chem., 2001, 20, 1399–1420 CrossRef CAS PubMed.
- D. W. Hawker and D. W. Connell, Octanol-water partition coefficients of polychlorinated biphenyl congeners, Environ. Sci. Technol., 1988, 22, 382–387 CrossRef CAS.
- U.S. EPA, Estimation Programs Interface (EPI) Suite for Microsoft® Windows, Ver. 4.1, U. S. Environmental Protection Agency, Washington, D.C., October 2011 Search PubMed.
- J. A. Arnot, D. Mackay, T. F. Parkerton and M. Bonnell, A database of fish biotransformation rates for organic chemicals, Environ. Toxicol. Chem., 2008, 27, 2263–2270 CAS.
- S. B. Gewurtz, R. Laposa, N. Gandhi, G. N. Christensen, A. Evenset, D. Gregor and M. L. Diamond, A comparison of contaminant dynamics in arctic and temperate fish: A modeling approach, Chemosphere, 2006, 63, 1328–1341 CrossRef CAS PubMed.
- F. A. P. C. Gobas and J. A. Arnot, Food web bioaccumulation model for polychlorinated biphenyls in San Francisco Bay, California, USA, Environ. Toxicol. Chem., 2010, 29, 1385–1395 CAS.
- A. M. McLeod, J. A. Arnot, K. Borga, H. Selck, D. R. Kashian, A. Krause, G. Paterson, G. D. Haffner and K. G. Drouillard, Quantifying uncertainty in the trophic magnification factor related to spatial movements of organisms in a food web, Integr. Environ. Assess. Manage., 2015, 11, 306–318 CrossRef CAS PubMed.
- D. Mackay, A. K. D. Celsie, J. M. Parnis, L. S. McCarty, J. A. Arnot and D. E. Powell, The chemical exposure toxicity space (CETS) model: Displaying exposure time, aqueous and organic concentration, activity, and onset of toxicity, Environ. Toxicol. Chem., 2017, 36, 1389–1396 CrossRef CAS PubMed.
- D. Mackay, L. S. McCarty and J. A. Arnot, Relationships between exposure and dose in aquatic toxicity tests for organic chemicals, Environ. Toxicol. Chem., 2014, 33, 2038–2046 CrossRef CAS PubMed.
- J. Stadnicka, K. Schirmer and R. Ashauer, Predicting concentrations of organic chemicals in fish by using toxicokinetic models, Environ. Sci. Technol., 2012, 46, 3273–3280 CrossRef CAS PubMed.
- K. Gerber, User's Guide and Technical Documentation KABAM Version 1.0 (KOW (based) Aquatic Bioaccumulation Model). Report of Environmental Fate and Effects Division. Office of Pesticide Programs, US Environmental Protection Agency, Washington, DC, 2009 Search PubMed.
- U.S. EPA, Estimation Programs Interface (EPI) Suite for Microsoft® Windows, Ver. 4.1, U. S. Environmental Protection Agency, Washington, D.C., October 2011 Search PubMed.
- F. A. P. C. Gobas and J. A. Arnot, Categorization of Organic Substances on the Domestic Substances List for Bioaccumulation Potential. Report for Environment Canada, Simon Fraser University, Burnaby, BC, 2003 Search PubMed.
- I. A. O'Connor, M. A. J. Huijbregts, A. M. J. Ragas and A. J. Hendriks, Predicting the oral uptake efficiency of chemicals in mammals: Combining the hydrophilic and lipophilic range, Toxicol. Appl. Pharmacol., 2013, 266, 150–156 CrossRef PubMed.
- J. A. Arnot, W. Meylan, J. Tunkel, P. H. Howard, D. Mackay, M. Bonnell and R. S. Boethling, A quantitative structure–activity relationship for predicting metabolic biotransformation rates for organic chemicals in fish, Environ. Toxicol. Chem., 2009, 28, 1168–1177 CAS.
- OECD, Series on Testing and Assessment: Ecotoxicity Testing, No. 175. Part I - Validation Report of a Ring Test for the OECD 305 Dietary Exposure Bioaccumulation Fish Test and Part II - Additional Report including Comparative Analysis of Trout and Carp Results, Environment Directorate, Organization for Economic Co-operation and Development, Paris, 2012 Search PubMed.
- R. Xiao, M. Adolfsson-Erici, G. Åkerman, M. S. McLachlan and M. MacLeod, A benchmarking method to measure dietary absorption efficiency of chemicals by fish, Environ. Toxicol. Chem., 2013, 32, 2695–2700 CrossRef CAS PubMed.
Footnote |
| † Electronic supplementary information (ESI) available. See DOI: 10.1039/c7em00539c |
| This journal is © The Royal Society of Chemistry 2018 |