
 Open Access Article
 This Open Access Article is licensed under a
 Creative Commons Attribution 3.0 Unported Licence
Influence of carbon and fluorine on potassium niobate anode material for sodium-ion battery applications†
Y. Bhaskara
Rao
 and
C. André
Ohlin
*
and
C. André
Ohlin
*
Department of Chemistry, Umeå University, Umeå 90187, Sweden. E-mail: andre.ohlin@umu.se
First published on 17th March 2025
Abstract
Potassium niobate, KNb3O8 (KNO) material is investigated as a potential anode material for sodium ion batteries owing to its layered structure and excellent electrochemical stability. However, the poor electrical conductivity of the material is addressed by surface modification with fluorine-doped carbon utilizing polyvinylidene fluoride as both a carbon and fluorine source. High resolution transmission electron microscopy results reveal that the active material is successfully embedded in the carbon matrix and X-ray photoelectron spectroscopy analysis confirms the tight attachment of carbon and fluorine bonding with the bulk material. As a result, the KNO@F–C material delivers a high reversible capacity of 173 mA h g−1 at a current density of 10 mA g−1, a superior rate performance of 137 mA h g−1 at 200 mA g−1 and a remarkable capacitance recovery rate (>100%). In addition, the coated material exhibits 90% capacity retention, demonstrating its long term cycling stability even after 200 cycles. The enhanced electrochemical performance of the coated sample over the pristine material is attributed to its large specific surface area, and a high Na+-ion diffusion coefficient, which facilitates a rapid transfer of electrons and improves grain-to-grain conductivity.
1. Introduction
Li-ion batteries (LIBs) are widely used in large-scale power stations, electric vehicles (EVs), and portable electronic devices such as laptops, mobile phones and power tools owing to their high energy density.1,2 Much work is now being done on developing new battery types, such as lithium–air batteries, all-solid-state batteries, and various alkali-ion batteries, to enhance the energy and power densities of rechargeable batteries.3–5 Among these, sodium-ion battery (SIB) technology has emerged as a promising alternative approach due to the high abundance, low cost and environmentally friendly nature of sodium.Many types of cathode materials for SIBs have been developed so far.6,7 However, only a limited number of anode materials have been explored for SIBs. Hard carbon is one of the most utilised anode candidates owing to its high reversible capacity and good cycle performance.8,9 However, the potential of Na/Na+ is very close to the Na+-ion insertion potential, leading to Na metal deposition and dendrite formation - issues associated with serious safety concerns for their practical applications.10
Recently, titanium-based oxide compounds have emerged as viable anode materials for SIBs since they react with Na+ ions at an elevated potential compared to that of hard carbon.11 However, only a few anode materials exhibit a compatible combination of reaction potential, cycle life, rate performance, and reversible capacity. Niobates, like titanates, should be regarded as possible anode candidates because they may undergo a reversible reaction with Na+ at an elevated potential due to the Nb5+/Nb4+ redox couple, which is critical for the development of advanced anode materials. However, reports on niobium oxides as anode active materials in SIBs remain scarce.
One such material, TiNb2O7, can be prepared by solid-state reaction and exhibits a reversible capacity of ca. 180 mA h g−1 at 15 mA g−1 current density with a capacity retention of 95% after 500 cycles.12 Nakayama et al. reported a potassium niobate anode material for use in SIBs, which delivered a reversible capacity of 104 mA h g−1 at only 3 mA g−1.10 Nb2O5·nH2O (niobic acid), a more reactive but infrequently utilized Nb precursor compared to commercially available crystalline, anhydrous niobium oxide, is used in our work. In this study, the KNb3O8 (KNO) anode active material was synthesised via a straightforward solid-state reaction, requiring 12 hours at an annealing temperature of 800 °C.
Further, polyvinylidene fluoride (PVDF), a commonly used binder for SIBs/LIBs, is a non-toxic, low-cost, environmentally friendly and high-performing polymer that contains C–H and C–F covalent bonds that can be used to surround the particles of active material.13 It is known that the doping of carbon materials with heteroatoms can not only increase the conductivity of carbon but also provide a large number of defects to facilitate alkali ion transport.14 Thus, the active material, KNO, is embedded in a fluorine-doped carbon matrix with the help of PVDF (used as both a carbon and fluorine source) to further enhance the performance of the potassium niobate anode material. As a result, the coated material delivers improved electrochemical properties, including high reversible capacity, remarkable rate performance, and enhanced capacity retention compared to the pristine sample, as discussed in detail in the Results and discussion section.
2. Experimental section
2.1 Material synthesis
Niobic acid (Nb2O5·nH2O; 40% H2O w/w), obtained as a gift from Prof. William H. Casey (UC Davis), and potassium carbonate (K2CO3, Sigma-Aldrich) were mixed in a stoichiometric ratio (3![[thin space (1/6-em)]](https://www.rsc.org/images/entities/char_2009.gif) :1) in an agate mortar and pestle with ethanol as a mixing medium. The product was then air-dried and annealed in an electric furnace at 800 °C for 12 h to obtain the KNb3O8 powder. Next, 0.5 g of KNb3O8 powder and 0.025 g of polyvinylidene fluoride were mixed in 10 mL N-methyl-2-pyrrolidone (NMP). The solution was vigorously stirred magnetically at 80 °C until the NMP evaporated. The mixture was then ground and calcined at 500 °C for 4 h under a N2 atmosphere to obtain the final carbon-coated and fluorine-doped KNb3O8 powder. The pristine and coated samples were named as KNO and KNO@F–C, respectively.
:1) in an agate mortar and pestle with ethanol as a mixing medium. The product was then air-dried and annealed in an electric furnace at 800 °C for 12 h to obtain the KNb3O8 powder. Next, 0.5 g of KNb3O8 powder and 0.025 g of polyvinylidene fluoride were mixed in 10 mL N-methyl-2-pyrrolidone (NMP). The solution was vigorously stirred magnetically at 80 °C until the NMP evaporated. The mixture was then ground and calcined at 500 °C for 4 h under a N2 atmosphere to obtain the final carbon-coated and fluorine-doped KNb3O8 powder. The pristine and coated samples were named as KNO and KNO@F–C, respectively.
2.2 Material characterization
The crystal structures of the materials were investigated by X-ray diffraction (XRD) spectroscopy on a PANalytical Xpert3 powder X-ray diffractometer with Cu-Kα radiation. The samples were scanned in the 2θ range of 5–70° at a step size of 0.02626°. A Renishaw Qontor instrument (Renishaw Plc, UK), running WiRe (version 5.3) was used to record the Raman spectra. A 532 nm solid-state laser was used through a 20× lens with a maximum nominal power of 50 mW in normal confocality mode.Scanning electron microscopy (SEM) images were collected on a Zeiss Merlin Schottkey FEG-SEM with a GEMINI II column. The acceleration voltage (or electron high tension, EHT), working distance, and the probe current were noted on the respective image. High resolution transmission electron microscopy (HRTEM) images were taken on FEI Glacios 200 kV cryo-TEM, using a Ceta-D 4k × 4k CMOS detector and the TEM grids were lacey-carbon-film-coated copper TEM grid mesh (400 squares per inch). For selected-area electron diffraction (SAED) images, a 40 μm or 100 μm aperture was used to exclude anything but the particle of interest.
A Kratos Axis Ultra DLD electron spectrometer with a monochromated Al Kα source operating at 150 W was used to obtain the X-ray photoelectron spectrum (XPS). While individual photoelectron lines were measured at 20 eV, wide spectra were acquired with an analyser pass energy of 160 eV. Spectral processing was performed using Kratos software. N2 adsorption–desorption measurements were conducted on a Micromeritics TriStar 3000 porosimeter. The isotherms were recorded at −196 °C after the samples had been outgassed at 120 °C for 3 h. The specific surface areas were collected by the Brunauer–Emmett–Teller (BET) method and the pore volumes were calculated from the desorption isotherms. The pore size distributions were estimated using the Barret, Joyner and Halenda (BJH) algorithm with the ASAP-2010 software.
2.3 Electrochemical characterisation
The electrochemical tests were carried out using CR-2032 coin-type half-cells assembled in an argon-filled glove box (MBraun-MB10 – compact) with O2 and H2O levels <0.5 ppm. All the electrodes were prepared by mixing the active material (80% w/w), Super P (Thermo Scientific) (15% w/w), and sodium carboxy methyl cellulose (CMC – MedChemExpress) (5% w/w) binder in deionized water. The mixed slurry was coated onto the surface of a copper foil (TMAXCN; 14 mm diameter, 0.1 mm thick) current collector and then dried at 50 °C. The loading amount of electrode was approximately 2–3 mg cm−2.A glass microfiber filter (Whatman, Grade GF/F; 19 mm diameter) was used as the separator and 1 M NaClO4 (Thermo Scientific) in ethylene carbonate (EC, from AmBeed) and dimethyl carbonate (DMC, from TCI; 1:1 v/v) was used as the electrolyte. Coin cells were fabricated using sodium metal as the counter/reference electrode. Cyclic voltammetry (CV) curves at different scan rates and electrochemical impedance spectroscopy (EIS) in the frequency range of 10 mHz to 1 MHz were recorded using a Gamry 1010E interface workstation. A NEWARE CT-4008 battery tester was used to record the galvanostatic charge–discharge curves in a voltage window of 0.01–2.5 V (vs. Na+/Na). All the electrochemical measurements were performed at 20 °C.
For ex situ XRD characterization, the CR-2032 coin-type cells were disassembled inside the argon-filled glove box with O2 and H2O levels <0.5 ppm after charged/discharged at selected voltages. The recovered electrodes were then washed with the DMC solvent to remove electrolyte and dried in the glove box for 5 h.
3. Results and discussion
The KNO material was prepared via a simple solid-state synthesis, and the crystal structures of the samples were confirmed by X-ray diffraction analysis (Fig. 1a). The diffraction peaks are successfully assigned to KNb3O8 orthorhombic phase with an Amam space group (COD#: 100-1208).10 Here, it is clear that the XRD pattern of the KNO@F–C sample matches the pattern of the pristine sample, KNO, even after carbon-coating and fluorine-doping without disturbing the crystal orientation and composition. Also, it does not contain any carbon diffraction peak probably due to the amorphous nature of carbon. Further, Fig. 1b shows the layered structure of KNb3O8 material which consists of NbO6 octahedra units, connected by the oxygen atoms, with an interlayer of potassium ions.10 Thus, the presence of larger K+ ions (ionic radius: 1.38 Å) facilitates the de/intercalation of Na+ ions (ionic radius: 1.02 Å) through the unique structure of KNb3O8 material during the charging/discharging. Raman spectra (Fig. 1c) of both samples are further investigated to analyse the structure in-depth. The bands observed at the wave numbers 952.5, 922.1, 896.3 and 851.6 cm−1 correspond to the stretching modes of short Nb–O bonds. The bands occurring between 658.8 and 571.9 cm−1 are assigned to the stretching vibrations of longer Nb–O bonds (antisymmetric stretching) present in the NbO6 octahedra.15 Further, the band at 454.9 cm−1 corresponds to the E-mode of Nb–O–Nb bending modes. Those bands observed at 351.3 and 324 cm−1 are assigned to the E-mode, which corresponds to the deformation in the NbO6 framework. Finally, the bands occurring between 249.2 and 178.9 cm−1 can be attributed to the Nb–O framework.15 In addition to these, two strong peaks at ca. 1350 and 1580 cm−1 are observed particularly in the KNO@F–C composite material (Fig. 1c), which are attributed to the D and G bands of disordered carbon and ordered graphitic carbon, respectively.14 The ratio (ID/IG) of these peaks is found to be ca. 0.8, which indicates that the KNO@F–C material exhibits a significant number of extrinsic defects after coating with carbon and doping with fluorine. However, no such signals are found in the pristine sample, KNO, consistent with the lack of carbon in that sample. | ||
| Fig. 1 (a) XRD patterns of KNO and KNO@F–C materials, (b) structure of KNb3O8, and (c) Raman spectra of KNO and KNO@F–C materials. | ||
The morphology and microstructure of the KNO and KNO@F–C materials were examined via SEM and TEM imaging (Fig. 2). Both materials feature micron-sized particles; however, the KNO@F–C material exhibits a more uniform particle size distribution after carbon-coating and fluorine-doping. TEM images (Fig. 2b and e) show that the surface modification does not alter the morphology of the KNO@F–C material. High-resolution TEM (HRTEM) images further reveal the lattice fringes in both materials (Fig. 2c and f), confirming their crystalline nature. Additionally, a thin amorphous layer around the KNO active particles in the KNO@F–C material (Fig. 2f) suggests successful embedding and decoration of the base material with the fluorine-doped carbon matrix. The selected area electron diffraction (SAED) pattern shows that both KNO (inset, Fig. 2c) and KNO@F–C (inset, Fig. 2f) have preferred crystal orientations. The EDX elemental mapping further confirms the uniform distribution of K, Nb, and O in the KNO base material (Fig. S1†), and the additional elements C and F in the KNO@F–C material (Fig. 2h–l).
 | ||
| Fig. 2 SEM, TEM and HRTEM images of KNO (a–c), and KNO@F–C materials (d–f) (inset: SAED pattern), and (g–l) electron diffraction X-ray spectroscopy (EDX) images of KNO@F–C material. | ||
XPS analysis was employed to investigate the surface properties and valence states of both KNO and KNO@F–C materials. Fig. 3a presents the XPS survey spectra, confirming the presence of K, Nb, and O in both materials, while F and C are detected in the coated material. A high-resolution K 2p XPS spectrum reveals peaks at binding energies of 293.1 and 295.9 eV, attributed to K 2p3/2 and K 2p1/2 in both samples (Fig. S2a† and 3b).16 Additionally, the high-resolution C 1s XPS spectrum for the coated sample exhibits six prominent peaks at binding energies of 284.6, 285.9, 287.1, 288.3, 289.9 and 291.4 eV (Fig. 3b), which are assigned to C–C, C–O, C–O–C/C–OH, O–C![[double bond, length as m-dash]](https://www.rsc.org/images/entities/char_e001.gif) O, C–F and C–F2 respectively.13,17 The Nb 3d spectrum (Fig. 3c and S2b†) shows two main peaks at 207.5 and 210.2 eV that correspond to Nb 3d5/2 and Nb 3d3/2, respectively, confirming the presence of Nb5+ in both samples.14 However, two additional weak peaks at 206.4 and 209.1 eV are observed in the KNO sample, possibly due to the co-existence of Nb4+ 3d5/2 and 3d3/2.18
O, C–F and C–F2 respectively.13,17 The Nb 3d spectrum (Fig. 3c and S2b†) shows two main peaks at 207.5 and 210.2 eV that correspond to Nb 3d5/2 and Nb 3d3/2, respectively, confirming the presence of Nb5+ in both samples.14 However, two additional weak peaks at 206.4 and 209.1 eV are observed in the KNO sample, possibly due to the co-existence of Nb4+ 3d5/2 and 3d3/2.18
 | ||
| Fig. 3 (a) XPS survey spectra of KNO and KNO@F–C materials, (b) K 2p and C 1s, (c) Nb 3d, (d) O 1s, and (e) F 1s spectra of KNO@F–C material, (f) N2-adsorption and desorption isotherm, and (g) pore size distribution of KNO and KNO@F–C materials. | ||
In the KNO@F–C material, a broad oxygen, O 1s peak (Fig. 3d) is deconvoluted into three peaks at 530.8, 532.5 and 533.6 eV, corresponding to Nb–O, C–OH/C–O–C and CO bonds, respectively.19 No CO bond is found in the undoped KNO material (Fig. S2c†), as it lacks carbon. Finally, the F 1s high-resolution spectrum (Fig. 3e) in the coated material features three peaks at 684.9, 687.1 and 689 eV, attributed to Nb–F, C–F and C–F2 bonds, respectively.14,17 This confirms that fluorine is predominantly bonded with KNO particles along with carbon. These findings demonstrate that F-doping and C-coating are successfully achieved with the PVDF as a source of both fluorine and carbon.
Furthermore, the N2 adsorption–desorption isotherm (Fig. 3) was analysed to determine the specific surface area and pore size distribution of KNO and KNO@F–C materials. The KNO@F–C sample (Fig. 3f) exhibits a type-IV isotherm with a hysteresis loop at high P/Po, indicating the presence of an extensive mesoporous structure due to the addition of carbon and fluorine.13 In particular, the BET specific surface area (SBET) of the coated material is found to be 52.04 m2 g−1 which is approximately ten times higher than that of the pristine material, KNO (5.38 m2 g−1). In addition, the pore volumes of KNO and KNO@F–C materials are found to be 0.06 and 0.14 cm3 g−1 respectively, suggesting the availability of abundant active sites in the coated material. The BJH mean pore diameters of KNO and KNO@F–C materials (Fig. 3g) are found to be 45 and 10 nm respectively. Thus, the pore volume and surface area of KNO@F–C material can be significantly increased by adding PVDF, a source of carbon and fluorine, to the KNO active particles. This results in, enhanced wettability of the electrode material by the liquid electrolyte, shortening the diffusion path of Na+ ions, and reducing polarization in the electrode material, ultimately improving the overall performance of the coated material.
The cyclic voltammogram curves of the first three cycles for each prepared electrode are shown in Fig. 4. Cathodic peaks in the KNO electrode (Fig. 4a) appear at voltages of 1.03, 0.85, and 0.59 V vs. Na/Na+, corresponding to Na+ insertion, while anodic peaks appear at 0.86, 0.98 and 1.49 V vs. Na/Na+, corresponding to Na+ extraction. Hence, the redox couples are 1.03/1.49 V, 0.85/0.98 V and 0.59/0.86 V vs. Na/Na+ for Na+ insertion and extraction, respectively. After the first cycle the reduction peak at 0.73 V shifts to the higher potential side (0.85 V), indicating that the electrode exhibits reduced resistance.10 On the other hand, these peaks are much broader in the case of KNO@F–C sample (Fig. 4b) which may be due to the carbon-coating and fluorine-doping. Further, the second and third cycles in both electrodes overlap well, suggesting improved electrochemical performance in the KNO samples. Thus, the KNO samples, as the anode material, react reversibly with the Na+ in SIBs. Further, the initial three charge–discharge cycles at a current density of 10 mA g−1 (Fig. 4c and d) demonstrate the electrochemical performance of both samples. The uncoated sample, KNO, exhibited initial discharge and charge specific capacities of 185.6, 128.5 mA h g−1 respectively, while the coated sample delivered enhanced discharge–charge capacities of 234.2 and 147.8 mA h g−1 with an initial coulombic efficiency of 63% compared to the pristine material (69%). The irreversible capacity loss is due to the solid–electrolyte interface (SEI) layer formation or degradation of liquid electrolyte in the first cycle for both samples, and the loss is higher in the case of the KNO@F–C sample, which may be due to the ability of carbon to absorb more liquid electrolyte, increasing the resistance at the SEI layer.20 However, the samples achieve high reversible discharge capacities of 140 and 173 mA h g−1 for KNO and KNO@F–C, respectively, which correspond to more than 92% coulombic efficiency from the second cycle, indicating stable electrochemical reversible kinetics. To better understand the Na+-ion insertion/extraction behaviour, an ex situ XRD measurement is performed using the coin-type cell as described in the experimental section. The standard Cu peaks are observed at 2θ values of 43.37° and 50.49° (Fig. S3†). Further, the changes in the crystal structure of both KNO (Fig. S3†) and KNO@F–C (Fig. 4e) electrodes are analyzed during the charge/discharge process at (i) a fully charged state (2.5 V), (ii) discharged to 1 V and (iii) discharged to 0.01 V vs. Na+/Na at a current density of 10 mA g−1. As shown in the Fig. 4e, during the discharging process from 2.5 V to 0.01 V, the diffraction peak (020) shifts to a higher angle (inset of Fig. 4e) indicating the shrinkage of crystal structure along the b-direction. On the other side, the shifting of the diffraction peak (002) to a lower angle indicates the expansion of crystal structure along the c-direction during Na+-ion insertion process.10 Similar behaviour is observed in the KNO electrode (Fig. S3†) and thus it is clear that both KNO and KNO@F–C electrodes reversibly react with the sodium during the charge–discharge processes.
 | ||
| Fig. 4 Cyclic voltammetry of (a) KNO and (b) KNO@F–C materials at a scan rate of 0.2 mV s−1, and galvanostatic charge–discharge curves of (c) KNO and (d) KNO@F–C materials at a current density of 10 mA g−1, for the first three cycles, and (e) ex situ XRD patterns of KNO@F–C electrode at various charge/discharge states (inset: enlarged view of (020) and (002) diffraction peaks). | ||
The rate performance of KNO and KNO@F–C samples at various current densities is depicted in Fig. 5a. The pristine sample, KNO, displayed discharge specific capacities of 140, 132, 124, 111, 89, 59, 47 and 35 mA h g−1 at current densities of 10, 25, 50, 100, 200, 500, 1000 and 2000 mA g−1, respectively. On the other hand, KNO@F–C delivered enhanced discharge capacities of 173, 169, 164, 155, 137, 100, 75 and 47 mA h g−1, respectively, at the same current densities. As expected, the coated sample showed a higher rate capability compared to that of the undoped sample at every current rate due to the incorporation of F and C, which surround the KNO active particles. The KNO@F–C electrode, with the presence of some defects, offers more redox active sites for the Na+ storage.13 In particular, at higher current densities, the fluorine doped carbon matrix around the KNO active particles can accommodate the volume change during cycling and release the strain from KNO electrode. The embedded F–C layer also acts as a buffer zone to reduce the polarization during Na+-ion insertion and extraction processes.13
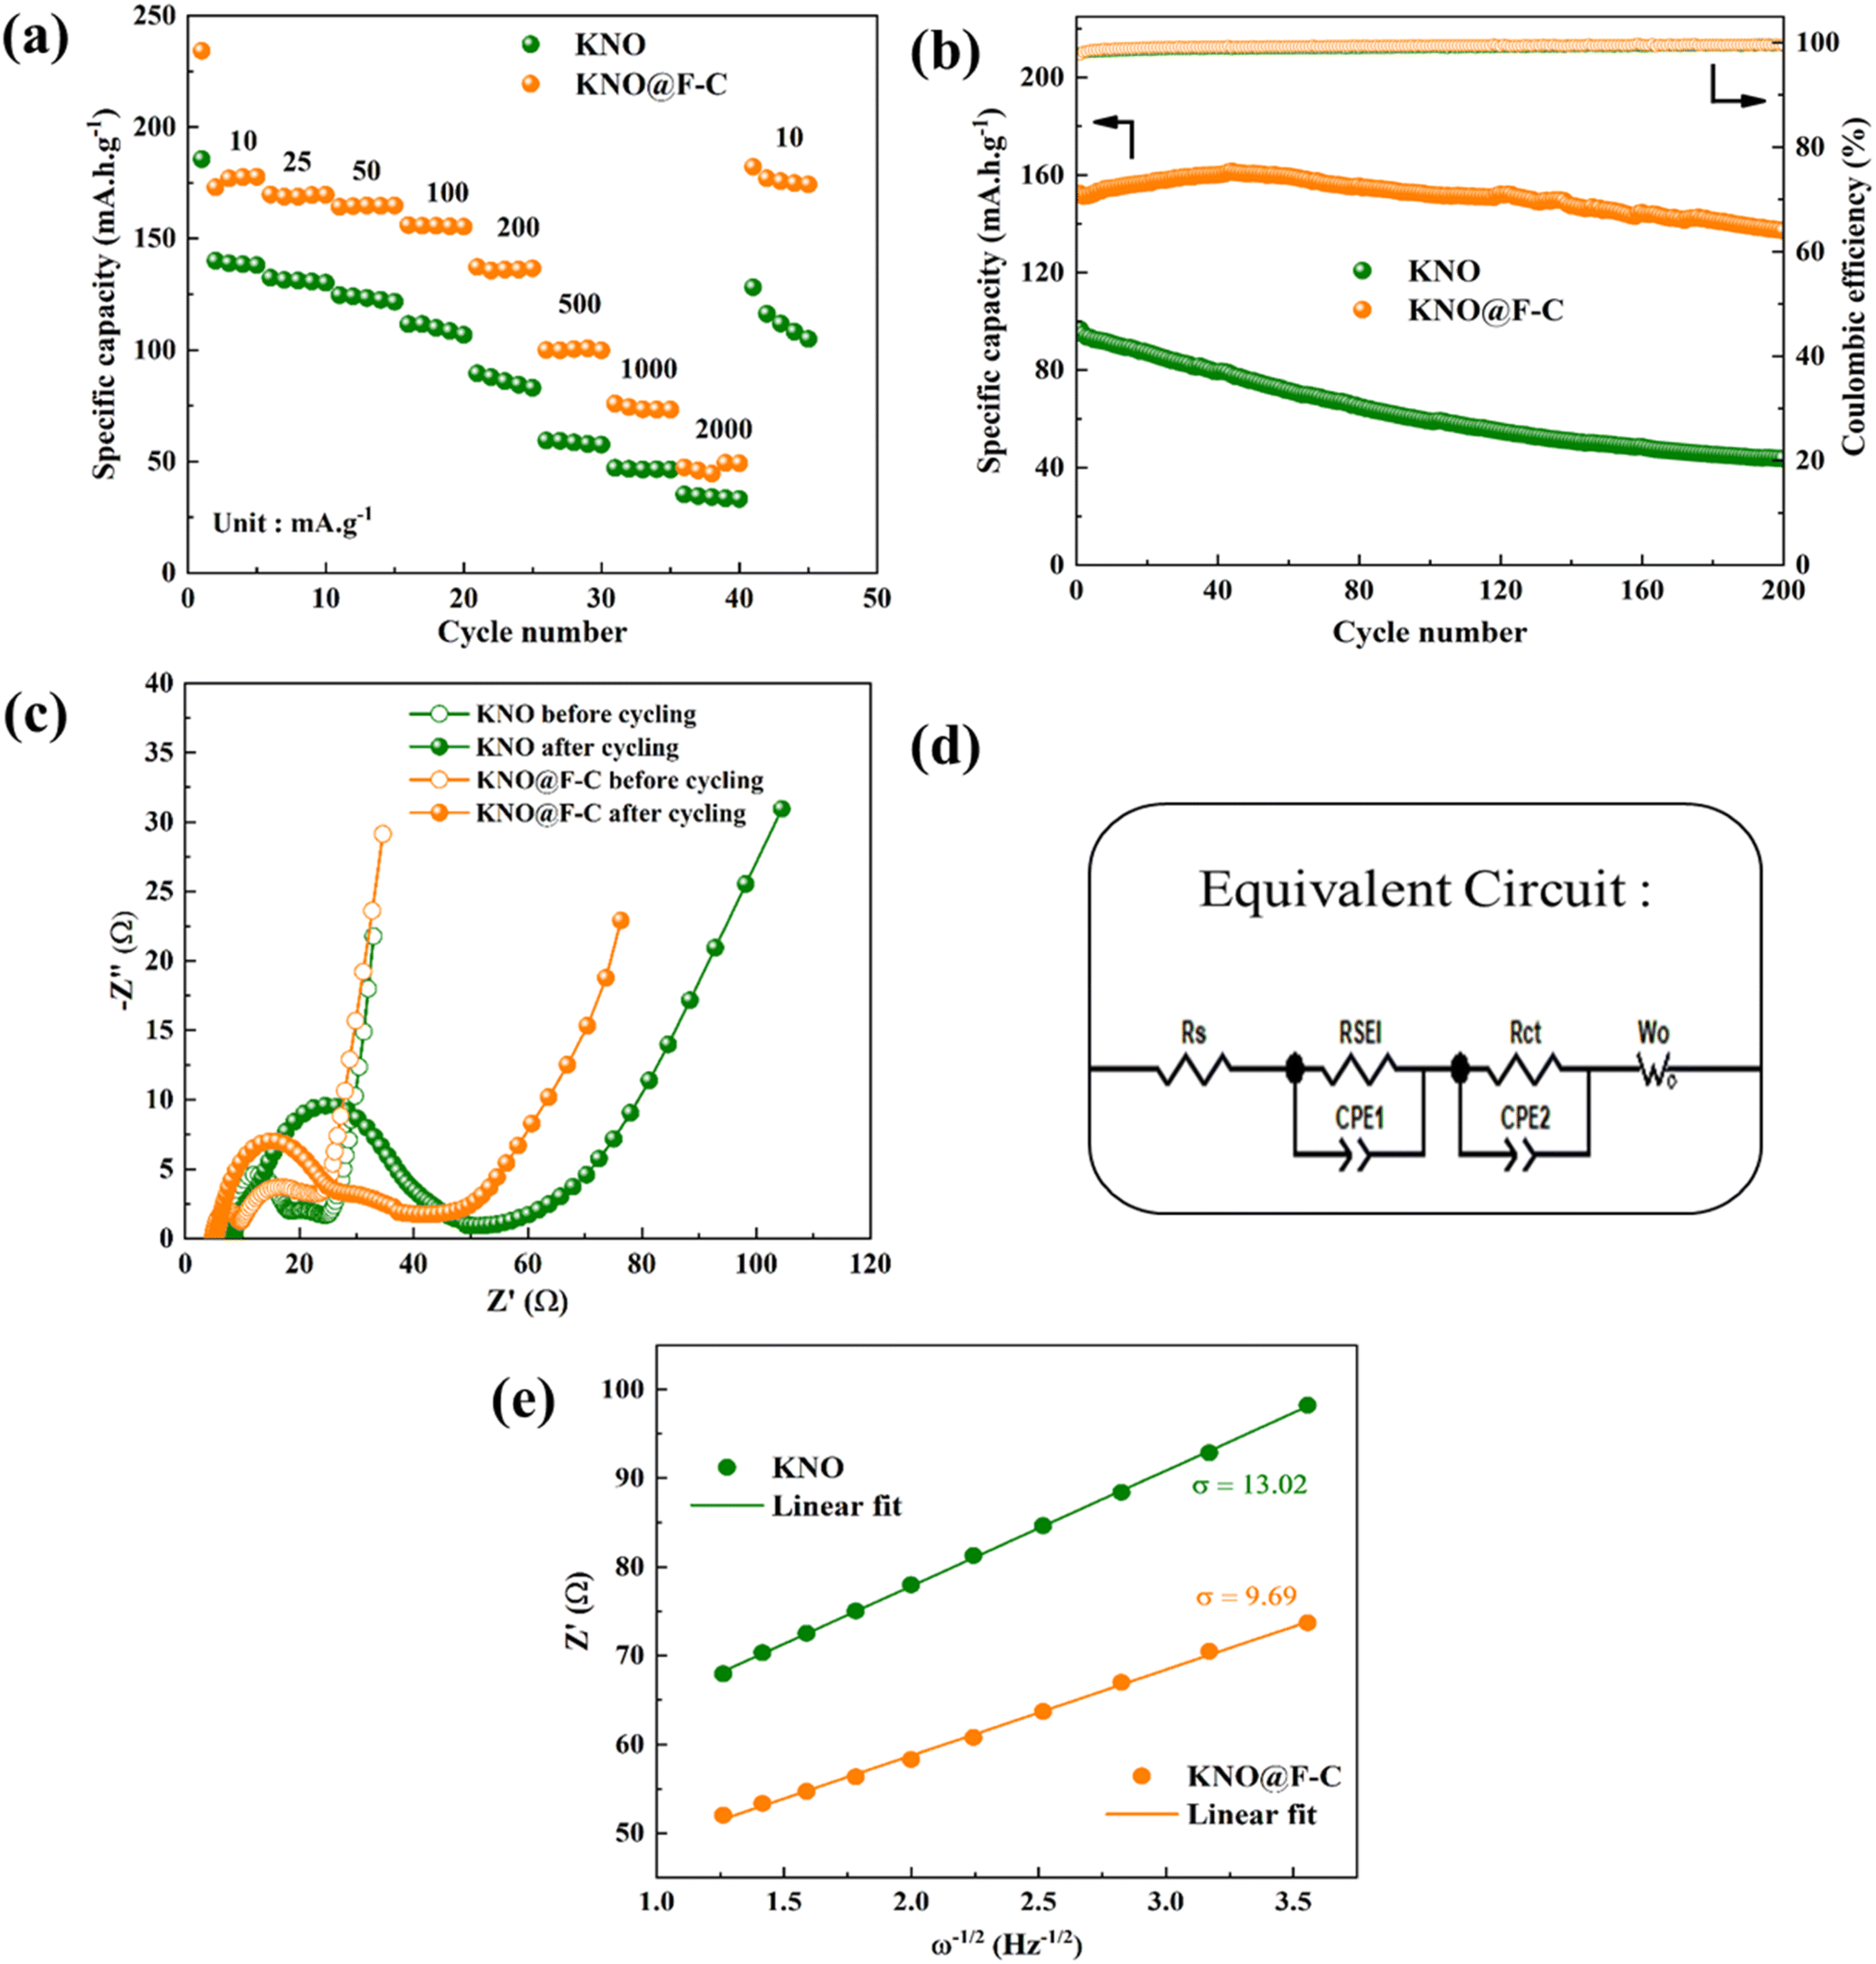 | ||
| Fig. 5 (a) Rate performance at various current densities, (b) cycling stability at a current density of 200 mA g−1, (c) Nyquist plots (before and after cycling), (d) equivalent circuit and (e) fitting curves of Z′ and ω−1/2 at a low frequency region of KNO and KNO@F–C materials. | ||
Furthermore, the uncoated sample displayed only a discharge capacity of 128 mA h g−1, when the current rate was reverted to the initial value (10 mA g−1) which corresponds to only 91% capacity recovery. Meanwhile, the carbon-coated and fluorine-doped sample, KNO@F–C, exhibited more than 100% capacitance recovery (182 mA h g−1) even after reverting to the initial current rate indicating its considerable stability and better reversibility. In addition, Fig. 5b shows long-term cycling stability of both materials at a current density of 200 mA g−1 in the voltage range of 0.01 and 2.5 V. It is apparent from the figure that both samples show stable coulombic efficiencies (ca. 100%) during the cycling. However, the pristine sample, KNO, delivers a discharge capacity of 44 mA h g−1 only after 200 cycles with a capacity retention of 45%. The poor cycling performance is attributed to the increase in interfacial resistance formed by the reaction between organic electrolyte and the electrode which ultimately leads to the formation of an inactive interface layer.21 Conversely, a superior reversible capacity of 137 mA h g−1 is achieved by the coated sample, KNO@F–C, after 200 cycles which corresponds to a remarkable capacity retention of 90%. It is worth to mention here that the discharge specific capacity of KNO@F–C material is increased initially up to a few cycles and then starts decreased. It may be due to the reason that the F-doping can accelerate the decrease of the interfacial resistance in the battery. Also, more number of electrons can be attracted to an extent due to higher electronegativity of fluorine, and thus the electrical conductivity is increased.13 In addition, the mesoporous structure in the FC can not only act as the reservoirs for sodium ion storage, but also accelerate the transportation of Na+-ions and the electrons throughout the electrode matrix which resulted in the improved electrochemical kinetics. However, the specific capacity starts to decrease upon cycling once these active sites get stabilized after a few cycles. A strong electronic interaction between F-doped carbon layer and the KNO active particles, in addition to, a strong Nb–F bond are together responsible for a significant cycling stability. As a result, the coated F–C layer around the KNO bulk material may successfully prevent capacity fading during cycling in the KNO@F–C anode material, preserve its surface structure, and suppress the electrolyte–electrode reaction. Further, the electrochemical performance of the KNO and KNO@F–C electrodes are compared with some of the other anode materials in the literature (Table 1).
| Anode material | Preparation | Potential window (V vs. Na+/Na) | Reversible discharge capacity (mA h g−1) | Current density (mA.g−1) | Reference |
|---|---|---|---|---|---|
| a SASSR: solution-assisted solid-state reaction. | |||||
| Na2Ti3O7 | Hydrothermal | 0.01–2.5 | 126.2 | 100 | 22 |
| NaTiO2 | Solid-state reaction | 0.6–1.6 | 152 | C/10 | 23 |
| KNb3O8 | Solid-state reaction | 0.1–2.5 | 104 | 3 | 10 |
| TiNb2O7 | Ball milling | 0.01–2.5 | 180 | 15 | 12 |
| KNO | Solid-state reaction | 0.01–2.5 | 140 | 10 | This work |
| KNO@F–C | SASSRa | 0.01–2.5 | 173 | 10 | This work |
Electrochemical impedance spectroscopy was used to analyse the rate and cycling performance of KNO and KNO@F–C samples before and after 20 cycles of charge and discharge (Fig. 5c). The equivalent circuit used to fit the Nyquist plots (Fig. 5d) includes the solution resistance (Rs), SEI layer resistance (RSEI), and charge transfer resistance (Rct).24 For the KNO electrode, the Rs, RSEI, and Rct values before cycling were 5.8, 6.9, and 11.1 Ω, respectively, whereas the coated sample had the resistance values of 4.9, 4.4, and 11.0 Ω. The SEI layer thickness increases during cycling, a common phenomenon, with RSEI reaching 10.1 Ω and 28.5 Ω for the pristine and coated samples, respectively. Here, a significant increase in RSEI value in the case of KNO@F–C material is expected as the SEI layer thickness on the electrode surface is increased during the cycling. This may be due to the carbon coating in the KNO@F–C material, which has a large specific surface area, as evident from Fig. 3f. However, a smaller charge transfer resistance of 16.1 Ω is found for the coated sample, after cycling, compared to that of the uncoated one (38.9 Ω). As a result, the carbon-coated and fluorine-doped sample, KNO@F–C, can achieve an improved interfacial charge transfer capability, which is beneficial for its high and consistent rate performance and exceptional cycling stability in the electrode material.
The charge transfer resistance, the electrochemical rate performance and enhanced cycling stability are closely related to the Na+-ion diffusion coefficient, DNa+ and can be calculated using eqn (1),25
 | (1) |
484 C mol−1, n, A, σ and C represent the number of transferred electrons, the effective working area of the electrode, the slope of Z′ vs. ω−1/2 (shown in Fig. 5e) and the Na+-ion concentration, respectively. Using eqn (2),26| Z′ = Rs + RSEI + Rct + σω−1/2 | (2) |
The CV plots of the KNO and KNO@F–C materials at various scan rates are shown in Fig. 6a and b. Here, the anodic and cathodic peak currents increase as the scan rate increases, for both materials, and the better symmetry of the redox peaks indicates that the electrodes exhibit better reversibility. In addition, a slight increase in the oxidation potential, and a slight decrease in the reduction potential for redox couple show that smaller polarization in both electrode materials.28 The power law relationship is used to further investigate the electrode kinetics in both materials (eqn (3)),29
| ip = aνb | (3) |
| log(ip) = log(a) + blog(ν) | (4) |
| i(V) = k1ν + k2ν1/2 | (5) |
 | ||
| Fig. 6 Cyclic voltammogram at various scan rates for (a) KNO and (b) KNO@F–C materials, (c) plot of logarithm of scan rate vs. logarithm of peak current of KNO and KNO@F–C materials, (d) CV curve showing the diffusive and capacitive contribution at 0.4 mV s−1 scan rate, and (e) percentage contribution of diffusive and capacitive processes at various scan rates for KNO@F–C material. | ||
4. Conclusion
In summary, a layered potassium niobate anode material is successfully prepared via a simple solid-state reaction. The material is then modified with fluorine-doping and carbon-coating, using PVDF as an effective source. The modification of the KNO electrode material further enhances the structural stability and electronic conductivity by forming a strong bond between the KNO active particles and the F-doped carbon. Consequently, the coated material exhibited a high reversible capacity of 173 mA h g−1 at a current density of 10 mA g−1, compared to the base material. Furthermore, superior rate performance is recorded for the KNO@F–C material at every current density, and a capacitance recovery rate exceeding 100% is achieved when the current density is returned to its initial value. Finally, the KNO@F–C anode material delivered a high-capacity retention of 90% over 200 cycles compared to the pristine material (45%) due to its large specific surface area and a high Na+-ion diffusion coefficient. Overall, these findings show that the surface-modified KNO@F–C material is a promising option as an effective anode material for Na-ion battery applications.Data availability
Any data that support the finding of this study are included within the article and also included as a part of the ESI.†Author contributions
Y. Bhaskara Rao: investigation, methodology, conceptualization, formal analysis, data curation, writing-original draft. C. André Ohlin: validation, supervision, resources, visualization, funding acquisition, writing-review & editing, project administration.Conflicts of interest
The authors declare no competing financial interest.Acknowledgements
Authors thank the Kempe foundation (JCSMK22-0094) for financial support and acknowledge the facilities and technical assistance of the Umeå Core Facility Electron Microscopy (UCEM) at the Chemical Biological Centre (KBC), Umeå University, SWEDEN.References
- F. Xin and M. S. Whittingham, Electrochem. Energy Rev., 2020, 3, 643–655 CrossRef CAS
.
- T. F. Yi, H. M. K. Sari, X. Li, F. Wang, Y. R. Zhu, J. Hu, J. Zhang and X. Li, Nano Energy, 2021, 85, 105955 CrossRef CAS
- F. Mizuno, S. Nakanishi, Y. Kotani, S. Yokoishi and H. Iba, Electrochemistry, 2010, 78, 5 CrossRef
- N. Kamaya, K. Homma, Y. Yamakawa, M. Hirayama, R. Kanno, M. Yonemura, T. Kamiyama, Y. Kato, S. Hama, K. Kawamoto and A. Mitsui, Nat. Mater., 2011, 10, 682–686 CrossRef CAS PubMed
- G. G. Amatucci, F. Badway, A. Singhal, B. Beaudoin, G. Skandan, T. Bowmer, I. Plitz, N. Pereira, T. Chapman and R. Jaworski, J. Electrochem. Soc., 2001, 148, A940 CrossRef CAS
- M. He, S. Liu, J. Wu and J. Zhu, Prog. Solid State Chem., 2024, 74, 100452 CrossRef CAS
- R. Li, X. Qin, X. Li, J. Zhu, L. R. Zheng, Z. Li and W. Zhou, Adv. Energy Mater., 2024, 14, 2400127 CrossRef CAS
- C. Wu, Y. Yang, Y. Zhang, H. Xu, X. He, X. Wu and S. Chou, Chem. Sci., 2024, 15, 6244–6268 RSC
- E. M. Reynolds, J. Fitzpatrick, M. O. Jones, N. Tapia-Ruiz, H. Y. Playford, S. Hull, I. McClelland, P. J. Baker, S. A. Cussen and G. E. Pérez, J. Mater. Chem. A, 2024, 12, 18469–18475 RSC
- H. Nakayama, M. Nose, S. Nakanishi and H. Iba, J. Power Sources, 2015, 287, 158–163 CrossRef CAS
- S. Lou, Y. Zhao, J. Wang, G. Yin, C. Du and X. Sun, Small, 2019, 15, 1904740 CrossRef CAS PubMed
- Y. Huang, X. Li, J. Luo, K. Wang, Q. Zhang, Y. Qiu, S. Sun, S. Liu, J. Han and Y. Huang, ACS Appl. Mater. Interfaces, 2017, 9, 8696–8703 CrossRef CAS PubMed
- X. Wang, Z. Feng, X. Hou, L. Liu, M. He, X. He, J. Huang and Z. Wen, Chem. Eng. J., 2020, 379, 122371 CrossRef CAS
- X. Ji, Y. Yang, Y. Ding, Z. Lu, G. Liu, Y. Liu, J. Song, Z. Yang and X. Liu, J. Phys. Chem. C, 2022, 126, 7799–7808 CrossRef CAS
- B. Yu, B. Cao, H. Cao, X. Zhang, D. Chen, J. Qu and H. Niu, Nanotechnology, 2013, 24, 085704 CrossRef PubMed
- P. Kongsong, M. Masae and A. Jeenarong, Dig. J. Nanomater. Biostructures, 2018, 13, 459–464 Search PubMed
- J. W. Lee, S. P. Jeong, N. H. You and S. Y. Moon, Nanomaterials, 2021, 11, 942 CrossRef CAS PubMed
- T. Onozato, T. Katase, A. Yamamoto, S. Katayama, K. Matsushima, N. Itagaki, H. Yoshida and H. Ohta, J. Phys.:Condens. Matter, 2016, 28, 255001 CrossRef PubMed
- X. Qu, Y. Liu, B. Li, B. Xing, G. Huang, H. Zhao, Z. Jiang, C. Zhang, S. W. Hong and Y. Cao, J. Mater. Sci., 2020, 55, 13062–13074 CrossRef CAS
- L. A. Ma, A. J. Naylor, L. Nyholm and R. Younesi, Angew. Chem., Int. Ed., 2021, 60, 4855–4863 CrossRef CAS PubMed
- F. Zheng, Q. Deng, W. Zhong, X. Ou, Q. Pan, Y. Liu, X. Xiong, C. Yang, Y. Chen and M. Liu, ACS Sustain. Chem. Eng., 2018, 6, 16399–16411 CrossRef CAS
- Z. Chen, L. Lu, N. Li and C. Sun, ChemElectroChem, 2019, 6, 3085–3090 CrossRef CAS
- D. Wu, X. Li, B. Xu, N. Twu, L. Liu and G. Ceder, Energy Environ. Sci., 2015, 8, 195–202 RSC
- Y. Zhuang, W. Zhang, Y. Bao and M. Guan, J. Alloys Compd., 2022, 898, 162848 CrossRef CAS
- A. P. Nowak, P. Rutecki, M. Szkoda and K. Trzciński, Energies, 2024, 17, 3233 CrossRef CAS
- Y. Wei, S. Zhu, J. Bai, X. Ma, B. Zhao, X. Zhu, Z. Zi and J. Dai, Int. J. Electrochem. Sci., 2020, 15, 9081–9087 CrossRef
- Z. He, Y. Huang, H. Liu, Z. Geng, Y. Li, S. Li, W. Deng, G. Zou, H. Hou and X. Ji, Nano Energy, 2024, 129, 109996 CrossRef CAS
- B. He, J. Cunha, Z. Hou, G. Li and H. Yin, J. Colloid Interface Sci., 2023, 650, 857–864 CrossRef CAS PubMed
- Y. B. Rao, Y. Saisrinu, S. Khatua, K. K. Bharathi and N. Patro, J. Alloys Compd., 2023, 968, 171917 CrossRef CAS
- Y. B. Rao, K. R. Achary and L. N. Patro, ACS Omega, 2022, 7, 48192–48201 CrossRef PubMed
- S. Li, J. Qiu, C. Lai, M. Ling, H. Zhao and S. Zhang, Nano Energy, 2015, 12, 224–230 CrossRef CAS
Footnote |
| † Electronic supplementary information (ESI) available. See DOI: https://doi.org/10.1039/d5se00071h |
| This journal is © The Royal Society of Chemistry 2025 |