
 Open Access Article
 This Open Access Article is licensed under a
 Creative Commons Attribution 3.0 Unported Licence
Recent advances in in situ/operando characterization of lithium–sulfur batteries
Thomas J. Leckie
 ab,
Stuart D. Robertson
a and
Edward Brightman
*b
ab,
Stuart D. Robertson
a and
Edward Brightman
*b
aDepartment of Pure & Applied Chemistry, University of Strathclyde, Glasgow, G1 1XL, UK
bDepartment of Chemical & Process Engineering, University of Strathclyde, Glasgow, G1 1XJ, UK. E-mail: edward.brightman@strath.ac.uk
First published on 4th September 2024
Abstract
The lithium–sulfur battery (LSB) is a next generation energy storage technology with potential to replace lithium-ion batteries, due to their larger specific capacity, cheaper and safer manufacturing materials, and superior energy density. LSBs are a rapidly progressing topic globally, with around 1800 publications each year and the market is expected to exceed 1.7 billion USD by 2028, as such many novel strategies are being explored to develop and commercialise devices. However, significant technical challenges must be solved to engineer LSBs with commercially viable cycle life, which requires a deeper understanding of the chemical mechanisms occurring within the battery structure. In recent years in situ/operando testing of LSBs has become a popular approach for deciphering the kinetics and mechanisms of their discharge process, which is notoriously complex, and visualising the effects of mass deposition onto the electrodes and how these factors affect the cell's performance. In this review, in situ and operando studies are discussed in the context of LSBs with particular focus on spectroscopic and morphological techniques in line with trends in the literature. Additionally, some techniques have been covered which have yet to be used widely in the literature but could prove to be invaluable tools for analysis in the future. These in situ/operando techniques are becoming more widely available, and a review is useful both for the research community and industry to help accelerate the commercialisation of this next-generation technology.
 Thomas J. Leckie | Thomas J. Leckie is a postgraduate research student jointly supervised between the Chemical Engineering and Chemistry departments at University of Strathclyde. He is investigating lithium solid–electrolyte interphase formation in polysulfide electrolytes for novel flow battery applications, and previously held a prestigious Carnegie Trust Vacation Scholarship. He received a MSci in Applied Chemistry and Chemical Engineering from the University of Strathclyde in 2023. |
 Stuart D. Robertson | Stuart D. Robertson is a Senior Lecturer in the department of Pure and Applied Chemistry at University of Strathclyde. His research focuses on the s-block metals and the novel chemistry that can be obtained by pairing them together or with other high-abundance, environmentally benign metals of the d- and p-block, with a particular focus on their use as battery electrolytes. |
 Edward Brightman | Edward Brightman is a Lecturer in the Chemical and Process Engineering department at University of Strathclyde with a background in diagnostics and characterisation of flow batteries, hydrogen fuel cells and electrolysers. He leads the Electrochemical Engineering research group with projects covering low-cost flow batteries for stationary energy storage, fuel cell membrane quality control, and hydrogen production from electrolysis of waste biomass feedstocks. |
1 Introduction
1.1 What are lithium–sulfur batteries?
The climate crisis, and subsequent push for green energy generation and storage, has led to the rapid advancement of battery technologies. The lithium–sulfur battery (LSB) is a next-generation battery technology that boasts a theoretical energy density of 2500 W h kg−1 and a practical energy density of ∼500 W h kg−1 which is almost double the amount possible from state-of-the-art lithium-ion batteries (LIB).1–3 Furthermore, the components of the LSB are cheaper and more sustainable than LIBs (which rely on nickel, cobalt, and manganese) making them a promising and desirable alternative chemistry.4 Additionally, the LSB market has grown by over 27% in 2023 with the market size estimated to reach 1.72 billion USD by 2028 making this a lucrative field for industry as well as academia.5 The most common configuration of an LSB has a lithium metal anode and usually a sulfur/graphite composite or intercalated cathode (Fig. 1(a)). Elemental sulfur cannot be used as a cathode material on its own due to its extremely low conductivity (5 × 10⁻³⁰ S cm−1).6 The electrolyte is usually composed of an ether-based solvent, commonly 1,3-dioxolane (DOL) and 1,2-dimethoxyethane (DME), or tetraethylene glycol dimethyl ether (TEGDME), with a supporting electrolyte salt such as lithium bis(trifluoromethanesulfonyl)imide (LiTFSI) with lithium nitrate.6–8 As the battery discharges, elemental sulfur is reduced through a series of lithium polysulfide (LiPS) intermediates, initially to Li2S8 in the first voltage plateau (∼2.3 V) and subsequently in decreasing Sx2− (2 ≤ x ≤ 8) chain lengths through the second discharge plateau (∼2.1 V), until the insoluble Li2S species forms (Fig. 1(b)); however, although the mechanism for discharge has been studied extensively, it is still not entirely understood.1,9–11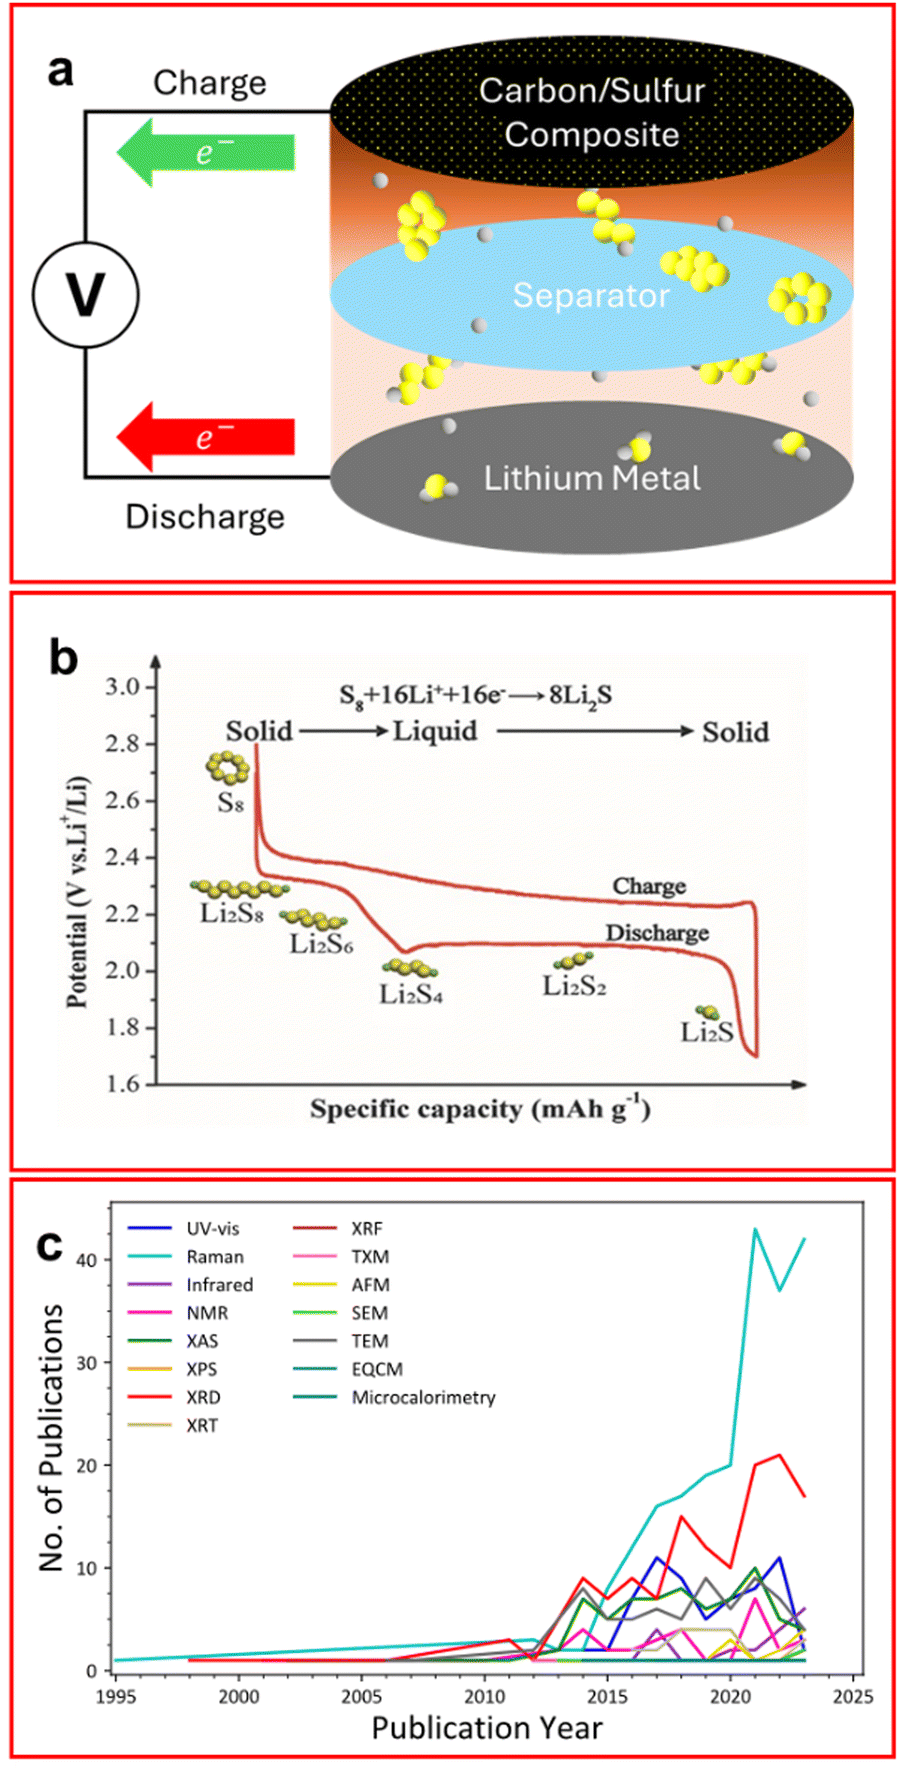 | ||
| Fig. 1 (a) Schematic of a traditional LSB configuration with sulfur (yellow) and lithium (grey) atoms in both elemental and LiPS forms; (b) typical voltage profile of an LSB showing two voltage profiles corresponding to the reduction of LiPS; (c) popularity of in situ/operando techniques with LSBs in published literature since 1995. (Search term: (ALL = (in situ X lithium sulfur)) NOT DT = (Review) NOT TI = (“Ex situ”), where X is the characterisation technique from Web of Science). ((b) Reproduced with permission from ref. 8, Copyright (2017) Wiley-VCH.) | ||
LSBs do have some major shortcomings which have been the focus of research in recent years, such as poor cyclability, low coulombic efficiency and reduced capacity compared to the theoretical value (1672 mA h g−1). A dominant cause of these problems is the so-called lithium polysulfide (LiPS) “shuttle”, where dissolved long-to-intermediate length LiPSs (Li2S4–8) can pass between the cathode and anode allowing Li2S to irreversibly deposit causing a loss of active material, with subsequent capacity degradation.6 This effect has been shown in Fig. 1(a) where elemental sulfur remains on the cathode side of the cell but soluble LiPS are able to migrate through the separator and form lower order Li2S on the anode surface.
There have been many proposed solutions to the LiPS shuttle such as binding agents employed on the cathode to prevent LiPS migration;12,13 using a redox flow battery configuration where LiPSs are the active material and are dissolved in solution;14 and employing different electrolyte formulations to make the transport of LiPS an unfavourable process.6 Each of these methods have been proven to mitigate the LiPS shuttle, or reduce the effect, thus improving the batteries’ performance. Many of these studies use in situ/operando techniques to provide a deeper understanding of the system beyond electrochemical performance and are discussed herein. Research on LSBs is a lucrative field with around 1800 publications each year focused on this topic, with this the output of the in situ/operando field of LSBs has accelerated sharply in the last decade (Fig. 1(c)).
Another issue with LSBs is the well-known instability of lithium metal which is commonly used as an anode. Lithium is known to form dendrites and dead lithium upon cycling,15 which result in poor cycle life and in extreme cases can cause safety issues such as short circuits. Controlling the lithium plating/stripping behaviour to avoid the formation of dendrites during charging and islands during stripping is an active and intensive topic of research and a key area of focus is the boundary layer between the lithium surface and the electrolyte, where a solid electrolyte interphase (SEI) is formed.16–18 The structure and composition of the SEI is complex and highly dependent on the electrolyte constituents, and it has been shown that the SEI can reduce dendrite formation as well as protect the lithium from LiPS shuttle attack, preventing self-discharge. Understanding SEI structure, formation and evolution during cycling is a critical area for successful LSB development, hence there is a need for a range of methods which can be used to fully characterise the surface of the electrodes during operation.
1.2 Why use in situ/operando techniques?
Many studies utilise ex situ, or post-mortem analyses, to understand chemical composition or morphology, and whilst these have benefits, they are limited in only being able to inform on one specific point in time and the conditions that the sample is in are likely to be completely different from the operating conditions (i.e. under mechanical or electrochemical load, in contact with electrolyte, etc.). In this review, the term “in situ” refers to a measurement taken directly in a cell which will require the electrochemical cycling to be paused, or altered, whereas “operando” refers to measurements taken in the cell which do not interrupt the cycling process (Table 1).19,20 In the literature it is not uncommon to find that other, slightly different, definitions of operando or in situ are used or that their usage overlaps, however, for consistency in this review we attempt to categorise the literature using our established definitions as outlined in Table 1, regardless of the terminology used in the original paper.| Method | Cell operable after sample | Measurement taken in cell | Cell in operation during measurement |
|---|---|---|---|
| Ex situ | No | No | No |
| In situ | Yes | Yes | No |
| Operando | Yes | Yes | Yes |
The nature of the conversion of elemental sulfur to Li2S is complicated due to the multi-phase processes and many different LiPS species that can exist,21 therefore, in situ/operando techniques are employed to decipher the processes occurring during charge–discharge cycling. In addition, the SEI layer can be studied in situ to see how it develops during the battery's life cycle. Utilising these methods provides researchers with a more quantitative method to characterise their LSBs.
1.3 In this review
In recent years the focus of incorporating in situ/operando techniques into electrochemical testing of LSBs has been associated with spectroscopic methods and these will form the bulk of this review. Some other methods such as gravimetric and topographical techniques are also discussed herein. However, some spectroscopic techniques such as electron paramagnetic resonance (EPR) have not been discussed, due to its use being mainly limited to information about radicals in LSBs,22,23 and electrochemical impedance spectroscopy (EIS) as this technique cannot be performed without pausing the charge–discharge process, and the current efforts on EIS in LSBs warrant their own review. The content of this review will mostly discuss articles published after 2020 since a review was published on this matter by Tian et al. in this year,9 and another review by Tan et al. published in 2017 was focused on in situ/operando characterisation of LSBs.10 Additionally, in an effort to maintain readability of this review, rather than comprehensively list all reported examples, only a few selected examples that showcase each technique are discussed in greater detail.Another topic of increasing interest in the LSB field is solid-state LSBs where a solid electrolyte is used instead of a liquid one. There are, in comparison to the traditional LSB configuration, relatively few papers on operando studies of solid-state LSBs. Therefore, the discussion of solid-state LSBs is limited to the techniques where this kind of battery is studied more often than traditional LSBs.
Each in situ/operando technique discussed herein covers a brief introduction to the technique, how it is used within the scope of LSBs and an examination of some of the novel materials tested in these research studies. The review summarises the broad toolkit available for research and development of LSBs and highlights the status of current knowledge from employing these techniques. The techniques covered in this review are organised into three distinct categories: spectroelectrochemical analysis, morphological and topographical analyses and other in situ/operando techniques.
2 Spectroelectrochemical analysis
The use of spectroscopy coupled with an electrochemical experiment is known as spectroelectrochemistry (SEC). The spectroscopies used in SEC can be varied but the more commonly found are ultraviolet-visible (UV-vis), Fourier transform infrared (FTIR), Raman, X-ray absorption spectroscopy (XAS), X-ray photoelectron spectroscopy (XPS) and nuclear magnetic resonance (NMR) spectroscopy, all of which are covered in this review.Most in situ/operando testing performed on the electrolyte is a form of SEC, although some forms of SEC are better suited to surface analysis. The geometry of an SEC cell is necessarily complicated due to the configuration of the electrodes required for optical access. While there are some examples of commercially available cells, these are often expensive and may not be specifically suited to the technique being used for investigation. Therefore, many researchers opt to use an in-house designed and custom-built cell hardware which is a time-consuming process. Since the spectroscopy type can have an impact on the geometry, it means that multiple SEC tests are difficult to obtain simultaneously.24 Another downside of SEC methods is that they typically cannot be performed with precision on systems charging or discharging at representative C-rates used for electrochemical testing. Often a very low C-rate must be adopted (<C/30) to make the electrolyte chemical composition pseudo-steady state allowing sufficient time for spectroscopic measurements to be made without the sample changing significantly as it is being measured.
2.1 UV-vis spectroscopy
In this technique, light in the ultraviolet to visible wavelength range (170–700 nm) is passed through a sample where certain wavelengths are absorbed by the sample due to excitation of electron energy levels in the target molecules. The relative intensity of the light transmitted (I) to the intensity of the incident radiation (I0) is used to calculate the absorbance (A) according to the Beer–Lambert Law A = −log(I/I0) = −log![[thin space (1/6-em)]](https://www.rsc.org/images/entities/char_2009.gif) T. Through this method it is possible to distinguish different bonds and bond environments from one another. UV-vis spectroscopy is often used as a characterisation tool for electrolytes prior to, or after, their use in an electrochemical cell, this can be useful as it can highlight changes in speciation or key functional groups on a molecule.25–30 The reason for this is due to the extensive library of UV-vis spectra that exists.
T. Through this method it is possible to distinguish different bonds and bond environments from one another. UV-vis spectroscopy is often used as a characterisation tool for electrolytes prior to, or after, their use in an electrochemical cell, this can be useful as it can highlight changes in speciation or key functional groups on a molecule.25–30 The reason for this is due to the extensive library of UV-vis spectra that exists.
In LSBs the key bond information observed through UV-vis is the n → σ* orbital transition of the S–S bond in a LiPS chain.28,31 It is understood that the wavelength of the light absorbed by this transition decreases as the chain length decreases, from around 560–570 nm for Li2S8 to around 430–450 nm for Li2S2, hence the area of focus is usually 400–600 nm although there are characteristic peaks formed down to around 300 nm. Therefore, the energy required for this transition to occur increases with decreasing PS chain length, the exception to this pattern being the S3˙− radical anion which Zou and Lu found to be the most stable intermediate polysulfide in dimethyl sulfoxide (DMSO) based electrolytes and which has a characteristic absorbance at 617 nm.32
UV-vis spectroscopy has been widely deployed in LSBs but mostly as an ex situ, or material characterisation technique. Where UV-vis has been used as an in situ/operando technique it has been employed to decipher the reaction kinetics and mechanisms of LiPS conversion during a charge–discharge process or for monitoring polysulfide binding to the cathode.33–38 A schematic of a typical UV-vis in situ cell from Xu et al. is represented in Fig. 2(a).34
 | ||
| Fig. 2 (a) Schematic of an in situ UV-vis cell highlighting the cell components; (b) discharge profile of an operando UV-vis LSB at C/20 (where I is the first voltage plateau, II is the region between the plateaus, and III is the second voltage plateau); (c)–(e) UV-vis spectra of the three voltage regions highlighted in (b); (f)–(h) UV-vis spectra of LSB at decreasing voltages with (f) a bare, (g) a graphene oxide coated, and (h) a LiF/graphene oxide coated PP separator; (i) discharge profile highlighting the voltages at which UV-vis spectra are acquired; (j) and (k) concentration of (j) Li2S8 and (k) Li2S6 calculated from UV-vis spectra intensity at decreasing voltages. ((a) Reproduced with permission from ref. 34, Copyright (2017) American Chemical Society; (b)–(e) reproduced with permission from ref. 39, Copyright (2020) IOP Publishing Limited; (f)–(k) reproduced with permission from ref. 33, Copyright (2018) Wiley-VCH.) | ||
A recent study by He et al. studied the first discharge process of an LSB and distinguished the speciation of the soluble LiPS intermediates throughout the full process, it is also the first time transmission UV-vis spectroscopy has been reported as an operando technique for LSBs.39 They were able to isolate, due to their slow discharge current, a previously unseen LiPS peak (around 266 nm, Fig. 2(b)–(e)) that has been attributed to the S32− intermediate and as such revolutionise the understanding of the mechanism for LSB in DOL:DME electrolytes.39 The authors propose a mechanism of disproportionation and electrochemical reactions involving the S32− polysulfide, this contrasts with the previously understood literature where a series of two electron processes was the presumed dominant pathway.40 This study would benefit from a follow-up article discussing the observations of subsequent cycling after the first cycle, whilst it is important to gain an understanding of the primary cycles larger cycle numbers represent a more accurate portrayal of LSBs in their proposed application.
Another area of study for UV-vis spectroscopy in LSBs is the visualisation of LiPS binding to the cathode material, or in some cases to monitor the effectiveness of a separator coating that prevents LiPS shuttle.33–36,41 This is achieved by using UV-vis spectroscopy on the electrolyte and by creating a library of spectra for LiPS it is possible to monitor both the average species of LiPS present and estimate the concentration of the active material for an in situ cell. Huang et al. utilised this method for studying the effectiveness of a zwitterionic nanoparticle containing separator at suppressing LiPS shuttle. The authors find that their novel separator prevents the shuttle of LiPS as the characteristic peaks of LiPS are barely visible on the anode side of the cell, compared to a standard polypropylene (PP) separator which freely allows LiPS shuttle.41 Ni et al. used operando UV-vis spectroscopy to estimate the concentration of LiPS at the anode, it was found that the LiF/graphene oxide separator used was the most effective at preventing LiPS migration with a reduction of LiPS concentration of over 40% compared to PP (Fig. 2(f)–(k)).33
The unfortunate downside to UV-vis spectroscopy is that the concentration of the LiPS in solution cannot exceed the order of 100 mM due to the dark colour formed by higher concentrations of LiPS, making the solution opaque.39 This could mean that the mechanistic studies may not truly represent systems relevant to applied devices where high loadings of active material (i.e. S8) are likely to lead to higher LiPS concentrations.
2.2 Raman spectroscopy
Raman spectroscopy is a method by which the vibrational modes of a sample can be studied in detail. This technique relies on the Raman scattering effect where an inelastic scattering of a photon of light occurs after interacting with the electron cloud of the target sample. Large changes in the polarizability of a molecule give strong Raman scattering, therefore symmetric vibrations are the most pronounced in Raman spectroscopy. Unfortunately, the Raman scattering occurs for about 1 in 106 scattered photons while elastic Rayleigh scattering is observed to dominate.24 Therefore variations of the technique such as surface enhanced Raman spectroscopy (SERS) can be used to increase sensitivity; this is however rarely used in LSBs.Most in situ/operando Raman spectroscopic studies focus on monitoring the LiPS species either in solution or on the surface of an electrode or separator (Fig. 3(a)),42–58 although other species may be observed. For example, it has been used recently by Zhang et al. as an in situ technique to identify the oxidation state of molybdenum in a polyoxometalate separator used for catalysis of LiPS conversion whilst preventing transfer of LiPS to the anode side of cell.59
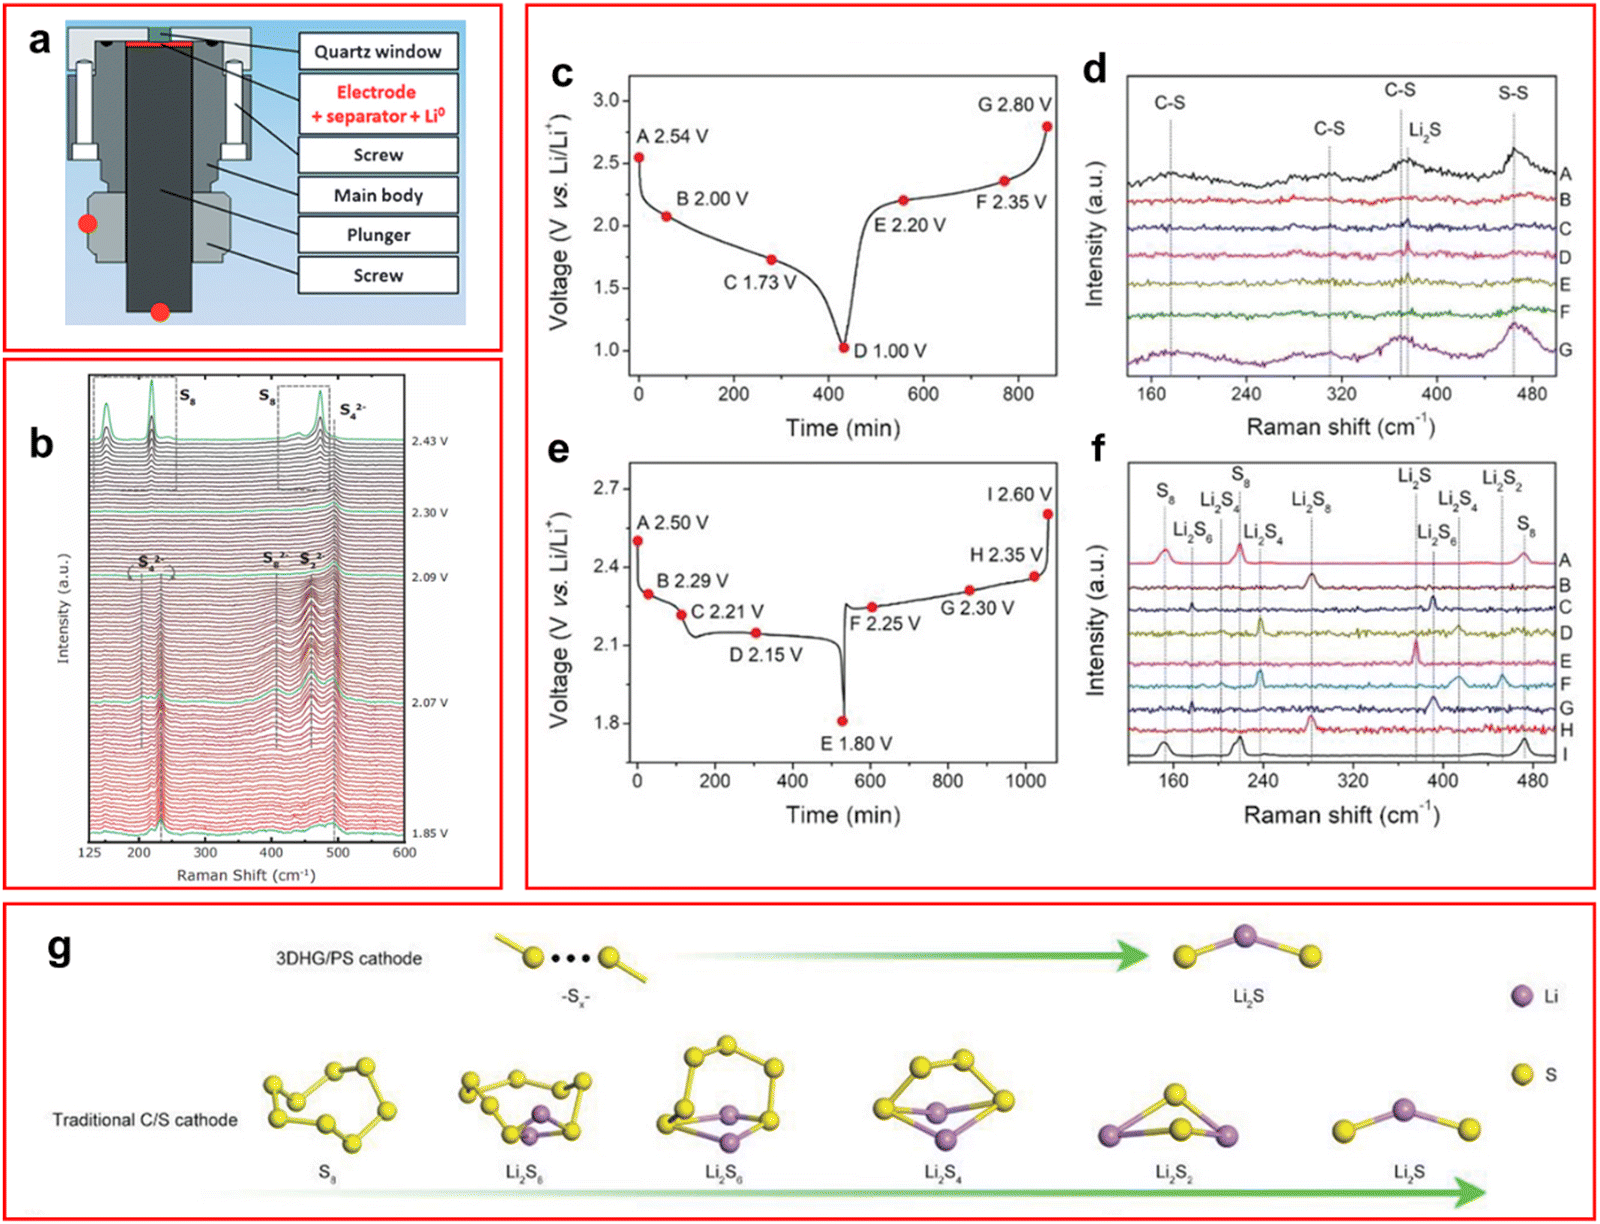 | ||
| Fig. 3 (a) Schematic of operando Raman cell used for LSB testing; (b) Raman spectra taken at different voltages to monitor the speciation of LiPS with peak labels for specific species; (c) and (d) discharge profile (c) and Raman spectra (d) of LSB containing binder-free graphene/polyacrylonitrile sulfur cathode; (e) and (f) discharge profile (e) and Raman spectra (f) of LSB containing traditional C–S cathode; (g) proposed new mechanism of discharge observed with a graphene/polyacrylonitrile sulfur cathode (top) and a traditional C–S cathode (bottom). ((a) Reproduced with permission from ref. 47, Copyright (2015) Wiley-VCH; (b) reproduced with permission from ref. 43, Copyright (2017) IOP Publishing Limited; (c)–(g) adapted with permission from ref. 44, Copyright (2021) Wiley-VCH.) | ||
The peaks observed in the Raman spectra for LiPS species are known to be unique for each species and contain multiple bond vibrations or peak overtones for each molecule.47 The Raman shift of LiPS varies from around 150–500 cm−1 with elemental sulfur appearing at 150, 230 and 470 cm−1.26,44,45,47 In an operando Raman study by Hannauer et al. density functional theory calculations have been used to predict the appearance of LiPS molecule spectra at different chain lengths,47 these calculated spectra have been used to inform the assignments in many other studies. Notably, a peak was observed, by both Wu et al. and Blanchard and Slagter who performed in situ and operando Raman studies respectively, at around 1066–1070 cm−1 which was ascribed to a S–O stretching mode of a thiosulfate molecule (S2O42−).42,43 This peak was suggested to be caused by a side reaction of the cathode and the ether-based solvent system or through irreversible sulfur oxidation, although Blanchard and Slagter suggest it could be due to their carrageenan species, which is a linear sulfated polysaccharide that is used as a cathode binder for LiPSs, that forms LiNaSO4 which attracts LiPS species and can allow dissolution of the LiPS hence decreasing its own peak intensity.43 They also found an unusual high concentration of S22− during the first voltage plateau. The peak is not present for long but the S3˙− radical formed during the disproportionation from S42− lingers in the system suggesting relative stability of the radical anion in ether-based solvents (Fig. 3(b)). This is in contrast to the operando UV-vis study by Zou and Lu who find that the S42− anion is the most stable intermediate in their DOL:DME solution, this is likely due to the fast rate of 1C applied by the authors in comparison to Blanchard and Slagter who apply C/10. The faster rate may not allow sufficient relaxation of the system to occur for the disproportionation reaction to occur, thus not forming the radical anion. Blanchard and Slagter also highlight the absence of S62− throughout their work, which they ascribe to the facile kinetics enabled by the DOL:DME system that allow the rapid conversion to shorter LiPS molecules.
Most work described so far has utilised binders to trap LiPS but recent work from Wang et al. uses a binder-free cathode made from graphene and polyacrylonitrile sulfur and utilises operando Raman to analyse the cathode.44 Due to the porosity of this design it avoids all problems related to the volume expansion during discharge. This binder-free cathode avoids the shuttle effect by making it more favourable for the sulfur atoms to remain inside the sulfur-rich pores of the cathode, and a new mechanism is suggested where direct reduction of S8 to Li2S occurs.44 Due to this new mechanism where Li2S is formed directly from the cathode (Fig. 3(g)), rather than forming soluble LiPS molecules, there are no LiPS observed in the Raman spectra during charge or discharge as seen in Fig. 3(c)–(f) compared to a traditional LSB, thus mitigating the shuttle effect.
The advancement of solid-state LSBs has led to the development of an operando Raman cell designed by Cao et al. which must be operated inside a glovebox.60 Through this operando Raman setup they have found that no LiPS can be observed during the operation of a solid-state LSB, with the only intermediate observed being Li2S2. This is corroborated by the appearance of the voltage profile during discharge which had only one plateau around 2 V suggesting that no LiPS intermediate reactions occurred. This study is one of the first times that Li2S2 has been observed directly in a solid-state LSB.
2.3 Fourier-transform infrared spectroscopy (FTIR)
FTIR is a method widely employed in analytical chemistry as it can identify vibrational modes similar to Raman spectroscopy, but asymmetrical vibrations are observed in this method since a change in dipole moment is required to absorb the incident IR wavelength instead of the change of polarizability for Raman spectroscopy which is caused by symmetric vibration modes. It is known that the S–S bond stretching vibration occurs at around 450–600 cm−1 for all LiPS chain lengths.61–64 The absorption band of the S–S bond of S82− has been shown to occur around 505 cm−1 and steadily redshifts as the length of the LiPS chain decreases.61,62,64 One of the shortfalls of Raman and UV-vis spectroscopy is the extremely slow cycling rates required to allow for the acquisition of the spectroscopic data (<C/30), or low concentration of active material is required, this is not a problem with IR spectroscopy especially when used in attenuated total reflection (FTIR-ATR) mode. In ATR-IR incident IR light is passed through the ATR crystal, which is in contact with the sample, at an angle that allows all light to be internally reflected apart from a small portion of the incident wave. The IR light that contacts the sample generates an evanescent wave and this is the origin of the spectrum for ATR-IR.65 ATR-spectrum acquisition time is much faster than transmission FT-IR leading to discharge rates equivalent to C/5.63 Special consideration of the cell configuration must be taken when utilising FTIR-ATR due to the low penetration depth of infrared radiation which is around 20 μm; an example cell design used by Rafie et al. is shown in Fig. 4(a).61,62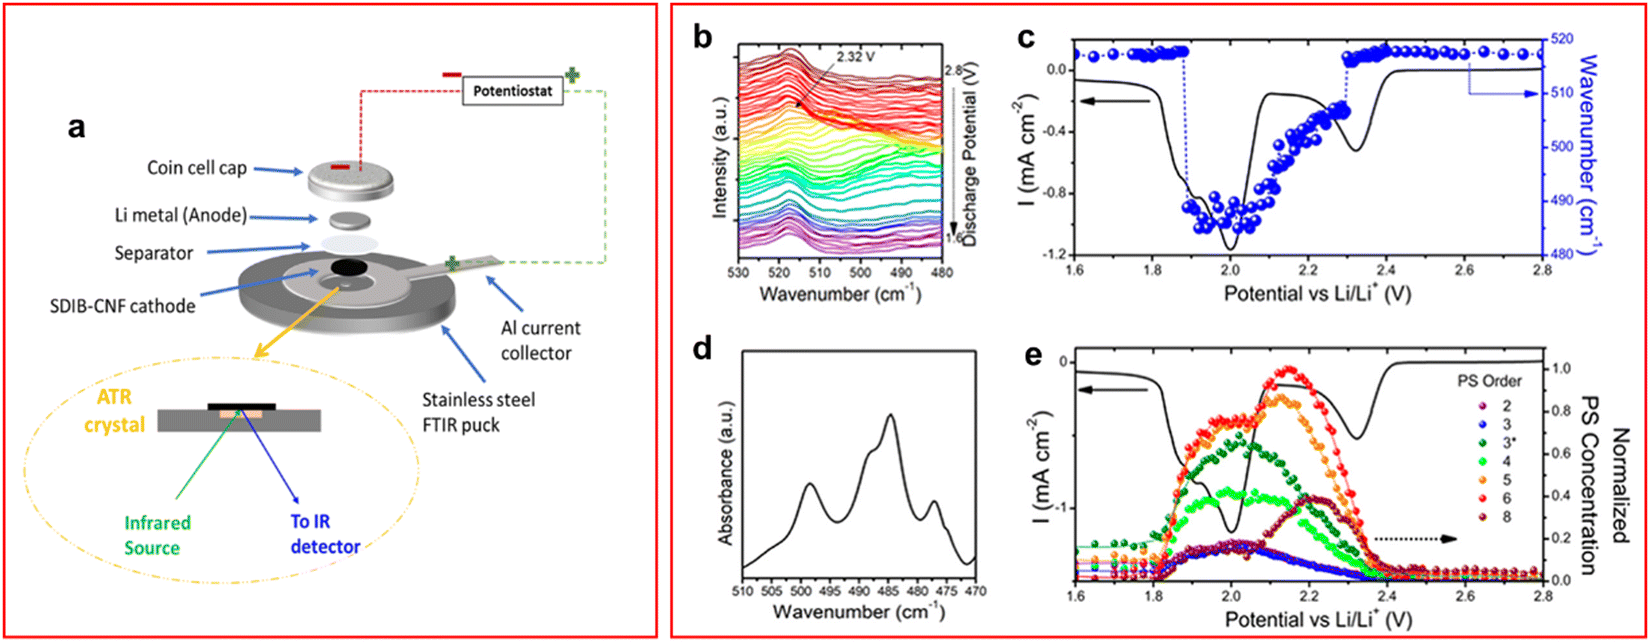 | ||
| Fig. 4 (a) Schematic of ATR-IR cell configuration; (b) IR spectra obtained during a CV at a scan rate of 0.05 mV s−1; (c) CV of operando cell overlapped with spectral data from the most intense spectrum; (d) single IR spectrum of the same cell at 2.2 V where multiple peaks assigned to LiPS species; (e) deconvoluted peaks give individual LiPS species and hence concentration. The LiPS concentrations are shown to vary during discharge giving insight into the mechanism of discharge. ((a) Reproduced with permission from ref. 62, Copyright (2022) American Chemical Society; (b)–(e) reproduced with permission from ref. 63, Copyright (2018) American Chemical Society.) | ||
Unlike UV-vis and Raman spectroscopy, IR spectroscopy is less widely used in LSBs and even less so as an in situ/operando technique to measure the vibrations of the S–S bonds or C–S bonds. Studies by the Kalra group have focused on the use of sulfurized polymers within a slurry cathode and utilised operando FTIR-ATR to characterise the cell's performance.62–64 It was shown that the C–S bond in the polymer is responsible for LiPS shuttle suppression as the sulfur atoms anchor to the carbon backbone. The effectiveness of this phenomenon was increased in the presence of lithium nitrate through the formation of a cathode electrolyte interphase which prevents LiPS from migrating away from the cathode.64
An operando FTIR-ATR study by Dillard et al. showed that the average LiPS chain length, and their concentration, could be calculated in situ by comparing to a library of IR spectra of LiPS at designated chain lengths.63 They showed that the S62− LiPS is the highest concentration species during a cyclic voltammetry (CV) experiment (Fig. 4(b)–(e)). The presence of S62− as the highest concentration LiPS appears to contradict the results of Blanchard and Slagter, who found S62− was absent in their Raman spectroscopy study, also using an ether-based electrolyte.43 The mechanism of the LiPS discharge is extremely dependent on the electrolyte formulation so the presence of a different salt could cause the mechanism to vary greatly. Additionally, the rate of discharge is far greater in the Dillard paper which can cause changes in the mechanism as species that form during a slower discharge may not appear under higher currents. Unsurprisingly the S82− concentration is one of the lowest appearing throughout the CV, the conversion of S82− to lower chain lengths is known to be a reaction that occurs rapidly during the first voltage plateau.43
It is also commonplace to analyse the spectra above 1000 cm−1 to detect any solvent instability by monitoring the characteristic peaks for each solvent system used such as the C–O–C, C–C and C–H environments of both DOL and DME.26,63 In an operando FTIR study by Santos et al. decomposition of the electrolyte was visible during charging due to the decreased intensity of the peaks related to the C–O–C bond vibration from the FTIR spectra.26 This may be an area to investigate further to establish whether this decomposition of electrolyte can be measured quantitatively.
One downside to FTIR is the peak present around 515 cm−1 that can be attributed to the –CF3 stretching mode of the commonly used LiTFSI additive.64 This can often lead to the S–S bond being obscured and deconvolution of the peaks is necessary to be able to isolate the peaks for each LiPS species.
Another use of ATR-IR that is not observed in current research is its use in probing the depth of the SEI layer on the lithium anode. Whilst techniques such as XPS undoubtedly have greater surface sensitivity, a far cheaper alternative such as ATR-IR could provide useful insights into the surface of the lithium anode during discharge. Additionally, the use of difference spectra where each spectrum has the previous one subtracted from it, allowing small changes in the IR spectrum to be observed could be utilised to detect minute details in the IR spectra.
2.4 Nuclear magnetic resonance spectroscopy (NMR)
Nuclear magnetic resonance (NMR) spectroscopy employs an external magnetic field to change the nuclear spin of a specific spin active isotope in the sample of interest. The energy transfer for this transition is only available at radio frequency (>10 MHz) and is dependent on the isotope of interest and magnetic field strength of the instrument.66 A signal is obtained when energy is released after the nucleus returns to its original spin state.In addition to the isotopes commonly used for NMR spectroscopy of organic compounds, namely 1H and 13C, the use of 6Li, 7Li and 33S have become an area of interest in LSB research in recent years.41,67–70 Unlike 1H and 13C NMR spectroscopy, the spectral features obtained from 6Li, 7Li and 33S are less well known or not collated in spectral libraries. In addition, 6Li and 33S isotopes are notoriously difficult to work with given their lower natural abundance (spin: 6Li = 1 and 33S = 3/2; abundance %: 6Li = 7.4 and 33S = 0.76) than 7Li (spin = 3/2; abundance % = 92.6), which can generate a weaker resonance.71,72 The weaker resonance generated by 6Li and 33S means that it is possible for signals to get lost in the noise, this can be corrected in most cases by increasing the acquisition time. 33S has the additional downside of producing very broad resonances that can make elucidation of structural information extremely difficult, this effect is especially prevalent when an asymmetric sulfur environment is being studied as in LSB chemistry.72
The use of 7Li NMR spectroscopy is the most common isotope studied for in situ/operando techniques in LSBs.73–75 The purpose of these studies have been mainly to decipher the reaction mechanisms of LSBs during charge–discharge cycles, an important conclusion, drawn by Xiao et al., is that the formation of insoluble Li2S occurs throughout the discharge process.73 This confirmed that the reduction of LiPS is not a discrete process where the chain length of LiPS gradually decreases throughout the system but rather a process where many different species of LiPS can exist at all stages of discharge until gradually reducing to the insoluble Li2S species.68,73
Two general regions can be observed in 7Li NMR spectra of LSBs: the first is around −260 to 100 ppm where the LiPS peaks occur with lithium salt peaks; the second region around 100 to 270 ppm is caused by metallic lithium, dendritic lithium and the many lithium species that typically form an SEI layer.73,75 Unfortunately, isolation and identification of an NMR peak for each LiPS species has not been possible, this is likely due to the large linewidth caused by the large quadrupole moment of 7Li atoms and the data being obscured by lithium salt additives which typically have a peak in the same region (∼0 ppm).73–76 In an operando study by Wang et al. peaks from both regions of the 7Li spectra are monitored over the course of multiple charge–discharge cycles and it is found that the quantity of soluble LiPS species steadily declines whilst the solid LiPS species increased over the course of 4 cycles (Fig. 5(a) and (b)). An increase in dendritic lithium formation was also observed with a decline in metallic lithium, as expected.75
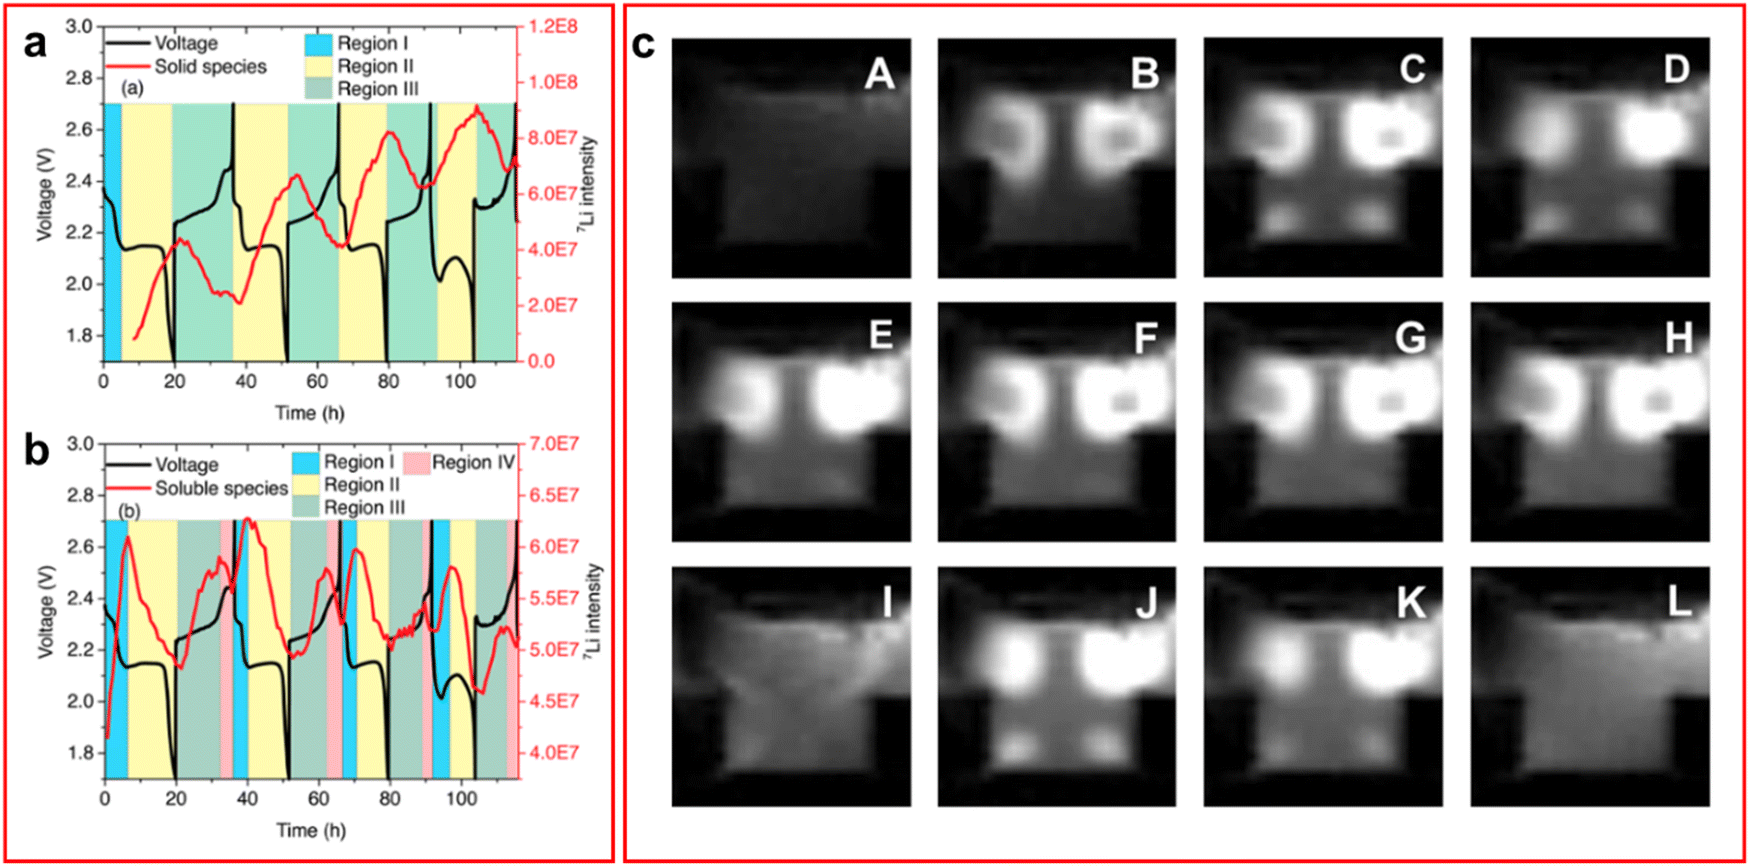 | ||
| Fig. 5 (a) and (b) Discharge profile overlapped with 7Li NMR spectroscopic data for (a) the insoluble LiPS species and (b) the soluble LiPS species. Where multiple regions are identified, I the initial SEI layer formation phase, II discharging region, III charging region, IV formation of elemental sulfur; (c) 1H MRI of an LSB with TEGDME electrolyte. White spots indicate presence of LiPS species. (A) Taken at open circuit voltage. (B)–(H) taken as voltage decreases throughout the discharge and (I)–(L) as voltage increases throughout the charge process. ((a) and (b) Reproduced with permission from ref. 75, Copyright (2017) American Chemical Society; (c) reproduced with permission from ref. 77, Copyright (2022) Elsevier.) | ||
A recent study by Dorai et al. utilised operando 1H NMR spectroscopy to perform 1H magnetic resonance imaging (MRI) on the cell to detect changes in the 1H NMR spectrum caused by LiPS formation in both TEGDME and DOL:DME solvent systems.77 The 1H MRI for the cell with DOL:DME electrolyte visually presents very small changes over the course of a cycle but on analysis of the peaks it shows a decline in the peak intensity of the cathode region corresponding to a decrease in the amount of LiPS in the system. The same effect can be observed in the TEGDME system but the 1H MRI are much clearer and have been included in Fig. 5(c).77 Although this technique provides a unique method of retrieving data it fails to offer any information that could not have been obtained by another in situ technique such as Raman, utilising its mapping capabilities. Additionally, all data produced required confirmation through 1H NMR spectroscopy and electron spin resonance measurements to determine the nature of the changes observed in the 1H MRI spectrum. This is not to say that with further development that this technique will not produce valuable information in the future.
2.5 X-ray absorption spectroscopy (XAS)
XAS is a technique which is used to study the different geometries and electronic structures of samples. The appearance of the XAS spectra can be split into two regions which have different origins, X-ray absorption near edge structure (XANES) and extended X-ray absorption fine structure (EXAFS). When an X-ray is incident on a sample, if the energy of the photon is equal to or greater than the ionisation energy of the core electron, then the electron will be excited to form a core electron hole. Another electron from a higher energy orbital can fall into this hole and emit an X-ray photon or cause the emission of an Auger electron. If the energy of the incident X-ray is above the edge energy by less than 50 eV then the XANES region is observed where multiple scattering occurs due to the low kinetic energy of the excited electron. When the energy of the incident X-ray is above this threshold the EXAFS region is measured where single scattering occurs since the high energy excited electron will have a weaker effect on the system.78 Since the energy of the incident X-ray beam must be tuned to excite the core electron this means that XAS is an element selective technique. In addition, the sample's phase does not impede the measurement meaning that both crystalline and amorphous phases can be studied simultaneously at atmospheric conditions.Most studies of XAS in LSBs focus on the XANES region of the sulfur K-edge.15,36,48,49,68,79–85 The key region of interest is in the 2460–2480 eV range with the elemental sulfur, or uncharged sulfur, peak at 2472 eV,15,36,79 the LiPS peak at ∼2470 eV and the peak associated with the LiTFSI sulfur atoms occurs around 2480 eV, although many papers choose not to use this sulfur containing additive to prevent any unnecessary noise in the data.15,82 Additionally, it was found by Gorlin et al. that a peak occurs around 1470 eV in an ether-based electrolyte that can be attributed to the S3˙− radical anion.84
XAS has been used in LSBs mainly to study the mechanism of LiPS conversion and shuttle during the discharge–charge process and the effectiveness of a cathode at suppressing the LiPS shuttle.36,79–82 Jia et al. utilised a novel bismuth-based coated PP separator to inhibit the LiPS shuttle whilst studying the cell with operando XAS (Fig. 6(a)).79 They found on the anode surface that the formation of Li2SO3 was preferred over Li2SO4 (Fig. 6(b)), which was formed in the cell without the bismuth-based coating, and no Li2S was detected (Fig. 6(c)). There were some trace amounts of LiPS detected in this experiment, but it was attributed to the penetration depth of the X-rays being large enough to reach the cathode side of the separator. On their study of the cathode side of the cell they found that an accumulation of LiPS was present with the coating indicating its effectiveness at preventing LiPS shuttle.
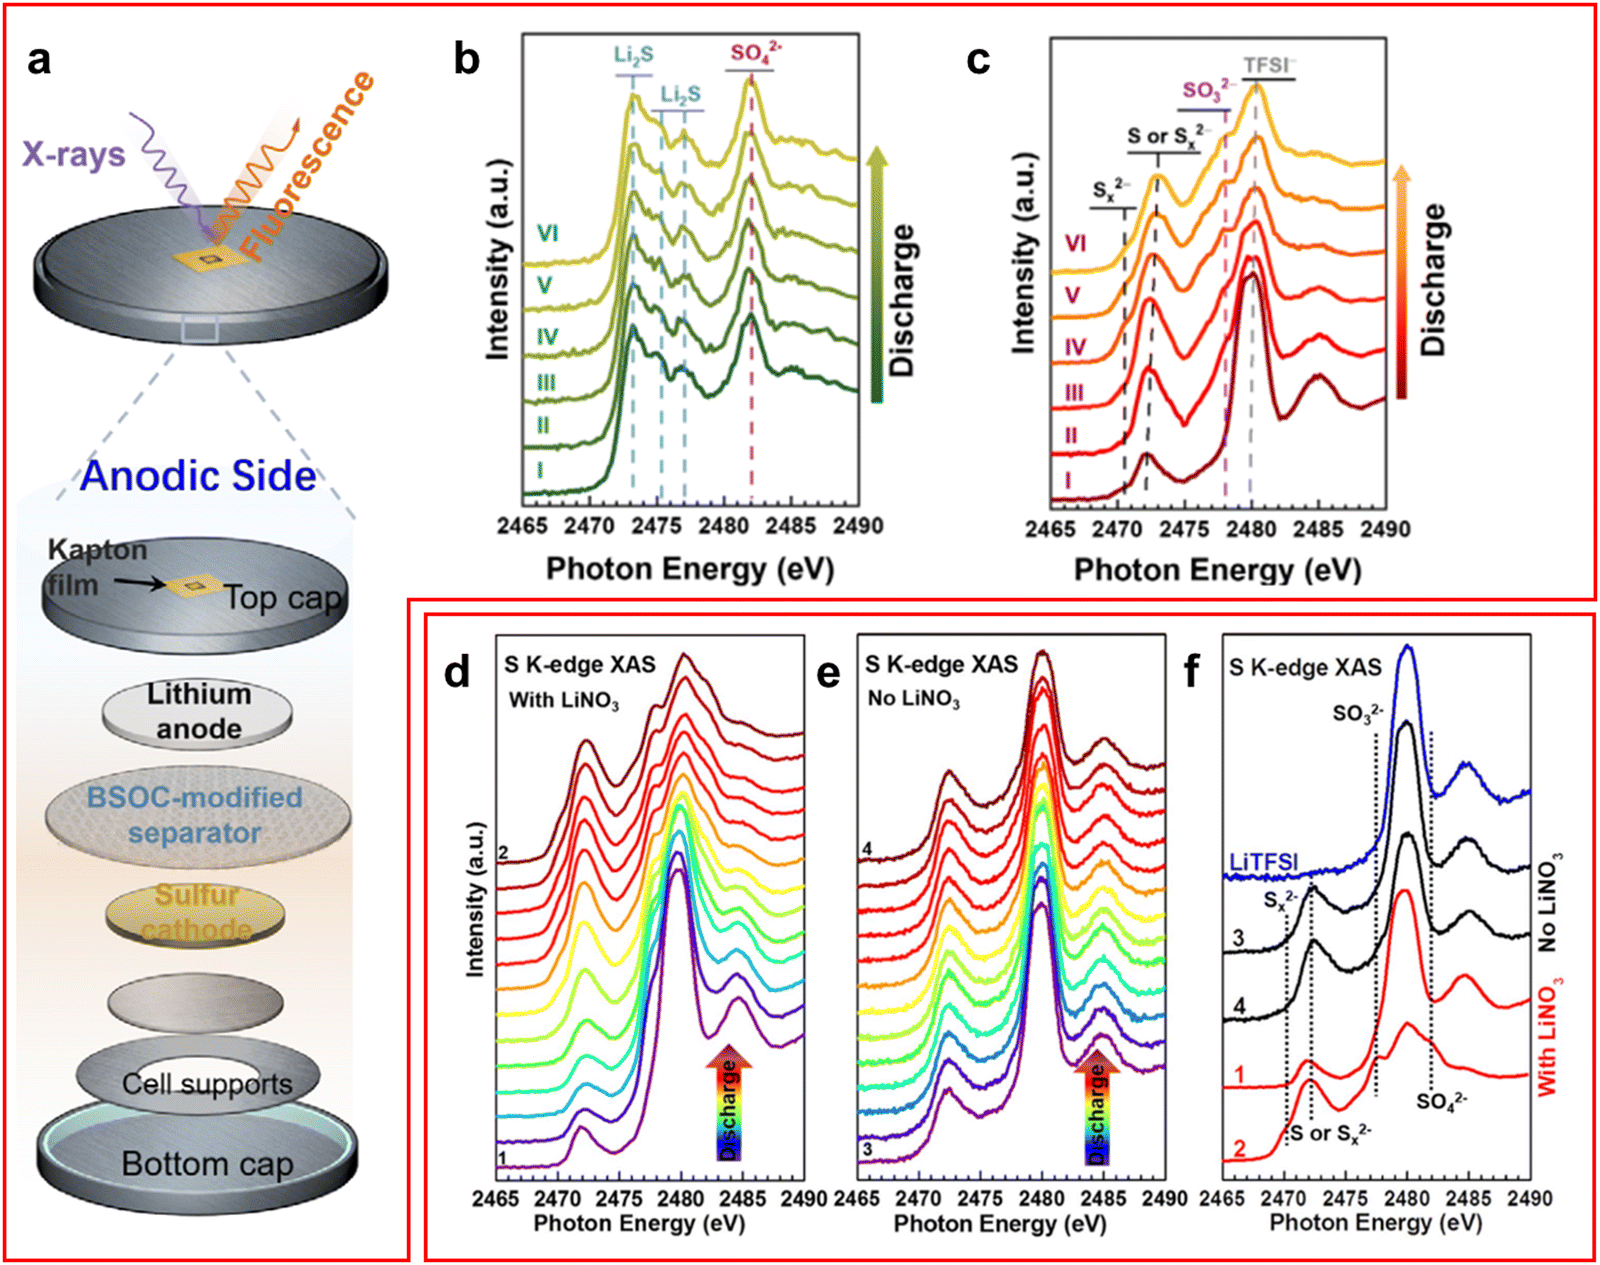 | ||
| Fig. 6 (a) Schematic of a XAS cell used for operando studies of an LSB; (b) and (c) operando XAS spectra of Jia et al. cell using (b) a bare PP separator and (c) a bismuth coated separator; (d)–(f) operando XAS spectra for a cell (d) with LiNO3 additive, (e) without LiNO3 and (f) a comparison of the spectra at full charge and discharge for both conditions with LiTFSI spectrum as reference. ((a)–(c) Reproduced with permission from ref. 79, Copyright (2021) Wiley-VCH; (d)–(f) reproduced with permission from ref. 15, Copyright (2018) Elsevier.) | ||
A study by Zhang et al. used operando XAS to study the effect LiNO3 has on suppressing the LiPS shuttle, they found that during the first discharge both sulfite and sulfate ions are formed on the SEI layer of the anode suggesting a reaction between LiNO3 and LiPS (Fig. 6(d)–(f)).15 They also confirmed through fluorine K-edge ex situ XAS that the decomposition of LiTFSI is unrelated to LiNO3 presence in the cell. Interestingly, despite the formation of the SEI layer an increasing intensity of Li2S was observed which was ascribed to LiPS finding gaps in the SEI layer to form the insoluble Li2S product.
Although XAS undoubtedly has its benefits when compared to some other X-ray techniques, which require high, or ultra-high, vacuum, XAS is not entirely a non-destructive method as it is possible to damage the surface and fundamentally change the morphology of the surface being measured. This was confirmed experimentally by Li et al. where the “beam effect” is observed through X-ray fluorescence (XRF).86 This study is discussed later in the section dedicated to in situ/operando XRF. Another downfall of XAS, as with many of the other techniques presented so far, is that it is impossible to distinguish a sulfur atom in one LiPS chain length from another, as all S atoms detected from a LiPS molecule are S2−, meaning XAS cannot be used for LiPS species identification.
2.6 X-ray photoelectron spectroscopy (XPS)
XPS uses the photoelectric effect where an electron is ejected from an atom by an incident X-ray and the kinetic energy of the photoelectron is measured. The binding energy is the difference between the incident photon energy and the photoelectron kinetic energy and represents the amount of energy necessary to eject the electron. XPS is performed using soft X-rays (∼1–2 keV) and as such is extremely surface sensitive with most of the signals originating from the top 5–10 nm of a sample, although increasing the energy of the incident beam will increase the penetration depth. Additionally, the sensitivity of XPS means that the electrons can easily interact with molecules in air meaning that XPS is usually performed under an ultra-high vacuum (UHV).In LSBs XPS is predominantly used as an ex situ technique due to the UHV conditions.26,37,55,56,59,64,87–91 A specially designed cell by Nandasiri et al. (Fig. 7(a)) provides a method to perform in situ XPS experiments.92 An ionic liquid, 1-butyl-1-methyl-pyrrolidinium bis(trifluoromethylsulfonyl)imide ([bmpyr]+[TFSI]−) is used as a cosolvent with DOL and DME. The TFSI anion is chosen to replicate the common additive of LSBs, LiTFSI. The ionic liquid has a low vapour pressure, hence is compatible with UHV conditions which allows a stable electrolyte formulation to be tested using in situ XPS. Measurements are taken at the end of each charge–discharge cycle to avoid the effects of charge-induced interactions which can alter the position and therefore the assignment of the peaks in the spectra. The measurements are targeted at the electrolyte–anode interface.
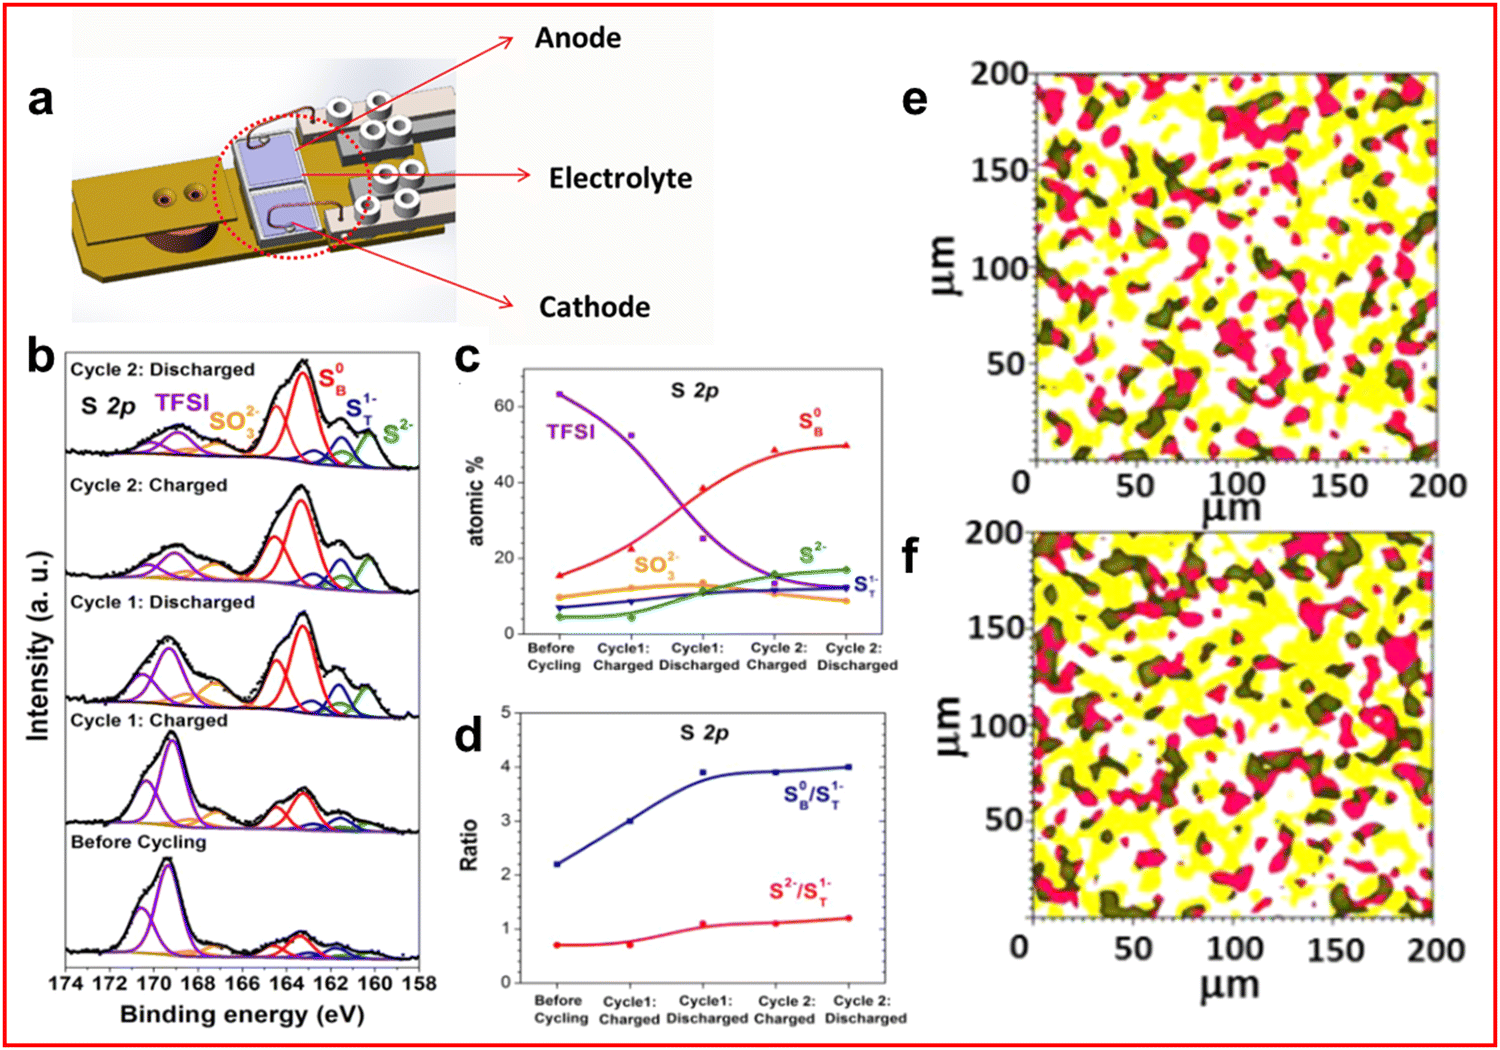 | ||
| Fig. 7 (a) Schematic of in situ XPS cell designed for LSB testing; (b) XPS spectra of the electrolyte–anode interphase in the fully charged and discharged states over the first two cycles; (c) distribution of S atoms measured in different chemical environments throughout charge–discharge process; (d) ratio of bridging and terminal sulfur atoms in LiPS environment alongside ratio of disulfide to terminal sulfur atoms throughout the charge–discharge; (e) and (f) XPS mapping of the electrolyte–anode interphase after (e) first charge and (f) first discharge. With S0 in red, Li–F in yellow and green representing a mix of both species. ((a)–(f) Reproduced with permission from ref. 92, Copyright (2017) American Chemical Society.) | ||
From the S 2p region of the XPS spectrum a peak is identified for TFSI anion (169 eV), sulfite or thiosulfate (167 eV) and a broad region assigned to sulfide peaks. The broad region can be deconvoluted to identify S2− from Li2S at 160 eV, with terminal (161.6 eV) and bridging sulfur (163.3 eV) from LiPS molecules (Fig. 7(b)). By measuring the ratio of the bridging to terminal sulfur peaks an estimate of the average LiPS chain length can be obtained at the end of each cycle (Fig. 7(c) and (d)). The authors also provide evidence of increasing Li2S growth on the anode which can cause further parasitic reactions creating fluoride and sulfide anions that can react with the electrolyte.92 In addition, XPS mapping is presented for the cell which provided an insight into the distribution of species on the surface of the anode although the resolution compared to many other morphological techniques is poor (Fig. 7(e) and (f)).
In a study by Lu et al., in situ XPS was used to study a LiF intercalated graphene layer over the lithium anode that improved the capacity retention (less than 0.022% loss per cycle) and coulombic efficiency compared to a cell without the novel SEI layer.93 LiF is commonly found in the SEI layer of the anode of LSBs alongside LiOH and Li3N, but it is claimed that LiF forms a more protective and compact SEI than the alternative depositions.94 Lu et al. studied the layer using XPS, with particular focus on the C 1s and F 1s regions of the spectra. They found that the sp3 C–F peak intensity gradually decreases while the sp2 C![[double bond, length as m-dash]](https://www.rsc.org/images/entities/char_e001.gif) C peak increases suggesting that graphene and LiF are being formed. This is confirmed by the emergence of a LiF peak at ∼685 eV in the F 1s region.
C peak increases suggesting that graphene and LiF are being formed. This is confirmed by the emergence of a LiF peak at ∼685 eV in the F 1s region.
As mentioned previously, XPS can be used to measure the thickness of the SEI layer due to its well-established relationship between incident beam energy and penetration depth. Therefore, efforts at quantifying the SEI layer thickness using this technique could be an interesting avenue of research.
Although XPS introduces a new approach at in situ characterisation it has many limitations compared to other techniques discussed thus far. These limitations are primarily the cost of the equipment which, in comparison to other techniques discussed, is very high. Additionally, the UHV conditions normally required limits the cell components and chemical composition of the cell.
3 Morphological & topographical analyses
Morphological and topographical techniques which study the structure and surface conditions of various components of the cell have become a regular feature in battery-related research papers especially LSBs where the SEI layer and its properties is a topic of particular interest. Despite the widespread analysis of morphology and topography, very few papers have utilised these techniques in situ or operando due to the already complicated nature of their experimental set-ups and challenges in designing suitable cell geometry.3.1 X-ray diffraction (XRD)
Powder X-ray diffraction (XRD) is a technique whereby the crystalline phase of a sample can be determined by measuring the angle of the diffracted X-ray through the crystal lattice. The obvious limitation of this technique is when a crystalline phase is not present in the sample.XRD has been widely employed in LSBs in recent years as the morphology of the electrode surfaces can change greatly over the course of a cycle, the appearance of Li2S on both the cathode and anode surfaces being the chief reason for these changes. The common region of study is in the 2θ = 20–35° region.95–104 From operando XRD it is determined that there are three distinct regions of the LSB discharge curve that are easily identifiable by XRD. They are in the 100–80% SOC region, where crystalline sulfur is observed; the 80–40% SOC region where no crystalline phase is found due to the formation of dissolved LiPS; and finally at 40–0% SOC where a peak emerges around 27° corresponding to the face centred cubic structure of Li2S at the end of the discharge.100,101,104
It has been discovered that the crystalline structure of elemental sulfur changes after the first cycle. During the first discharge α-S8 is present which inevitably disappears during discharge; upon recharging the cell the less thermodynamically stable β-S8 is formed, the same formation is found after many subsequent cycles.97,100–102,105,106 This is unexpected as this phase is expected to be unstable below 95 °C, it is suspected that this structure is favoured due to some interaction between the cathode and sulfur upon reformation under galvanostatic conditions, although it has not been confirmed.106 The formation of α-S8 was found, through operando XRD, to be preferentially deposited on charging in a cathode containing an MXene Ti3C2Tx (where Tx is a generic functional group) by Zhao et al. due to the highly conductive nature of the sample and its plentiful active sites facilitating deposition of both Li2S and S (Fig. 8(a) and (b)).107
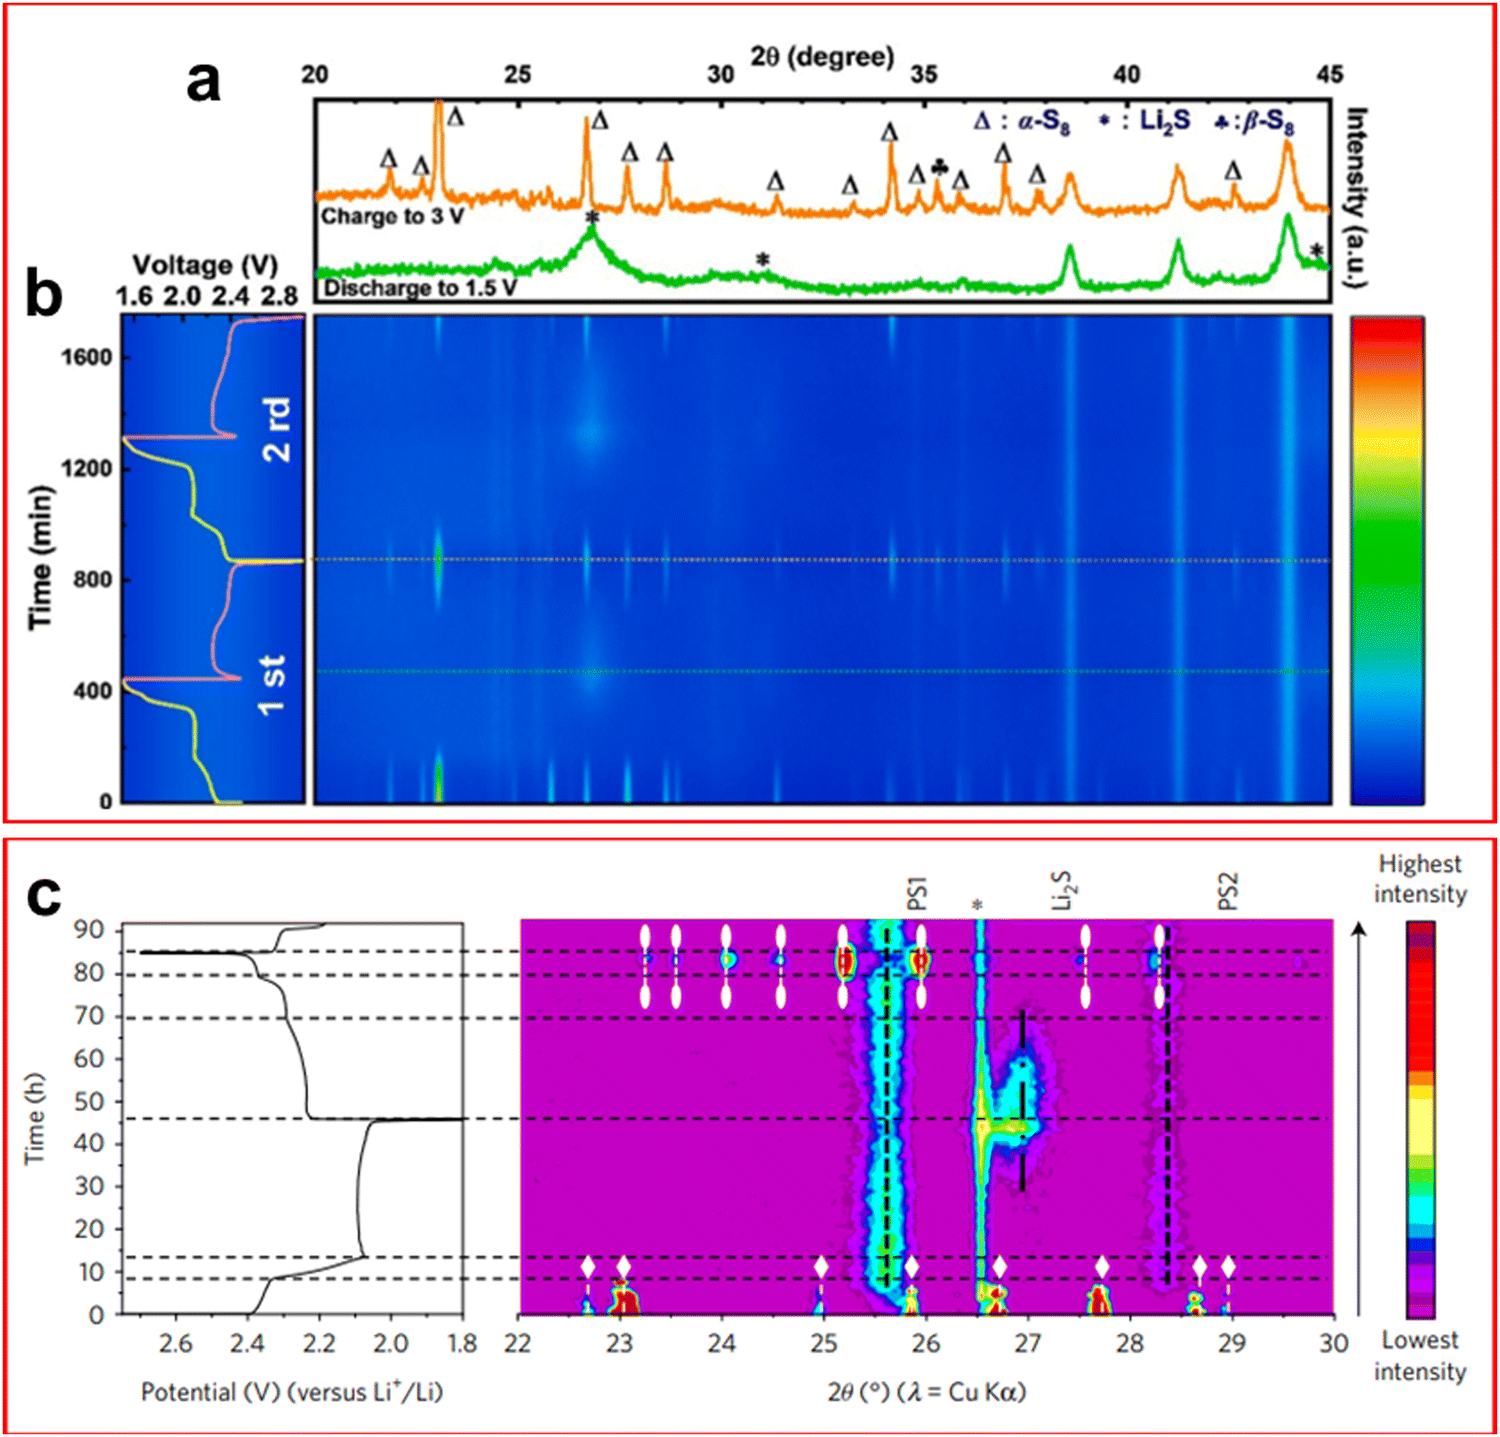 | ||
| Fig. 8 (a) XRD spectra at the end of the first charge (orange) and first discharge (green) showing the disappearance of S8 and formation of Li2S; (b) operando XRD spectrum as a contour map over the first two cycles of an LSB at 0.3C. (c) XRD contour map and corresponding charge–discharge plot highlighting the S8 phases α-S8 (white diamond) and β-S8 (white oval). ((a) and (b) Reproduced with permission from ref. 107, Copyright (2021) Elsevier; (c) reproduced with permission from ref. 101, Copyright (2017) Springer Nature.) | ||
Although most authors report that LiPSs are not visible through XRD, an outlier to this is the paper by Conder et al. where the use of fumed SiO2 as an electrolyte additive provided additional peaks in the operando XRD spectra during the middle region of the discharge (Fig. 8(c)).101 SiO2 was found to absorb LiPS and would result in a loss of active material that can only be retrieved upon full recharge of the cell, it did however reduce the corrosion caused by LiPS shuttle. Another novel discovery through operando XRD was the observation of crystalline Li2S2 by Paolella et al. This confirmed that Li2S2 is an intermediate of the discharge process which was only previously theorised, although the authors do suggest that it is caused by disproportionation reactions rather than a direct electrochemical step.103
In a study by Chien et al. an operando XRD cell is utilised with intermittent current interruption (ICI) to couple the formation of crystalline phases with changes in internal resistance and mass transport resistance.108 It is found that the end of a discharge process, where crystalline Li2S forms, is also coupled by an increase in mass transport resistance at the cathode leading the authors to conclude that the pores of the porous carbon-based cathode have been blocked by Li2S deposits on the cathode surface. Additionally, the authors emphasise a point which should be considered for all in situ/operando techniques: the design alterations of a cell to enable these techniques must not be at the cost of cell performance as changes in the cell geometry, and hence diffusion patterns, can fundamentally alter the chemistry of LSBs and many other battery chemistries.
Utilising operando XRD not only allows for phase characterisation but also the observation of utilisation of sulfur stored in the cathode and visualisation of parasitic self-discharge reactions by monitoring the intensity of the S8 peaks.52,104
A technique which has seen relatively low uptake but may be considered complimentary to XRD is neutron diffraction, or neutron scattering, in which neutrons are incident onto the sample instead of X-rays. This technique has the advantage of being able to detect lithium atoms in different environments more easily especially when surrounded by heavier atoms. Studies by Risse et al. and Jafta et al. utilise small angle neutron scattering (SANS) in an operando experiment.109,110 Jafta et al. found that SANS provides an early detection method for Li2S during discharge as SANS can detect the formation of amorphous Li2S which occurs earlier in the discharge than crystalline Li2S. The low usage of this technique is likely due to the lack of a laboratory scale SANS,111 which usually requires a national nuclear facility, but as interest in LSBs grows we might expect more research using neutron techniques in coming years.
3.2 X-ray tomography (XRT)
XRT, or X-ray computed tomography (XCT), produce images of the target by transmitting X-rays through a sample at different angles to obtain a series of 2D radiographs that can be collated into a 3D model of the sample, allowing the visualisation of features from different angles and depths previously unseen. This technique has seen a recent surge in popularity among researchers of LSBs due to the ability to visualise sulfur utilisation and the formation of dendritic and mossy lithium on the anode.112–121 It has also been exclusively used to determine properties of the morphology of the cell for use in simulations.122XCT has provided researchers with a valuable tool to study the deposition mechanisms of both S8 and lithium upon charging. It was found by Lemarié et al. in their in situ XCT cell, which featured an inactive area on the cathode due to uneven compression, that the redeposition of sulfur onto the cathode preferably formed agglomerates with other sulfur particles (Fig. 9(a)–(d)).112 This effect was even observed for unreacted sulfur in the α-S8 phase where clusters of α-S8 are formed onto the unreacted sites alongside β-S8 on other sites of the cathode, highlighting preference of sulfur particles to form agglomerates as even an unfavoured phase of sulfur is formed due to it being a sulfur rich site.
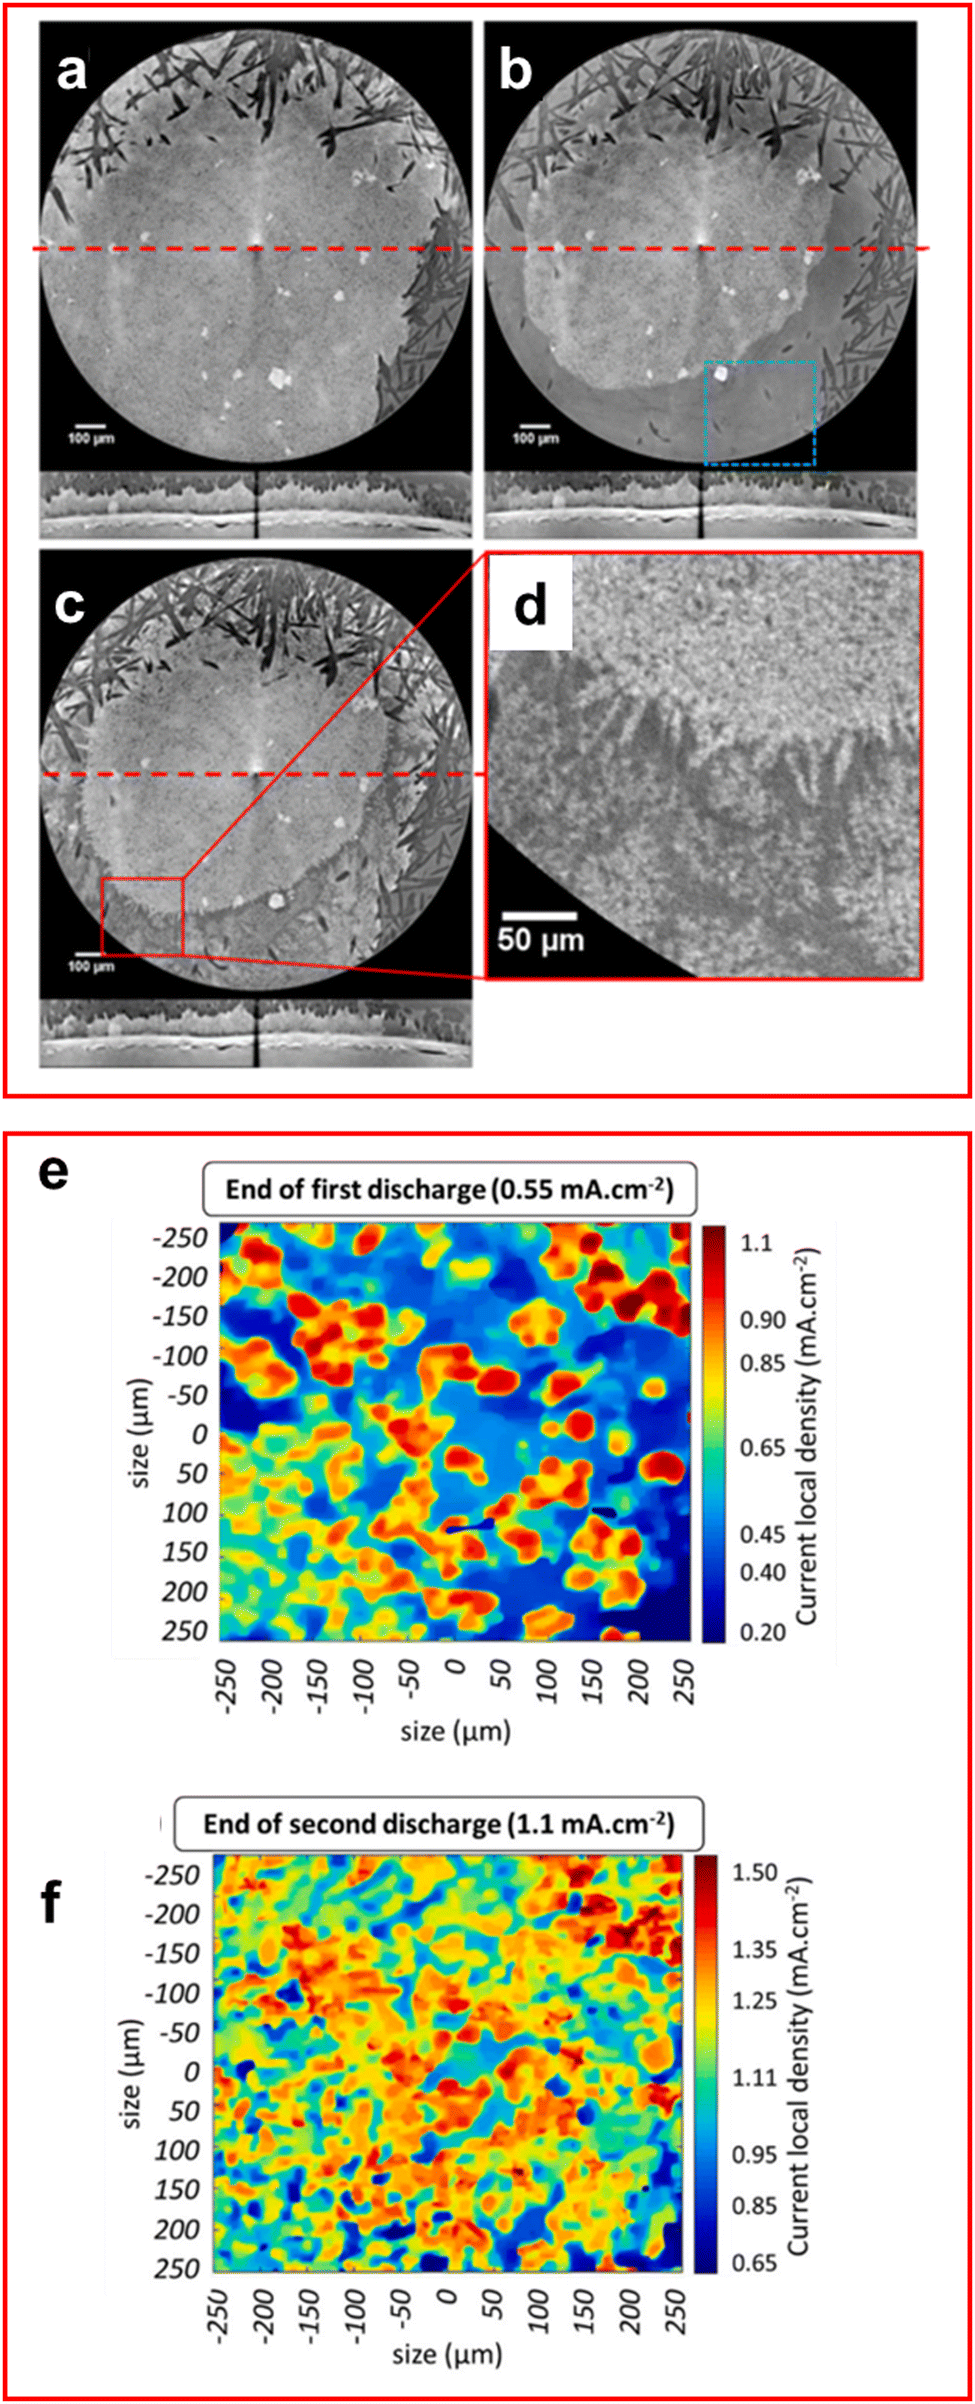 | ||
| Fig. 9 (a)–(d) Lateral and transversal XCT images of the cathode at (a) 0% discharge, (b) 100% discharge, (c) 100% charge with (d) an enlarged image of (c). The horizontal red line represents transverse image location. (e)–(f) 2D images of lithium–electrolyte interface from XCT data (e) end of 1st discharge and (f) end of 2nd discharge. ((a)–(d) Reproduced with permission from ref. 112, Copyright (2020) American Chemical Society; (e) and (f) reproduced with permission from ref. 119, Copyright (2020) Elsevier.) | ||
Tonin et al. demonstrated the heterogeneous nature of lithium metal deposition using operando XRT, where large pit formation was observed on the lithium anode surface.119 The number of pits formed was found to increase with current density and the local current density was found to vary significantly, in places up to twice the global current density, which further increases the formation of the pits and promotes the formation of high surface area, electrochemically inactive mossy lithium inside the pits (Fig. 9(e) and (f)).
One downfall of this technique is highlighted by Sadd et al. where they specify that the resolution of the equipment can cause trace amounts of materials to be missed due to their nano-scale size.117 In some cases this has led to the authors declaring that the deposition of Li2S cannot be visualised.113 This particular shortcoming is significant for LSBs as Li2S formation and deposition is one of the key reasons for studying morphology.
3.3 X-ray fluorescence (XRF)
XRF is both a chemical and spatial mapping characterisation technique, although the higher energy X-rays (∼20–25 keV) used compared to XPS (∼1–5 keV) mean the chemical information is far less sensitive due to increased penetration depth and decreased instrument energy resolution. The fundamental principle of XRF is similar to XPS where an incident X-ray excites an electron out of a nucleus, but rather than measuring this electron the fluorescent X-ray produced when an outer shell electron falls down to the vacant core orbital is measured.One use of operando XRF for LSBs has already been discussed in the XAS section where Li et al. utilise the surface mapping capabilities of XRF.86,123,124 Li et al. use XRF to visualise the “beam effect” causing fundamental changes to the surface morphology of the sample.86 The radiation from XAS measurements was seen to cause the dispersion of sulfur from the area targeted by the beam due to the instability of crystalline sulfur and its inherent susceptibility to radiation damage, this can be seen in Fig. 10(a)–(h) where the dark region formed in the middle of Fig. 10(g) (indicated by arrow) is thought to be radiation damage caused by the XAS measurement. This observation is backed up by the sudden dispersion of sulfur in Fig. 10(h) which suggests that even at this low state of charge (see Fig. 10(i) for discharge voltage profile) there is difficulty forming Li2S, which normally crystallizes together, in these darker regions of the image.
 | ||
| Fig. 10 (a)–(h) XRF map of a LSB with sulfur (blue) and cobalt (yellow) following changes in voltage corresponding with (i) a discharge voltage profile. (a)–(i) Reproduced with permission from ref. 86, Copyright (2022) American Chemical Society. | ||
The more common usage of operando XRF is to determine the distribution of sulfur during cycling. Freiberg et al. show that the LiPSs remain distributed in the electrolyte even at the end of discharge but large clusters of Li2S can be identified on both electrodes at this time.123 The LiPS shuttle was also visualised using this method as sulfur disperses throughout the cell during an OCV forming an almost homogeneous phase.
The studies presented so far have utilised XRF to visualise sulfur distribution either at the cathode or as a profile of the full cell. In work by Wu et al. an image of the sulfur content on the anode using XRF is presented which can help to decipher the nature of the SEI layer formed on the anode.125 They were able to map the effects of LiPS shuttle inhibition through a solvent mixture of DOL:DME with LiNO3.
The lower chemical sensitivity of this technique means that features caused by lithium, or even distinguishing between elemental sulfur and LiPS or Li2S, is impossible without the aid of another characterisation technique. It is commonplace therefore to find that XRF is used in conjunction with another X-ray characterisation technique such as XAS, to provide the ability to distinguish one kind of sulfur signal from another.86,123–125
3.4 Transmission X-ray microscopy (TXM)
TXM is a technique used to study the morphology of a sample and is performed by passing a beam of X-rays through a sample and measuring both the unaffected and scattered X-rays. It provides a better understanding of the morphology of the sample than electron microscopy techniques, which will be discussed later in this review, due to the larger penetration depth of X-rays at an equivalent energy.126 Due to the lack of chemical information produced by this technique it is not uncommon to find it in use with XANES or XRD especially in LSB research.127–129 The purpose of operando TXM for LSBs is to visualise the change in morphology, specifically the observation of sulfur particles and cluster evolution throughout the charge–discharge process.Weret et al. utilised an anode-less design, where lithium is stored in the electrolyte and lithium plating occurs during cycling to form the anode on the host structure.128 Their study demonstrated through operando TXM that, in comparison to lithium iron phosphate batteries, the stability of deposited lithium is greater in LSBs due to the presence of LiPS (Fig. 11(a)–(e)). They also report being able to visualise an SEI layer formed on the anode during plating that remains intact during the subsequent stripping process (Fig. 11(d) and (e)) – unfortunately the only chemical information available for the deposited layer is that it likely contains lithium. This highlights the limitations of this technique when used in solitude, but in tandem with another technique they can provide a powerful combination to elucidate the morphology of LSBs.
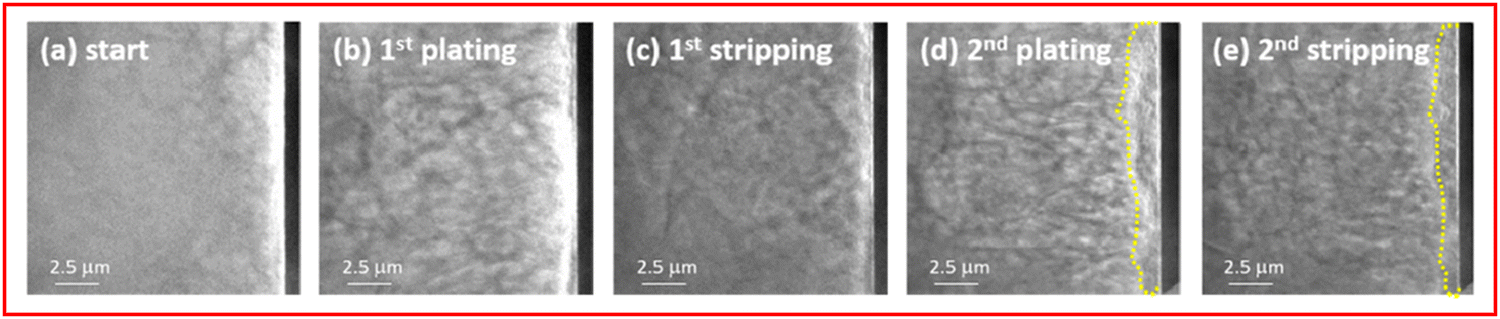 | ||
| Fig. 11 (a)–(e) Operando TXM images of the lithium anode morphology on the copper substrate in a Li2S||Cu cell at 1.5 mA cm−2. Yellow line highlights a dense lithium layer formed attributed to SEI layer formation. ((a)–(e) Adapted with permission from ref. 128, Copyright (2023) American Chemical Society.) | ||
In work by Nelson et al., operando XRD and TXM are used to gain insight into the morphological evolution of the cell.129 Contrary to many reports in the literature, they find that there is no crystalline Li2S formation at any point in the charge–discharge process, this displays the sensitivity to the surrounding morphology of crystalline Li2S. Nelson et al. use TXM to reveal the morphology of sulfur particles on the cathode where only a small amount of sulfur dissolves into solution but still has a detrimental effect on cell performance.
3.5 Atomic force microscopy (AFM)
AFM is used to measure topographical and morphological structures at the nanometre scale using an atomically sharp tip which is gently pressed onto the surface and moved in different directions to determine the topography of the sample. Through different modes of AFM it is possible to obtain other information about the sample being studied, such as tapping mode which allows different phases to be identified, and conductive AFM which can measure the conductivity of the sample.AFM has seen limited use as an in situ/operando technique in LSBs but where it has been employed it has been to observe the morphological changes associated with Li2S and Li2S2 particles on the cathode surface.51,130–132 An AFM-based technique called scanning electrochemical microscopy (AFM-SECM) is used by Mahankali et al. to study the insoluble products remaining on the cathode after discharge.132 Using in situ AFM-SECM they are able to find an inhomogeneous surface on the cathode where conducting and insulating products are present, assigned to Li2S2 and Li2S, respectively. By monitoring the height of the particles, the current at the AFM tip and the phase of the sample they can decipher key information about the properties of these insoluble discharge products. They find that both Li2S2 and Li2S exist in proximity on the cathode and that Li2S2 undergoes oxidation to LiPS more easily than Li2S (Fig. 12(a)–(l)). In addition, they found that Li2S reacts with LiPS to form larger insulating deposits.
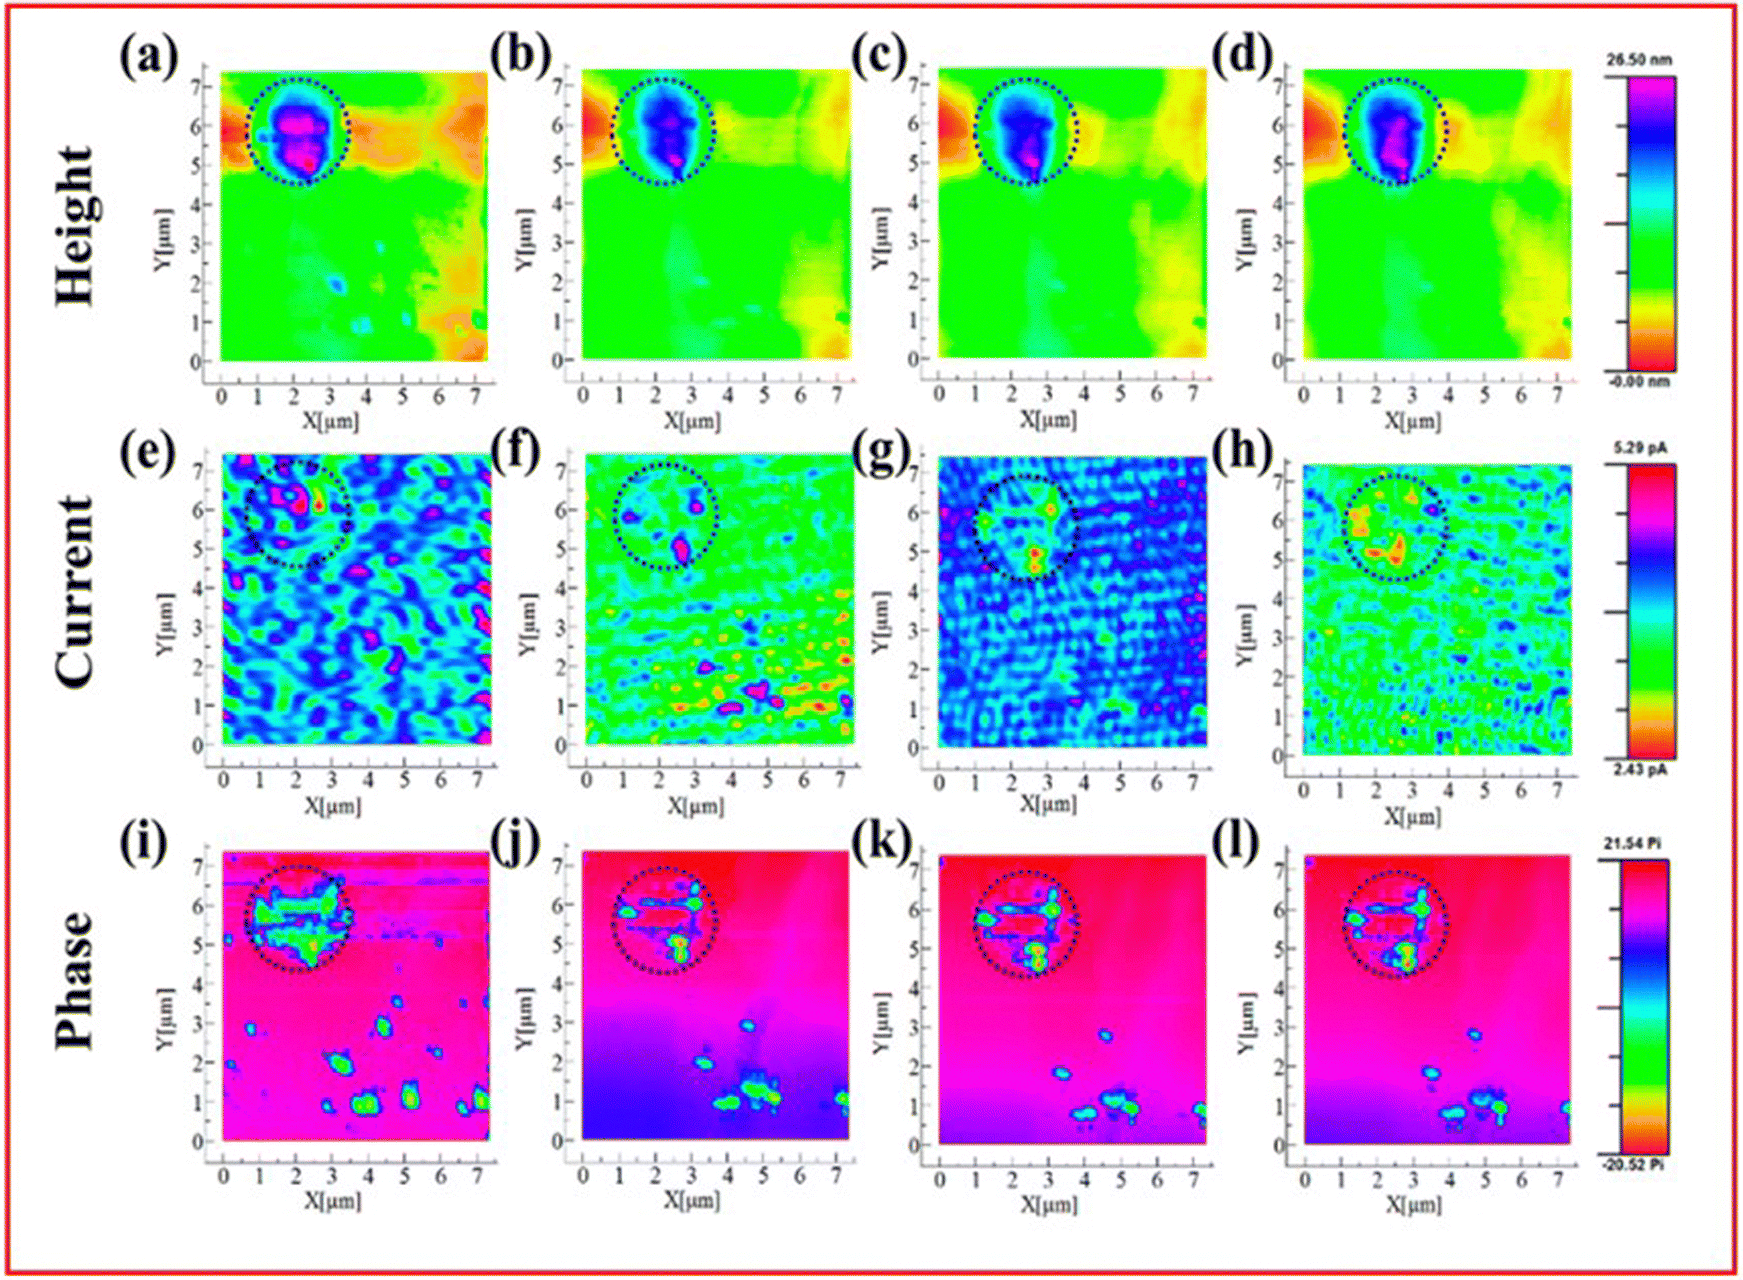 | ||
| Fig. 12 AFM-SECM images of insoluble Li2S/Li2S2 on the cathode. Simultaneously obtained data for the height (a)–(d), current (e)–(h) and phase shift (i)–(l) mapping are shown for samples before oxidation (a), (e), (i), at 2.5 V (b), (f), (j), 2.6 V (c), (g), (k) and 2.7 V (d), (h), (l) vs. Li/Li+. ((a)–(l) Reproduced with permission from ref. 132, Copyright (2019) American Chemical Society.) | ||
As with many of the morphological and topographic techniques discussed thus far, very limited chemical information can be obtained through AFM. Thangavel et al. utilised both in situ AFM and operando Raman spectroscopy in their study of Li2S deposition that found that the presence of the intermediate Li2S2 has a negative effect on the reversibility of Li2S reduction, making larger deposits far easier to form.51
3.6 Scanning electron microscopy (SEM)
SEM is a topographic technique that can be used to visualise the top few nanometres of a surface by targeting a sample with a high energy electron beam (10–20 keV). The excitation this beam causes to the sample can emit a secondary electron and an X-ray photon that can be detected and interpreted into an image of surface structure. If energy dispersive X-ray spectroscopy (EDX) is employed, which assigns emitted photons to specific elements, then chemical composition of features can be deduced and mapped.SEM has been used in LSBs as an ex situ or post-mortem analysis technique on most components of the cell, but it has rarely been used as an in situ technique. Where SEM has been deployed to visualise real-time topographical changes it has studied both electrodes for depositions of either lithium dendrites or Li2S.133–135 Marceau et al. utilised in situ SEM and operando UV-vis spectroscopy to decipher the nature of the failure mechanism of their solid-state LSB.133 An operando SEM investigation into lithium dendrite formation on the anode by Rong et al. demonstrated the effect that additives have on the lithium plating reaction.135 They show that a reduced length of dendrite can be observed with LiNO3 additive and the presence of LiPS in solution (Fig. 13(a)–(d)) compared to a solution with only LiPS present (Fig. 13(e)–(h)).
 | ||
| Fig. 13 Operando SEM images of the Li/Cu anode used by Rong et al. at increasing plating times for a solution containing (a)–(d) 0.2 M Li2S8 and (e)–(h) 0.2 M Li2S8 with 1 wt% LiNO3. Scale bar: 10 μm ((a)–(h) adapted with permission from ref. 135, Copyright (2017) Wiley-VCH.) | ||
Rong et al. also highlight one of the downfalls of SEM, the electron beam effect, which can cause a sample to become charged due to the high energy bombardment with electrons.135 The charged state of areas of the sample can fundamentally change the surface structure, although this can be avoided by using a lower energy incident beam or reduced scan times. Both can affect the results obtained by either making the beam more surface sensitive or having decreased resolution of the image produced.
3.7 Transmission electron microscopy (TEM)
TEM is a technique where both topographical and crystallographic data can be obtained by firing a high energy electron beam (up to 300 keV) at a thin sample contained within an ultra-high vacuum.136 The incident electrons are transmitted through the sample, the heavier the atom that the electron beam passes through the lower the amount of transmitted electrons. This difference in transmittance provides the contrast necessary for topographical information to be obtained which provides resolution down to 0.1 nm. Alongside the transmission data, an electron diffraction pattern (EDP) is obtained for the sample which allows crystallographic elucidation of the sample.For the application of LSBs TEM is used to decipher the complex nature of Li2S formation and decomposition on the electrode surfaces. TEM can only be used as an in situ method for all battery technologies as the electron beam can interfere with the electrochemical processes occurring, additionally the UHV requirements of TEM can lead to complications with electrolyte selection, as in XPS studies. Similar to other methods discussed in this review, the electron beam can cause sulfur to evaporate into the vacuum environment and it can damage Li2S formations.
One solution to this problem was to confine the sulfur inside carbon nanotubes (CNT) or nanowires, this allows the in situ TEM technique to be employed in LSBs.137,138 Kim et al. used this approach to visualise the lithiation of sulfur at different stages of the process; they found that a direct formation of Li2S from S8 occurs due to the lack of a liquid electrolyte.137 The authors suspected that lithiation would occur readily at the interface between the CNT and the contained sulfur due to the increased conductivity at this site, however a uniform reaction front is observed where lithiation occurs at all sites within the CNT. This avenue was further investigated by Wang et al. who used in situ TEM to observe the lithiation of sulfur in their solid-state LSB at elevated temperatures.138 Their work concluded that the reversibility of Li2S deposition is influenced by both the temperature at which the discharging/charging process occurs and the voltages applied during both processes. Ultimately, they conclude that lithium-ion diffusion is the limiting factor in the reversibility of Li2S formations in solid-state LSBs.
There are two cell configurations for performing in situ TEM, the most common of which is the open cell configuration which is exposed to air for a brief period forming a natural lithium oxide layer on the lithium anode and reflects more accurately the operation of a solid-state LSB and all the works on TEM discussed thus far have been in this configuration. The open cell configuration however is not representative of the operation of a typical LSB, due to the lack of liquid electrolyte, the oxidised lithium anode and the lithiation reactions occurring through a bias voltage rather than a constant current.
The other cell configuration, which Zhou et al. encouraged the development of in their recent review on the use of in situ TEM in lithium metal batteries,139 is the liquid cell. In this configuration a liquid electrolyte can be analysed as it is sequestered from the high vacuum environment required for the electron beam. Seo et al. have utilised a liquid cell configuration to demonstrate that an ionic liquid electrolyte can be used to prevent the shuttle of LiPS (Fig. 14(a)–(d)).140 They show that the diffusion of LiPS and the reduction in size of sulfur nanoparticles being studied is decreased in the ionic liquid electrolyte (Fig. 14(c)) when compared to a solution without (Fig. 14(d)), thus providing evidence that ionic liquids can reduce but not entirely stop the LiPS shuttle effect.
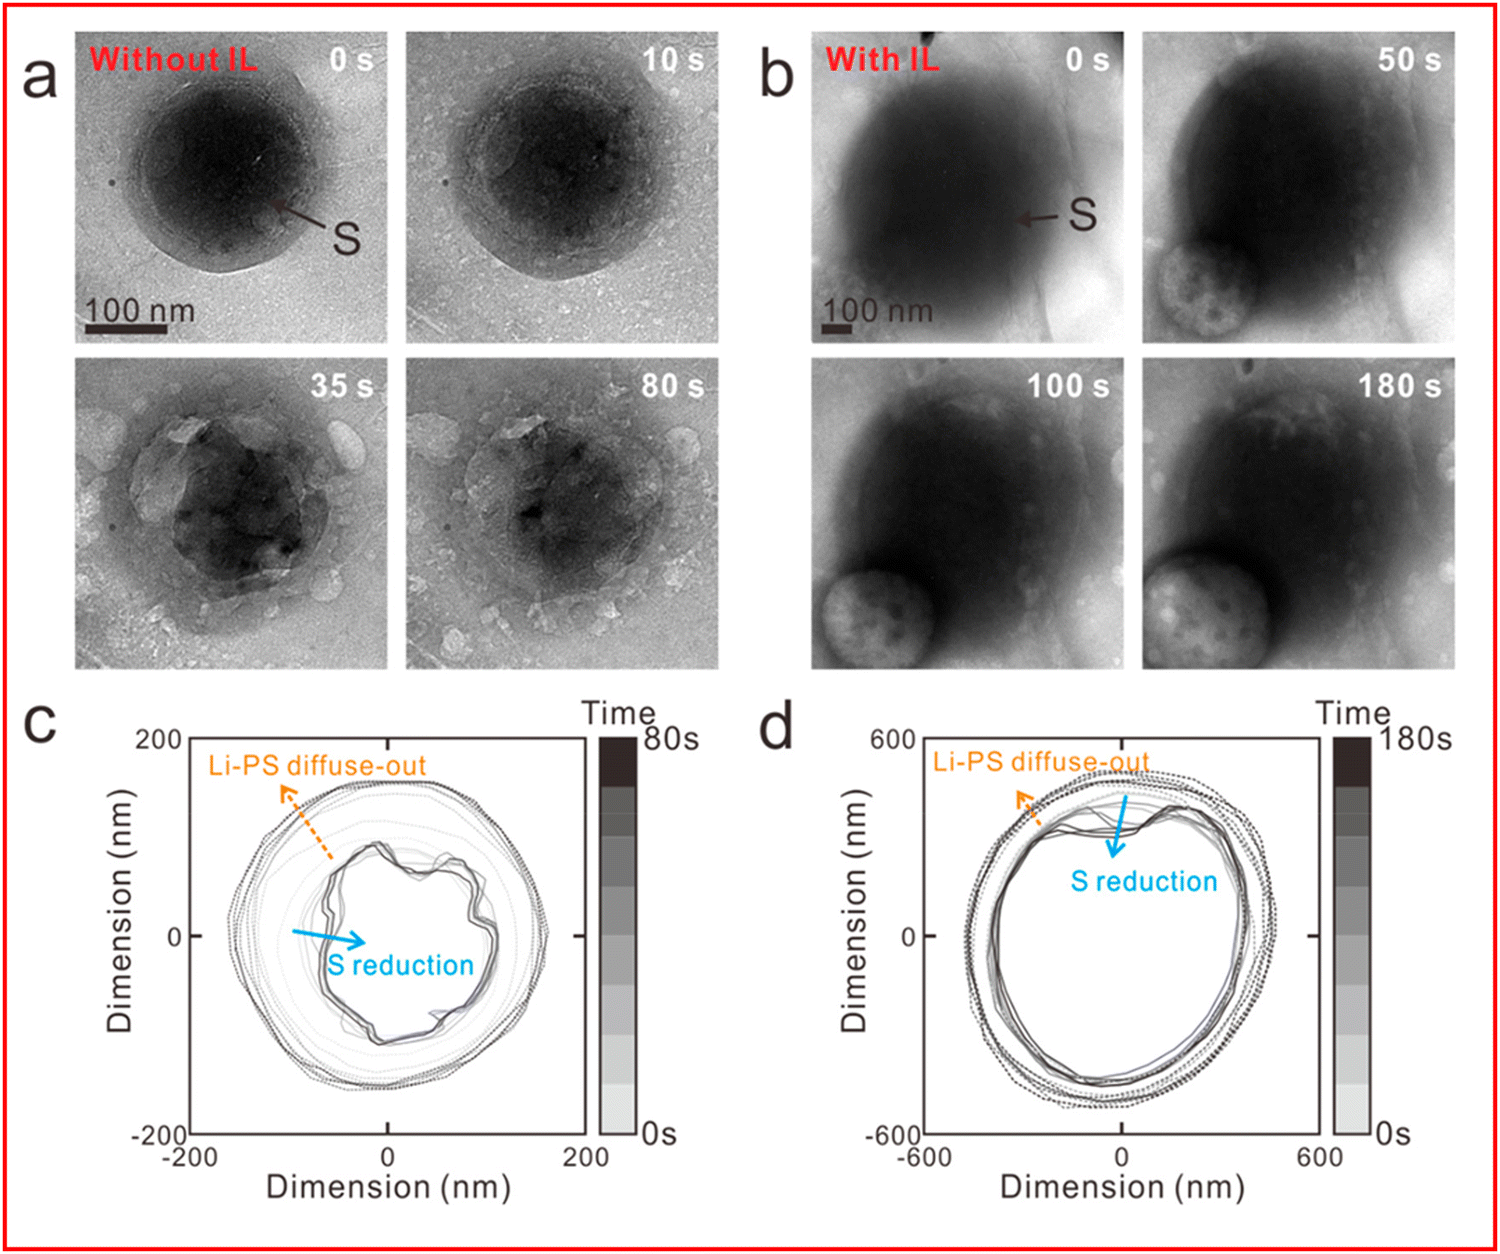 | ||
| Fig. 14 (a) and (b) TEM image of sulfur nanoparticles during lithiation (a) without an ionic liquid electrolyte and (b) with ionic liquid electrolyte; (c) and (d) outer boundaries of sulfur particle and LiPS and their evolution over time from (a) and (b) respectively. ((a)–(d) Reproduced with permission from ref. 140, Copyright (2020) American Chemical Society.) | ||
Another recent example of liquid cell in situ TEM is the work by Zhou et al. investigating the use of molybdenum nanoclusters deposited on N-doped graphene (MoNCs/N-G) and the effect this surface has on the deposition of Li2S.141 In this study they find that molybdenum nanoclusters can alter both the mechanism of deposition and the morphology of the Li2S deposited onto the electrode. On a bare titanium electrode, the deposition of Li2S is in rod or plate-like formations from single depositions that cluster together via Li2S2. In the MoNCs/N-G coated titanium electrode a droplet shaped dense phase of LiPS is formed near the surface where both amorphous and nanocrystalline Li2S were deposited directly from the LiPS phase.
4 Other in situ/operando techniques
Some of the in situ/operando techniques used in LSBs do not fit into either of the above categories as they either do not use spectroscopic analyses or do not provide information on the morphology and topographical features, and they are discussed here.4.1 Electrochemical quartz crystal microbalance analysis (EQCM)
EQCM is an extremely sensitive operando gravimetric analysis where mass changes of nanogram scale can be calculated by measuring changes in the resonance frequency of a quartz crystal which functions as an electrode during an electrochemical experiment.Most applications of EQCM in LSBs focus on quantifying the LiPS entrapment mechanism that is commonly visualised qualitatively using other techniques.29,142–145 Singh et al. used EQCM to measure this effect on their poly(ionic liquid)–zinc polyoxometalate composite cathode which is found to allow the LiPS conversion reactions to occur whilst the molecules remain intercalated.29 An increase in mass is observed at the cathode due to the insertion of Li+ to decrease the LiPS chain length as the cell discharges. An opposite effect is found to occur on charging the cell where the extraction of Li+ occurs. Wu et al. found an unstable crystal resistance during cycling, likely caused by changes in the density, viscosity of electrolyte, the roughness of the surface deposits on the quartz crystal or changes in the electrode volume, although it is most likely that a combination of all these factors is the cause.144 The increasing crystal resistance means that the Sauerbrey equation, which is used to convert frequency changes to mass changes, becomes invalid since this equation assumes a thin uniformly deposited mass, making quantification of mass changes impossible for most of the cycling process of the author's cell. They were able to establish that 35% of LiPS dissolved into the electrolyte, highlighting the need for effective cathode binders in LSBs.
An interesting study by Zeng et al. uses EQCM to study SEI layer formation on the lithium metal anode using transition metal acetates (TMA) as electrolyte additives to form the protective layer (Fig. 15(a)).146 Their study mainly focuses on the use of zinc and copper as the transition metal, due to their sustained capacity and coulombic efficiency over 500 cycles. Zeng et al. found that over the first 5 cycles a cell with a TMA has a higher mass change due to the increased molar mass and improved kinetics for SEI formation. TMA reacts with some LiPS to form a transition metal sulfide layer on the anode which can interact with Li2S to form a uniform and dense SEI layer that prevents dendrite growth. However, the rate of deposition is greater for the cell without TMA leading to greater depositions forming over time (Fig. 15(b)).
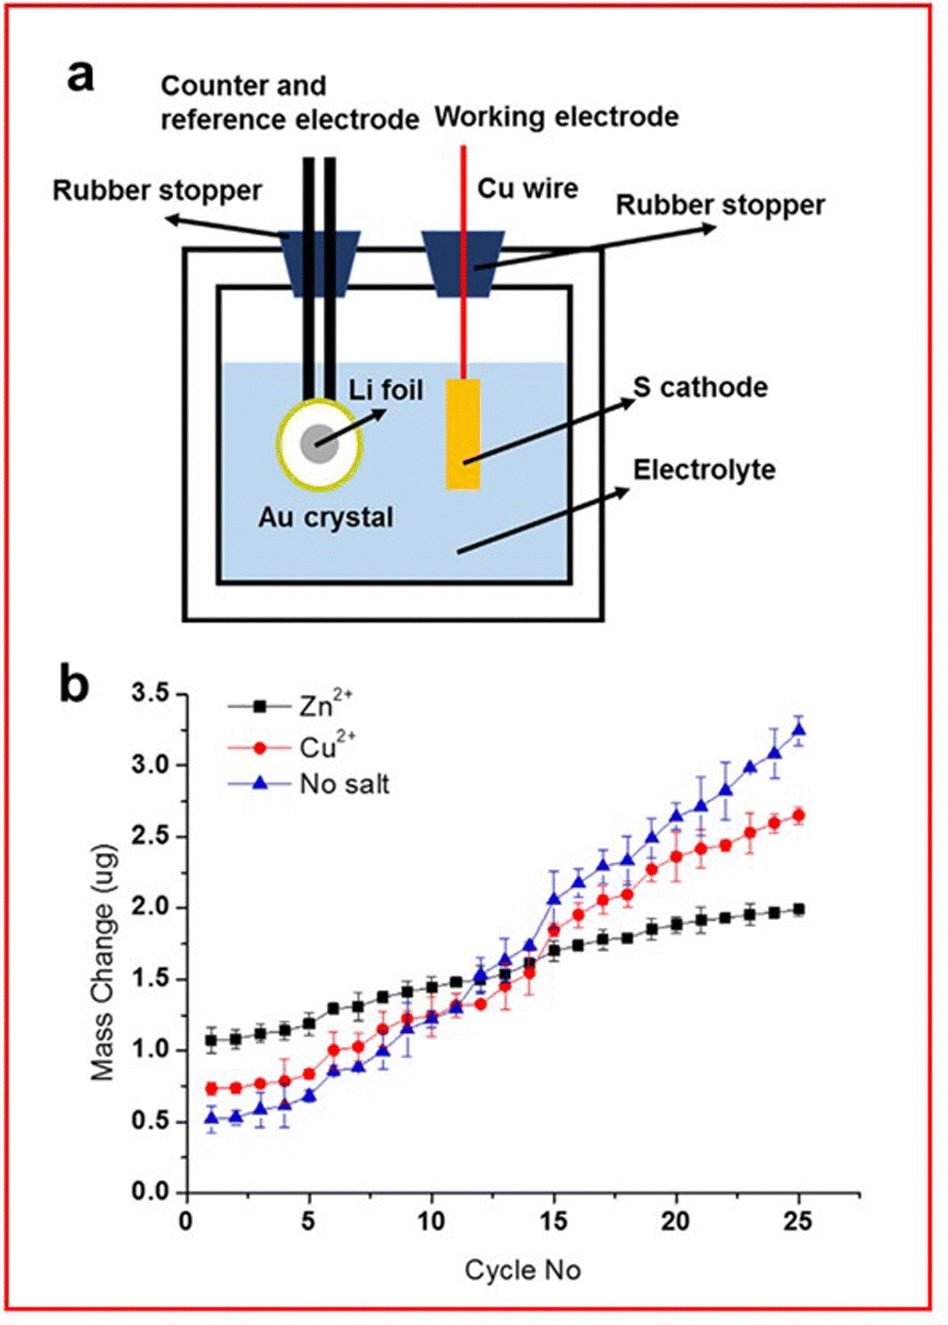 | ||
| Fig. 15 (a) Schematic of an EQCM set-up for an LSB; (b) mass change measured through EQCM for the lithium anode with an electrolyte containing either no salt (blue) or TMA salt (Zn2+ in black and Cu2+ in red). ((a) and (b) Reproduced with permission from ref. 146, Copyright (2019) Elsevier.) | ||
4.2 Microcalorimetry
Microcalorimetry is used to measure the heat generated from a reaction, or a device. In the case of batteries, heat is generated during discharge as the primary reaction is exothermic, although some intermediate reaction steps can be endothermic such as the conversion of long chain to short chain LiPS in LSBs. In a study by Cheng et al., operando XRD and microcalorimetry are used to gain insight into the properties of their porous carbon sheets doped with nitrogen, oxygen and phosphorus.98 They observe heat generated during the first discharge plateau and ascribe this to the dissolution of sulfur into long chain LiPS, followed by a drop in heat produced due to the endothermic LiPS chain shortening (Fig. 16). A final peak is observed when Li2S is generated in the final stage of discharge. This method does provide some insight into the mechanism of the discharge as there is a notable change in the heat generation profile at higher C-rates suggesting different reaction kinetics, or different reaction mechanisms, are occurring despite a negligible change in the voltage profile. The proposed explanation for this effect is due to incomplete reductions of both sulfur and LiPS causing heat evolution at a delayed stage of discharge due to the high rate.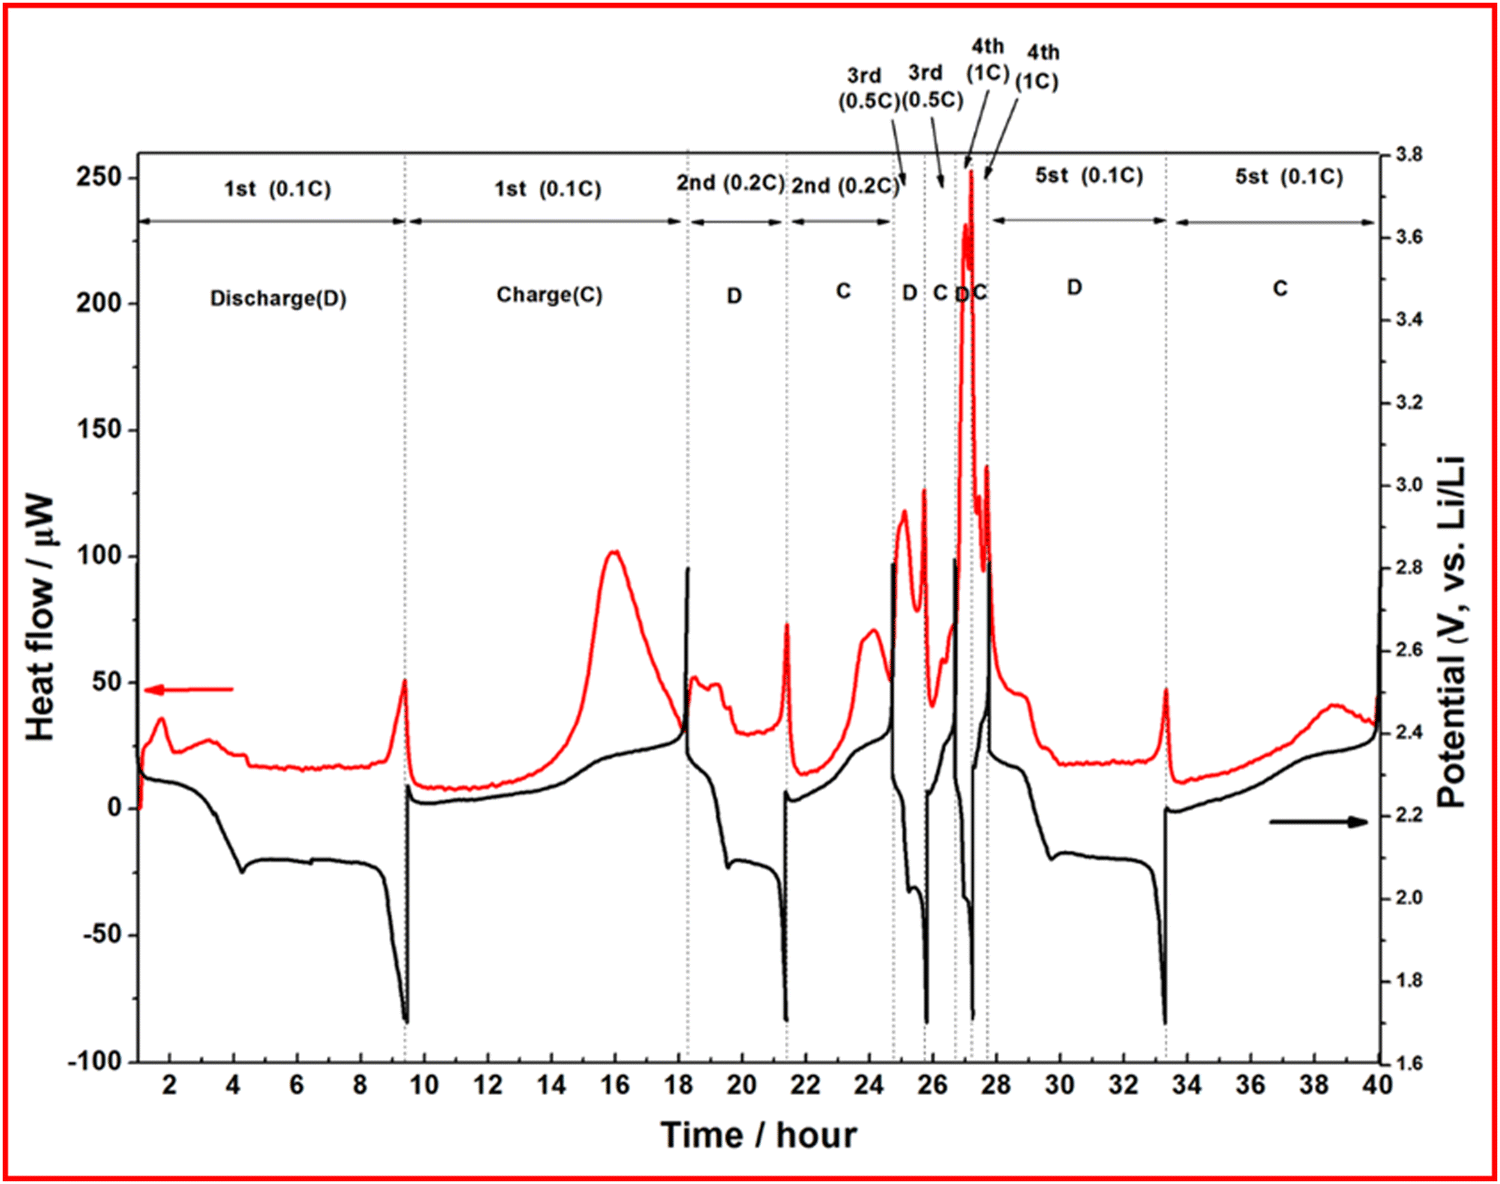 | ||
| Fig. 16 Discharge profile (black) and heat generation (red) at different C-rates (0.1C to 1C) for a nitrogen and phosphorus doped carbon–sulfur cathode. Reproduced with permission from ref. 98, Copyright (2023) Royal Society of Chemistry. | ||
In addition to helping to understand the polysulfide discharge mechanisms, this technology could provide a great deal of insight into a large-scale LSB, especially for use in monitoring issues like thermal runaway or just generally monitoring the fluctuation in temperature throughout the cells.
5 Summary & outlook
The number of studies utilising in situ techniques for studying LSBs is rapidly growing and has led to some thought-provoking insights into the operation, mechanism of sulfur speciation and formation of the SEI layer. It has been shown rigorously that LiPS can be effectively sequestered to the cathode side of the cell using sulfurized polymer backbones as cathode binders and novel separator coatings such as bismuth-based PP separators. Additionally, the use of different electrolyte formulations and additives can beneficially alter the mechanism of discharge to produce batteries with high capacity and coulombic efficiency over many cycles.A summary of the techniques discussed in this review has been collated into Table 2. Each of these techniques have their own merits and drawbacks yet all have great potential for future applications in LSB research and development. Some of these techniques are more established in the field of LSBs, mainly XRD and Raman spectroscopy, these techniques have seen widespread applications in different LSB environments, and it is likely due to the limitations of these techniques that in recent years other methods have seen increased interest from academia. There are some techniques that are in their infancy when compared to the others in LSB research, such as XPS and microcalorimetry. The use of XPS to study the formation of the SEI layer in an in situ experiment, both to study the chemical composition and the thickness of the layer, is a promising prospect for this method. Microcalorimetry could be employed in any study that reports a new mechanism for charge and discharge, this may provide some insight into the mechanism and its viability for scale-up.
| Section | Technique | Primary application(s) | Advantages | Limitations |
|---|---|---|---|---|
| Spectroelectrochemical analysis | UV-vis | Monitoring LiPS speciation and concentration during cycling | Cheap and well-established technique | Low concentration of active material (<100 mM) is required |
| Raman | Deciphering discharge/charge mechanism and detecting LiPS | Can target a variety of cell components | Low C-rate must be applied | |
| Infrared | Solvent stability studies and monitoring of LiPS speciation | Fast C-rates closer to normal operation | Presence of LiTFSI can obscure S–S bond data | |
| NMR | Monitoring LiPS, Li2S and different lithium environments evolution through discharge | Both LiPS and lithium metal can be monitored using the same cell | LiPS cannot be distinguished from each other due to limited resolution | |
| XAS | Studying effectiveness of electrodes and separators for LiPS binding or sequestration | Can detect amorphous Li2S and LiPS | Damages the surface through the “beam effect” | |
| XPS | Studying electrolyte–anode interface | Identifying terminal and bridging sulfur atoms | UHV required limits electrolyte choices and very high cost | |
| Morphological and topographical analyses | XRD | Evolution of crystalline Li2S and S throughout cycling | Average crystalline size calculated from spectra | Only crystalline species can be observed |
| XRT | Visualising sulfur utilisation | Identifying different crystalline phases | Low resolution can miss nano-sized features | |
| XRF | Identifying distribution of sulfur | Visualising LiPS shuttle | Low chemical sensitivity | |
| TXM | Observation of sulfur particles and SEI layer formation | Larger penetration depth than other microscopies | Low chemical information | |
| AFM | SEI layer and Li2S deposition observation | Ångstrom-scale resolution possible | Low chemical information | |
| SEM | Dendrite formation on lithium anode | Detailed observation of lithium plating process | Sample can become charged if incorrect parameters are used | |
| TEM | Formation of Li2S formation and decomposition | Topographical and morphological data | UHV required which limit electrolyte and cathode structure choice | |
| Other techniques | EQCM | Measuring mass deposition on electrodes | Allows quantification of sulfur binding | Very sensitive to noise |
| Micro-calorimetry | Measuring heat generation throughout cycling | Can calculate reaction enthalpies | No chemical information obtainable | |
The use of multiple in situ techniques in combination is also commonplace in the literature and has been discussed in a few examples so far, specifically by Thangavel et al. who use AFM and Raman spectroscopy to provide both topological and chemical information about the cell and Marceau et al. who couple SEM and UV-vis spectroscopy.51,133 When a morphological technique and a spectroscopic technique are coupled together it allows certain species, usually sulfur, to be monitored in all stages of cycling, as the morphological technique can help visualise the insoluble species and the spectroscopic technique observes the soluble species. This can provide a deeper insight into the discharge mechanism present in LSBs.
Whilst the techniques are described as being used in tandem it is rarely the case that they are performed simultaneously as most techniques require different operating conditions or environments for effective measurements. This means that the mechanism or imaging observed may not be the same as in the complimentary technique being used, this was highlighted by Chien et al. who show that the cell geometry can profoundly alter the performance of the cell and the mechanism of discharge.108
At this stage the authors would like to echo the message in Vargas-Barbosa's recent communication calling for more standardised testing in batteries.147 In order for effective comparisons to be made between different studies a benchmark cell configuration and suite of standard tests needs to be established for LSBs. The need for this benchmark is highlighted by work by Zou and Lou,32 Blanchard and Slagter,43 and Dillard et al.,63 where different reaction intermediates were observed through UV-vis, Raman, and IR spectroscopy respectively. All three studies used ether-based solvents with different additives, electrodes, electrochemical conditions or even the specific electrochemical test profile performed during in situ testing, this makes direct comparisons of cells in similar solvent systems impossible due to the number of variable changes or lack of necessary data. Additionally, if researchers would report performance and mechanisms of in situ testing beyond the preliminary few cycles a greater understanding of the operating conditions inside the cell can be deciphered. Whilst it is appreciated that these cycles are important to develop an understanding of how certain factors, such as SEI formation, affects performance of the LSB it is equally important to understand how to extend battery life and considerable progress could be achieved through in situ analysis.
A benchmark cell configuration should consist of a lithium metal anode and a carbon/sulfur cathode, either slurry or intercalation method whichever is closer to that being tested in the novel work. The electrolyte for this cell should be a 1:1 v/v solution of DOL and DME containing 1 M LiTFSI and 2 wt% LiNO3 as this is the most common electrolyte system studied in LSBs. The key performance considerations of the benchmark should be to establish a standard for the discharge capacity at different C-rates, through a rate capability test, and the coulombic efficiency of the cell. This kind of testing can be performed on any potentiostat or battery cycling system which should be in the arsenal of all battery researchers. Additionally, a standard for impedance should be achieved through EIS as this can provide necessary information on the electrolyte and charge transfer resistance.
Additionally, it would be beneficial if efforts were made to quantify the features observed during testing, for example a measure of the concentration of LiPS on the anode side of the cell to test the efficacy of a separator or cathode structure would enable far better comparison between models rather than relying on visual analysis.
The prospects of in situ/operando testing of LSBs is promising as new materials are continually being manufactured which can alter the discharge mechanism, or change the formation of the SEI layer, and, ultimately, improve the cell's performance. If LSBs are to become a replacement technology for LIBs then significant advances are required with respect to the longevity of the cells for them to become marketable, although this will take a large amount of time to study using in situ/operando techniques. Many different methods are being employed to improve LSBs, such as improved cathode binders to prevent LiPS shuttle and novel electrolyte additives to form a stable SEI layer, but it will not be one of these areas that unlocks the potential of the LSB technology but rather a combination of all. Due to the ever advancing, and sometimes increasingly complicated, methods used for improving LSBs the need for in situ techniques will continue to be in high demand and continue to contribute significantly to the understanding of LSBs.
Author contributions
Thomas J. Leckie: writing – original draft, writing – review and editing. Stuart D. Robertson: proof reading and editing, and supervision. Edward Brightman: proof reading and editing, resources, supervision, and project administration.Data availability
No primary research results, software or code have been included and no new data were generated or analysed as part of this review.Conflicts of interest
There are no conflicts to declare.Acknowledgements
We thank EPSRC Doctoral Training Partnership DTP 2224 [EP/W524670/1] and StorTera Ltd. for a PhD scholarship for T. J. L.References
- J. B. Robinson, K. Xi, R. V. Kumar, A. C. Ferrari, H. Au, M.-M. Titirici, A. Parra-Puerto, A. Kucernak, S. D. S. Fitch, N. Garcia-Araez, Z. L. Brown, M. Pasta, L. Furness, A. J. Kibler, D. A. Walsh, L. R. Johnson, C. Holc, G. N. Newton, N. R. Champness, F. Markoulidis, C. Crean, R. C. T. Slade, E. I. Andritsos, Q. Cai, S. Babar, T. Zhang, C. Lekakou, N. Kulkarni, A. J. E. Rettie, R. Jervis, M. Cornish, M. Marinescu, G. Offer, Z. Li, L. Bird, C. P. Grey, M. Chhowalla, D. D. Lecce, R. E. Owen, T. S. Miller, D. J. L. Brett, S. Liatard, D. Ainsworth and P. R. Shearing, J. Phys. Energy, 2021, 3, 031501 CrossRef CAS.
- P. G. Bruce, S. A. Freunberger, L. J. Hardwick and J.-M. Tarascon, Nat. Mater., 2012, 11, 19–29 CrossRef CAS PubMed.
- G. Zhou, H. Chen and Y. Cui, Nat. Energy, 2022, 7, 312–319 CrossRef CAS.
- N. Nakamura, S. Ahn, T. Momma and T. Osaka, J. Power Sources, 2023, 558, 232566 CrossRef CAS.
- Lithium Sulfur Batteries Market Forecast, Share, Size Overview By 2033, https://www.thebusinessresearchcompany.com/report/lithium-sulfur-batteries-global-market-report, (accessed 13 June 2024).
- N. Angulakshmi, R. B. Dhanalakshmi, S. Sathya, J.-H. Ahn and A. M. Stephan, Batteries Supercaps, 2021, 4, 1064–1095 CrossRef CAS.
- E. Zhao, K. Nie, X. Yu, Y.-S. Hu, F. Wang, J. Xiao, H. Li and X. Huang, Adv. Funct. Mater., 2018, 28, 1707543 CrossRef.
- R. Fang, S. Zhao, Z. Sun, D.-W. Wang, H.-M. Cheng and F. Li, Adv. Mater., 2017, 29, 1606823 CrossRef PubMed.
- J.-H. Tian, T. Jiang, M. Wang, Z. Hu, X. Zhu, L. Zhang, T. Qian and C. Yan, Small Methods, 2020, 4, 1900467 CrossRef CAS.
- J. Tan, D. Liu, X. Xu and L. Mai, Nanoscale, 2017, 9, 19001–19016 RSC.
- L. Zhou, D. L. Danilov, F. Qiao, J. Wang, H. Li, R.-A. Eichel and P. H. L. Notten, Adv. Energy Mater., 2022, 12, 2202094 CrossRef CAS.
- M. Wang, Z. Bai, T. Yang, C. Nie, X. Xu, Y. Wang, J. Yang, S. Dou and N. Wang, Adv. Energy Mater., 2022, 12, 2201585 CrossRef CAS.
- H. Yuan, J.-Q. Huang, H.-J. Peng, M.-M. Titirici, R. Xiang, R. Chen, Q. Liu and Q. Zhang, Adv. Energy Mater., 2018, 8, 1802107 CrossRef.
- K. Dong, S. Wang and J. Yu, RSC Adv., 2014, 4, 47517–47520 RSC.
- L. Zhang, M. Ling, J. Feng, L. Mai, G. Liu and J. Guo, Energy Storage Mater., 2018, 11, 24–29 CrossRef.
- K. Qin, K. Holguin, M. Mohammadiroudbari, J. Huang, E. Y. S. Kim, R. Hall and C. Luo, Adv. Funct. Mater., 2021, 31, 2009694 CrossRef CAS.
- L. Huang, J. Li, B. Liu, Y. Li, S. Shen, S. Deng, C. Lu, W. Zhang, Y. Xia, G. Pan, X. Wang, Q. Xiong, X. Xia and J. Tu, Adv. Funct. Mater., 2020, 30, 1910375 CrossRef CAS.
- Q. Shao, S. Zhu and J. Chen, Nano Res., 2023, 16, 8097–8138 CrossRef CAS.
- G. Hinds, Curr. Opin. Electrochem., 2017, 5, 11–19 CrossRef CAS.
- Y. Yang, J. Feijóo, V. Briega-Martos, Q. Li, M. Krumov, S. Merkens, G. De Salvo, A. Chuvilin, J. Jin, H. Huang, C. J. Pollock, M. B. Salmeron, C. Wang, D. A. Muller, H. D. Abruña and P. Yang, Curr. Opin. Electrochem., 2023, 42, 101403 CrossRef.
- X. Tang, Z. Xu, Z. Sun, J. Zhou, X. Wu, H. Lin, J. Rong, S. Zhuo and F. Li, Energy Technol., 2019, 7, 1900574 CrossRef.
- Q. Wang, J. Zheng, E. Walter, H. Pan, D. Lv, P. Zuo, H. Chen, Z. D. Deng, B. Y. Liaw, X. Yu, X. Yang, J.-G. Zhang, J. Liu and J. Xiao, J. Electrochem. Soc., 2015, 162, A474 CrossRef CAS.
- R. Steudel and T. Chivers, Chem. Soc. Rev., 2019, 48, 3279–3319 RSC.
- A. C. González-Baró, G. Espino, A. Colina and A. Heras, in Springer Handbook of Inorganic Photochemistry, ed. D. Bahnemann and A. O. T. Patrocinio, Springer International Publishing, Cham, 2022, pp. 171–206 CAS.
- X. Guan, H. Pei, X. Chen, C. Chang, S. Shao, Y.-M. Zhang, X. Zhou, H. Nie and X. Xie, J. Colloid Interface Sci., 2023, 652, 997–1005 CrossRef CAS PubMed.
- É. A. Santos, C. G. Anchieta, R. C. Fernandes, M. J. Pinzón C, A. N. Miranda, I. Galantini, F. C. B. Maia, G. Doubek, C. B. Rodella, L. M. Da Silva and H. Zanin, Nano Energy, 2023, 116, 108809 CrossRef.
- R. Price, L. MacDonald, N. Gillies, A. Day, E. Brightman and J. Li, Faraday Discuss., 2023, 247, 268–288 RSC.
- G. S. Taiwo, A. Rashti, M. Mishra and K. P. C. Yao, J. Electrochem. Soc., 2022, 169, 090518 CrossRef CAS.
- V. Singh, A. K. Padhan, S. D. Adhikary, A. Tiwari, D. Mandal and T. C. Nagaiah, J. Mater. Chem. A, 2019, 7, 3018–3023 RSC.
- M. Yu, Z. Dong, K. Wang, X. Wang, Q. Hou, J. Mu, H. Jiang, J. Guo, X. Liu, X. Qi, Y. Dai, W. Zheng, X. Li and G. He, Sep. Purif. Technol., 2024, 328, 125044 CrossRef CAS.
- Y.-W. Song, L. Shen, N. Yao, X.-Y. Li, C.-X. Bi, Z. Li, M.-Y. Zhou, X.-Q. Zhang, X. Chen, B.-Q. Li, J.-Q. Huang and Q. Zhang, Chem, 2022, 8, 3031–3050 CAS.
- Q. Zou and Y.-C. Lu, J. Phys. Chem. Lett., 2016, 7, 1518–1525 CrossRef CAS PubMed.
- X. Ni, T. Qian, X. Liu, N. Xu, J. Liu and C. Yan, Adv. Funct. Mater., 2018, 28, 1706513 CrossRef.
- N. Xu, T. Qian, X. Liu, J. Liu, Y. Chen and C. Yan, Nano Lett., 2017, 17, 538–543 CrossRef CAS PubMed.
- W. Chen, T. Qian, J. Xiong, N. Xu, X. Liu, J. Liu, J. Zhou, X. Shen, T. Yang, Y. Chen and C. Yan, Adv. Mater., 2017, 29, 1605160 CrossRef PubMed.
- M. Ling, L. Zhang, T. Zheng, J. Feng, J. Guo, L. Mai and G. Liu, Nano Energy, 2017, 38, 82–90 CrossRef CAS.
- J. H. Park, K. M. Choi, D. K. Lee, B. C. Moon, S. R. Shin, M.-K. Song and J. K. Kang, Sci. Rep., 2016, 6, 25555 CrossRef CAS PubMed.
- R. Dou, Q. Wang, X. Ren and L. Lu, Chem. Res. Chin. Univ., 2024, 40, 279–286 CrossRef CAS.
- Q. He, A. T. S. Freiberg, M. U. M. Patel, S. Qian and H. A. Gasteiger, J. Electrochem. Soc., 2020, 167, 080508 CrossRef CAS.
- B. Yan, X. Li, Z. Bai, X. Song, D. Xiong, M. Zhao, D. Li and S. Lu, J. Power Sources, 2017, 338, 34–48 CrossRef CAS.
- Z. Huang, L. Wang, Y. Xu, H. Li, X. Wang, B. Su, F. Xu, Z. Qiu and B. Zhu, ACS Appl. Mater. Interfaces, 2023, 15, 14350–14358 CAS.
- H.-L. Wu, L. A. Huff and A. A. Gewirth, ACS Appl. Mater. Interfaces, 2015, 7, 1709–1719 CrossRef CAS PubMed.
- D. Blanchard and M. Slagter, J. Phys. Energy, 2021, 3, 044003 CrossRef CAS.
- T. Wang, Q. Zhang, J. Zhong, M. Chen, H. Deng, J. Cao, L. Wang, L. Peng, J. Zhu and B. Lu, Adv. Energy Mater., 2021, 11, 2100448 CrossRef CAS.
- W. Chen, T. Lei, T. Qian, W. Lv, W. He, C. Wu, X. Liu, J. Liu, B. Chen, C. Yan and J. Xiong, Adv. Energy Mater., 2018, 8, 1702889 CrossRef.
- S. Chauque, B. L. Souza, H. M. Sintaku, R. A. Ando and R. M. Torresi, Electrochim. Acta, 2024, 475, 143539 CrossRef CAS.
- J. Hannauer, J. Scheers, J. Fullenwarth, B. Fraisse, L. Stievano and P. Johansson, ChemPhysChem, 2015, 16, 2755–2759 CrossRef CAS PubMed.
- C.-J. Huang, J.-H. Cheng, W.-N. Su, P. Partovi-Azar, L.-Y. Kuo, M.-C. Tsai, M.-H. Lin, S. Panahian Jand, T.-S. Chan, N.-L. Wu, P. Kaghazchi, H. Dai, P. M. Bieker and B.-J. Hwang, J. Power Sources, 2021, 492, 229508 CrossRef CAS.
- W. Yao, W. Zheng, J. Xu, C. Tian, K. Han, W. Sun and S. Xiao, ACS Nano, 2021, 15, 7114–7130 CrossRef CAS PubMed.
- W. Yao, C. Tian, C. Yang, J. Xu, Y. Meng, I. Manke, N. Chen, Z. Wu, L. Zhan, Y. Wang and R. Chen, Adv. Mater., 2022, 34, 2106370 CrossRef CAS PubMed.
- N. K. Thangavel, K. Mahankali and L. M. R. Arava, J. Electrochem. Soc., 2022, 169, 060501 CrossRef CAS.
- P. Chen, T. Wang, D. He, T. Shi, M. Chen, K. Fang, H. Lin, J. Wang, C. Wang and H. Pang, Angew. Chem., Int. Ed., 2023, 62, e202311693 CrossRef CAS PubMed.
- F. Han, L. Fan, X. Ma, H. Lu, L. Li, X. Zhang and L. Wu, Energy Environ. Mater., 2023, 7, e12623 CrossRef.
- B. P. Vinayan, T. Diemant, X.-M. Lin, M. A. Cambaz, U. Golla-Schindler, U. Kaiser, R. Jürgen Behm and M. Fichtner, Adv. Mater. Interfaces, 2016, 3, 1600372 CrossRef.
- C. Fu, M. B. Oviedo, Y. Zhu, A. von Wald Cresce, K. Xu, G. Li, M. E. Itkis, R. C. Haddon, M. Chi, Y. Han, B. M. Wong and J. Guo, ACS Nano, 2018, 12, 9775–9784 CrossRef CAS PubMed.
- U. Zubair, S. Bianco, J. Amici, C. Francia and S. Bodoardo, J. Power Sources, 2020, 461, 228144 CrossRef CAS.
- J. H. Yun, J.-H. Kim, P. Ragupathy, D. J. Kim and D. K. Kim, J. Mater. Chem. A, 2021, 9, 18260–18271 RSC.
- R. Li, Z. Bai, W. Hou, Z. Wu, P. Feng, Y. Bai, K. Sun and Z. Wang, Chin. Chem. Lett., 2023, 34, 108263 CrossRef CAS.
- Y. Zhang, Y. Cao, L. Fan, G. Shi, T. Zheng, H. Liu, J. Song and G. Gao, Chem. Eng. J., 2024, 482, 148991 CrossRef CAS.
- D. Cao, X. Sun, F. Li, S.-M. Bak, T. Ji, M. Geiwitz, K. S. Burch, Y. Du, G. Yang and H. Zhu, Angew. Chem., Int. Ed., 2023, 62, e202302363 CrossRef CAS PubMed.
- N. Saqib, C. J. Silva, C. M. Maupin and J. M. Porter, Appl. Spectrosc., 2017, 71, 1593–1599 CrossRef CAS PubMed.
- A. Rafie, R. Pereira, A. A. Shamsabadi and V. Kalra, J. Phys. Chem. C, 2022, 126, 12327–12338 CrossRef CAS.
- C. Dillard, A. Singh and V. Kalra, J. Phys. Chem. C, 2018, 122, 18195–18203 CrossRef CAS.
- R. Pereira, K. K. Sarode, A. Rafie, A. Fafarman and V. Kalra, J. Phys. Chem. C, 2023, 127, 19356–19365 CrossRef CAS.
- P. Larkin, in Infrared and Raman Spectroscopy, ed. P. Larkin, Elsevier, Oxford, 2011, pp. 27–54 Search PubMed.
- M. Rashid, S. K. Singh and C. Singh, in Modern Techniques of Spectroscopy: Basics, Instrumentation, and Applications, ed. D. K. Singh, M. Pradhan and A. Materny, Springer, Singapore, 2021, pp. 469–512 Search PubMed.
- L. Carbone, M. Gobet, J. Peng, M. Devany, B. Scrosati, S. Greenbaum and J. Hassoun, ACS Appl. Mater. Interfaces, 2015, 7, 13859–13865 CrossRef CAS PubMed.
- M. U. M. Patel, I. Arčon, G. Aquilanti, L. Stievano, G. Mali and R. Dominko, ChemPhysChem, 2014, 15, 894–904 CrossRef CAS PubMed.
- A. Hoefling, D. T. Nguyen, P. Partovi-Azar, D. Sebastiani, P. Theato, S.-W. Song and Y. J. Lee, Chem. Mater., 2018, 30, 2915–2923 CrossRef CAS.
- T.-Z. Hou, W.-T. Xu, X. Chen, H.-J. Peng, J.-Q. Huang and Q. Zhang, Angew. Chem., Int. Ed., 2017, 56, 8178–8182 CrossRef CAS PubMed.
- R. Bradbury, N. Kardjilov, G. F. Dewald, A. Tengattini, L. Helfen, W. G. Zeier and I. Manke, Adv. Funct. Mater., 2023, 33, 2302619 CrossRef CAS.
- L. A. Huff, J. L. Rapp, J. A. Baughman, P. L. Rinaldi and A. A. Gewirth, Surf. Sci., 2015, 631, 295–300 CrossRef CAS.
- J. Xiao, J. Z. Hu, H. Chen, M. Vijayakumar, J. Zheng, H. Pan, E. D. Walter, M. Hu, X. Deng, J. Feng, B. Y. Liaw, M. Gu, Z. D. Deng, D. Lu, S. Xu, C. Wang and J. Liu, Nano Lett., 2015, 15, 3309–3316 CrossRef CAS PubMed.
- K. A. See, M. Leskes, J. M. Griffin, S. Britto, P. D. Matthews, A. Emly, A. Van der Ven, D. S. Wright, A. J. Morris, C. P. Grey and R. Seshadri, J. Am. Chem. Soc., 2014, 136, 16368–16377 CrossRef CAS PubMed.
- H. Wang, N. Sa, M. He, X. Liang, L. F. Nazar, M. Balasubramanian, K. G. Gallagher and B. Key, J. Phys. Chem. C, 2017, 121, 6011–6017 CrossRef CAS.
- N. J. Stone, At. Data Nucl. Data Tables, 2016, 111–112, 1–28 CrossRef CAS.
- A. Dorai, J. Kawamura and T. Omata, Electrochem. Commun., 2022, 141, 107360 CrossRef CAS.
- S. P. Cramer, in X-Ray Spectroscopy with Synchrotron Radiation: Fundamentals and Applications, ed. S. P. Cramer, Springer International Publishing, Cham, 2020, pp. 131–164 Search PubMed.
- L. Jia, J. Wang, S. Ren, G. Ren, X. Jin, L. Kao, X. Feng, F. Yang, Q. Wang, L. Pan, Q. Li, Y. Liu, Y. Wu, G. Liu, J. Feng, S. Fan, Y. Ye, J. Guo and Y. Zhang, Energy Environ. Mater., 2021, 4, 222–228 CrossRef CAS.
- D. R. Wang, D. B. Shah, J. A. Maslyn, W. S. Loo, K. H. Wujcik, E. J. Nelson, M. J. Latimer, J. Feng, D. Prendergast, T. A. Pascal and N. P. Balsara, J. Electrochem. Soc., 2018, 165, A3487–A3495 CrossRef CAS.
- K. H. Wujcik, T. A. Pascal, C. D. Pemmaraju, D. Devaux, W. C. Stolte, N. P. Balsara and D. Prendergast, Adv. Energy Mater., 2015, 5, 1500285 CrossRef.
- A. Berger, A. T. S. Freiberg, A. Siebel, R. Thomas, M. U. M. Patel, M. Tromp, H. A. Gasteiger and Y. Gorlin, J. Electrochem. Soc., 2018, 165, A1288 CrossRef CAS.
- E. Zhao, J. Wang, F. Li, Z. Jiang, X.-Q. Yang, F. Wang, H. Li and X. Yu, Chem. Commun., 2019, 55, 4993–4996 RSC.
- Y. Gorlin, A. Siebel, M. Piana, T. Huthwelker, H. Jha, G. Monsch, F. Kraus, H. A. Gasteiger and M. Tromp, J. Electrochem. Soc., 2015, 162, A1146 CrossRef CAS.
- Y. Ye, A. Kawase, M.-K. Song, B. Feng, Y.-S. Liu, M. A. Marcus, J. Feng, E. J. Cairns, J. Guo and J. Zhu, Nanomaterials, 2016, 6, 14 CrossRef PubMed.
- M. Li, W. Liu, D. Luo, Z. Chen, K. Amine and J. Lu, ACS Energy Lett., 2022, 7, 577–582 CrossRef CAS.
- S. D. S. Fitch, G. E. Moehl, N. Meddings, S. Fop, S. Soulé, T.-L. Lee, M. Kazemian, N. Garcia-Araez and A. L. Hector, ACS Appl. Mater. Interfaces, 2023, 15, 39198–39210 CrossRef CAS PubMed.
- K. Sarode, T. Yim, R. Pereira, N. Cardoza and V. Kalra, Energy Adv., 2024, 3, 584–591 RSC.
- S. Chen, Y. Xiang, G. Zheng, Y. Liao, F. Ren, Y. Zheng, H. He, B. Zheng, X. Liu, N. Xu, M. Luo, J. Zheng and Y. Yang, ACS Appl. Mater. Interfaces, 2020, 12, 27794–27802 CrossRef CAS PubMed.
- Y. Torii, Y. Matsui, K. Yamamoto, S. Uchida, S. Yamazaki, T. Watanabe, K. Nakanishi, T. Uchiyama, Y. Uchimoto and M. Ishikawa, J. Phys. Chem. C, 2023, 127, 15069–15077 CrossRef CAS.
- X. Shen, T. Qian, P. Chen, J. Liu, M. Wang and C. Yan, ACS Appl. Mater. Interfaces, 2018, 10, 30058–30064 CrossRef CAS PubMed.
- M. I. Nandasiri, L. E. Camacho-Forero, A. M. Schwarz, V. Shutthanandan, S. Thevuthasan, P. B. Balbuena, K. T. Mueller and V. Murugesan, Chem. Mater., 2017, 29, 4728–4737 CrossRef CAS.
- H. Lu, N. Xu, X. Ni, J. Zhou, J. Liu, Z. Wang, T. Qian and C. Yan, J. Energy Chem., 2021, 58, 78–84 CrossRef CAS.
- X. Shen, Y. Li, T. Qian, J. Liu, J. Zhou, C. Yan and J. B. Goodenough, Nat. Commun., 2019, 10, 900 CrossRef PubMed.
- N. A. Cañas, S. Wolf, N. Wagner and K. A. Friedrich, J. Power Sources, 2013, 226, 313–319 CrossRef.
- W. Yao, J. Xu, Y. Cao, Y. Meng, Z. Wu, L. Zhan, Y. Wang, Y. Zhang, I. Manke, N. Chen, C. Yang and R. Chen, ACS Nano, 2022, 16, 10783–10797 CrossRef CAS PubMed.
- A. Schneider, C. Weidmann, C. Suchomski, H. Sommer, J. Janek and T. Brezesinski, Chem. Mater., 2015, 27, 1674–1683 CrossRef CAS.
- R. Cheng, J. Liu, P. Manasa, M. Zhou, Y. Guan, K. Zhang, X. Lin, F. Rosei, A. A. Pimerzin, H. J. Seifert, F. Xu, L. Sun, D. Cai, J. Zeng, Z. Cao and H. Pan, Inorg. Chem. Front., 2023, 10, 7038–7053 RSC.
- A. Zhu, S. Li, Y. Yang, B. Peng, Y. Cheng, Q. Kang, Z. Zhuang, L. Ma and J. Xu, Small, 2024, 20, 2305494 CrossRef CAS PubMed.
- T. Lai, A. Bhargav and A. Manthiram, Adv. Funct. Mater., 2023, 33, 2304568 CrossRef CAS.
- J. Conder, R. Bouchet, S. Trabesinger, C. Marino, L. Gubler and C. Villevieille, Nat. Energy, 2017, 2, 1–7 Search PubMed.
- S. Waluś, C. Barchasz, J.-F. Colin, J.-F. Martin, E. Elkaïm, J.-C. Leprêtre and F. Alloin, Chem. Commun., 2013, 49, 7899–7901 RSC.
- A. Paolella, W. Zhu, H. Marceau, C. Kim, Z. Feng, D. Liu, C. Gagnon, J. Trottier, G. Abdelbast, P. Hovington, A. Vijh, G. P. Demopoulos, M. Armand and K. Zaghib, J. Power Sources, 2016, 325, 641–645 CrossRef CAS.
- S. Huang, L. Liu, Y. Wang, Y. Shang, L. Zhang, J. Wang, Y. Zheng, O. G. Schmidt and H. Y. Yang, J. Mater. Chem. A, 2019, 7, 6651–6658 RSC.
- A. Krause, S. Dörfler, M. Piwko, F. M. Wisser, T. Jaumann, E. Ahrens, L. Giebeler, H. Althues, S. Schädlich, J. Grothe, A. Jeffery, M. Grube, J. Brückner, J. Martin, J. Eckert, S. Kaskel, T. Mikolajick and W. M. Weber, Sci. Rep., 2016, 6, 27982 CrossRef CAS PubMed.
- J. Kulisch, H. Sommer, T. Brezesinski and J. Janek, Phys. Chem. Chem. Phys., 2014, 16, 18765–18771 RSC.
- W. Zhao, Y. Lei, Y. Zhu, Q. Wang, F. Zhang, X. Dong and H. N. Alshareef, Nano Energy, 2021, 86, 106120 CrossRef CAS.
- Y.-C. Chien, A. S. Menon, W. R. Brant, D. Brandell and M. J. Lacey, J. Am. Chem. Soc., 2020, 142, 1449–1456 CrossRef CAS PubMed.
- S. Risse, E. Härk, B. Kent and M. Ballauff, ACS Nano, 2019, 13, 10233–10241 CrossRef CAS PubMed.
- C. J. Jafta, S. Prévost, L. He, M. Li, X.-G. Sun, G. Yang, I. Belharouak and J. Nanda, Energy Storage Mater., 2021, 40, 219–228 CrossRef.
- C. M. Jeffries, J. Ilavsky, A. Martel, S. Hinrichs, A. Meyer, J. S. Pedersen, A. V. Sokolova and D. I. Svergun, Nat. Rev. Methods Primer, 2021, 1, 1–39 CrossRef.
- Q. Lemarié, E. Maire, H. Idrissi, P.-X. Thivel, F. Alloin and L. Roué, ACS Appl. Energy Mater., 2020, 3, 2422–2431 CrossRef.
- Q. Lemarié, H. Idrissi, E. Maire, P.-X. Thivel, F. Alloin and L. Roué, J. Power Sources, 2020, 477, 228374 CrossRef.
- R. Xu, J. Xiang, J. Feng, X. Lu, Z. Hao, L. Kang, M. Li, Y. Wu, C. Tan, Y. Liu, G. He, D. J. L. Brett, P. R. Shearing, L. Yuan, Y. Huang and F. R. Wang, Energy Storage Mater., 2020, 31, 164–171 CrossRef.
- C. Tan, T. M. M. Heenan, R. F. Ziesche, S. R. Daemi, J. Hack, M. Maier, S. Marathe, C. Rau, D. J. L. Brett and P. R. Shearing, ACS Appl. Energy Mater., 2018, 1, 5090–5100 CrossRef CAS.
- S.-H. Yu, X. Huang, K. Schwarz, R. Huang, T. A. Arias, J. D. Brock and H. D. Abruña, Energy Environ. Sci., 2018, 11, 202–210 RSC.
- M. Sadd, S. De Angelis, S. Colding-Jørgensen, D. Blanchard, R. E. Johnsen, S. Sanna, E. Borisova, A. Matic and J. R. Bowen, Adv. Energy Mater., 2022, 12, 2103126 CrossRef CAS.
- G. Tonin, G. Vaughan, R. Bouchet, F. Alloin, M. Di Michiel, L. Boutafa, J.-F. Colin and C. Barchasz, Sci. Rep., 2017, 7, 2755 CrossRef PubMed.
- G. Tonin, G. B. M. Vaughan, R. Bouchet, F. Alloin and C. Barchasz, J. Power Sources, 2022, 520, 230854 CrossRef CAS.
- G. Tonin, G. B. M. Vaughan, R. Bouchet, F. Alloin, M. Di Michiel and C. Barchasz, J. Power Sources, 2020, 468, 228287 CrossRef CAS.
- Y.-C. Chien, H. Li, J. Lampkin, S. Hall, N. Garcia-Araez, W. R. Brant, D. Brandell and M. J. Lacey, Batteries Supercaps, 2022, 5, e202200058 CrossRef CAS.
- C. Tan, M. D. R. Kok, S. R. Daemi, D. J. L. Brett and P. R. Shearing, Phys. Chem. Chem. Phys., 2019, 21, 4145–4154 RSC.
- A. T. S. Freiberg, A. Siebel, A. Berger, S. M. Webb, Y. Gorlin, M. Tromp and H. A. Gasteiger, J. Phys. Chem. C, 2018, 122, 5303–5316 CrossRef CAS.
- X. Yu, H. Pan, Y. Zhou, P. Northrup, J. Xiao, S. Bak, M. Liu, K.-W. Nam, D. Qu, J. Liu, T. Wu and X.-Q. Yang, Adv. Energy Mater., 2015, 5, 1500072 CrossRef.
- Z. Wu, S.-M. Bak, Z. Shadike, S. Yu, E. Hu, X. Xing, Y. Du, X.-Q. Yang, H. Liu and P. Liu, ACS Appl. Mater. Interfaces, 2021, 13, 31733–31740 CrossRef CAS PubMed.
- Z. Wu, X. Ding, C. Zhang, G. Liu, Y. Tian and Y. Guan, in Advanced X-ray Imaging of Electrochemical Energy Materials and Devices, ed. J. Wang, Springer, Singapore, 2021, pp. 65–90 Search PubMed.
- C.-N. Lin, W.-C. Chen, Y.-F. Song, C.-C. Wang, L.-D. Tsai and N.-L. Wu, J. Power Sources, 2014, 263, 98–103 CrossRef CAS.
- M. A. Weret, S.-K. Jiang, K. N. Shitaw, C.-Y. Chang, T. M. Tekaligne, J.-C. Chiou, S.-C. Yang, N. T. Temesgen, Y. Nikodimos, S.-H. Wu, C.-C. Wang, W.-N. Su and B. J. Hwang, ACS Energy Lett., 2023, 8, 2817–2823 CrossRef CAS.
- J. Nelson, S. Misra, Y. Yang, A. Jackson, Y. Liu, H. Wang, H. Dai, J. C. Andrews, Y. Cui and M. F. Toney, J. Am. Chem. Soc., 2012, 134, 6337–6343 CrossRef CAS PubMed.
- S.-Y. Lang, Y. Shi, Y.-G. Guo, D. Wang, R. Wen and L.-J. Wan, Angew. Chem., Int. Ed., 2016, 55, 15835–15839 CrossRef CAS PubMed.
- S.-Y. Lang, Y. Shi, Y.-G. Guo, R. Wen and L.-J. Wan, Angew. Chem., Int. Ed., 2017, 56, 14433–14437 CrossRef CAS PubMed.
- K. Mahankali, N. K. Thangavel and L. M. Reddy Arava, Nano Lett., 2019, 19, 5229–5236 CrossRef CAS PubMed.
- H. Marceau, C.-S. Kim, A. Paolella, S. Ladouceur, M. Lagacé, M. Chaker, A. Vijh, A. Guerfi, C. M. Julien, A. Mauger, M. Armand, P. Hovington and K. Zaghib, J. Power Sources, 2016, 319, 247–254 CrossRef CAS.
- Y. Qiu, G. Rong, J. Yang, G. Li, S. Ma, X. Wang, Z. Pan, Y. Hou, M. Liu, F. Ye, W. Li, Z. W. Seh, X. Tao, H. Yao, N. Liu, R. Zhang, G. Zhou, J. Wang, S. Fan, Y. Cui and Y. Zhang, Adv. Energy Mater., 2015, 5, 1501369 CrossRef.
- G. Rong, X. Zhang, W. Zhao, Y. Qiu, M. Liu, F. Ye, Y. Xu, J. Chen, Y. Hou, W. Li, W. Duan and Y. Zhang, Adv. Mater., 2017, 29, 1606187 CrossRef PubMed.
- Electron Microscopy of Polymers, ed. G. H. Michler, Springer, Berlin, Heidelberg, 2008, pp. 15–51 Search PubMed.
- H. Kim, J. T. Lee, A. Magasinski, K. Zhao, Y. Liu and G. Yushin, Adv. Energy Mater., 2015, 5, 1501306 CrossRef.
- Z. Wang, Y. Tang, L. Zhang, M. Li, Z. Shan and J. Huang, Small, 2020, 16, 2001899 CrossRef CAS PubMed.
- S. Zhou, Q. Zheng, S. Tang, S.-G. Sun and H.-G. Liao, J. Chem. Phys., 2022, 157, 230901 CrossRef CAS PubMed.
- H. K. Seo, Y. Hwa, J. H. Chang, J. Y. Park, J. S. Lee, J. Park, E. J. Cairns and J. M. Yuk, Nano Lett., 2020, 20, 2080–2086 CrossRef CAS PubMed.
- S. Zhou, J. Shi, S. Liu, G. Li, F. Pei, Y. Chen, J. Deng, Q. Zheng, J. Li, C. Zhao, I. Hwang, C.-J. Sun, Y. Liu, Y. Deng, L. Huang, Y. Qiao, G.-L. Xu, J.-F. Chen, K. Amine, S.-G. Sun and H.-G. Liao, Nature, 2023, 621, 75–81 CrossRef CAS PubMed.
- M. Ramezanitaghartapeh, A. F. Hollenkamp, M. Musameh and P. J. Mahon, Electrochim. Acta, 2021, 391, 138898 CrossRef CAS.
- H. Su, C. Fu, Y. Zhao, D. Long, L. Ling, B. M. Wong, J. Lu and J. Guo, ACS Energy Lett., 2017, 2, 2591–2597 CrossRef CAS.
- H.-L. Wu, L. A. Huff, J. L. Esbenshade and A. A. Gewirth, ACS Appl. Mater. Interfaces, 2015, 7, 20820–20828 CrossRef CAS PubMed.
- D. Wang, X. Hong, S. Liu, X. Ge, B. Tang, H. Wang, K. Xie and W. Ren, Ionics, 2020, 26, 191–199 CrossRef CAS.
- W. Zeng, M. M.-C. Cheng and S. K.-Y. Ng, Electrochim. Acta, 2019, 319, 511–517 CrossRef CAS.
- N. M. Vargas-Barbosa, Nat. Nanotechnol., 2024, 19, 419–420 CrossRef CAS PubMed.
| This journal is © The Royal Society of Chemistry 2024 |