 Open Access Article
Creative Commons Attribution 3.0 Unported Licence
An automated and intelligent microfluidic platform for microalgae detection and monitoring†
Jiahao
Zheng
a,
Tim
Cole
 a,
Yuxin
Zhang
 a,
Bayinqiaoge
a,
Dan
Yuan
b and
Shi-Yang
Tang
a,
Bayinqiaoge
a,
Dan
Yuan
b and
Shi-Yang
Tang
 *ac
*ac
aDepartment of Electronic, Electrical and Systems Engineering, University of Birmingham, Edgbaston, Birmingham, B15 2TT, UK
bSchool of Mechanical & Mining Engineering, The University of Queensland, Brisbane, QLD 4072 Australia
cSchool of Electronics and Computer Science, University of Southampton, Southampton, SO17 1BJ, UK. E-mail: Shiyang.Tang@soton.ac.uk
First published on 4th December 2023
Abstract
Microalgae not only play a vital role in the ecosystem but also hold promising commercial applications. Conventional methods of detecting and monitoring microalgae rely on field sampling followed by transportation to the laboratory for manual analysis, which is both time-consuming and laborious. Although machine learning (ML) algorithms have been introduced for microalgae detection in the laboratory, no integrated platform approach has yet emerged to enable real-time, on-site sampling and analysing. To solve this problem, here, we develop an automated and intelligent microfluidic platform (AIMP) that can offer automated system control, intelligent data analysis, and user interaction, providing an economical and portable solution to alleviate the drawbacks of conventional methods for microalgae detection and monitoring. We demonstrate the feasibility of the AIMP by detecting and classifying four microalgal species (Cosmarium, Closterium, Micrasterias, and Haematococcus Pluvialis) that exhibit varying sizes (from a few to hundreds of microns) and morphologies. The trained microalgae species detection network (MSDN, based on YOLOv5 architecture) achieves a high overall mean average precision at 0.5 intersection-over-union (mAP@0.5) of 92.8%. Furthermore, the versatility of the AIMP is demonstrated by long-term monitoring of astaxanthin production from Haematococcus Pluvialis over a period of 30 days. The AIMP achieved 97.5% accuracy in the detection of Haematococcus Pluvialis and 96.3% in further classification based on astaxanthin accumulation. This study opens up a new path towards microalgae detection and monitoring using portable intelligent devices, providing new ideas to accelerate progress in the ecological studies and commercial exploitation of microalgae.
Introduction
Microalgae, as single-celled species that obtain nutrients from their aquatic habitat, absorb sunlight, capture carbon dioxide from the air and produce about 50% of atmospheric oxygen, can range in size from a few microns to several hundred microns, depending on the species.1 Current research on microalgae has been conducted from two main perspectives. One aspect is based on the position of microalgae in the ecological chain to study their impact on the ecosystem as well as on human health. For example, exploring the factors that trigger harmful algal blooms (HABs) due to microalgal overgrowth,2–4 monitoring and predicting HABs events,5,6 the toxic threat to human health from HABs events,6–8 and wastewater treatment by microalgae.9–11 Another direction of research on microalgae is to explore their commercial applications, such as biofuels, biopharmaceuticals, nutritional supplements, and cosmetics production.12–16 Both research directions require the detection and monitoring of microalgae.As microalgae are not visible to the naked eye, the traditional method of detecting microalgae requires researchers to collect samples from various environmental sites, bring them to the laboratory, image them with a microscope and then analyse them manually based on morphology.17 Although this method is reliable, there is a significant lag in the analysis of microalgae at the environmental sites sampled as it is both time-consuming and laborious. Therefore, in order to reduce human effort, a few recent studies introduced machine learning (ML) for microalgae detection.18–20 For example, Abdullah et al.20 explore the potential of YOLO algorithms in microalgae detection, spanning four distinct algae species. However, it is important to note that solely relying on ML detection algorithms, without additional considerations, does not fully achieve the goal of enabling “sampling and testing” in the field. This limitation persists because ML-based approaches still necessitate a separate and relatively large laboratory setup (e.g., microscope, computer, etc.) for implementation. Consequently, there remains a pressing need to substantially reduce both the time and economic costs associated with microalgae detection.
Microfluidics, a technique for manipulating fluids in microchannels at the micron level, has set the trend for engineering improvements in areas such as flow cytometry,21 microscale chemical synthesis,22 bioparticle detection,23 and cell culture.24 Particularly due to the rapid development of ML in recent decades, which has greatly enhanced the ability of microfluidic platforms to process data, the construction of intelligent microfluidic platforms resulting from the combination of these two disciplines has received increasing attention.25,26 The integration of microfluidics and microalgae research has been steadily developing in the last decade.27–32 As an illustration, Zheng et al.31 present an integrated microfluidic device designed for marine microalgae culture and chemical toxicity screening. While their research yielded commendable results, the relatively intricate fabrication process of the microfluidic chip, the chemical treatment steps required for microalgae detection, the overall system construction costs, and the expenses associated with consuming the microfluidic chip during system operation collectively render the system challenging for adoption by microalgae researchers. In addition, Wang et al.32 present a microfluidic system for analysing ballast water using a concentration gradient chip. This platform incorporates a photodetection system to assess the chlorophyll properties of the microalgae. While this research marks a valuable contribution to the exploration of the potential of microfluidic systems in microalgae research, it is important to note that the system, designed with considerations for the properties of detection reagents and chlorophyll, does not facilitate direct microalgae-specific classification analysis. Similar to the previously mentioned work, this system also exhibits relatively high complexity and operational costs. Thus, the development of microfluidic platforms dedicated to microalgae detection remains at an early stage of development. Image-based intelligent microfluidic platforms have the potential to offer a more intuitive observation of microalgae morphology, significantly easing the challenges associated with experiment preparation. Furthermore, the development of an integrated intelligent platform has the potential to lower the barriers for microalgae researchers, making the field of microfluidics more accessible and acceptable within the microalgae research community.
In this work, we develop an automated and intelligent microfluidic platform (AIMP) that can overcome the time-consuming and labour-intensive drawbacks of conventional methods for microalgae detection and monitoring. The platform utilises a low-cost portable USB microscope and a mini XYZ motorised platform to reduce an otherwise expensive laboratory microscope to a size and weight that can be carried in a backpack without compromising critical functionality. The AIMP also uses laser-cut microfluidic chips to replace microfabricated microfluidic channels that require complex fabrication processes. Microalgae with four different sizes and morphologies (Cosmarium, Closterium, Micrasterias, and Haematococcus Pluvialis) are selected to demonstrate the feasibility of image-based detection on this platform. Datasets are collected for these microalgae and a YOLOv5 detection model is trained based on the datasets. Different image processing methods are chosen for different species for precise classification. Furthermore, we examine the versatility of the AIMP by using it for monitoring the production of astaxanthin from Haematococcus Pluvialis microalgae over a long period of 30 days. The platform meets the need for portability by having all mechanical control and data analysing processes performed by a single microcomputer (Raspberry Pi 4B). Finally, an App is developed to call all the functions to make the platform easy to use.
Experimental
Materials
Four species of microalgae were obtained, including 1) Cosmarium, which is deeply separated in the middle of the cell by a short isthmus containing the nucleus (Carolina Biological Supply Company); 2) Closterium, which has a crescent or elongated shape (Carolina Biological); 3) Micrasterias, whose size can go up to hundred-microns-level (Carolina Biological); and 4) Haematococcus Pluvialis, spherical to ovoid in shape, which can get remarkable colour changes due to the accumulation of astaxanthin (Darwin Biological Company). The USB microscope was purchased from Jiusion Digital Microscope (focusing range: 10–250 mm, we used a 10 mm focusing distance to get the maximum magnification; streaming speed: 30 fps). The XYZ motorised stage was made by assembling three miniature electric linear actuators (Nema 17 Stepper Motor with 1.8° step angle). The double-sided adhesive tape was purchased from 3M™ (GPT-020F, thickness of 200 μm), which was cut using a CO2 laser cutter (OMTech K40 40 W) to make microfluidic channels. The top of the channel was sealed using a 3 mm thick polymethyl methacrylate (PMMA) plate. The AIMP was powered by a rechargeable Li-polymer battery (11.1 V, 3300 mAh, Youme Power). A Raspberry Pi (4, Model B, 4GB RAM) was used as the microcomputer. The total cost of building the AIMP was less than £170, as detailed in Table S1.†Preparation of Haematococcus Pluvialis samples
The 30 ml Haematococcus Pluvialis sample was shaken with a laboratory shaker (Microspin 12, Grant Instruments) at 150 RPM for 5 minutes to ensure that the cells were evenly distributed without causing overt damage to them. After shaking the sample solution, 5 ml of the sample was taken with a pipettor into a clear culture tube, diluted to 50 ml with Jaworski's medium33 culturing liquid (Culture Collection of Algae and Protozoa, SAMS Ltd.) and placed in a benchtop shaking incubator (SQ-4020, SciQuip Ltd.) at a constant temperature of 25 °C and a constant shaking speed of 100 RPM. Cultures were exposed to a 12 h/12 h light/dark cycle provided by a fluorescent lamp powered with a digital timer switch (178-5368, RS PRO). The incubation lasted for 6 weeks, with the start of week 2 being Day 0, and samples from Day 0, Day 15 and Day 30 were taken for validation experiments.Results and discussion
Construction of the AIMP
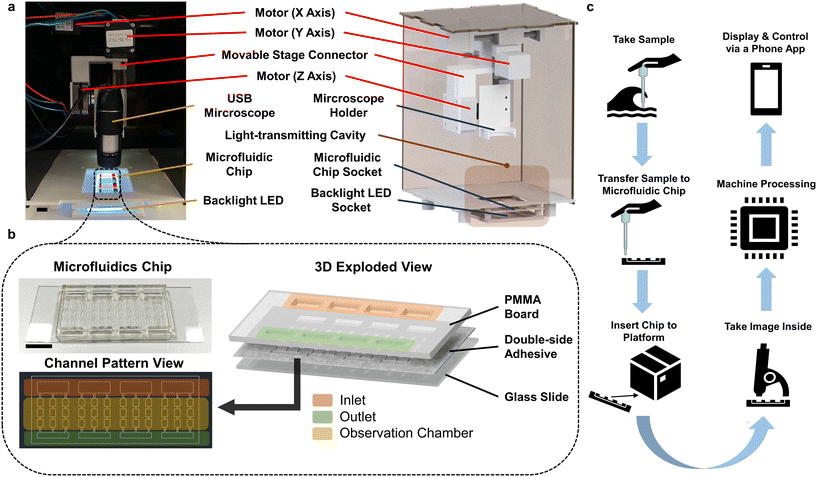
Fig. 1 shows the internal structural design of the AIMP. An XYZ motorised stage is designed and built based on three miniaturised linear actuators to drive the USB microscope, as shown in Fig. 1a. The linear actuator contains a stepper motor (with a 1.8° step angle) connected with a 95 mm long thread rod (2 mm per turn). The actuator converts the rotation of the rod into a linear movement. Our design allows the USB microscope to observe all the chambers of the microfluidic chip to capture colour images for subsequent image-based analysis. Each microfluidic chip has four sets of sample detection channels, and each set of channels consists of an inlet, an outlet and an observation grid consisting of nine observation chambers of the same size, as shown in Fig. 1b. The microfluidic chamber is fabricated by laser cutting a double-sided adhesive tape. One side of the tape adheres to a glass side and the other side bonds to a transparent PMMA board. The PMMA board is also laser cut into the designed structure (with an inlet and outlet). Such a microfluidic channel fabrication process is simple, and the quality of the finished product is adequate for the AIMP for microalgae detection monitoring. Details of the microfluidic chip fabrication process and the AIMP operation procedures are given in Fig. S1.† To prevent the effect of external ambient light sources on the imaging process, the platform's housing, except for the bottom base plate, is made of opaque black PMMA boards. The bottom base plate, which includes a light-transmitting cavity, is 3D printed using polycarbonate filaments. This cavity has a socket for easy and repeated insertion and removal of the microfluidic chip and a socket for placing the backlight LED board.The dimension of the completed AIMP is 14 × 16 × 28 cm. Such a size allows the platform to be easily fit into an ordinary backpack, making it easy for outdoor microalgae sampling and monitoring. Fig. 1c illustrates the workflow diagram of the AIMP. After sampling is completed, the collected microalgae are transferred to the microfluidic chip and the chip is inserted into the AIMP. Afterwards, the platform can be controlled via an App for real-time microscope image acquisition, display, and analysis based on pre-set image processing and ML. All data processing (including the control of the XYZ motorised stage) is conducted by a Raspberry Pi 4B microcomputer integrated into the AIMP. The interactive graphical user interface of the App is displayed by casting the Raspberry Pi desktop to the phone screen via VNC (virtual network computing) software.
Dataset preparation and machine learning
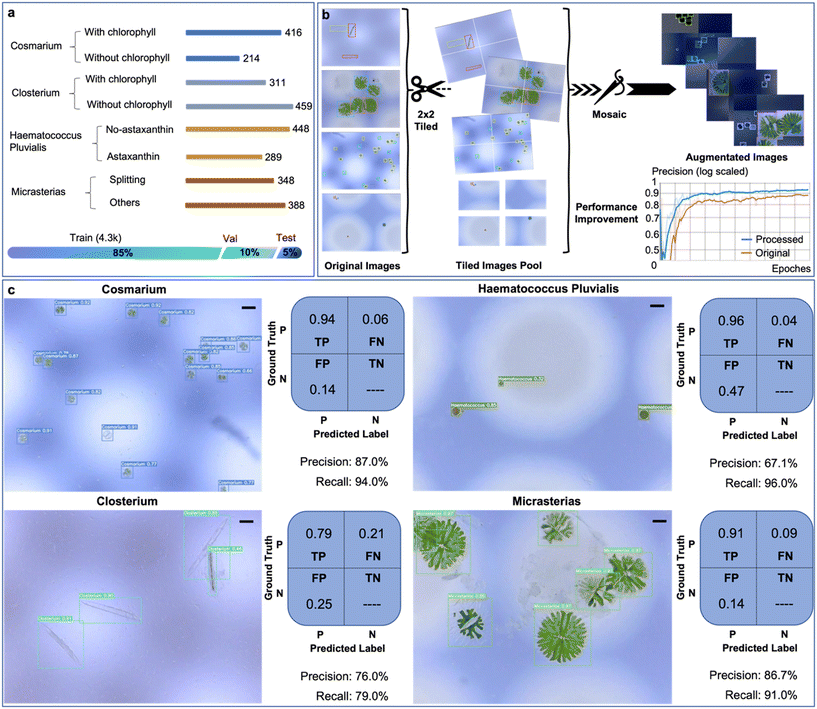
As a proof-of-concept demonstration of the AIMP for minimising the human effort involved in the detection of microalgae and reducing the expertise required of the sampler, four species of microalgae, varying in size and morphology, are selected to create the dataset used for the training of the microalgae detection ML network. From an initial set of 812 captured images, we curate 630 labels for Cosmarium, 770 for Closterium, 737 for Haematococcus Pluvialis, and 736 for Micrasterias, thus establishing the raw image dataset, as illustrated in the histogram in Fig. 2a. To enhance the dataset's suitability for analysis, we subject it to a series of preprocessing steps, including auto-orientation, resizing to 640 × 640 dimensions, automatic contrast adjustment (contrast stretching), tiling (2 × 2), and filtering to exclude null images, ensuring that at least 90% of images retain annotations after preprocessing.Given the relatively modest size of this dataset, we opt to expand it through an image augmentation process. Beyond the conventional flip and rotation augmentations, we introduce additional adjustments such as saturation (ranging from −30% to +30%) and brightness (between −10% and +10%) to compensate for potential variations in lighting conditions during USB microscope imaging. We also incorporate a blur adjustment (up to 1px) to counteract potential imperfections in focus when capturing images, as many microalgae specimens in our case are relatively small. Additionally, a Mosaic augmentation is applied. As depicted in Fig. 2b, during dataset construction, we initiate the process by preprocessing the original images using a 2 × 2 tiling approach, which aids in improving the model's accuracy in detecting smaller microalgae, such as Cosmarium and Haematococcus Pluvialis. Subsequently, the tiled image set undergoes a Mosaic augmentation to restore the original image size and introduce more background context, thereby enhancing the model's performance. An overall precision improvement of approximately 6% is observed, as demonstrated in the performance comparison graph in Fig. 2b. Upon completion of all data preprocessing and augmentation steps, the final dataset, as illustrated in the bar chart in Fig. 2a, is divided into three distinct sets: training (85%, comprising 4276 images), validation (10%, with 484 images), and testing (5%, encompassing 243 images).
Based on the microalgae dataset, we train a microalgae species detection network (MSDN) for 100 epochs with batch size 16 using the YOLOv5 architecture.34 The training process is monitored, and details can be found in Fig. S2.† The detecting results of the trained network on the test image set and its evaluation matrices for each microalgae species are given in Fig. 2c. Since each object in the analysed image may belong to a different class, only true positive (TP), background false negative (FN) and background false positive (FP) are meaningful in the confusion matrix. The precision (TP/(TP + FP)) and recall (TP/(TP + FN)) of the model for each microalgae species are calculated (Fig. 2c). To further evaluate the model in an overall sense, we use the precision–recall (PR) curve to perform further calculations and find the value of mAP@0.5, which is the mean average precision at 0.5 intersection-over-union (IoU) threshold, is 92.8% (see Fig. S3†). We also try to train the model on the same microalgae dataset using other network architectures, as shown in Table S2.† However, the performance of the model on microalgae detection is not significantly improved compared to YOLOv5.
Limited by the field of view (FOV) of the USB microscope at 1000× magnification, the observation chamber of the microfluidic chip cannot be fully covered in a single image taken directly. Therefore, to be able to capture panoramic images of the observation chamber, we integrate an automatic image stitching function in the platform, as detailed in Fig. S4.† In brief, the USB microscope takes images of the upper and lower parts of the observation chamber by moving along the x and y-axis. Then, the captured images are stitched together using OpenCV. As the raw stitched image has black edges due to non-ideal shifts that occur during the USB microscope movement, we use the pixel indexing method to crop the outermost black edges to obtain the final stitched image. The microalgae exhibit minimal movement during the process of generating panoramic images, as shown in Movie S1.†
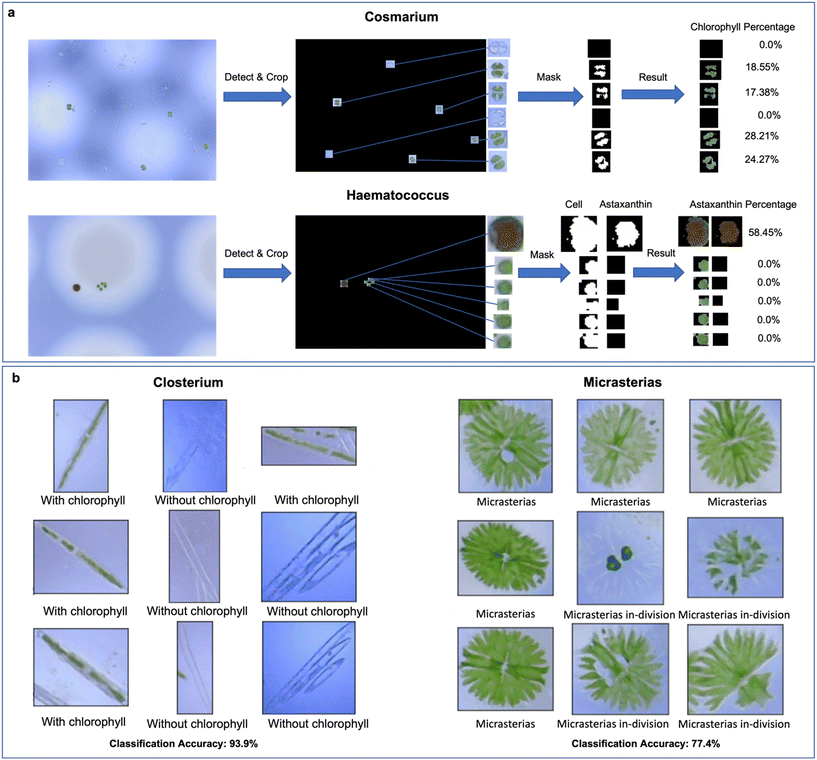
To further classify the detected microalgae for monitoring the stage of growth, we validate the use of two different methods – colour extractor for Cosmarium and Haematococcus Pluvialis (Fig. 3a) and EfficientNet-Lite0 network-based-classifiers for Closterium and Micrasterias (Fig. 3b). EfficientNet-Lite0 belongs to the EfficientNet-Lite set, which is a set of mobile-end-friendly network models for image classification. The EfficientNet-Lite model architecture has been validated in many application scenarios.35,36 For monitoring the growth of Cosmarium via colour extractor, we first crop out the Cosmarium cells identified in the image. We then mask the parts that are not in the target colour range by performing a pixel-by-pixel inspection of the HSV (Hue, Saturation, Value) values for each Cosmarium cell. By comparing the mask area with the unmasked area within the target colour range, the proportion of chlorophyll contained in Cosmarium cells can be derived. As chlorophyll is an important value in microalgae that can be extracted and utilised,37 knowing its proportion in the sample of Cosmarium cells can provide a valuable guide for possible subsequent sorting and extraction. A similar colour extractor function is used for identifying Haematococcus Pluvialis cells that produce astaxanthin. Haematococcus Pluvialis algae are known for their ability to produce astaxanthin, an important nutritional supplement chemical that is widely used in food, feed, nutritional products and pharmaceuticals.38 Whereas, in this case, we first set green and red as the target colours to obtain the overall area of the cell excluding the background, and then set red only as the target colour to obtain the area of red-coloured astaxanthin accumulated in the cell, which provides an indicator for the possible sorting and extraction.
Closterium cells, characterised by their crescent or elongated strip-like morphology, present challenges when attempting to establish classification thresholds through chlorophyll occupancy analysis. Consequently, unlike the case of Cosmarium cells, we adopt a different approach for Closterium cells, segmenting them into two distinct groups: those with visible chlorophyll and those without visible chlorophyll. This division forms the dataset used to train the binary classifier based on the EfficientNet-Lite0 network architecture. This binary classifier achieved a classification accuracy of 93.9% after training (as shown in the image set on the left of Fig. 3b). Also, using the EfficientNet-Lite0 network architecture, we train a binary classifier on the detected Micrasterias cells for recognising whether they are in-division, achieving a classification accuracy of 77.4% (as shown in the image set on the right of Fig. 3b).
Raspberry Pi App development
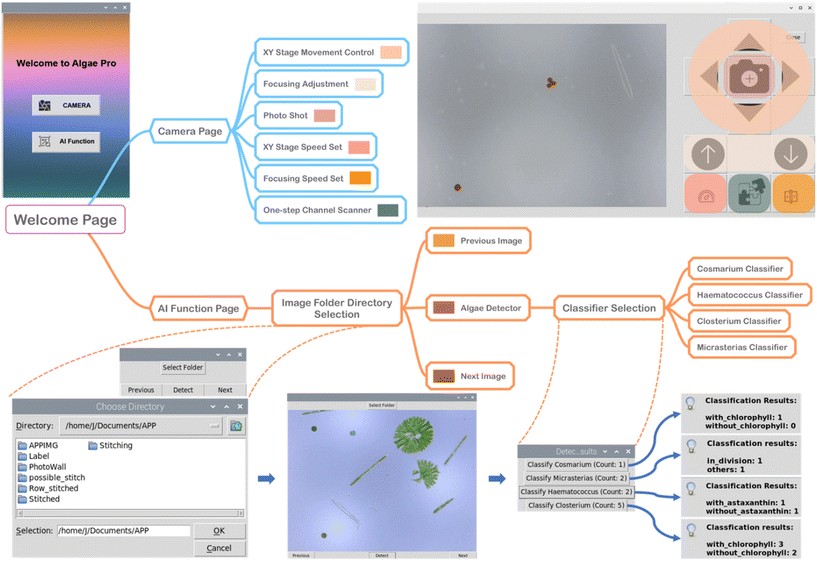
To make the AIMP more user-friendly, a Raspberry Pi App is developed to realise the functions of camera live-streaming, XY stage controlling, focusing tuning, picture capture, image processing, object detection, and object classification, as illustrated in Fig. 4. The “Welcome Page” has two selections, one to access the “Camera” page and the other to access the “AI Function” page. The “Camera” page allows the interface for live streaming of the captured video from the USB microscope. The user can adjust the movement in the X and Y directions via the “XY Stage Movement Control” panel in the operator interface, thus allowing the USB microscope to see the entire observation chambers of the microfluidic chip. Furthermore, the speed of movement can be adjusted, allowing for single-chamber observation at small steps and inter-chamber imaging at large steps. The focusing adjustment panel allows the distance between the USB microscope and the microfluidic chip to be adjusted in the Z-direction, resulting in in-focus and clear imaging. Similarly, with the “Focusing Speed Set” button, the movement speed in the Z direction can be adjusted, allowing coarse and fine adjustments for clear imaging. In the operation interface, the user can capture the currently displayed image (auto-saved in the PhotoWall folder) and invoke the automatic stitching function (auto-saved in the Stitched folder). Since the automatic stitching function is invoked to acquire sub-images from left to right and top to bottom and then stitch them together, before using the “One-step Channel Scanner”, the user needs to ensure that the USB microscope's current imaging area is in the upper left of that observation chamber.When entering the “AI Function” page, the user can select an image folder to access (e.g. PhotoWall folder or Stitched folder). When the image is displayed, the user can select to browse the previous and next images in the same folder. The “Detect” button located in the middle serves the purpose of taking the currently displayed image as input for the trained MSDN, which then retrieves information about the microalgae species present in the image along with their respective counts. After conducting MSDN analysis on 50 sample images, we find that, on average, the platform requires approximately 1.974 s per image from the moment the “Detect” button is pressed until the detection result is displayed in a pop-up window. By selecting the specific microalgae species within the pop-up window, the user can access their corresponding classification functions (explained in Fig. 3b and c). The result for the selected microalgae species after further classification will be displayed, as shown in the screenshot at the bottom right of Fig. 4. The full demonstration of the App for controlling the AIMP for detecting and monitoring microalgae is given in Movie S2.†
Monitoring the accumulation of astaxanthin in Haematococcus Pluvialis
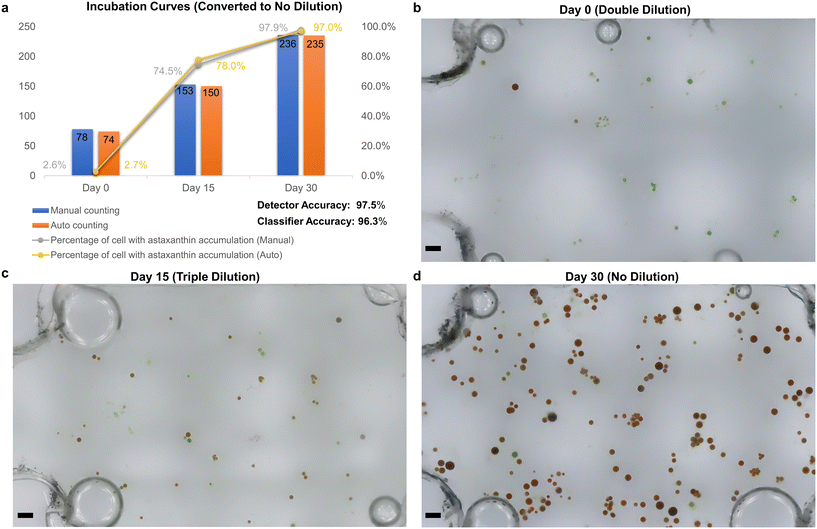
To further examine the capability of the AMIP in practical applications, we use it to monitor the accumulation of astaxanthin in Haematococcus Pluvialis over a period of 30 days and perform automatic platform-based analysis. Fig. 5a shows the culture experiment data and comparison graph of the manual (blue columns) and AIMP (orange columns) obtained statistics. Using eqn (1), we compare the two sets of data and conclude that the AIMP achieves 97.5% accuracy of detection (Precicion_D) compared to the manual approach. | (1) |
 | (2) |
 | (3) |
Conclusion
In summary, we develop the AIMP to overcome the significant time and labour cost associated with conventional methods for microalgae detection and monitoring. Using a low-cost USB portable microscope and the mini XYZ motorised stage, the AIMP achieves the low-cost and portability requirements without sacrificing critical functionality. The use of laser-cut microfluidic chips instead of microfabricated microfluidic channels avoids the need for complex manufacturing processes. The capability of the AIMP is validated using four microalgae (Cosmarium, Closterium, Micrasterias, and Haematococcus Pluvialis) of varying sizes and morphologies. The MSDN (based on YOLOv5 architecture) trained on the established dataset achieved mAP@0.5 of 92.8%. In addition to MSDN, we use different image processing methods for each microalgae species for precise classification. This precise classification not only helps understand the growth stage of the samples but also serves as an indicator for the potential extraction of valuable cellular products like chlorophyll and astaxanthin. To ensure portability, the AIMP employs a microcomputer (Raspberry Pi 4B) to handle all mechanical control and data analysis processes. Furthermore, the versatility of the AIMP is demonstrated by monitoring the astaxanthin production of Haematococcus Pluvialis over a 30 days. The AIMP achieved 97.5% accuracy in microalgae species detection and counting, as well as an overall classification accuracy of 96.3%. To enhance user-friendliness, an App is developed to facilitate easy access to all the functions of the platform. The AIMP has showcased its vast potential as a solution for revolutionising conventional microalgae detection and monitoring methods. Although its performance is currently limited by a relatively small dataset, the AIMP has the capability to make a transformative impact with the integration of more high-quality data. With continued research and development, the AIMP is poised to drive significant progress in intelligent microfluidics and enable a wide range of innovative applications in environmental science.Author contributions
Conceptualization: S.-Y. T. and J. Z. Data curation: J. Z., T. C., Y. Z., Bayinqiaoge, and D. Y. Formal analysis: J. Z. Funding acquisition: S.-Y. T. Investigation: J. Z., T. C., Y. Z., Bayinqiaoge, D. Y., and S.-Y. T. Methodology: J. Z. and S.-Y. T. Supervision: S.-Y. T. Writing (original draft): J. Z. and S.-Y. T. Writing (review and editing): T. C., Y. Z., Bayinqiaoge, D. Y., and S.-Y. T.Conflicts of interest
There are no conflicts to declare.Acknowledgements
This work was funded by Engineering and Physical Sciences Research Council (EPSRC) grant EP/V008382/1.References
- A. Singh, P. S. Nigam and J. D. Murphy, Bioresour. Technol., 2011, 102, 26–34 CrossRef CAS PubMed.
- R. Santoleri, V. Banzon, S. Marullo, E. Napolitano, F. d'Ortenzio and R. Evans, J. Geophys. Res.: Oceans, 2003, 108, 8122–8145 CrossRef.
- F. Gohin, L. Lampert, J.-F. Guillaud, A. Herbland and E. Nézan, Cont. Shelf Res., 2003, 23, 1117–1141 CrossRef.
- A. C. Thomas, D. W. Townsend and R. Weatherbee, Cont. Shelf Res., 2003, 23, 971–989 CrossRef.
- P. R. Hill, A. Kumar, M. Temimi and D. R. Bull, IEEE J. Sel. Top. Appl. Earth Obs. Remote Sens., 2020, 13, 3229–3239 Search PubMed.
- D. M. Anderson, Ocean Coastal Manage., 2009, 52, 342–347 CrossRef PubMed.
- R. C. Cruz, P. Reis Costa, S. Vinga, L. Krippahl and M. B. Lopes, J. Mar. Sci. Eng., 2021, 9, 283 CrossRef.
- S. L. Hinder, G. C. Hays, C. J. Brooks, A. P. Davies, M. Edwards, A. W. Walne and M. B. Gravenor, Environ. Health, 2011, 10, 1–12 CrossRef.
- N. Abdel-Raouf, A. Al-Homaidan and I. Ibraheem, Saudi J. Biol. Sci., 2012, 19, 257–275 CrossRef CAS PubMed.
- K. Li, Q. Liu, F. Fang, R. Luo, Q. Lu, W. Zhou, S. Huo, P. Cheng, J. Liu and M. Addy, Bioresour. Technol., 2019, 291, 121934 CrossRef CAS PubMed.
- S. F. Mohsenpour, S. Hennige, N. Willoughby, A. Adeloye and T. Gutierrez, Sci. Total Environ., 2021, 752, 142168 CrossRef CAS PubMed.
- M. A. Borowitzka, J. Appl. Phycol., 1995, 7, 3–15 CrossRef CAS.
- T. Suganya, M. Varman, H. Masjuki and S. Renganathan, Renewable Sustainable Energy Rev., 2016, 55, 909–941 CrossRef CAS.
- L. Brennan and P. Owende, Renewable Sustainable Energy Rev., 2010, 14, 557–577 CrossRef CAS.
- T. M. Mata, A. A. Martins and N. S. Caetano, Renewable Sustainable Energy Rev., 2010, 14, 217–232 CrossRef CAS.
- P. Spolaore, C. Joannis-Cassan, E. Duran and A. Isambert, J. Biosci. Bioeng., 2006, 101, 87–96 CrossRef CAS PubMed.
- F. Liu, C. Zhang, Y. Wang and G. Chen, Sci. Total Environ., 2022, 815, 152913 CrossRef CAS PubMed.
- P. Otálora, J. Guzmán, F. Acién, M. Berenguel and A. Reul, Algal Res., 2021, 55, 102256 CrossRef.
- M. Cao, J. Wang, Y. Chen and Y. Wang, Environ. Sci.: Processes Impacts, 2021, 23, 1516–1530 RSC.
- Abdullah, S. Ali, Z. Khan, A. Hussain, A. Athar and H.-C. Kim, Water, 2022, 14, 2219 CrossRef.
- Y. Zhang, Y. Zhao, T. Cole, J. Zheng, Q. Bayin, J. Guo and S. Tang, Analyst, 2022, 147, 2895–2917 RSC.
- Z. Chen, Z. Pei, X. Zhao, J. Zhang, J. Wei and N. Hao, Chem. Eng. J., 2022, 433, 133258 CrossRef CAS.
- Bayinqiaoge, Y. Zhang, T. Cole, J. Zheng, J. Guo and S.-Y. Tang, Biosens. Bioelectron., 2023, 222, 114944 CrossRef CAS PubMed.
- M. L. Coluccio, G. Perozziello, N. Malara, E. Parrotta, P. Zhang, F. Gentile, T. Limongi, P. M. Raj, G. Cuda and P. Candeloro, Microelectron. Eng., 2019, 208, 14–28 CrossRef CAS.
- J. Zheng, T. Cole, Y. Zhang, J. Kim and S.-Y. Tang, Biosens. Bioelectron., 2021, 194, 113666 CrossRef CAS PubMed.
- E. A. Galan, H. Zhao, X. Wang, Q. Dai, W. T. Huck and S. Ma, Matter, 2020, 3, 1893–1922 CrossRef.
- Y. J. Juang and J. S. Chang, Biotechnol. J., 2016, 11, 327–335 CrossRef CAS PubMed.
- H. S. Kim, T. P. Devarenne and A. Han, Algal Res., 2018, 30, 149–161 CrossRef.
- B. Ozdalgic, M. Ustun, S. R. Dabbagh, B. Z. Haznedaroglu, A. Kiraz and S. Tasoglu, Biotechnol. Bioeng., 2021, 118, 1716–1734 CrossRef PubMed.
- A. B. Alias, S. Mishra, G. Pendharkar, C.-S. Chen, C.-H. Liu, Y.-J. Liu and D.-J. Yao, Molecules, 2022, 27, 1910 CrossRef CAS PubMed.
- G. Zheng, Y. Wang, Z. Wang, W. Zhong, H. Wang and Y. Li, Mar. Pollut. Bull., 2013, 72, 231–243 CrossRef CAS PubMed.
- J. Wang, G. Wang, M. Chen, Y. Wang, G. Ding, Y. Zhang, Y. Kang and X. Pan, Algal Res., 2019, 42, 101593 CrossRef.
- G. Jaworski, J. Talling and S. Heaney, Br. Phycol. J., 1981, 16, 395–410 CrossRef.
- G. Jocher, A. Chaurasia, A. Stoken, J. Borovec, Y. Kwon, K. Michael, J. Fang, Z. Yifu, C. Wong and D. Montes, Zenodo, 2022, DOI:10.5281/zenodo.7347926.
- D. H. Fudholi, S. Rani, D. M. Arifin and M. R. Satyatama, Sci. J. Inform., 2021, 8, 111–118 Search PubMed.
- M. N. Ab Wahab, A. Nazir, A. T. Z. Ren, M. H. M. Noor, M. F. Akbar and A. S. A. Mohamed, IEEE Access, 2021, 9, 134065–134080 Search PubMed.
- A. Hosikian, S. Lim, R. Halim and M. K. Danquah, Int. J. Chem. Eng., 2010, 2010, 391632–391643 Search PubMed.
- R. R. Ambati, P. Siew Moi, S. Ravi and R. G. Aswathanarayana, Mar. Drugs, 2014, 12, 128–152 CrossRef PubMed.
Footnote |
| † Electronic supplementary information (ESI) available. See DOI: https://doi.org/10.1039/d3lc00851g |
| This journal is © The Royal Society of Chemistry 2024 |

