Water-coupled monovalent and divalent ion transport in polyviologen networks†
Alexandra D.
Easley
a,
Khirabdhi
Mohanty
b and
Jodie L.
Lutkenhaus
 *ab
*ab
aDepartment of Materials Science and Engineering, Texas A&M University, College Station, Texas 77843, USA. E-mail: jodie.lutkenhaus@mail.che.tamu.edu
bArtie McFerrin Department of Chemical Engineering, Texas A&M University, College Station, Texas 77843, USA
First published on 11th April 2023
Abstract
Redox-active polymers (RAPs) are of interest as environmentally friendly and earth-abundant energy storage materials. Polyviologens are promising RAPs, but they tend to dissolve during operation. Further, the two-electron redox reaction for polyviologens in various electrolytes is not always reversible, highlighting the need for a deeper understanding of the redox mechanism. Here, the energy storage mechanism for a cross-linked viologen (PTPM) is demonstrated using electrochemical quartz crystal microbalance with dissipation monitoring (EQCM-D), comparing NaCl and Na2SO4 aqueous electrolytes. E-QCMD reveals that the ion-electron transport mechanism is strongly dependent on the valency of the anion. More sudden and dramatic changes in the electrode's mass were observed for the divalent sulfate ion as compared to the smooth mass transitions associated with the monovalent chloride ion. Meanwhile, there was marked hysteresis in the mass transfer profile for NaCl, but little hysteresis for Na2SO4. Our results demonstrate that electrolyte design, and specifically ion valency, will have a large impact on the nature of mass transport in polymer-based electrodes. This work enables electrolyte selection for the next generation polymer batteries with improved performance.
Introduction
With expanding footprints in electrified transportation and personal electronics, lithium-ion batteries (LIBs) have become an integral part of everyday life. However, LIBs have many drawbacks related to the extraction and recycling of critical elements, such as cobalt, lithium, and nickel.1,2 Alternatives include low-cobalt or cobalt-free active materials, sodium-ion batteries, and others.3–5 As another alternative, redox-active polymers (RAPs) offer an appealing approach that is independent of critical materials sourcing.RAPs are polymeric materials that contain redox-active groups comprised of non-metallic elements (e.g. C, H, N, O, or S) for use as active materials in battery electrodes.6–9 Conjugated polymers are a class of RAPs that exhibit redox activity through the π-orbitals of the redox-active groups in the polymer backbone in which electronic charge is distributed. In contrast, non-conjugated polymers containing redox-active groups, such nitroxide radicals or viologens, have charge localized to the redox group itself. There remains a significant knowledge gap in understanding the redox mechanism of these species.
For methyl viologen-based RAPs, the polymer undergoes reduction from the dication (MV2+) to the radical-cation (MV˙+) state, resulting in movement of counter anions and solvent. An additional reduction event can occur leading to the neutral viologen (MV0) species and further ion/solvent movement. The reaction is coupled with the solvated counter ions diffusing in and out of the RAP film throughout the redox process, which can cause swelling and contraction. Therefore, this process may lead to volume changes during reduction and oxidation, which should be considered. Further, dissolution of the active polymer during cycling can lead to long-term capacity fade. The aqueous electrochemistry of viologen-based RAPs is especially interesting because aqueous electrolytes are generally environmentally friendly and safer than flammable non-aqueous solvents.
Studies on the coupled mass transport (ion and solvent) have primarily focused on swollen solid RAPs containing pendant nitroxide radicals or quinones,10–14 but limited reports on the participation of solvent and ions in the redox reaction of viologen-based RAPs exist.15–19 With regard to viologen-based RAPs, many studies reported only minimal mass change,15,16,20,21 focused on only the first redox couple,15,17 or investigated monolayers,22 which are not ideal representations of battery electrodes. Corrêa et al. studied polymerized imidazole/viologen crosslinked films in lithium-based aqueous electrolytes and found that electrolytes with larger anions (CF3SO3−) favored anion transport and those with smaller anions (BF4−) favored lithium transport for the first redox couple.17 This points to the possible effects of ion size, but not valency. Further, in-depth analysis of the mass response, solvent-coupled ion movement, and the second redox reaction were not considered.
Here, a cross-linked viologen RAP was probed to reveal the aqueous redox mechanism. The monomer was synthesized using a simple one-step reaction and subsequently used for electropolymerization on conductive substrates. Coupled ion and water mass transport were then investigated using electrochemical quartz crystal microbalance with dissipation monitoring (EQCM-D), which provides real-time mass changes during electropolymerization and cycling. Additionally, the change in the charge transfer resistance with viologen oxidation state was considered using electrochemical impedance spectroscopy. For both characterization techniques, two anions (chloride and sulfate) were considered to investigate the effect of differing valencies (monovalent and divalent) on mass transport.
Results and discussion
TPM synthesis and electropolymerization
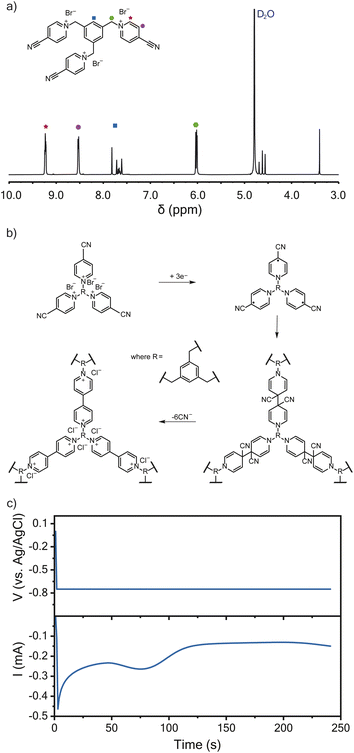
Following a previously described protocol, 1,3,5-tris(4-cyanopyridinio)mesitylene (TPM) bromide salt was synthesized through the coupling of 4-pyridinecarbonitrile and 1,3,5-tris(bromomethyl)benzene.16,23 The successful synthesis of TPM was confirmed using 1H-NMR spectroscopy (Fig. 1a). The resulting TPM bromide salt was a trifunctional monomer that could undergo cathodic electropolymerization to produce crosslinked polyviologen films of about 120 nm in thickness (Fig. 1b), which is an ideal thickness for EQCM-D characterization.24 As proposed by Saika et al., the monomer polymerizes following a reductive radical coupling with cyanide ion elimination.23 This reductive deposition is followed by an oxidation step to recover the dicationic nature of the deposited viologen film.23Fig. 1c shows the current-response during potentiostatic electropolymerization at −0.75 V vs. Ag/AgCl. The electrolyte was 5 mM TPM in aqueous 0.1 M NaCl. Wang et al. found similar crosslinked-viologen network films to be amorphous and thermally stable up to 325 °C.25 Others have previously demonstrated the electrochromic properties of similarly crosslinked-viologen networks.20,21,26Cyclic voltammetry
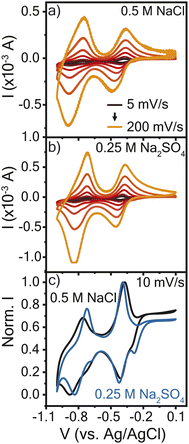
The electrochemical properties of the resulting crosslinked viologen (PTPM) films were considered in sodium chloride (0.5 M NaCl) and sodium sulfate (0.25 M Na2SO4), to compare the effect of anion valency. These electrolyte concentrations were selected so as to keep the same effective concentration of anions. Fig. 2a and b show cyclic voltammograms of PTPM in the two electrolytes. At 5 mV s−1, the polyviologen films exhibited half wave potentials (E1/2) of −0.8 V and −0.4 V vs. Ag/AgCl in the chloride and sulfate-based electrolytes. This confirms a two-electron reaction. Additionally, the redox couple associated with the dication to radical cation exhibited peak separation values (ΔEp) of ∼25 mV at 5 mV s−1 (Fig. S1†), whereas the reaction from the radical cation to the neutral form had ΔEp of ∼100 mV. This indicates that the first redox couple is reversible and the second is quasi-reversible.The resulting cyclic voltammograms were normalized to the maximum peak current to compare their shapes (Fig. 2c). At low scan rates, PTPM in Na2SO4 electrolyte exhibited an additional peak in the reduction scan, whereas the film in the NaCl electrolyte did not. The observed peak splitting in Na2SO4 could be attributed to the sequential ejection of sodium cations and then sulfate anions when viologen is reduced from the dication (2+) to the radical cation (1+ state). At the initial stages of reduction, one sulfate ion might act as a counter ion for two radical cation viologen groups, so charge balance might require transport of only sodium ions. As reduction proceeds further, anions then expel from the film. Curiously, the extra peak does not appear in either electrolyte during PTPM oxidation, suggesting that the mass transport mechanism may differ from reduction. Also, the different behavior of PTPM in NaCl may be attributed to the chloride anion, which cannot interact with two radical viologen groups in the same manner as a sulfate anion. To understand the true nature of mass transport and how it might be assigned to each redox event, further characterization is required.
EQCM-D characterization of PTPM
Given the differences in cyclic voltammogram shapes for polyviologen in the two electrolytes, it is of interest to study the real-time mass-coupled electron transfer mechanism to provide greater insight. Using the cyclic voltammetry data for 10 mV s−1, the charge transferred, Q, during oxidation and reduction was determined by integration of the current (Fig. 3). The polyviologen film exhibited a higher oxidation peak current in Na2SO4, compared to that in NaCl, corresponding to more charge transferred (Fig. 3a and b). Also, both electrolytes yielded similar profile shapes for the charge transferred. The polyviologen film exhibited a greater areal capacity in the Na2SO4 electrolyte (3.1 × 10⁻⁴ mA h cm−2) than in NaCl (2.3 × 10⁻⁴ mA h cm−2). The film in both electrolytes exhibited coulombic efficiencies greater than 95%.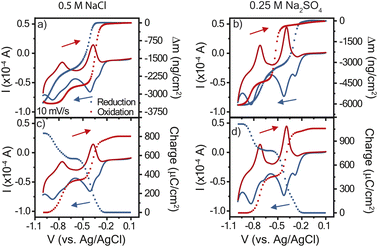 | ||
| Fig. 3 Cyclic voltammograms at 10 mV s−1 with overlaid mass profiles (a and b) and charge profiles (c and d). The supporting electrolyte was (a) and (c) 0.5 M NaCl or (b) and (d) 0.25 M Na2SO4. Poly(1,3,5-tris(4-cyanopyridinio)mesitylene) (PTMP) on a Au/Ti EQCM-D crystal was the working electrode, and Ag/AgCl reference electrode and platinum plate counter electrode were used. The legend in (a) applies to all panels. The cyclic voltammogram is the solid curve, and the charge or mass profiles are presented as data points. The arrows indicate the voltage scan direction for reduction (blue) and oxidation (red). Data for 25 mV s−1 is found in Fig. S3.† | ||
Using the changes in frequency and dissipation obtained from EQCM-D, the mass change during CV was calculated from the Sauerbrey equation, Fig. 3c and d. The Sauerbrey equation was selected because |ΔDn/(Δfn/n)| was less than 4 × 10⁻⁷ Hz−1 and |ΔDn/Δfn| was also less than 1 × 10⁻⁸ Hz−1.24 During reduction, both films exhibited a decrease in mass associated with the expulsion of ions and/or solvent from the film. In oxidation the opposite behavior was observed. Sharp changes in mass occurred alongside the redox peaks, indicating that the mass changes are directly affiliated with the redox reaction. Qualitatively, significant hysteresis in the electrode's mass change occurred in NaCl, which contrasts with the minor hysteresis for Na2SO4.
To deduce whether the affiliated mass changes may be assigned to cation, anion, and/or water, the mass change was plotted with respect to the charge transferred, Fig. 4. The resulting slope yields the mass transferred per electron (Δm/e), which can be compared to theoretical values (in mg C−1) of 0.39 for chloride and 0.50 for sulfate.27 For example, in an idealized system, every electron transferred during reduction is coupled with the expulsion of a monovalent anion (or every two electrons for a divalent anion) from the film, since it is no longer needed for charge balance. Fig. 4a and b shows the results for reduction in both electrolytes; the slopes were negative for the entire reduction period, confirming the expulsion of mass. In contrast, Fig. 4c and d shows positive slopes during oxidation, indicative of mass gain. A plot of the derivative mass profile vs. potential for the Na2SO4 electrolyte (Fig. S2†) showed an additional small peak for each redox couple in reduction, similar to the additional peak observed in CV (Fig. 2c).
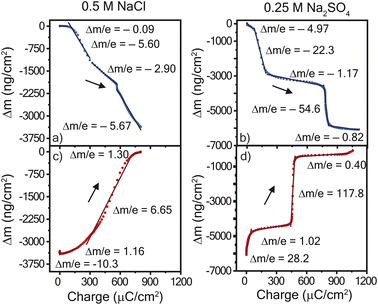 | ||
| Fig. 4 Mass change vs. charge transferred during cyclic voltammetry at 10 mV s−1 with for (left) = 0.5 M NaCl and (right) 0.25 M Na2SO4 electrolytes. Panels (a and b) show reduction and panels (c and d) show oxidation. The mass change and charge transferred is a function of the potential in Fig. 3. PTPM electropolymerized on the Au/Ti EQCM-D crystal was the working electrode with a Ag/AgCl reference electrode and platinum plate counter electrode. Data for 25 mV s−1 is found in Fig. S4.† | ||
Overall, the mass-charge profiles in Fig. 4 are drastically different for NaCl and Na2SO4 electrolyte. PTPM in NaCl electrolyte exhibited smooth changes in mass with most of the profile following a single curve. In contrast, PTPM in Na2SO4 electrolyte exhibited very sharp and sudden transitions that coincided with the onset of the redox peak. As discussed below, this is indicative of large and sudden volumetric changes of PTPM in Na2SO4. For both electrolytes, we observed no signs of PTPM dissolution, which would have been marked by significant drifts in frequency or mass. This result confirms that crosslinking improves the stability of PTPM.
Using Faraday's law, if the absolute value of the experimentally determined slope from Fig. 4 is different than the theoretical value for the anion alone, then there are additional transporting species such as sodium cations or water. The absolute theoretical value of mass transferred per electron for sodium is 0.24 and 0.18 mg C−1 for water. Inspecting the mass-charge profile of PTPM in NaCl (Fig. 4a and c) more closely allows for the consideration of which species are transporting at particular potentials. The reduction of PTPM showed a comparatively smooth mass-charge curve with four distinct changes in slope. Initially (0.1 to −0.33 V vs. Ag/AgCl), Δm/e was −0.09 mg C−1, suggesting little to no mass transport. As the potential further decreased, PTPM began to reduce to its radical cation and neutral states, leading to considerable mass transport and Δm/e values of ∼−5.60 mg C−1 and a small excursion to −2.90 mg C−1 at −0.42 V vs. Ag/AgCl. Taken together, >50 water molecules are expelled per anion (assuming no cation transport). This value may seem large, but we have observed similar effects for the chloride ion in nitroxide radical polymers because of the chloride ion's kosmotropic nature, which induces large amounts of swelling and contraction in the redox-active polymer film.28 There are also likely electrostatic effects were electrostatic repulsion among the diradical viologen groups causes repulsion and ingress of water.
Similarly, for PTPM oxidation (Fig. 4c), four distinct slopes were observed following a similar path. During most of the charge transfer process, Δm/e was −6.65 mg C−1. Using EQCM-D to estimate the solvent-swollen PTPM thickness, the polymer swelled by 38.7% upon oxidizing from the neutral to the dication form.
On the other hand, the mass-charge profile of PTPM in Na2SO4 (Fig. 4b and d) suggest a different mechanism from that of NaCl. For the reduction of PTPM in Na2SO4, two prominent plateaus were observed, having Δm/e values of −1.17 and −0.82 mg C−1 where the majority of charge transfer occurred. The first plateau corresponds to −0.33 to −0.49 V, and the second to −0.75–1.0 vs. Ag/AgCl, corresponding to reduction of the dication to the radical cation and then the radical cation to the neutral state. From a mass balance, the Δm/e value of −1.17 mg C−1 corresponds to the expulsion of seven water molecules plus one sulfate anion, if cation transport is neglected, for the dication/radical cation reduction step. The radical cation/neutral reduction step yielded a Δm/e value of −0.82 mg C−1, corresponding to 3.5 water molecules per anion (neglecting cation transport). Between the mass-charge plateaus, highly negative Δm/e values were observed, indicative of sudden contraction and large amounts of water transport. However, as discussed below, cations are also likely participating in the process for the Na2SO4 electrolyte, meaning that the true number of water molecules transferring is likely different from that presented here.
For oxidation of PTPM in Na2SO4 (Fig. 4d), a similar mass-charge profile shape was observed as for reduction. Again, the majority of charge transferred occurred within two plateaus, having Δm/e values of 1.02 and 0.4 mg C−1, corresponding to the respective neutral/radical cation and radical cation/dication oxidations steps. The neutral/radical cation oxidation step was accompanied by little water transport, and the radical/dication step showed signs of possible mixed cation/anion/water transport. For example, a value of 0.5 mg C−1 is expected for sulfate transport, but the lower experimental value (0.4 mg C−1) suggests that cations are also participating. Similarly, large step-changes in mass were indicative of sudden volume expansion between oxidation states. Using EQCM-D to estimate the solvent-swollen PTPM thickness, the polymer swelled by 63.8% upon oxidizing from the neutral to the dication form for Na2SO4.
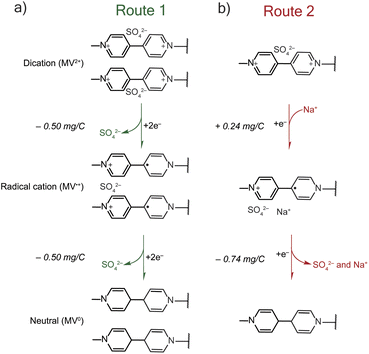
The mass-charge profiles (Fig. 4) and the derivative mass profiles (Fig. S2†) for PTPM in Na2SO4 electrolyte suggests that charge compensation occurs very differently relative to NaCl electrolyte. This is because the sulfate anion is divalent and can interact with more than one viologen unit at a time.29 Accordingly, we considered two different charge compensation routes for the Na2SO4 electrolyte, Fig. 5. In Route 1 (Fig. 5a), reduction of the two dications to two radical cations leads to expulsion of a sulfate anion, with the remaining sulfate anion being shared between the two radical cations. Further reduction of the two radical cations to neutral viologen units leads to the expulsion of the remaining sulfate anion. To be valid, Route 1 requires absolute mass-charge changes corresponding minimally to that of the sulfate anion (0.50 mg C−1).
In contrast, Route 2 considers the contribution of sodium cations in the charge compensation mechanism. Upon reduction of the dication to the radical cation, a sodium cation enters into the PTPM electrode for charge neutrality (+0.24 mg C−1). Further reduction to the neutral viologen species then leads to expulsion of both sodium and sulfate ions (−0.74 mg C−1).
Instead, we propose that both Routes 1 and 2 simultaneously occur in PTPM in Na2SO4 (Fig. 4). Evidence for both is supplied by the presence of extra redox peaks in the cyclic voltammogram. These two routes can occur at different potentials, hence the appearance of the extra peak in the reduction scan for PTPM in Na2SO4, Fig. 2c and 3c. Also, the derivate mass profile in Fig. S2† shows small mass peaks corresponding to the extra peaks. Examining the additive effects of Routes 1 and 2, it is reasonable that simultaneous sulfate expulsion and sodium injection can occur, to yield a mixed Δm/e value for the dication/radical cation reduction step. It is challenging to deconvolute the contributions of Routes 1 and 2 because water is also likely involved. We speculate that the extra peak that occurs at the more positive potential is assigned to sodium transport because sodium transport is less hindered due to its monovalent nature.
When comparing the two electrolytes, it was observed that for the NaCl electrolyte there was less swelling (ca. 39%) and an observable and nearly constant water-coupled chloride movement. In contrast, for the Na2SO4 electrolyte there was significantly more swelling (ca. 64%) with highly coupled water-sulfate movement outside of the redox peaks. However, during the plateaus associated with the redox peaks, mixed sulfate-sodium movement with some water was observed. For battery applications, the reduced swelling and smoother mass-change profile associated with the sodium chloride electrolyte may be preferred to prevent large thickness changes that could impact the electrode resistance. However, the sodium sulfate electrolyte resulted in a higher capacity than the sodium chloride electrolyte. Long-term cycling of the two polymers in a practical battery (i.e., with carbon additive) will be required to fully understand which electrolyte is best; however, our current electropolymerization approach prevents us from exploring this idea at present.
Electrochemical impedance spectroscopy
As discussed, there was a large amount of water movement occurring in both electrolytes for PTPM. One concern with water uptake is that the charge transfer resistance (RCT) could increase due to an increased thickness. Because these polymers were examined without conductive carbon, swelling can diminish electron hopping from chain to chain. To determine RCT for the viologen films in each electrolyte, electrochemical impedance spectroscopy (EIS) was utilized, and the resulting data was modeled using the equivalent circuit presented in Fig. 6a. This equivalent circuit is acknowledged to be an oversimplification because the polymer has mixed ion and electron transport, and the two electrolytes are at different ionic strengths. The EIS curves for the NaCl electrolyte exhibited semi-circles typical of redox-active polymers (Fig. 6b). However, the Na2SO4 electrolyte did not exhibit a clear semi-circle, which could be associated with large resistance or diffusion limitations (Fig. 6c). From the equivalent circuit fits (Table 1), PTPM exhibits a larger RCT for the dication/radical cation redox couple as compared to radical cation/neutral form for both electrolytes. However, PTPM exhibited significantly smaller RCT values in NaCl compared to Na2SO4. This can be attributed to the degree of swelling (39% for NaCl vs. 64% for Na2SO4).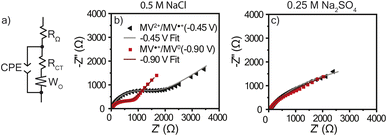 | ||
| Fig. 6 (a) The equivalent circuit used to model the EIS data. Nyquist plots for PTPM in (b) 0.5 M NaCl and (c) 0.25 M Na2SO4 with their curve fits. EIS was conducted at −0.45 V and −0.90 V vs. Ag/AgCl (sat.) with an amplitude of 10 mV in a frequency range of 5 × 10⁶ Hz to 0.1 Hz (10 steps per decade). Bode plots are found in Fig. S5 and S6.† | ||
| EIS fit parameter | Dication/radical cation (−0.45 V vs. Ag/AgCl) | Radical cation/neutral (−0.90 V vs. Ag/AgCl) | ||
|---|---|---|---|---|
| 0.5 M NaCl | 0.25 M Na2SO4 | 0.5 M NaCl | 0.25 M Na2SO4 | |
| R Ω (Ω) | 35 ± 0.2 | 40 ± 0.1 | 34 ± 0.2 | 40 ± 0.2 |
| R CT (Ω) | 1330 ± 80 | 3520 ± 350 | 650 ± 30 | 1170 ± 340 |
| W O | 0.21 ± 0.01 | 0.22 ± 0.04 | 0.29 ± 0.01 | 0.33 ± 0.04 |
| CPE (S sα) | 60 ± 1 | 710 ± 10 | 80 ± 2 | 520 ± 20 |
| CPE α | 0.83 ± 0.01 | 0.66 ± 0.01 | 0.92 ± 0.01 | 0.71 ± 0.01 |
Conclusions
In conclusion, the synthesis and in situ electropolymerization of 1,3,5-tris(4-cyanopyridinio)mesitylene (TPM) bromide salt was presented. After electropolymerization, the mass transport properties of the fully crosslinked PTPM film during cyclic voltammetry were studied using quartz crystal microbalance with dissipation (QCM-D) in aqueous sodium chloride (NaCl) and sodium sulfate (Na2SO4) electrolyte solutions. In the NaCl electrolyte, smooth mass transitions were observed corresponding with the onset of the redox potential. In contrast, in the Na2SO4 electrolyte, the PTPM exhibited mass transfer plateaus corresponding to each redox potential with drastic steps mass transport between. The PTPM film exhibited a higher areal capacity in the Na2SO4 electrolyte compared to the NaCl electrolyte. There was significantly more film swelling in the Na2SO4 electrolyte than the NaCl electrolyte. This is reflected in a higher charge transfer resistance for the film in the Na2SO4 compared to the NaCl electrolyte. Interestingly, EQCM-D provided indirect evidence both sodium and sulfate transport in PTPM, caused by the interaction of divalent sulfate anions with multiple viologen units. Taken together, this demonstrates the drastic differences in the ion-coupled water transport for monovalent and divalent electrolytes in viologen-based network polymers.Experimental
Materials
Sodium chloride (NaCl), 4-pyridinecarbonitrile, acetonitrile (MeCN), sodium tetrafluoroborate (NaBF4), 1,3,5-tris(bromomethyl)benzene (TBMB), and methanol were received from Millipore Sigma. Sodium sulfate (Na2SO4) was received by VWR. Ultrapure water (MQ water) was collected from a Milli-Q® water purification system (18 MΩ cm). Indium tin oxide (ITO)-coated glass (CUV5B) was purchased from Delta Technologies. Au-coated QSense quartz crystal microbalance sensors with a Ti adhesion layer (QSX 338) were purchased from Biolin Scientific and cleaned with 5![[thin space (1/6-em)]](https://www.rsc.org/images/entities/char_2009.gif) :
:![[thin space (1/6-em)]](https://www.rsc.org/images/entities/char_2009.gif) 1
1![[thin space (1/6-em)]](https://www.rsc.org/images/entities/char_2009.gif) :
:![[thin space (1/6-em)]](https://www.rsc.org/images/entities/char_2009.gif) 1 (by volume) MQ·H2O:ammonium hydroxide:hydrogen peroxide at 75 °C for 5 min before use. All chemicals were used as received.
1 (by volume) MQ·H2O:ammonium hydroxide:hydrogen peroxide at 75 °C for 5 min before use. All chemicals were used as received.
Characterization
1H-NMR spectra were conducted on D2O solutions using a 400 MHz Bruker NMR. UV-vis spectra were collected in 1 nm increments from 800 to 250 nm using a Hitachi U-4100 UV-vis-NIR spectrophotometer (341-F).Synthesis of 1,3,5-tris(4-cyanopyridinio)mesitylene (TPM) bromide salt
The TPM bromide salt was synthetized following a modified protocol from Sano et al. and is described briefly (Fig. 1a).16 TBMB (2.25 g, 6.3 mmol) and 4-pyridinecarbonitrile (6.5 g, 62.4 mmol) were refluxed in acetonitrile (20 mL) for 24 h under nitrogen. The resulting, yellow-colored solid was recovered by filtration, washed with acetonitrile, and recrystallized from methanol to yield yellow needlelike crystals. This afforded 1.24 g of the final product (yield = 62%).Electrochemical measurements
TPM was electropolymerized from a 5 mM TPM in 0.1 M NaCl aqueous solution onto ITO glass in a three-electrode beaker cell with a platinum wire counter electrode and Ag/AgCl (sat.) reference electrode. The electropolymerization was carried out using a potentiostatic hold at −0.75 V vs. Ag/AgCl for 10 minutes (Fig. 7). After deposition, the film was soaked in the testing electrolyte for 20 minutes to remove any unreacted TPM. The testing electrolytes were 0.5 NaCl and 0.25 M Na2SO4. After soaking, conditioning by cyclic voltammetry (CV) was carried out for three cycles at 50 mV s−1, followed by two cycles of CV at each of the following scan rates: 5, 10, 25, 50, 100, and 200 mV s−1. Finally, a 10 minutes potentiostatic hold was used to equilibrate the sample before conducting electrochemical impedance spectroscopy (EIS) with an amplitude of 10 mV in a frequency range of 0.1 to 5 × 10⁶ Hz (10 steps per decade). Equilibration and EIS were conducted at two potentials: (1) −0.45 V vs. Ag/AgCl and (2) −0.90 V vs. Ag/AgCl. All electrochemical data were collecting using a Gamry Interface 1000 unless otherwise noted.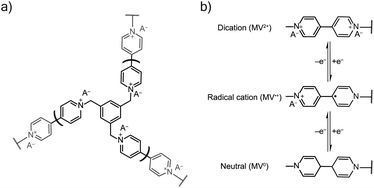 | ||
| Fig. 7 (a) The viologen crosslinked network from electropolymerization of TPM salt. (b) The redox mechanism of the viologen pendant group with both charge and ion transport, where A− is an anion. | ||
Electrochemical quartz crystal microbalance with dissipation (EQCM-D)
In situ mass changes during electrochemistry were characterized using a QSense E1 module (Biolin Scientific) during electrodeposition and CV. First, an air baseline was collected on the blank Au/Ti sensor for 2 minutes. After 2 minutes, the 5 mM TPM in 0.1 M NaCl aqueous solution was flowed (150 μL min−1) into the EQCM-D cell and the flow was stopped for the electropolymerization. The electropolymerization was then carried out using a potentiostatic hold at −0.75 V vs. Ag/AgCl for 4 minutes. After deposition, the testing electrolyte was continuously flowed at 150 μL min−1 into the cell for 20 minutes to remove any unreacted TPM. After 20 minutes the electrolyte flow was ceased, and conditioning cyclic voltammetry (CV) was carried out for three cycles at 50 mV s−1, followed by two cycles of CV at each of the following scan rates: 5, 10, 25, 50, 100, and 200 mV s−1. The QCM-D data was analyzed using Dfind (Biolin Scientific), where the reference period was taken as the static solution of 5 mM TPM in 0.1 M NaCl aqueous solution before the electropolymerization began. The estimated film thickness after electropolymerization was ca. 120 nm.EQCM-D data modeling
The QCM-D data were modeled in Dfind using the composite Sauerbrey equation, which relates the normalized change in frequency (Δf/n) to change in mass (eqn (1)). For fitting, the solution density was assumed to match that of water (1 mg mL−1) and the polymer layer was taken to be 1.2 mg cm−3. Overtones 3, 5, 7, and 9 were used to obtain accurate fits. | (1) |
The mass change is then related to the charge transferred to determine the mass per charge relationship (Δm/e) and then compared to the ideal value obtained from Faraday's law.
Author contributions
A. D. E. and J. L. L. conceived the study. A. D. E. developed experimental methodologies, carried out the experiments, and completed data analysis. K. M. assisted in data acquisition. All of the authors discussed the results. A. D. E. and J. L. L. wrote the manuscript with input from K. M.Conflicts of interest
There are no conflicts to declare.Acknowledgements
A. D. E and J. L. L acknowledge support from grant DE-SC0014006 funded by the US Department of Energy, Office of Science (PTPM synthesis, E-QCMD). A. D. E. acknowledges support by the National Science Foundation Graduate Research Fellowship under Grant No. DGE: 1746932. K. M. acknowledges support by the National Science Foundation from grant DMR-2119672 (EIS analysis).Notes and references
- Nature, 2021, 595, 7, DOI:10.1038/d41586-021-01735-z.
- A. D. Easley, T. Ma and J. L. Lutkenhaus, Joule, 2022, 6, 1743–1749 CrossRef
.
- T. Kim, W. Song, D.-Y. Son, L. K. Ono and Y. Qi, J. Mater. Chem. A, 2019, 7, 2942–2964 RSC
.
- M. Li, J. Lu, Z. Chen and K. Amine, Adv. Mater., 2018, 30, 1800561 CrossRef PubMed
.
- J. Xie and Y.-C. Lu, Nat. Commun., 2020, 11, 2499 CrossRef CAS PubMed
.
- J. Kim, J. H. Kim and K. Ariga, Joule, 2017, 1, 739–768 CrossRef CAS
.
- P. Rohland, E. Schröter, O. Nolte, G. R. Newkome, M. D. Hager and U. S. Schubert, Prog. Polym. Sci., 2022, 125, 101474 CrossRef CAS
.
- M. Kathiresan, B. Ambrose, N. Angulakshmi, D. Elizabeth Mathew, D. Sujatha and A. Manuel Stephan, J. Mater. Chem. A, 2021, 9, 27215–27233 RSC
.
- M. Yuan and S. D. Minteer, Curr. Opin. Electrochem., 2019, 15, 1–6 CrossRef CAS
.
- T. Ma, A. D. Easley, S. Wang, P. Flouda and J. L. Lutkenhaus, Cell Rep. Phys. Sci., 2021, 2, 100414 CrossRef CAS
.
- S. Wang, F. Li, A. D. Easley and J. L. Lutkenhaus, Nat. Mater., 2019, 18, 69–75 CrossRef CAS PubMed
.
- C. Karlsson, H. Huang, M. Strømme, A. Gogoll and M. Sjödin, RSC Adv., 2015, 5, 11309–11316 RSC
.
- M. Sterby, R. Emanuelsson, X. Huang, A. Gogoll, M. Strømme and M. Sjödin, Electrochim. Acta, 2017, 235, 356–364 CrossRef CAS
.
- H. Wang, R. Emanuelsson, H. Liu, K. Edström, F. Mamedov, M. Strømme and M. Sjödin, ACS Appl. Energy Mater., 2019, 2, 7162–7170 CrossRef CAS
.
- D.-Y. Lee, A. K. M. Kafi, S.-H. Park, D.-J. Qian and Y.-S. Kwon, Jpn. J. Appl. Phys., 2006, 45, 3772 CrossRef CAS
.
- N. Sano, W. Tomita, S. Hara, C.-M. Min, J.-S. Lee, K. Oyaizu and H. Nishide, ACS Appl. Mater. Interfaces, 2013, 5, 1355–1361 CrossRef CAS
.
- C. M. Corrêa, S. I. Córdoba de Torresi, T. M. Benedetti and R. M. Torresi, J. Electroanal. Chem., 2018, 819, 365–373 CrossRef
.
- J.-Y. Ock, H.-K. Shin, Y.-S. Kwon and J. Miyake, Colloids Surf., A, 2005, 257–258, 351–355 CrossRef CAS
.
- H.-X. Huang, D.-J. Qian, N. Nakamura, C. Nakamura, T. Wakayama and J. Miyake, Electrochim. Acta, 2004, 49, 1491–1498 CrossRef CAS
.
- K. Kamata, T. Kawai and T. Iyoda, Langmuir, 2001, 17, 155–163 CrossRef CAS
.
- K. Kamata, T. Suzuki, T. Kawai and T. Iyoda, J. Electroanal. Chem., 1999, 473, 145–155 CrossRef CAS
.
- H. C. De Long and D. A. Buttry, Langmuir, 1992, 8, 2491–2496 CrossRef CAS
.
- T. Saika, T. Iyoda and T. Shimidzu, Bull. Chem. Soc. Jpn., 1993, 66, 2054–2060 CrossRef CAS
.
- A. D. Easley, T. Ma, C. I. Eneh, J. Yun, R. M. Thakur and J. L. Lutkenhaus, J. Polym. Sci., 2022, 60, 1090–1107 CrossRef CAS
.
- L. Wang, J. Ding, S. Sun, B. Zhang, X. Tian, J. Zhu, S. Song, B. Liu, X. Zhuang and Y. Chen, Adv. Mater. Interfaces, 2018, 5, 1701679 CrossRef
.
- K. Madasamy, D. Velayutham, V. Suryanarayanan, M. Kathiresan and K.-C. Ho, J. Mater. Chem. C, 2019, 7, 4622–4637 RSC
.
- M. N. Akieh, W. E. Price, J. Bobacka, A. Ivaska and S. F. Ralph, Synth. Met., 2009, 159, 2590–2598 CrossRef CAS
.
- T. Ma, C.-H. Li, R. M. Thakur, D. Tabor and J. L. Lutkenhaus, Nat. Mater., 2023 DOI:10.1038/s41563-023-01518-z
.
- A. J. Kelly and N. Oyama, J. Phys. Chem., 1991, 95, 9579–9584 CrossRef CAS
.
Footnote |
| † Electronic supplementary information (ESI) available. See DOI: https://doi.org/10.1039/d3ta00289f |
| This journal is © The Royal Society of Chemistry 2023 |

