 Open Access Article
Creative Commons Attribution 3.0 Unported Licence
Effect of small amounts of akaganeite (β-FeOOH) nanorods on the gelation, phase behaviour and injectability of thermoresponsive Pluronic F127†
Surya Narayana
Sangitra
 a and
Ravi Kumar
Pujala
 *ab
*ab
aSoft and Active Matter group, Department of Physics, Indian Institute of Science Education and Research (IISER), Tirupati, Andhra Pradesh 517507, India. E-mail: pujalaravikumar@iisertirupati.ac.in
bCentre for Atomic, Molecular and Optical Sciences & Technologies (CAMOST), Indian Institute of Science Education and Research (IISER) Tirupati, Tirupati, Andhra Pradesh 517507, India
First published on 16th June 2023
Abstract
Pluronic F127 (PF127) is a copolymer with an amphiphilic nature and can self-assemble to form micelles and, beyond 20% (w/v), form a thermoresponsive physical gel state. However, they are mechanically weak and easily dissolve in physiological environments, which limits their use in load-bearing in specific biomedical applications. Therefore, we propose a pluronic-based hydrogel with enhanced stability by incorporating small amounts of paramagnetic nanorods, akaganeite (β-FeOOH) nanorods (NRs) of aspect ratio ∼7, with PF127. Due to their weak magnetic properties, β-FeOOH NRs have been used as a precursor for preparing stable iron-oxide states (e.g., hematite and magnetite), and the studies on β-FeOOH NRs to be used as a primary component in hydrogels are at the nascent stage. Here we report a method to synthesize β-FeOOH NRs on a gram scale using a simple sol–gel process and characterize the NRs with various techniques. A phase diagram and thermoresponsive behaviour based on rheological experiments and visual observations are proposed for 20% (w/v) PF127 with low concentrations (0.1–1.0% (w/v)) of β-FeOOH NRs. We observe a unique non-monotonous behaviour in the gel network represented by various rheological parameters like storage modulus, yield stress, fragility, high-frequency modulus plateau, and characteristic relaxation time as a function of nanorod concentration. A plausible physical mechanism is proposed to fundamentally understand the observed phase behaviour in the composite gels. These gels show thermoresponsiveness and enhanced injectability, and could find applications in tissue engineering and drug delivery.
Introduction
Hydrogels are soft materials with a three-dimensional internal network-like structure with water as the main component.1 If hydrogels have two or more components, they are called hybrid gels or nanocomposite hydrogels.2–5 Because of their moderate biocompatibility, high water content and low surface tension with biological fluids, and soft behaviour, they have proved to be more stable, economical and efficient than conventional drug delivery (DD) and tissue engineering (TE) systems.6,7 Because of the above advantages, from 1960 onwards, hydrogels were widely used in biological fields.8 Hydrogels have undergone different development stages for more than six decades. Summarising all the stages, currently, they are collectively known as smart materials.9 The word smart corresponds to a direct response to changes in environmental conditions like pH, light, pressure, temperature, and electric and magnetic fields.10 If the hydrogels are sensitive to temperature, they are known as thermoresponsive hydrogels.11 Poly(N-isopropyl acrylamide) (PNIPAM), poly-(organo-phosphazenes) (PPZ), and poloxamers are the most commonly used thermoresponsive polymers.12 Poloxamers are non-ionic copolymers consisting of three blocks, out of which one block composed of poly(propylene oxide) (PPO) having hydrophobic nature is sandwiched between two blocks of poly(ethylene oxide) (PEO) which are hydrophilic. The poloxamers 407 (P407) are also known as Pluronic F127 (PF127).13 Pluronics have broad industrial applications as detergents, stabilisers, dispersants, foaming agents and emulsifiers.14–18 In biomedical fields, PF127 has been used for the last 50 years in tissue engineering (TE) and drug delivery (DD) systems.13 The incorporation of drugs into PF127 systems enhances the circulation time and stability. The outer hydrophilic PEO block of PF127 micelles protects the drugs from external conditions leading to reinforced metabolic activity. At higher concentrations (>18%), PF127 micelles can form a gel. Gels based on PF127 containing various drugs have been used for different skin, eye and dental treatments.19 An extensive study has been done on the microstructures and rheological properties of pure PF127.20,21However, along with the above advantages, PF127 has a few drawbacks: they are mechanically weak and easily dissolve in physiological environments, which limits their use in load-bearing in specific biomedical applications.22,23
To overcome these drawbacks and improve the hydrogel properties, synthetic and natural polymers, clay, bioactive glasses and nanoparticles (NPs) can be introduced into the hydrogels.24–27 Among different works, we have discussed a few composite systems that characterise the composite system using rheology as one of the tools. Mayol et al. developed a hydrogel consisting of PF127 and hyaluronic acid (HA) with enhanced mechanical and drug release properties.28 Chia-jung et al. proposed a nanocomposite hydrogel based on PF127 and LAPONITE® (inorganic clay), which is mechanically tough compared to its polymer hydrogel counterparts.29 To prevent F127 hydrogels from dissolving in aqueous media and to enhance their mechanical properties, Baskan et al. proposed a tough interpenetrating hydrogel made of P127 and polyacrylic acid (PAA).30 Maria Bercea et al. investigated the PVA/PF127 composite system and reported enhanced stability of PF127 due to a PVA-entangled network.31 Hom and Bhatia proposed a mechanically strong composite system made of PF127/alginate and LAPONITE® clay.32 Yeh et al. proposed a thermoreversible gel consisting of gelatin and PF127 suitable for biomedical applications.33 Cidade et al. described the role of alginate microparticles in the gelation behaviour of PF127 for making an injectable hydrogel.34 Recently, Khusan et al. performed experiments on a composite system based on cellulose nanocrystals (CNCs) and PF127. They have discussed the role of the CNC network in the phase behaviour of PF127. The composite system shows a thermoreversibility and enhanced flexibility compared to the original PF127 gels.35 Gonçalves et al. dispersed magnetite (Fe3O4) nanoparticles in PF127 for skin delivery applications.36 Inspired by these works and looking at the ubiquity of PF127 in biomedical applications, we have systematically studied composite systems of nanorods (NRs), i.e., akaganeite (β-FeOOH) NRs in PF127.
Iron oxyhydroxides (FeOOH) can exist in different crystalline polymorph phases, commonly known as α, β, γ and δ as goethite, akaganeite, lepidocrocite and ferroxyhyte, respectively.37 The β-phase polymorphs of iron oxyhydroxide, commonly known as akaganeite (β-FeOOH), recently received much attention in different applications, including water treatment, photocatalysis and batteries.38 Recently, Fateheh et al. studied the applications of β-FeOOH NRs with antimicrobial benefits, and it also showed decent biocompatibility when synthesised with different concentrations of surfactants, polyethene amine (PEI) and polyethene glycol (PEG).39 The β-FeOOH NRs are used as an intermediate state to convert to the most stable iron oxides like magnetite (Fe3O4) and hematite (α-Fe2O3),40 but significantly less attention has been given to the β-FeOOH form alone.41 The β-FeOOH NRs are paramagnetic at room temperature and show weak magnetic response compared to other MNPs, and therefore, conventionally, they have not been used in many biomedical fields.42
But there have been some cases where paramagnetic nanoparticles were used in cancer diagnosis and therapy.43
Since β-FeOOH NRs have magnetic properties,44,45 these composite gels can find applications in future targeted drug delivery.46 As discussed earlier, PF127 forms micelles, which can encapsulate drugs and other active molecules and release them in a controlled manner.19 The addition of β-FeOOH NRs could potentially enhance the drug release property.47 β-FeOOH nanoparticles can improve the mechanical properties of the composite system since it show enhanced stiffness and toughness in some polymer composites.48 Therefore, we investigate a composite system of β-FeOOH NRs, which are paramagnetic, and its composite system with PF127 can be a good candidate for thermoresponsive magnetic hydrogels used for biomedical applications.46
In this work, we aim to explore the potential of β-FeOOH as a component of thermoresponsive magnetic hydrogels for biomedical applications, leveraging its unique rheological properties. Therefore, in perspective of biomedical applications, we proposed a pluronic-based hydrogel with enhanced stability and gel strength by incorporating a small amount (≤1% (w/v)) of akaganeite (β-FeOOH) nanorods (NRs) in 20% PF127, to ensure biocompatibility.
This study explores the effect of small amounts of akaganeite nanorods of aspect ratio ∼7 on the gelation, stability and phase behaviour of thermoresponsive PF127 suspensions. Based on visual appearance and rheological experiments, we establish a phase diagram by identifying the thermoresponsive behaviour with rotational and oscillatory modes. We propose a possible physical mechanism based on different interactions between the colloidal particles to understand the observed phase behaviour. These gels show thermoresponsiveness and injectability, which could be used for biomedical fields, specifically in tissue engineering and drug delivery applications.
Materials and methods
Materials
Pluronic F127 (PF127) (flakes) powder with average molecular weight (∼12![[thin space (1/6-em)]](https://www.rsc.org/images/entities/char_2009.gif) 600 g mol−1), ferric chloride hexahydrate (FeCl3·6H2O) and sodium hydroxide (NaOH) pellets were purchased from Sigma-Aldrich, India and were used without further modifications. Milli-Q (MQ) water (pH ∼ 6 to 7) was used as a solvent for all the experiments. The pH of the suspensions was changed by dropwise addition of millimolar amounts of NaOH.
600 g mol−1), ferric chloride hexahydrate (FeCl3·6H2O) and sodium hydroxide (NaOH) pellets were purchased from Sigma-Aldrich, India and were used without further modifications. Milli-Q (MQ) water (pH ∼ 6 to 7) was used as a solvent for all the experiments. The pH of the suspensions was changed by dropwise addition of millimolar amounts of NaOH.
Synthesis procedures for akaganeite β-FeOOH NRs
The β-FeOOH NRs were synthesised following a sol–gel technique.49,50 1.8 M FeCl3·6H2O was prepared in a beaker with water as the solvent. The precursor FeCl3·6H2O was mixed via sonication and then stirred using a Teflon-coated magnetic bead to get complete dilution on a magnetic stirrer. The same procedure is repeated for mixing 5 molar NaOH solution in water. After that, the stock suspensions of NaOH were added slowly to the iron chloride solution with continuous stirring using a Teflon-coated magnetic bead at 1500 rpm for 15–20 minutes on a magnetic stirrer.After complete addition, the mixture becomes thick and brown. After the mixture becomes more viscous and gains a dark brown colour, it is tightly sealed in glass bottles with a lid covered with aluminium foil. These bottles are immediately transferred to a preheated oven at 100 °C and kept for 8 h without disturbance to produce β-FeOOH NRs. Later, the precipitate is separated by centrifugation at 12![[thin space (1/6-em)]](https://www.rsc.org/images/entities/char_2009.gif) 000 rpm for 10 minutes, 5–6 times to remove the other impurities. The residual sample was collected in the centrifuge tube and was frozen by dipping the tubes in liquid nitrogen. The caps of the tubes were replaced by Kim wipe tissues making some tiny pinholes. The frozen samples were kept in a VirTis SP Scientific (benchtop lyophiliser with a temperature of −104 °C and a pressure of 23 mT for creating a vacuum) for 24–48 h (depending on the sample volume) to get the β-FeOOH NRs in powder form.
000 rpm for 10 minutes, 5–6 times to remove the other impurities. The residual sample was collected in the centrifuge tube and was frozen by dipping the tubes in liquid nitrogen. The caps of the tubes were replaced by Kim wipe tissues making some tiny pinholes. The frozen samples were kept in a VirTis SP Scientific (benchtop lyophiliser with a temperature of −104 °C and a pressure of 23 mT for creating a vacuum) for 24–48 h (depending on the sample volume) to get the β-FeOOH NRs in powder form.
Sample preparation
The β-FeOOH NR suspensions of concentrations 0.1 to 1.0% are made by dispersing the dry powder in desired amounts by stirring and sonication. Pluronic F127 is a thermoresponsive block copolymer, dissolving only at lower temperatures (<10 °C). Therefore, Pluronic F127 aqueous suspensions of 20% concentration are prepared at low temperatures using an ice bath on a magnetic stirrer. All combinations of mixed suspensions are prepared by adding 20% Pluronic to the aqueous suspensions of β-FeOOH (0.1–1.0% (w/v)). All the sample preparation was done at low temperatures using an ice bath on the magnetic stirrer.High-resolution transmission electron microscopy (HR-TEM) and energy dispersive spectroscopy (EDS)
The high-resolution transmission electron microscopy (HR-TEM) micrograph and energy dispersive spectroscopy (EDS) spectra of the synthesised β-FeOOH NRs were taken from a JEOL JEM 2100 PLUS. The image analysis was performed by Image J software.X-ray diffraction (XRD)
The crystal structures of the NRs were determined using a Rigaku SmartLab X-ray diffractometer and SmartLab Studio II x64 v4.4.295.0 software to analyse the XRD data. The experiments were performed by keeping the X-ray generator with kβ-filter 1D for Cu at 45 kV, 200 mA with 1D scan mode and scan speed 2.0° min−1 with 2θ ranging from 10° to 80°, keeping the step width at 0.01°.Fourier transform infrared (FTIR) spectroscopy
The functional group analysis of the NRs in solid form by making pellets with the KBr disk method with pure PF127 and the nanocomposites was performed by an FT-IR-Bruker ALPHA.Vibrating sample magnetometry (VSM)
The magnetic properties of the NRs were investigated and analysed by a Lakeshore VSM 7410S, vibrating sample magnetometer (VSM) at 300 K.X-ray photoelectron spectroscopy (XPS)
The elemental composition of the NR surface was characterised by XPS spectra and analysed by a Thermo Fisher ESCALAB Xi+ instrument.Dynamic light scattering (DLS and ELS)
The stability of the colloidal dispersions at different pH was studied by measuring hydrodynamic diameter (D), and zeta potential (ζ) by a Litesizer 500 (Anton Paar) using the dynamic light scattering (DLS) and electrophoretic light scattering (ELS) principles, respectively. All the measurements were done at a temperature of 25 °C with 0.2% (w/v) concentration of nanorods and MQ-water as solvent.Rheology
All the rheological measurements of the nanocomposite gels were performed on an MCR 302 rheometer (Anton Paar, Austria) with stainless steel cone-plate geometry (diameter 25 mm having cone angle 2° and truncation gap 0.105 mm) in rotational and oscillatory modes. For rotational tests, viscosity was recorded as a function of temperature (temperature ramp) by keeping the shear rate constant at![[small gamma, Greek, dot above]](https://www.rsc.org/images/entities/i_char_e0a2.gif) = 50 s−1 and oscillatory tests in a small oscillatory shear strain amplitude sweep at a constant angular frequency ω = 10 rad s−1 and frequency sweep are performed in the linear viscoelastic region (LVR), keeping the strain amplitude (γ = 0.5%) constant.
= 50 s−1 and oscillatory tests in a small oscillatory shear strain amplitude sweep at a constant angular frequency ω = 10 rad s−1 and frequency sweep are performed in the linear viscoelastic region (LVR), keeping the strain amplitude (γ = 0.5%) constant.
Results and discussion
Characterization of akaganeite NRs
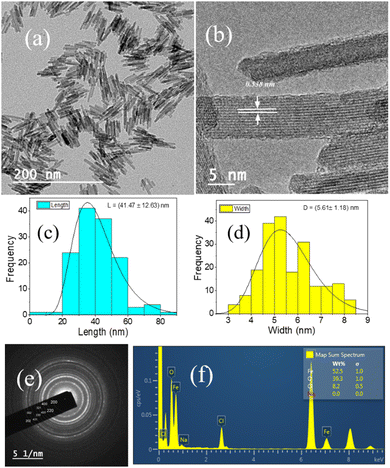
Fig. 1(a and b) represent the HR-TEM images of the NRs, with an average length and width of the β-FeOOH NRs calculated as (41.47 ± 12.63) nm and (5.61 ± 1.18) nm, respectively, using ImageJ software. The length and width are the mean values, and the errors are calculated as standard deviations of the distributions shown in Fig. 1(c and d), respectively. We also analysed the selected area electron diffraction (SAED) patterns to determine the interplanar spacing (d-spacing) (Fig. 1(e) and Fig. S1–S3, ESI†) and crystallographic plane information. Along with HR-TEM, energy dispersive spectroscopy (EDS) data (Table ST1, ESI†) were also analysed to reveal the elements present in the system in percentages (Fig. 1(f)) as iron (Fe), oxygen (O) and chlorine (Cl) with (52.5 ± 1.0)%, (39.3 ± 1.0)% and (8.2 ± 0.5)%, respectively.The powder XRD of the NRs is presented in Fig. 2(a) with the peaks resembling akaganeite (β-FeOOH) with PDF (Pair Distribution Function) card Number: 01-079-5284 (miller indices symbolised in blue colour text). Fig. 2(b) shows the transmission spectra of β-FeOOH NRs with different peaks at 685.23, 857.19, 1626.81 and 3374.83 cm−1. The peaks at 685.23 and 857.19 represent Fe–O stretching vibration51 and Fe–O–Fe bending vibration in the sample,52 respectively. The peaks at 1626.81 and 3374.83 cm−1 correspond to stretching vibrations of the hydroxyl group (OH) in the akaganeite structure.51–53
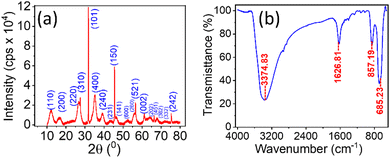 | ||
| Fig. 2 (a) Powder XRD of NRs; the peaks resemble β –FeO (OH) with PDF card No: 01-079-5284. (b) FTIR transmission spectra in the KBr disk method for the NRs. | ||
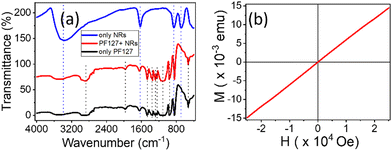
The FTIR profiles of PF127 and its composites with NRs are captured to investigate the functional properties in Fig. 3(a). The FTIR spectra of the nanocomposite are almost identical to the PF127 alone spectra. The peak at 690 cm−1 for the β-FeOOH NRs, which corresponds to Fe–O stretching vibration, is absent in the composite FTIR spectrum. The adsorption of PF127 onto the surface of β-FeOOH NRs could be one of the plausible causes.
Typically, PF127 is known to adsorb onto the surface of nanoparticles and form a protective coating;54 this could potentially affect the vibrational modes of the NRs and lead to a change in the FTIR spectrum. If the adsorption is strong enough, it could even result in the complete absence of the peak at 690 cm−1. This behaviour is also seen in iron oxide nanocrystals in the PF127 system.55
The magnetic behaviour of the NRs is shown in Fig. 3(b). The sample shows a paramagnetic behaviour at room temperature with magnetisation (Ms) of 0.41 emu g−1. Under a magnetic field from (−25![[thin space (1/6-em)]](https://www.rsc.org/images/entities/char_2009.gif) 000) Oe to (+25
000) Oe to (+25![[thin space (1/6-em)]](https://www.rsc.org/images/entities/char_2009.gif) 000) Oe. The positive intrinsic coercivity (Hci) at magnetisation (MS) = 0 is 20.875 Oe, and the residual magnetisation or retentivity (MR) is 0.117 × 10⁻³ emu g−1 with sensitivity (−0.67) emu. The VSM data confirms that NRs respond to the applied field by applying a sufficient magnetic field.
000) Oe. The positive intrinsic coercivity (Hci) at magnetisation (MS) = 0 is 20.875 Oe, and the residual magnetisation or retentivity (MR) is 0.117 × 10⁻³ emu g−1 with sensitivity (−0.67) emu. The VSM data confirms that NRs respond to the applied field by applying a sufficient magnetic field.
Fig. 4(a) and (b) show the XPS spectra of β-FeOOH NRs in iron and oxygen as significant elements for Fe-2p and O-1s with line designation, respectively. Deconvoluting the Fe-2p and O-1s spectra gave the peaks for binding energies at 711.49 eV and 725.13 eV for iron (Fe-2p) and 531.82 eV for oxygen (O-1s). The above data confirm from the NIST database that those peaks belong to the FeOOH bond on the surface.56,57
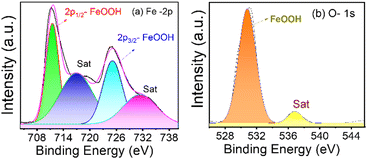 | ||
| Fig. 4 XPS spectra of β-FeOOH NRs in (a) iron and (b) oxygen are presented, and the peaks are deconvoluted to get the spectral information. | ||
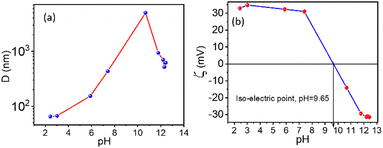
The stability of each suspension depends on its pH value. Therefore, the effect of pH on the solution was studied. For our experiment, 0.1% suspensions of NRs in water were used and are acidic with pH = 2.43. The pH of these suspensions varied from 2.43 to 12.42 using a different molar concentration of NaOH suspensions, as shown in Fig. 5. Hydrodynamic radius (D) from DLS as a function of pH is shown in Fig. 5(a), where continuous growth in the particle size is observed. However, at pH= 10.67, a rapid increase in particle size is seen, indicating an unstable solution.
The complementary results were also obtained from the ELS method with the same instruments. The stability can be understood by observing pH dependent on the zeta potential (ζ) values. Fig. 5(b) shows a shift in zeta potential (ζ) from +32.9 mV to −31.4 mV, reaching an iso-electric point at pH ∼ 9.65, which refers to a stability fluctuation of the suspensions with increasing pH. After pH = 7.4, a rapid decrease in zeta potential was observed, stabilising after pH = 11.77. At pH ∼ 9.65, the corresponding zeta potential becomes zero, and the particle aggregation is strong because the particle/cluster size is in micrometres (∼5 μm). Hence the particles sedimented after a few minutes.
As a subsequent study, we incorporated the NRs in a thermoresponsive triblock copolymer to prepare a nanocomposite and studied their dispersion stability properties. The DLS and ELS measurements for the composite systems are reported in Table 1.
| Sample name (concentration in %(w/v)) | Hydrodynamic diameter (D) (nm) | ζ-Potential (mV) |
|---|---|---|
| 1.0% PF127 only | 22.46 | −16.8 ± 0.8 |
| 0.1% NRs only | 58.78 | 29.2 ± 0.5 |
| 0.1% NRs + 0.1%PF127 | 84.37 | 19.1 ± 1.0 |
| 0.1% NRs + 1%PF127 | 114.49 | 15.8 ± 0.9 |
| 0.1% NRs + 10%PF127 | 3433 | −4.0 ± 0.2 |
The DLS and ELS measurements were performed on the composite systems consisting of 0.1% NRs with different concentrations of PF127 at 25 °C. The hydrodynamic diameter PF127 is 22.46 nm. The size of the particles in the composite system increases from 58.78 nm to 3343 nm as the PF127 concentration increases from 0.1% to 10%, respectively, and at higher concentrations (15% and 20%) the samples are more turbid and not suitable for DLS measurements. The zeta potential from ELS measurements decreases, and the data support the aggregation of the particles due to the adsorption of PF127 molecules (Table 1). Since nanorods are hydrophilic (Fig. S4, ESI†), the hydrophilic part PEO can attach to the surface of the NRs. The schematic diagram of the adsorption mechanism is proposed for the PEO–PPO–PEO block of PF127 on the NR surface (Fig. 6). We also tried to redisperse the composite system in MQ water after freeze drying but found that the coated NRs are not fully dispersed in water (Fig. S5, ESI†), which also supports polymer adsorption on the nanorods. This mechanism is consistent with the results from DLS, zeta potential and FTIR. At higher concentrations of PF127, the micelle concentrations are enough to make a stable suspension (Fig. S6, ESI†). In the subsequent study, the thermoresponsive behaviour of the composite systems is characterised by rheology.
 | ||
| Fig. 6 Schematic illustration of the adsorption of the PEO–PPO–PEO block of PF127 on the β-FeOOH NR surface. | ||
Rheological profiling
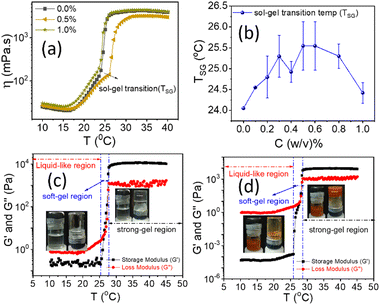
![[small gamma, Greek, dot above]](https://www.rsc.org/images/entities/i_char_e0a2.gif) = 50 s−1). Fig. 7(a) suggests that adding low concentrations of NRs does not affect the overall trend of the temperature-dependent viscosity curves. Viscosity decreases with increasing temperature at low temperatures (10–15 °C). The conversion of unimers into micelles can reduce the hydrodynamic volume per unimer and may cause a lowering in viscosity.58,59 At temperatures nearly 25–30 °C, there is a sudden rise in the viscosity by 10–100 times, which may correspond to the sol–gel transition temperature (TSG), as shown in Fig. 7(a).35 The TSG increases from 24 °C to 24.50 °C as we incorporate NRs in PF127 and then fluctuates between 24.50–26 °C as shown in Fig. 7(b). The presence of β-FeOOH NRs can hinder the connectivity between the PF127 micelles from forming a more closely packed structure and can lead to a higher transition temperature.35
= 50 s−1). Fig. 7(a) suggests that adding low concentrations of NRs does not affect the overall trend of the temperature-dependent viscosity curves. Viscosity decreases with increasing temperature at low temperatures (10–15 °C). The conversion of unimers into micelles can reduce the hydrodynamic volume per unimer and may cause a lowering in viscosity.58,59 At temperatures nearly 25–30 °C, there is a sudden rise in the viscosity by 10–100 times, which may correspond to the sol–gel transition temperature (TSG), as shown in Fig. 7(a).35 The TSG increases from 24 °C to 24.50 °C as we incorporate NRs in PF127 and then fluctuates between 24.50–26 °C as shown in Fig. 7(b). The presence of β-FeOOH NRs can hinder the connectivity between the PF127 micelles from forming a more closely packed structure and can lead to a higher transition temperature.35
To understand this behaviour further, we performed more experiments by keeping the temperature constant and varying the shear rate (Fig. S7 and S8, ESI†) for 20% PF127 and an oscillatory test with varying strain amplitude, frequency and temperature. The oscillatory temperature sweeps, shown in Fig. 7(c and d), confirm the thermoresponsive behaviour. From the oscillatory test, we defined three-regions, in the first region G′′ is dominated over G′, so it is named as a liquid-like sample. In the second region where G' is dominated over G′′ but varies with temperature. We refer to this region as the sol–gel transition or soft-gel region. In the third region, G' is dominated over G′′ but shows a plateau region, and we refer to it as a strong-gel. These regions are also found in other experiments (Fig. S9 and S10, ESI†).
Amplitude sweeps
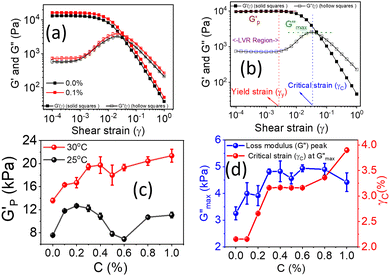
The rotational rheological tests give information about the viscosity of the materials, whereas the oscillatory test gives general information about the viscoelastic properties. Therefore, we investigated the amplitude sweep tests with strain amplitude (γ) in the interval from 0.0001 to 1, keeping angular frequency constant at (ω = 10 rad s−1). Fig. 8(a) shows the amplitude sweep data for 20% PF127 for different concentrations (0.1–1.0%) of β-FeOOH NRs at 30 °C. The storage (G′) and loss (G′′) moduli exhibit plateau regions, i.e., nearly independent of shear strain for low strain values, which is labelled in Fig. 8(b) as the linear viscoelastic region (LVR). The red vertical lines in Fig. 8(b) represent the limit of the LVR regions, and we define the corresponding shear strain values as yield strain (γy). A horizontal line fitting to the storage modulus (G′) curve determines the storage modulus value at low strain and is shown in Fig. 8(b). The linear region of the curve represents the regime where the material response is predominantly elastic and reversible and where the storage modulus is a good measure of the material's resistance to deformation.60,61The storage modulus value at low strain is an essential parameter in characterizing the mechanical properties of a material. Higher storage modulus value at low strain indicates that the material is stiffer and more resistant to deformation, while a lower value indicates that the material is more compliant and less resistant to deformation.62 After the yield point, both moduli start to deviate from linearity (i.e. G' decreases and G′′ increases). Similarly, the G′′ values increase and reach a maximum  and then start decreasing again. There is a crossover between G' and G′′ where (G′ = G′′) and the corresponding strain value are defined as flow strain (γf), where the gel behaviour changes to a liquid. The non-linear region of amplitude sweeps can also provide information regarding the network's strength. The strain at which the G′′ peak appears is referred to as the critical strain (γC). Critical strain can be used to quantify the rate of deformation or fragility. The smaller critical strain signifies a stronger physical bond and a more fragile mechanical system.35
For the storage modulus value at low strain  , when plotted as a function of NRs in PF127 gels, we observe a non-monotonous trend both at 25 °C and 30 °C. To investigate this further, we exacted other parameters, such as maximum loss modulus
  and critical strain (γC) from the non-linear regions.
We plotted the storage modulus plateau  representing the gel strength before deformation in Fig. 8(c) and dissipation energy
  and critical strain (γC) representing network strength and fragility of the sample as a function of NR concentration at 30 °C in Fig. 8(d). A non-monotonous behaviour is observed for all the parameters probed in this study. Addition of small concentration NRs (0.1% and 0.2%) in PF127 gels initially forms a more complex and ordered network and fragile network, and a further increase in NR concentrations (0.3–0.6%) makes the system less ordered and flexible, and at even higher concentrations (0.8–1.0%) the system forms a more structured network at 25 °C. But when the temperature is increased to 30 °C the trend in
  is the same but with higher values. This can be due to the formation of larger and more interconnected micelle structures at higher temperatures. The particle loading is very small compared to the previous studies performed on CNC/PF127 systems.35
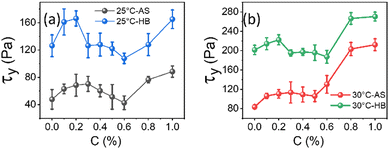
The internal structure of a material does not change under small stress, showing a reversible viscoelastic behaviour as long as the applied stress value is less than the critical stress. The minimum critical stress applied to the sample to see an irreversible viscoelastic behaviour is known as yield stress (τy). We calculated the yield stress by using a similar analogy to a yield strain (Fig. S11, ESI†), but instead of strain, we take moduli as a function of shear stress and extract the yield point, defined as yield stress (τy).60,61
This yield stress is also termed elastic yield stress.63,64 We calculated the dynamic stress by extrapolating the flow curves (Fig. S7(a) and S8(a), ESI†) using Herschel–Berkley (HB) model fitting65 and compared the yield stress obtained from both approaches, plotted as a function of different concentrations of NRs in PF127 gels (Fig. 9). The observed trend of the curve is similar in both cases. The yield stress calculated from the flow curve is 2–3 times higher in magnitude than the yield stress from amplitude sweeps.
The difference in yield stress values obtained from the flow curve and amplitude sweep methods could be attributed to the different deformation modes. The dynamic yield stress calculated from the flow curves represents the stress to maintain flow, and the elastic yield stress is calculated from amplitude sweeps where the plastic deformation begins and the sample no longer fully recovers its original state. In steady shear, the sample must be deforming plastically, and therefore the dynamic yield stress is greater than the elastic yield stress.63 To understand the behaviour in more detail, we also discuss the frequency-dependent behaviour of the viscoelastic moduli keeping the strain amplitude constant.
Frequency sweeps
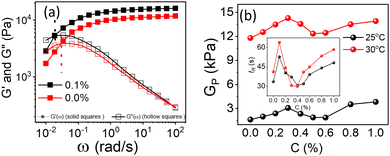
Frequency-dependent storage and loss moduli for different concentrations of NRs in 20% of PF127 at 30 °C are shown in Fig. 10(a). These experiments were performed at a constant strain amplitude of 0.1% in LVR while varying the angular frequency (ω) at 25 °C and 30 °C. Typically, the structural relaxations are characterised by the crossover points between the liquid-like (G′′) and solid-like (G′) behaviour of the sample.The inverse of the angular frequency value corresponding to crossover can give information about the characteristics of relaxation time (tR) for sol–gel transitions of the system.66 Inset of Fig. 10(b), the relaxation time (tR) is plotted as a function of NRs in PF127 gels. In rheology, a high-frequency modulus plateau refers to a region in the frequency sweep where the storage modulus (G′) remains relatively constant over a range of frequencies. The high-frequency modulus plateau is typically observed at frequencies well above the relaxation time of the material. The high-frequency modulus plateau is crucial because it provides information about the material's structural or network properties. Specifically, it implies that the material has reached equilibrium in terms of the stress or deformation response and that the network can maintain its structure and resist deformation across a wide frequency range.67 In Fig. 10(b), the high-frequency modulus plateau (GP) at 25 °C and 30 °C, plotted for different concentrations of NRs and in both measurements, we observe a non-monotonous behavior.
The relaxation time is increased with the loading of nanorods in the PF127 gels. For 0.1% of NRs, tR decreases up to 0.5%, and then from 0.6% to 1.0% onwards, the relaxation time increases. The relaxation time describes the time required for a material to reach equilibrium after a deformation. At a NR concentration of 0.1%, the increase in relaxation time could be due to the formation of a more structured network within the composite material.68 As the concentration of NRs increases from 0.2–0.5%, the relaxation time decreases. This could be due to reduced interparticle distance between nanorods, leading to a less structured network within the composite material.69 The relaxation time increases again at higher NR concentrations of 0.6% to 1.0%. This could be due to the formation of more structured network as the nanorods become more closely packed which we refer to as a secondary network. Here, the strength of the network is defined by the number of grain boundaries (GB) or macroscopic domains that are formed under the application of shearing deformation. The greater the number of domains, the weaker the network strength and the system takes longer time to reach equilibrium. With a small number of domains, the strength of the network is high and the system relaxes faster.70 This explanation is also compatible with the high-frequency modulus plateau (GP) trend shown in Fig. 10(b).
All the experimental data are well supported by the inverted vial test for all composite gels at 25 °C and 30 °C, as shown in Fig. 11. At low loadings of NRs (0.1% and 0.2%) the composite gels are stable in gel form, and for intermediate concentrations (0.3–0.6%), all samples start to flow and for higher concentration (0.8 and 1.0%) again become a gel at 25 °C. As the temperature increases up to 30 °C, all the samples form a strong gel, and therefore, we did not observe any flow behaviour of any sample in the intermediate concentration. We also observed a phase separation in the intermediate particle loading (0.3–0.6%) whose internal microstructure is yet to be probed in detail. Based on all the rheological studies and visual appearance, we propose a phase diagram for the composite systems using different interactions in the system (Fig. 12).
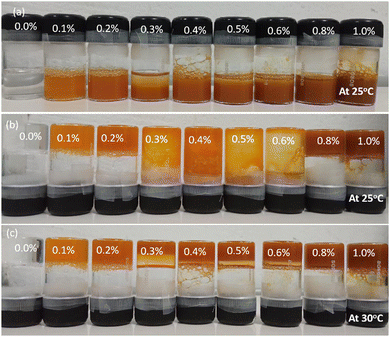 | ||
| Fig. 11 Inverted vial test for different β-FeOOH NR concentrations in 20% PF127. (a) Typical images of all the samples at 25 °C (b) inverting all the vials at 25 °C and (c) at 30 °C. | ||
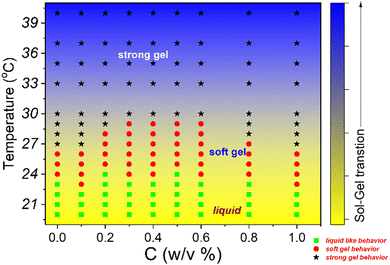 | ||
| Fig. 12 Phase diagram of 20% PF127 in the presence of β-FeOOH NRs based on rheological experiments and visual observations. | ||
Physical mechanism of composite gels
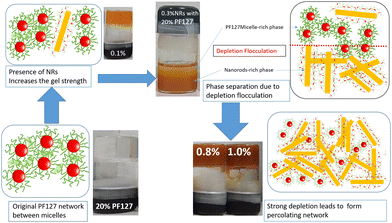
PF127 forms a strong gel containing spherical micelles at concentrations of 17.5% (w/v) or higher.21 From various rheological measurements on 20% PF127 and its composite system, we found non-monotonous rheological behaviour by varying the concentration and temperature. NRs can alter the gel network formed by PF127 micelles and lead to different behaviour (Fig. 13). The network formed in pure PF127 is mainly due to the short-range hydrophilic attraction between the micelles.21 When NRs are incorporated in the PF gel containing micelles, various colloidal interactions and mechanisms come into the picture, leading to different networks.The initial rise in the storage modulus  , defined as gel strength, with the addition of 0.1% and 0.2% of β-FeOOH NRs, could be due to the reinforcing effect of PF127-coated NRs on the polymer network, which leads to an increase in the stiffness of the nanocomposite.71 At lower concentrations, the NRs can act as cross-linkers that strengthen the network by creating additional physical cross-links between the polymer chains. This can lead to an increase in gel strength
  .72 At intermediate concentrations (0.3–0.6%), we see phase separation in the sample (Fig. 11) and a subsequent decrease in
  . At these concentrations, depletion attractions become stronger and can induce flocculation and aggregation of the NRs.73 This can lead to the formation of clusters that act as defects in the polymer network, weakening its structure and leading to a decrease in gel strength
  .74 The clusters formed by the coated NRs may also be responsible for phase separation and flow in composite gels.73,75
At higher concentrations (0.8–1.0%), depletion attraction becomes stronger and may form a percolation network76,77 of NRs that reinforces the polymer network, increasing the  .78 This network may be more interconnected, so the NRs may be less likely to undergo phase separation from the polymer matrix. Therefore, we see stable gels at beyond 0.8% at 25 °C. But at 30 °C, the magnitude of
  doesn’t change significantly, and the values fluctuate within the error bar, and visually we don’t see any flow. We did not observe any flow behaviour of any sample in the intermediate concentration, which may be because as the temperature rises to 30 °C, the polymer chains become less hydrated and more likely to associate and aggregate, leading to larger and more interconnected micelle structures forming a strong gel.
Injectability of hydrogels
The shear thinning behaviour from the flow curve (Fig. S7 and S8, ESI†) and low critical strain value from the non-linear region of the amplitude sweeps (Fig. 8(b)) of PF127 and its composite with β-FeOOH NRs at higher temperatures make them good candidates for injectable gels.35,79–81 When a hydrogel is used in a traditional syringe/needle to inject drugs, different narrow channels with varying diameters are subject to very high shear/stains rates. Therefore, it is crucial to determine if the mixture can recover its initial mechanical properties and the gel state. Hence, to confirm the structural recovery of the hydrogels, we performed the thixotropic test (time-dependent shear thinning test) with three intervals. We followed the same procedure as discussed in Kushan et al.35 and found out that the composite hydrogel indeed recovered its mechanical properties having a higher storage modulus (G′) value than pure PF127 (Fig. 14).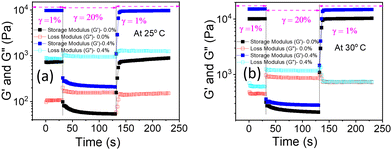 | ||
| Fig. 14 Thixotropic test with 3-intervals to check gel-recovery of the nanocomposite hydrogels at (a) 25 °C and (b) 30 °C, respectively. | ||
The injectability of the gels was demonstrated by capturing images while loading the sample into a 5 ml syringe with a needle shown in Fig. 15. The samples are gels at elevated temperatures (>26 °C), but they are liquid at a lower temperature (<20 °C). Loading the hydrogels in liquid form is more accessible than in gel form. Therefore, all the samples were kept in an ice bath to make them liquid. Then the samples were loaded inside the syringe and kept at an elevated temperature of 30 °C. The gels were injected by applying manual shear. Both the 20% PF127 hydrogel and its composite system with 0.4% NRs show good injectability. However, the composite hydrogels show enhanced injectability. One can identify these by observing the structure made by both of the injected gels. PF127 gels are more fragile and formed a discontinuous structure (Fig. 15(a and c)), but the composite system formed a smoother structure (Fig. 15(b and d)). This agrees with the experimental data discussed in Fig. 8(d). In Fig. 8(d), the critical strain value for PF127 is 2.151%, and for the composite system of 0.4% NRs with PF127 is 3.158%, and a higher critical strain value of the composite gels confirms the system as less fragile than PF127 alone.
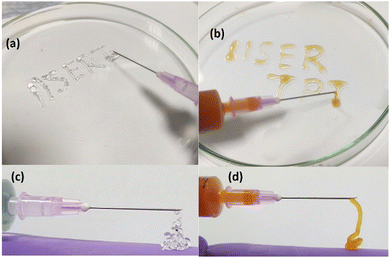 | ||
| Fig. 15 Injectability demonstration of (a) and (c) 20% PF127 and (b) and (d) composite hydrogels with 0.4% loading of NRs in 20% PF127 at 30 °C. | ||
Conclusions
We designed novel thermoresponsive hydrogels with the combination of magnetic nanoparticles (β-FeOOH NRs) and PF127 in order to develop simple, cost-effective, and biocompatible hydrogels with multiple stimuli-responsive characteristics. For the first time, β-FeOOH NRs are used as a primary component in a hydrogel. Nanorods are synthesized in large quantities via a simple sol–gel process and characterized using HR-TEM, EDS, XRD, FTIR, XPS, VSM, DLS, and ELS, and rheology measurements. A phase diagram is proposed based on rheological tests and visual observations. The thermoresponsive behaviour is analysed based on rheological experiments with flow curves, amplitude, frequency and temperature sweep for 20 w/v% PF127 with low concentrations (0.1–1.0 w/v%) of β-FeOOH NRs. As a function of NRs loading, we observe a novel non-monotonic behaviour for all rheological parameters (storage modulus/gel strength, yield stress, fragility, and characteristics time scale) in the 20% PF127 gel. To comprehend the phase behaviour, we proposed a physical mechanism based on the interactions of colloidal particles. Even at small concentrations, the presence of β-FeOOH NRs can modify the strength and flexibility of PF127 gels. The composite hydrogels are soft and showed enhanced injectability compared to the PF127 gels, which may find applications in industry, drug delivery, tissue engineering and pharmaceutical formulations.Conflicts of interest
There are no conflicts to declare.Acknowledgements
RKP acknowledges the Department of Science and Technology for an INSPIRE Faculty Award Grant [DST/INSPIRE/04/2016/002370] and the Core Research Grants [CRG/2020/006281, CRG/2021/004759] from SERB, Government of India. The authors acknowledge IISER Tirupati for funding and research facilities.References
-
M. Bahram, N. Mohseni, M. Moghtader, M. Bahram, N. Mohseni and M. Moghtader, An Introduction to Hydrogels and Some Recent Applications, IntechOpen, 2016 Search PubMed
.
- X. Sun, F. Yao and J. Li, J. Mater. Chem. A, 2020, 8, 18605–18623 RSC
.
- N. S. Satarkar, D. Biswal and J. Zach Hilt, Soft Matter, 2010, 6, 2364–2371 RSC
.
- P. Schexnailder and G. Schmidt, Colloid Polym. Sci., 2009, 287, 1–11 CrossRef CAS
.
- K. Haraguchi, Curr. Opin. Solid State Mater. Sci., 2007, 11, 47–54 CrossRef CAS
.
- S. K. Das, T. Parandhaman and M. Deep Dey, Green Chem., 2021, 23, 629–669 RSC
.
- E. Caló and V. V. Khutoryanskiy, Eur. Polym. J., 2015, 65, 252–267 CrossRef
.
- A. S. Hoffman, Adv. Drug Delivery Rev., 2012, 64, 18–23 CrossRef
.
- K. S. Soppimath, T. M. Aminabhavi, A. M. Dave, S. G. Kumbar and W. E. Rudzinski, Drug Dev. Ind. Pharm., 2002, 28, 957–974 CrossRef CAS PubMed
.
- P. Lavrador, M. R. Esteves, V. M. Gaspar and J. F. Mano, Adv. Funct. Mater., 2021, 2005941 CrossRef CAS
.
- L. Klouda and A. G. Mikos, Eur. J. Pharm. Biopharm., 2008, 68, 34–45 CrossRef CAS PubMed
.
- M. J. Taylor, P. Tomlins and T. S. Sahota, Gels, 2017, 3, 4 CrossRef PubMed
.
- P. Zarrintaj, J. D. Ramsey, A. Samadi, Z. Atoufi, M. K. Yazdi, M. R. Ganjali, L. M. Amirabad, E. Zangene, M. Farokhi, K. Formela, M. R. Saeb, M. Mozafari and S. Thomas, Acta Biomater., 2020, 110, 37–67 CrossRef CAS PubMed
.
- M. Asama, A. Hall, Y. Qi, B. Moreau, H. Walthier, M. Schaschwary, B. Bristow and Q. Wang, J. Biomed. Mater. Res., Part A, 2018, 106, 1448–1456 CrossRef CAS PubMed
.
- A. J. Tilley, C. J. Drummond and B. J. Boyd, J. Colloid Interface Sci., 2013, 392, 288–296 CrossRef CAS PubMed
.
- R. Wang, T. Hughes, S. Beck, S. Vakil, S. Li, P. Pantano and R. K. Draper, Nanotoxicology, 2013, 7, 1272–1281 CrossRef CAS PubMed
.
- M. Fernandez-Tarrio, F. Yañez, K. Immesoete, C. Alvarez-Lorenzo and A. Concheiro, AAPS PharmSciTech, 2008, 9, 471–479 CrossRef CAS PubMed
.
- P. L. Roberts, D. Lloyd and P. J. Marshall, Biologicals, 2009, 37, 26–31 CrossRef CAS PubMed
.
- M. Bercea, R. N. Darie, L. E. Niţă and S. Morariu, Ind. Eng. Chem. Res., 2011, 50, 4199–4206 CrossRef CAS
.
- B. Shriky, A. Kelly, M. Isreb, M. Babenko, N. Mahmoudi, S. Rogers, O. Shebanova, T. Snow and T. Gough, J. Colloid Interface Sci., 2020, 565, 119–130 CrossRef CAS PubMed
.
- K. Suman, S. Sourav and Y. M. Joshi, Phys. Fluids, 2021, 33, 073610 CrossRef CAS
.
- M. Katakam, W. R. Ravis, D. L. Golden and A. K. Banga, Int. J. Pharm., 1997, 152, 53–58 CrossRef CAS
.
- D. Cohn, A. Sosnik and A. Levy, Biomaterials, 2003, 24, 3707–3714 CrossRef CAS PubMed
.
- A. M. Deliormanlı and M. Türk, J. Inorg. Organomet. Polym., 2020, 30, 1184–1196 CrossRef
.
- P. M. Queiroz, B. R. Barrioni, J. Nuncira and M. M. Pereira, J. Mater. Sci., 2022, 57, 13027–13042 CrossRef CAS
.
- P. Petrov, M. Bozukov and C. B. Tsvetanov, J. Mater. Chem., 2005, 15, 1481–1486 RSC
.
- X. Li, E. Park, K. Hyun, L. Oktavia and M. Kwak, J. Rheology, 2018, 62, 107–120 CrossRef CAS
.
- L. Mayol, F. Quaglia, A. Borzacchiello, L. Ambrosio and M. I. L. Rotonda, Eur. J. Pharm. Biopharm., 2008, 70, 199–206 CrossRef CAS PubMed
.
- C. J. Wu, A. K. Gaharwar, B. K. Chan and G. Schmidt, Macromolecules, 2011, 44, 8215–8224 CrossRef CAS
.
- T. Baskan, D. C. Tuncaboylu and O. Okay, Polymer, 2013, 54, 2979–2987 CrossRef CAS
.
- M. Bercea, S. Morariu, L. E. Nita and R. N. Darie, Polym.-Plast. Technol. Eng., 2014, 53, 1354–1361 CrossRef CAS
.
- W. L. Hom and S. R. Bhatia, Polymer, 2017, 109, 170–175 CrossRef CAS
.
- M.-Y. Yeh, J.-Y. Zhao, Y.-R. Hsieh, J.-H. Lin, F.-Y. Chen, R. Deepan Chakravarthy, P.-C. Chung, H.-C. Lin and S.-C. Hung, RSC Adv., 2017, 7, 21252–21257 RSC
.
- M. T. Cidade, D. J. Ramos, J. Santos, H. Carrelo, N. Calero and J. P. Borges, Materials, 2019, 12, 1083 CrossRef PubMed
.
- E. Kushan and E. Senses, ACS Appl. Bio Mater., 2021, 4, 3507–3517 CrossRef CAS PubMed
.
- L. C. Gonçalves, A. B. Seabra, M. T. Pelegrino, D. R. de Araujo, J. S. Bernardes and P. S. Haddad, RSC Adv., 2017, 7, 14496–14503 RSC
.
- S.-M. Taghizadeh, A. Berenjian, M. Zare and A. Ebrahiminezhad, Processes, 2020, 8, 1128 CrossRef CAS
.
- M. O. Akharame, B. O. Fagbayigbo, O. Pereao, O. U. Oputu, D. I. Olorunfemi, O. S. Fatoki and B. O. Opeolu, J. Nanopart. Res., 2021, 23, 1–33 CrossRef
.
- F. Mohammadi, S. Amiri, E. Mirzaei and A. Gholami, J. Nanomater., 2022, 2022 Search PubMed
.
- P. More, S. N. Sangitra, H. B. Bohidar and R. K. Pujala, J. Chem. Phys., 2022, 157, 214902 CrossRef CAS PubMed
.
- J. Yue, X. Jiang and A. Yu, J. Nanopart. Res., 2011, 13, 3961–3974 CrossRef CAS
.
- L. H. Reddy, J. L. Arias, J. Nicolas and P. Couvreur, Chem. Rev., 2012, 112, 5818–5878 CrossRef CAS PubMed
.
-
R. Toy and E. Karathanasis, in Nanomaterials in Pharmacology, ed. Z.-R. Lu and S. Sakuma, Springer, New York, NY, 2016, pp. 113–136 Search PubMed
.
- M. Tadic, I. Milosevic, S. Kralj, M. L. Saboungi and L. Motte, Appl. Phys. Lett., 2015, 106, 183706 CrossRef
.
- L.-Y. Zhang, D.-S. Xue and J. Fen, J. Magn. Magn. Mater., 2006, 305, 228–232 CrossRef CAS
.
- A. Pardo, M. Gómez-Florit, S. Barbosa, P. Taboada, R. M. A. Domingues and M. E. Gomes, ACS Nano., 2021, 15, 175–209 CrossRef CAS PubMed
.
- R. K. Chandunika, V. Rajagopalan and N. K. Sahu, IET Nanobiotechnol., 2020, 14, 823–829 CrossRef PubMed
.
- A. Sinha, B. G. Cha and J. Kim, ACS Appl. Nano Mater., 2018, 1, 1940–1948 CrossRef CAS
.
- T. Sugimoto and K. Sakata, J. Colloid Interface Sci., 1992, 152, 587–590 CrossRef CAS
.
- J. M. Meijer and L. Rossi, Soft Matter, 2021, 17, 2354–2368 RSC
.
- Y. X. Yang, M. L. Liu, H. Zhu, Y. R. Chen, G. J. Mu, X. N. Liu and Y. Q. Jia, J. Magn. Magn. Mater., 2008, 320, L132–L136 CrossRef CAS
.
- S. Goñi-Elizalde, M. E. Garcia-Clavel and M. I. Tejedor-Tejedor, Reactivity Solids, 1987, 3, 139–154 CrossRef
.
- E. Murad and J. L. Bishop, Am. Mineral., 2000, 85, 716–721 CrossRef CAS
.
- M. Nagalakshmaiah, F. Pignon, N. E. Kissi and A. Dufresne, RSC Adv., 2016, 6, 66224–66232 RSC
.
- M. Gonzales and K. M. Krishnan, J. Magn. Magn. Mater., 2007, 311, 59–62 CrossRef CAS
.
- W. Ma, Y. Zhang, Y. Li, Y. Wang, R. Sun, Y. Wu and C. Han, J. Nanopart. Res., 2021, 23, 19 CrossRef CAS
.
- C. Lyu, L. Ju, X. Yang, L. Song and N. Liu, J. Mater. Sci.: Mater. Electron., 2020, 31, 4797–4807 CrossRef
.
- P. J. McCauley, S. Kumar and M. A. Calabrese, Langmuir, 2021, 37, 11676–11687 CrossRef CAS PubMed
.
- P. Bahadur, K. Pandya, M. Almgren, P. Li and P. Stilbs, Colloid Polym. Sci., 1993, 271, 657–667 CrossRef CAS
.
- Q. Beuguel, J. R. Tavares, P. J. Carreau and M.-C. Heuzey, J. Rheology, 2018, 62, 607–618 CrossRef CAS
.
-
T. Mezger, The Rheology Handbook: For users of rotational and oscillatory rheometers, European Coatings, 2020 Search PubMed
.
- J.-C. Majesté, C. Carrot, B. Olalla and R. Fulchiron, Macromol. Theory Simul., 2012, 21, 113–119 CrossRef
.
- Y. M. Joshi and G. Petekidis, Rheol. Acta, 2018, 57, 521–549 CrossRef CAS
.
- R. T. Bonnecaze and J. F. Brady, J. Rheology, 1992, 36, 73–115 CrossRef CAS
.
- D. Bonn, M. M. Denn, L. Berthier, T. Divoux and S. Manneville, Rev. Mod. Phys., 2017, 89, 035005 CrossRef
.
- H. Ramli, N. F. A. Zainal, M. Hess and C. H. Chan, Chem. Teacher Int., 2022, 4, 307–326 CrossRef
.
- J. M. Zuidema, C. J. Rivet, R. J. Gilbert and F. A. Morrison, J. Biomed. Mater. Res., Part B, 2014, 102, 1063–1073 CrossRef PubMed
.
- N. Seetapan, P. Bejrapha, W. Srinuanchai and U. R. Ruktanonchai, Micron, 2010, 41, 51–58 CrossRef CAS PubMed
.
- E. B. Jørgensen, S. Hvidt, W. Brown and K. Schillén, Macromolecules, 1997, 30, 2355–2364 CrossRef
.
-
R. G. Larson, The structure and rheology of complex fluids, Oxford University Press, 1999, p. 15 Search PubMed
.
- S. K. Agrawal, N. Sanabria-DeLong, G. N. Tew and S. R. Bhatia, Langmuir, 2008, 24, 13148–13154 CrossRef CAS PubMed
.
- M. K. Jaiswal, J. R. Xavier, J. K. Carrow, P. Desai, D. Alge and A. K. Gaharwar, ACS Nano, 2016, 10, 246–256 CrossRef CAS PubMed
.
- F. Sciortino, P. Tartaglia and E. Zaccarelli, J. Phys. Chem. B, 2005, 109, 21942–21953 CrossRef CAS PubMed
.
- T. B. J. Blijdenstein, A. J. M. van Winden, T. van Vliet, E. van der Linden and G. A. van Aken, Colloids Surf., A, 2004, 245, 41–48 CrossRef CAS
.
- J. B. Hooper and K. S. Schweizer, Macromolecules, 2006, 39, 5133–5142 CrossRef CAS
.
- V. I. Irzhak, Colloid J., 2021, 83, 64–69 CrossRef CAS
.
- R. Jadrich and K. S. Schweizer, J. Chem. Phys., 2011, 135, 234902 CrossRef PubMed
.
- Q. Chen, S. Gong, J. Moll, D. Zhao, S. K. Kumar and R. H. Colby, ACS Macro Lett., 2015, 4, 398–402 CrossRef CAS PubMed
.
- Y. Pang, J. Liu, Z. L. Moussa, J. E. Collins, S. McDonnell, A. M. Hayward, K. Jajoo, R. Langer and G. Traverso, Adv. Sci., 2019, 6, 1901041 CrossRef CAS PubMed
.
- G. Stojkov, Z. Niyazov, F. Picchioni and R. K. Bose, Gels, 2021, 7, 255 CrossRef CAS PubMed
.
- K. Phogat and S. Bandyopadhyay-Ghosh, Cellulose, 2018, 25, 5821–5830 CrossRef CAS
.
Footnote |
| † Electronic supplementary information (ESI) available. See DOI: https://doi.org/10.1039/d3sm00451a |
| This journal is © The Royal Society of Chemistry 2023 |

