 Open Access Article
Aqueous phase hydrogenolysis of glycerol with in situ generated hydrogen over Ni/Al3Fe1 catalyst: effect of the calcination temperature
Raquel Raso ,
Alejandro Lete
 ,
Lucía García
 *,
Joaquín Ruiz
 ,
Miriam Oliva
 and
Jesús Arauzo
Thermochemical Processes Group (GPT), Aragon Institute of Engineering Research (I3A), Universidad de Zaragoza, Mariano Esquillor S/N, 50018 Zaragoza, Spain. E-mail: luciag@unizar.es
First published on 14th February 2023
Abstract
The present work studied the influence of the calcination temperature on the aqueous phase hydrogenolysis of glycerol with in situ generated hydrogen over a Ni/Al3Fe1 catalyst. The Ni/Al3Fe1 catalyst was synthesized by the co-precipitation method at 28 mol% of Ni (Ni/(Ni + Al + Fe)) and a molar ratio of Al/Fe of 3/1. The prepared catalyst was calcined at different temperatures (500–750 °C). The obtained samples were tested for the aqueous phase hydrogenolysis (APH) of glycerol and characterized by several analytical techniques (ICP-OES, H2-TPR, XRD, N2-physisorption, NH3-TPD, STEM, FESEM, and TGA). The catalyst calcined at 625 °C was selected as the best sample due to its high acidity, metal dispersion, and catalytic activity; 1,2-propanediol was the highest carbon selectivity product. In addition, it experienced lower metal leaching than the catalyst calcined at 500 °C.
Introduction
In recent decades, the consumption of fossil fuels has risen rapidly, resulting in an environmental crisis. The transport sector accounts for around 60% of global oil consumption and generates one-fifth of global CO2 emissions.1 The global atmospheric CO2 concentration has increased in the last two decades from 369.38 ppm (2000) to 417.53 ppm (2022).2 Therefore, developing sustainable and clean sources of combustibles is essential. In this context, biodiesel has become one of the most common worldwide biofuels.1,2 Global biodiesel production soared from 36 billion liters in 2017 to 46.5 billion liters in 2020.3 Biodiesel is mainly produced by the transesterification of triglycerides (animal fats, vegetable oils, and waste oils) using ethanol or methanol in the presence of a catalyst. However, for every 10 tons of biodiesel produced, around 1 ton of glycerol is generated as a by-product which can negatively affect its production costs.4–6 Many works have been published on converting glycerol into value-added products, such as H2 or 1,2-propanediol (1,2-PDO), to valorize the glycerol and improve the economics of biodiesel production.7–9Among the various methods for glycerol conversion into valuable products, hydrogenolysis deserves special attention. Hydrogenolysis is a kind of reduction with hydrogen participation that allows obtaining products of industrial interest, such as 1,3-propanediol, 1,2-PDO, 1-propanol, 2-propanol, and ethylene glycol. In the work of Nakagawa and Tomishige,10 heterogeneous catalysts (noble and non-noble metal) for glycerol hydrogenolysis were reviewed, and mainly 1,2-PDO was produced.
The conversion of glycerol to 1,2-PDO emerges as an attractive alternative because the 1,2-PDO market can absorb large quantities of glycerol.11 In this case, the aqueous phase hydrogenolysis (APH) of glycerol to 1,2-PDO can be carried out without external hydrogen addition. In this process, hydrogen is generated in situ from glycerol reforming, making it safer and less expensive than conventional glycerol hydrogenolysis. Traditional hydrogenolysis of glycerol in the liquid phase requires H2 feeding. APH without external hydrogen addition is a catalytic process carried out at moderate pressures of around 34 bar and relatively low temperatures of around 227 °C, obtaining gas and liquid products from a renewable feedstock.12
Nickel-based catalysts are attractive materials for use in the APH of glycerol because of their accessibility, high reactivity, low price, and high activity for producing H2, which is an advantage for the hydrogenation reaction. They can break the C–C bond efficiently towards ethylene glycol production. The use of hydrogen generated in situ from glycerol reforming makes hydrogenolysis a more “green” process since hydrogen is usually derived from fossil fuels.13–15
Most of the works published in the literature related to glycerol hydrogenolysis without external hydrogen use batch reactors (discontinuous feeding).16–20 Few studies have reported continuous operations that could be useful due to their more significant production potential on an industrial scale.12
Some works, such as those of Cai et al.21 and Freitas et al.,13 studied the APH of glycerol with and without the addition of external hydrogen in a fixed-bed reactor using bimetallic Ni/Cu catalysts. Freitas et al.13 found that the bimetallic Ni–Cu catalysts (CuNi/Al2O3 and CuNi/ZSM-5) showed the highest glycerol conversion with a 1,2-PDO yield of around 25% without external hydrogen addition. They also concluded that the presence of Ni is significant for glycerol reforming, obtaining in situ H2 that is used to generate 1,2-PDO from acetol hydrogenation. Cai et al.21 proposed the same reaction pathway for glycerol hydrogenolysis with and without external hydrogen addition on Ni/Cu/TiO2 catalysts which included the dehydration of glycerol to produce acetol and the hydrogenation of acetol to achieve 1,2-PDO.
More recently, Mendonça et al.22 studied the effect of MgO addition to Cu–Ni/Al2O3 catalysts on glycerol hydrogenolysis in a continuous reactor without external hydrogen addition. They observed the highest selectivity to 1,2-PDO of about 50% with the Cu–Ni/30 wt% MgO–Al2O3 catalyst after 6 h of reaction.
Our previous study12 demonstrated that mixed-oxide catalysts (Ni/AlxFey) showed a better catalyst performance than Ni/Al and Ni/Fe catalysts, the Ni/Al3Fe1 catalyst being the best for the APH of glycerol in a continuous system without external hydrogen addition. A liquid carbon product selectivity to 1,2-PDO of around 71% was obtained. Besides this, the Ni/Al3Fe1 catalyst presented excellent activity for at least 9 h of reaction.23
The stability of the catalysts in aqueous processes under pressure, such as aqueous phase reforming (APR) and APH, is relevant for industrial use. The Ni/Al3Fe1 catalyst calcined at 500 °C and tested at 227 °C, and 34 absolute bar in the APH of glycerol showed boehmite formation and metal leaching.12,23 The novelty of the present work is investigating the effects of the calcination temperature on the properties and catalytic activity of the Ni/Al3Fe1 catalyst for the APH of glycerol without external hydrogen addition. For this purpose, the coprecipitated Ni/Al3Fe1 catalyst was calcined at different temperatures (500–750 °C). The Ni/Al3Fe1 catalyst has the benefits of low cost, being a non-noble metal with high selectivity to 1,2-PDO, and stability for the APH of glycerol.12,23
Calcination is a relevant step in the preparation of the catalysts. The final calcination temperature influences their physicochemical properties, such as the surface area and crystallinity, affecting the catalytic performance. Moreover, the activation temperature of the catalysts determines their active metal phase, which is a key factor in catalytic activity.
As some examples, Bian et al.24 studied the effect of the calcination temperature on the dry reforming of CH4 over Ni-based catalysts. They found the highest activity at an intermediate calcination temperature. They concluded that the formation of NiAl2O4 spinel was beneficial to the activity and stability. Similar tendencies were obtained by Barzegari et al.25 in the dry reforming of propane. They found that the calcined sample at 600 °C displayed the best catalytic performance with the highest Ni dispersion and surface area combined with sufficient basicity.
Ozdemir et al.26 showed that for catalyst systems where there is no interaction between metal oxide components and the support, calcination at high temperatures is beneficial for obtaining catalysts with an excellent dispersion if spinel or solid solution formation occurs during the catalyst preparation. In addition, calcination at low temperatures is helpful to prevent NiO sintering. Thus, lower Ni particles and better dispersion are obtained after reduction. But these phenomena are unclear for catalyst systems in which there is an interaction between their components.
To the best of our knowledge, there are few studies about the influence of the calcination temperature on the catalyst employed, such as ZnPd/ZnO–3Al, Os/bentonite, and Cu–Fe in glycerol hydrogenolysis to 1,2-PDO,27–29 and the effect on the Ni/Al3Fe1 catalyst has not been previously studied.
The Ni/Al3Fe1 catalyst is a promising catalyst for the APH of glycerol. Studying its calcination temperature is relevant to optimizing the catalyst preparation conditions that could improve its catalytic performance. For these purposes, APH of glycerol without external hydrogen addition experiments were carried out in a continuous installation, and the catalysts were characterized before and after the reaction.
Experimental
Catalyst preparation and characterization
Ni/Al3Fe1 catalyst was prepared by the co-precipitation method at a 28 mol% of Ni (Ni/(Ni + Al + Fe)) and a molar ratio of Al/Fe of 3/1. The catalyst was calcined at different temperatures (500–750 °C, denoted as Ni/Al3Fe1-X, X being the calcination temperature in °C) for 3 h in order to study the influence of the calcination temperature on the APH of glycerol. Moreover, it was characterized by many techniques: inductively coupled plasma optical emission spectrometry (ICP-OES), hydrogen temperature-programmed reduction (H2-TPR), X-ray diffraction (XRD), temperature-programmed desorption of ammonia (NH3-TPD), thermogravimetric analysis (TGA), N2-physisorption, scanning transmission electron microscopy (STEM), and field emission scanning electron microscopy (FESEM). The detailed procedures for the catalyst preparation and characterization are described in our previous work.12Catalyst performance
Catalytic performance was examined in a continuous system (Process Integral Development Eng & Tech, Spain) which mainly consisted of a stainless-steel fixed bed reactor with an inner diameter of 9 mm, and a micrometric valve that regulated the pressure system. The fixed bed was composed of a mixture of catalyst (2 g) and sand (5 g), and their mesh sizes were 160–315 μm. It was placed on a tubular reactor and covered with quartz wool supports. Before the catalytic test, the catalysts were reduced, according to the H2-TPR results.A solution of 10 wt% glycerol (Sigma-Aldrich, purity: 99.5%) in deionized water was pumped into the reactor at 1 mL min−1. The reaction occurred at 227 °C and 34 absolute bar for 3 h. Gas and liquid products were obtained during the APH of glycerol under these operating conditions. The products leaving the reactor were depressurized using the micrometric valve and arrived at the condensation system, where the liquid products were collected. The exit gas mixture: N2, C2H6, CH4, H2, CO, CO2, and C3H8, where N2 was used as an internal standard, was analyzed online using an Agilent 490 Micro-GC equipped with Thermal Conductivity Detectors (TCD). The liquid products consisted mainly of methanol (MeOH), acetol, ethanol (EtOH), acetic acid, ethylene glycol (EG), 1,2-propanediol (1,2-PDO), and non-reacted glycerol. They were examined offline using an Agilent 7820A GC equipped with a Flame Ionization Detector (FID) and an HP-FFAP Agilent 19091F-105 capillary column. 1-Butanol (PanReac, purity: 99.5%) was used as an internal standard. Besides, the liquid products were submitted to an inductively coupled plasma optical emission spectrometry (ICP-OES) analysis to examine the possibility of metal leaching. More details of the experimental system were described in our earlier studies.12,23 The catalytic performance (glycerol conversion, carbon yield to gases and liquids) was calculated as follows, according to the expressions cited in our previous studies:12,23
where ni are the total moles of the i product (i = liquid or gas).
The carbon selectivity to products (gases and liquids) was defined as the percentage ratio of carbon in a product ‘i’ to the total carbon in all the analyzed products (gases and liquids), excluding the unreacted glycerol.
Due to errors in analyzing and collecting the samples, there was no complete coincidence between the glycerol conversion and the addition of the carbon yield to products (gas and liquid). As reported by other authors,12,17,30 an experiment with a value of carbon deficit below 15% was considered a reliable test. The carbon deficit was defined as follows:
| Carbon deficit = glycerol conversion − (carbon yield to gases + carbon yield to liquids) |
Results and discussion
Catalytic performance experiments
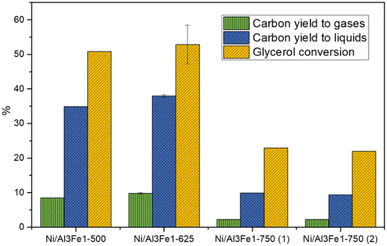
Glycerol conversion, carbon yield to gases, and carbon yield to liquids are shown in Fig. 1. More carbon yield to liquid than carbon yield to gas was obtained for all samples; therefore, the operating conditions favored liquid production.12,30 There were slight differences between the Ni/Al3Fe1-500 and the Ni/Al3Fe1-625 catalysts, calcined at 500 °C and 625 °C, respectively. However, the Ni/Al3Fe1 catalyst calcined at 750 °C showed the worst catalytic activity. For example, the carbon yield to liquids was around 38% for the Ni/Al3Fe1-625 catalyst, while for the catalysts calcined at 750 °C (Ni/Al3Fe1-750 (1) and Ni/Al3Fe1-750 (2)), it was about 10%.Prior to the catalytic test, the Ni/Al3Fe1-500 and Ni/Al3Fe1-625 catalysts were reduced at 500 °C, but the Ni/Al3Fe1-750 was activated at 650 °C (Ni/Al3Fe1-750 (1)), according to the H2-TPR results. Due to the low catalytic performance of the catalyst calcined at 750 °C and reduced at 650 °C, this catalyst was also reduced at 725 °C (Ni/Al3Fe1-750 (2)) in order to improve its performance. However, there was no improvement obtained in their catalytic performance.
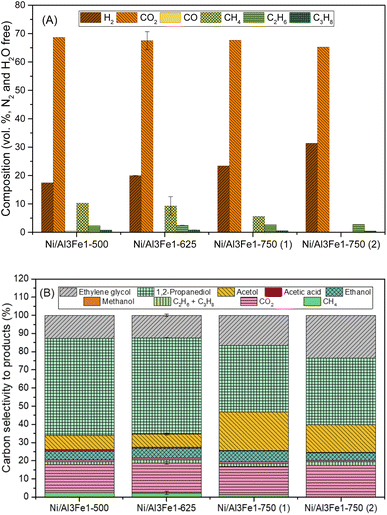
Fig. 2(A) displays the gas compositions (vol%, N2, and H2O free). The exit gas was composed mainly of CO2 and H2 and low amounts of CH4, C2H6, and C3H8. The low content of CO is expected due to the water–gas shift (WGS) reaction being carried out at a low temperature.
The content of H2 in the gas stream was boosted by increasing the calcination temperature, while the CO2 was almost unchanged. In addition, the alkanes (CH4, C2H6, and C3H8) were diminished, and CO was practically not found.
For the Ni/Al3Fe1 catalyst calcined at 750 °C, boosting the reduction temperature from 650 (Ni/Al3Fe1-750 (1)) to 725 °C (Ni/Al3Fe1-750 (2)) favored the decrease in the content of CO2 and alkanes but increased that of H2.
Fig. 2(B) shows the carbon selectivity to products for the catalysts tested, including gas and liquid products. All catalysts presented around 20% and 80% of converted carbon in gas and liquid products, respectively. The gas product with the highest carbon selectivity was CO2. This was about 16% and almost unchanged with the calcination temperature. Meanwhile, the alkanes (CH4, C2H6, and CH3H8) decreased, and CO was practically not found.
The major liquid products were 1,2-PDO, acetol, and ethylene glycol. 1,2-PDO was the product with the highest carbon selectivity among liquid and gas products, with values up to 53%. Garcia et al.30 observed that when, for example, the APR of glycerol over Ni/Al catalyst occurred under the same operating conditions (34 bar, 10 wt% glycerol, and 227 °C), 1,2-PDO was the product with the highest carbon selectivity to liquid and gas products, with values around 37%. Roy et al.17 also reported that 1,2-PDO was the product with the highest carbon selectivity, with values up to 53% obtained from the APH of glycerol over an admixture of 5% wt. Ru/Al2O3 and 5 wt% Pt/Al2O3 catalysts.
The carbon selectivity to 1,2-PDO, acetol and ethylene glycol did not change from Ni/Al3Fe1-500 to Ni/Al3Fe1-625. However, at a calcination temperature of 750 °C (Ni/Al3Fe1-750 (1)), the carbon selectivity to acetol and ethylene glycol increased, while the 1,2-PDO decreased. Meanwhile, increasing the reduction temperature for the Ni/Al3Fe1 catalyst calcined at 750 °C from 650 (Ni/Al3Fe1-750 (1)) to 725 °C (Ni/Al3Fe1-750 (2)) boosted ethylene glycol production, whereas the acetol was reduced, and the 1,2-PDO was unaffected.
Considering the products obtained from the APH of glycerol without external H2 addition and some references from the literature,23,30–32 a proposed reaction mechanism is suggested in this work. The reaction network includes gas and liquid products.
In the gas phase, H2 and CO are mainly obtained by the reforming reactions of glycerol and liquid intermediates (eqn (1)) as well as by decarbonylation reactions that release CO. Then CO is converted into CO2 and H2 by the WGS reaction (eqn (2)). CH4 is produced by the methanation reactions of CO and CO2 (eqn (3)–(5)). In addition, Fischer–Tropsch reactions can explain the presence of C2H6 and C3H8.30,31,33
| CnHmOk + (n − k)H2O ↔ nCO + (n + m/2 − k)H2 | (1) |
WGS reaction:
| CO + H2O ↔ CO2 + H2 | (2) |
Methanation reactions:
| CO2 + 4H2 ↔ CH4 + 2H2O | (3) |
| CO + 3H2 ↔ CH4 + H2O | (4) |
| 2CO + 2H2 ↔ CH4 + CO2 | (5) |
There are two main paths in the liquid phase:
In path I, glycerol is dehydrated into acetol, which is assumed to occur preferentially in acid sites. Subsequently, the hydrogenation of acetol produces 1,2-PDO using the H2 generated in situ, which is expected to occur in metal sites (eqn (6)).13,31,32,34
In path II, glycerol is dehydrogenated to glyceraldehyde, whose further decarbonylation generates ethylene glycol (eqn (7)). Then, the dehydration and hydrogenation of ethylene glycol can produce ethanol. Besides, methanol is obtained by decarbonylation and dehydrogenation of ethylene glycol. Ethylene glycol can be dehydrated to form acetaldehyde. Acetaldehyde can be transformed into acetic acid. In addition, acetaldehyde can be hydrogenated to create also ethanol, which can be converted into this intermediate again by dehydrogenation.17,23,30–33,35 It is worth noting that the reaction path to the formation of methanol can make glycerol produce more H2.31,32
The experimental results indicated that using these catalysts and operating conditions, the main route is path I due to the high carbon selectivity to 1,2-PDO and acetol.
It is well known that the Ni active sites favor C–C bond cleavage and the WGS reaction. Furthermore, Ni exhibits activity for hydrogenation/dehydrogenation reactions.30
 | (6) |
 | (7) |
The catalysts calcined at low temperatures of 500 and 625 °C (Ni/Al3Fe1-500 and Ni/Al3Fe1-625, respectively) favored the dehydration reactions, which are assumed to occur in acid sites, and the hydrogenation reactions that take place in metal sites (path I). Thus, the carbon selectivity to 1,2-PDO and acetol together was around 60%, while the carbon selectivity to ethylene glycol was 12% for the Ni/Al3Fe1-625. In the APH of glycerol without external hydrogen addition, the catalyst must promote the dehydration of glycerol in acid sites to form acetol and simultaneously the reforming reaction for hydrogen production, which is required to generate 1,2-PDO by hydrogenation of acetol in metal sites.13 Moreover, path II also takes place and explains ethylene glycol production. A clear trend could be observed by which an increase in the calcination temperature to 750 °C enhanced the dehydrogenation/decarbonylation reactions, promoting the formation of H2, which requires metal sites (path II). In addition, the increase in the reduction temperature from 650 (Ni/Al3Fe1-750 (1)) to 725 °C (Ni/Al3Fe1-750 (2)) for the Ni/Al3Fe1 catalyst calcined at 750 °C encouraged the conversion of glycerol into dehydrogenation and decarbonylation products, increasing the selectivity to ethylene glycol and H2. Thus, the carbon selectivity to 1,2-PDO and acetol together was 58% and 52% for the Ni/Al3Fe1-750 (1) and Ni/Al3Fe1-750 (2) catalysts, respectively, while the carbon selectivity to ethylene glycol was 17% and 24%, respectively.
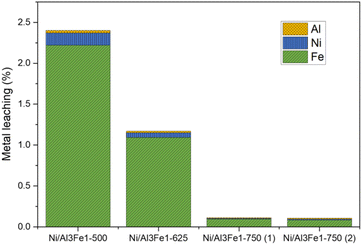
Furthermore, the liquid products were submitted to ICP-OES analysis to examine the possibility of metal leaching. The Al, Ni, and Fe amounts detected in the liquid product are shown in Fig. 3. The metal leaching could be due to the dissolved CO2 and/or soluble oxygenated compounds generated in the APH reaction of glycerol, such as acetic acid, which produces an acid medium.35–37
The metal leached to a lesser extent with an increase in the calcination temperature from 500 to 750 °C. Fe was the most leached and Al the least. The metal leaching was reduced by almost half from the Ni/Al3Fe1-500 to the Ni/Al3Fe1-625. Increasing the calcination temperature from 500 °C to 750 °C favored the excellent stability of the catalyst resulting in a smaller loss of its metals. The pH values of the collected liquid products were 4.0 and 4.4 for the catalysts calcined at 500 °C and 625 °C, respectively, and 5.6 and 5.5 for the catalysts calcined at 750 °C: Ni/Al3Fe1-750 (1) and Ni/Al3Fe1-750 (2), respectively. The results corroborate that the highest acidity of liquid products increased the metal leaching. Moreover, the acetic acid generated in the reaction was calculated, and the values were 4.1 mmol acetic acid/mol glycerol fed using the catalyst calcined at 500 °C; 3.6, 0.6, and 0.5 mmol acetic acid/mol glycerol fed using the catalysts Ni/Al3Fe1-625, Ni/Al3Fe1-750 (1) and Ni/Al3Fe1-750 (2), respectively. These data were in accordance with the pH values of the collected liquid products and demonstrated the effect of acetic acid in the acid medium.
Wu et al.32 stated that acidic conditions boost the solubility of active metals in water, in agreement with the metal leaching results. The amount of metal leaching did not affect the catalytic activity of the samples under the operating conditions, as also reported by Raso et al.23 However, a very high time-on-stream could influence the catalytic activity. It is better to develop a catalyst with low metal leaching.
It is well known that Ni catalysts supported on Al2O3 are often unstable and suffer changes in their structure during the APR of glycerol, causing deactivation by metal leaching, metal particles sintering, and so on.14,36 Cai et al.21 showed that the Ni/Cu catalyst suffered more deactivation by metal particles sintering and metal leaching when the glycerol hydrogenolysis was performed using water than 2-propanol as a solvent. However, the presence of Fe in catalysts helps to improve their stability and delays the deactivation of the Ni-based catalyst.22,36
In conclusion, the Ni/Al3Fe1-625 catalyst presented the best performance for the APH of glycerol due to its high catalytic activity towards dehydration/hydrogenation products and its lower degree of metal leaching than the Ni/Al3Fe1-500 catalyst under the same operating conditions.
Catalyst characterization
The textural properties of the Ni/Al3Fe1 catalyst calcined at different temperatures are shown in Table 1. Fig. 4(A) and (B) show the N2 adsorption–desorption of the calcined and used samples, respectively, and Fig. 4(C) and (D) display the pore size distribution of the calcined and used samples, respectively. According to the IUPAC classification, the fresh and spent catalysts exhibited a type IV isotherm with a hysteresis loop (type H2) which occurred after P/Po = 0.4. This is characteristic of mesoporous materials with interconnected pores of different sizes and shapes.38 Boosting the calcination temperature decreased the surface area (SBET) from 233 m2 g−1 at 500 °C to 82 m2 g−1 at 750 °C. It was 199 m2 g−1 at 625 °C. The average pore diameter (dp) increased, but the pore volume (Vp) had a maximum of 625 °C. In addition, it is observed that while the surface area and pore volume decreased after using the catalysts, the pore diameter increased. This trend could be because the samples suffered from pore plugging, which would have reduced their pore volume.14
| Sample | Calcined samples | Spent samples | ||||||
|---|---|---|---|---|---|---|---|---|
| SBETa (m2 g−1) | Vpb (cm3 g−1) | dpb (nm) | SBETa (m2 g−1) | Vpb (cm3 g−1) | dpb (nm) | Dboehmitec (nm) | DFeNi3c (nm) | |
| a The Brunauer, Emmett, and Teller (BET) method.b Barrett–Joyner–Halenda (BJH) adsorption method.c Boehmite and FeNi3 crystallite sizes calculated from the Scherrer equation.d Value corresponding to the Ni/Al3Fe1 catalysts calcined at 750 °C: reduced at 650 (1) and 725 °C (2). | ||||||||
| Ni/Al3Fe1-500 | 233 | 0.158 | 3.31 | 197 | 0.150 | 3.71 | 13 | 8 |
| Ni/Al3Fe1-625 | 199 | 0.174 | 3.93 | 185 | 0.145 | 4.44 | 19 | 7 |
| Ni/Al3Fe1-750 (1) | 82d | 0.145d | 7.41d | 56 | 0.126 | 13.10 | 15 | 11 |
| Ni/Al3Fe1-750 (2) | 42 | 0.136 | 18.70 | 20 | ||||
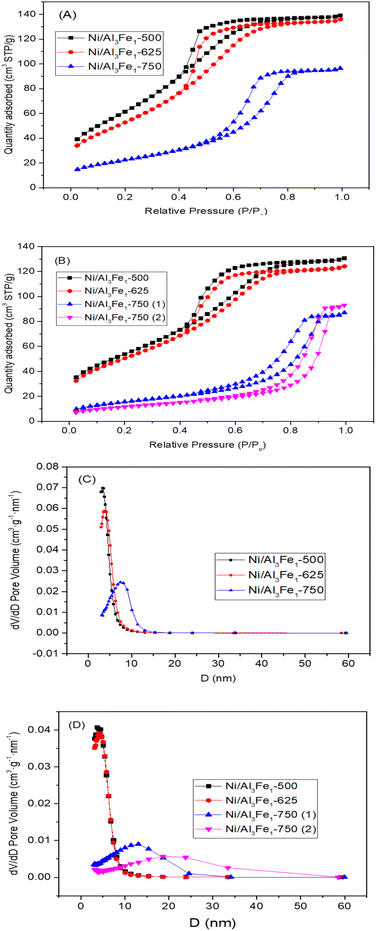 | ||
| Fig. 4 N2 adsorption–desorption isotherms of the calcined (A) and spent (B) samples. Pore size distribution of the calcined (C) and spent (D) samples. | ||
A decrease in the SBET was observed after using the samples. The catalysts calcined at 500 °C (Ni/Al3Fe1-500) and 625 °C (Ni/Al3Fe1-625) showed a slight decline in the SBET and high catalytic activity. However, the Ni/Al3Fe1 catalysts calcined at 750 °C (Ni/Al3Fe1-750 (1) and Ni/Al3Fe1-750 (2)) demonstrated the highest decrease in the SBET and the worst catalytic performance.
 | ||
| Fig. 5 XRD patterns of the calcined (A) and used (B) samples. TGA curves of the used samples (C). Step I: physisorbed water and step II: chemisorbed water and boehmite transformation. | ||
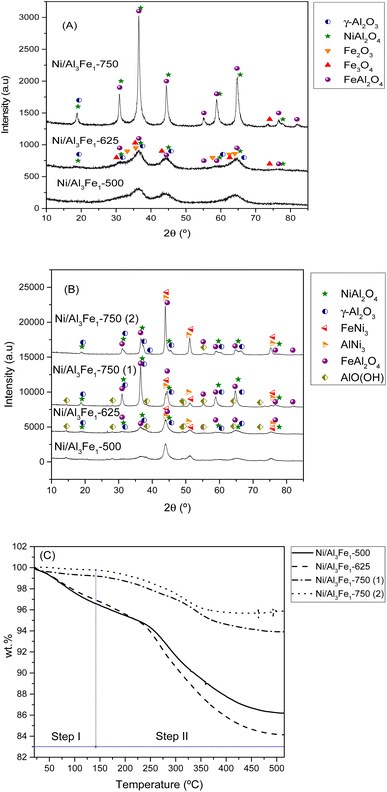
It can be observed that increasing the calcination temperature, especially from 625 to 750 °C, leads to the Ni/Al3Fe1 catalyst having a more crystalline structure. A similar trend was found in the case of the ZnO–3Al catalyst, reported by Li et al.27 The intensity peaks of the NiAl2O4 and FeAl2O4 increased as the calcination temperature rose in the Ni/Al3Fe1 catalyst. Bian et al.24 reported that a high calcination temperature favored the crystal size growth.
Fig. 5(B) displays the XRD patterns of the spent samples. Our previous works12,23 found that the phases presented in the reduced and spent catalysts were very similar except for the boehmite (AlO(OH), JCPDS 01-074-18795). For this reason, the XRD of the reduced samples is not shown in the present work. Raso et al.23 found that the AlO(OH) was formed before the APH reaction and that its formation occurred during the stabilization of the system with water for the reaction. The AlO(OH) phase is formed due to the reaction between Al2O3 and H2O.13,14,23
The principal diffraction peaks of both the FeNi3 (JCPDS 03-065-3244) and AlNi3 (JCPDS 00-050-1265) could be observed in all the samples due to their similar patterns.12 Besides, the NiAl2O4, and FeAl2O4 phases were still observed due to their partial reducibility. These require a high temperature to achieve complete reduction.41,42 However, Fe3O4 and Fe2O3 disappeared due to their total reducibility after the reduction treatment.
Increasing the reduction temperature for the Ni/Al3Fe1-750 catalyst from 650 °C (Ni/Al3Fe1-750 (1)) to 725 °C (Ni/Al3Fe1-750 (2)) favored the reduction of the spinels (NiAl2O4 and FeAl2O4), obtaining small peaks. This means the Ni and Fe components are well combined with the Al2O3 support ingredient during the calcination step.41 In addition, the intensity of the characteristic peaks of FeNi3 and AlNi3 was boosted with a rise in the reduction temperature. The estimated mean FeNi3 crystallite sizes are shown in Table 1. Increasing the calcination temperature from 500 to 625 °C decreased the FeNi3 crystallite size slightly from 8 to 7 nm, enhancing the dispersion from 12.1 to 13.9%. The dispersion was calculated using the equation D = 97.1/d (nm).43 However, a further increase in calcination temperature to 750 °C caused a decrease in the FeNi3 dispersion to 8.8% due to active metal sintering during the activation process.25 In addition, the FeNi3 crystallite size increased from 11 to 20 nm when the Ni/Al3Fe1-750 catalyst was reduced at high temperature (725 °C), and consequently, FeNi3 dispersion diminished from 8.8 to 4.9%.
Additionally, raising the calcination and reduction temperature favored decreasing the AlO(OH) phases. The approximate AlO(OH) crystallite size was 13 to 19 nm (Table 1). The presence of metal particles retards the transformation of γ-Al2O3 into AlO(OH) under hydrothermal conditions.13 The FeNi3 and AlO(OH) crystallite sizes were calculated using the Scherrer equation44 for the characteristic diffraction peaks of FeNi3 at 2θ = 44.3°, 51.6°, and 75.9° and the main peak of AlO(OH) at 2θ = 14.5°.
According to a report by Doukkali et al.,14 calcination treatments at high temperatures strengthen the Al–O bonds of γ-Al2O3 to minimize its interaction with the H2O in the reaction medium, maintain the stability of the mesoporous structure and texture of the γ-Al2O3 support, and control the aggregation of Ni particles, providing higher hydrothermal stability of the catalyst in its subsequent use.
In addition, the spent samples were studied using the TGA technique in the N2 atmosphere to quantify the boehmite formation. Fig. 5(C) shows the TGA curves of the used samples. The catalysts calcined at 500 °C and 625 °C presented higher values of total weight loss than the catalysts calcined at 750 °C. The TGA results were in good agreement with the XRD results. The weight loss is directly related to the release of adsorbed water and the transformation of boehmite (AlO(OH)) into Al2O3.45 Furthermore, the boehmite formation was estimated considering the weight loss in the temperature range of 140 °C to 515 °C, which corresponded to the chemisorbed water and boehmite transformation step in the catalyst (step II). The % weight loss in step II for each sample was 10.4% for the Ni/Al3Fe1-500 catalyst, 12.78% for the Ni/Al3Fe1-625 catalyst, 5.29% for the Ni/Al3Fe1-750 (1) catalyst, and 3.89% for the Ni/Al3Fe1-750 (2) catalyst.
Looking at the catalytic results, the Ni/Al3Fe1-625 catalyst showed the highest catalytic activity and the smallest FeNi3 crystallite size, around 7 nm, indicating a high dispersion. Increasing the calcination and reduction temperature leads to the Ni/Al3Fe1 catalyst having a more crystalline structure and an increased FeNi3 crystallite size of around 20 nm (Ni/Al3Fe1-750 (2)), indicating a low dispersion.
The higher amount of boehmite in the catalysts calcined at 500 and 625 °C than in the catalysts calcined at 750 °C does not appear to cause a negative effect on the catalytic activity. Furthermore, Wu et al.46 used the boehmite as a support for a Cu-based catalyst in the hydrogenolysis of glycerol to 1,2-PDO.
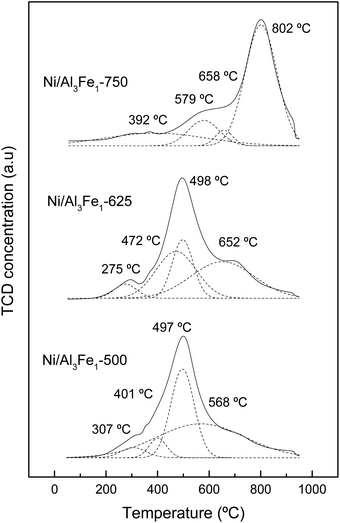
The assignation of the peaks is in accordance with the work of Meng et al.47 The peaks at low temperatures (200–440 °C) are ascribed to the reduction peak of Fe2O3 to Fe3O4 and α-NiO, the peaks at the moderate ranges (440–600 °C) are attributed to the reduction peak of Fe3O4 to Fe and β-NiO, and the peaks in the range of 550–750 °C are assigned to the reduction peak of NiAl2O4 spinel (γ-NiO). In addition, the FeAl2O4 is reduced at high temperatures.12,41
For the Ni/Al3Fe1-500 and Ni/Al3Fe1-625 catalysts, the first peaks at 307 °C and 275 °C, respectively, might be ascribed to the reduction of α-NiO species to Ni, corresponding with the easily reducible surface free nickel oxide.36 The second peaks at 401 °C and 472 °C for the Ni/Al3Fe1-500 and Ni/Al3Fe1-625, respectively, could be attributed to the reduction of Fe2O3 to Fe3O4. The next peaks at 497 °C and 498 °C for the Ni/Al3Fe1-500 and Ni/Al3Fe1-625, respectively, can be related to the reduction of β-NiO, which had a strong interaction with the support or referred to non-stoichiometric nickel aluminate (NiO–Al2O3) with weaker stability,24,47 and Fe3O4 to Fe. Finally, the last peaks at 568 °C and 652 °C for the Ni/Al3Fe1-500 and Ni/Al3Fe1-625, respectively, could be assigned to the reduction of γ-NiO, which corresponded to the reduction of the NiAl2O4 phase or Ni phases with strong interaction with the support, and of the FeAl2O4 phase.
For the Ni/Al3Fe1-750, the first peak at 392 °C could be related to the reduction of α-NiO species. The next peak at 579 °C might be assigned to the reduction of β-NiO. The third peak at 658 °C could be attributed to the reduction of Fe3O4, and the last peak at 802 °C might be ascribed to the reduction of γ-NiO and FeAl2O4.
In addition, the ratio of the different phases was calculated and shown in Table 2. Increasing the calcination temperature decreased the proportion of α-NiO phases and β-NiO phases, whereas the ratio of γ-NiO phases was boosted. This indicated that the α-NiO and β-NiO could be converted into NiAl2O4, as reported by Bian et al.24 They stated that increasing the calcination temperature favored the NiAl2O4 formation, which was beneficial for the dry reforming of methane in terms of activity and stability.
| Sample | Reduction temperature (°C)/relative contentb (%) | Total H2 consumption (mmol H2/gcat) | ||||
|---|---|---|---|---|---|---|
| α-NiO | Fe2O3 | β-NiO | Fe3O4 | γ-NiO/FeAl2O4 | ||
| a Value corresponding to a total reduction of β-NiO and Fe3O4.b Calculated from Gaussian deconvolution of H2-TPR. | ||||||
| Ni/Al3Fe1-500 | 307/5.5 | 401/7.3 | 497/41.4a | 568/45.8 | 9.25 | |
| Ni/Al3Fe1-625 | 275/4.1 | 472/25.0 | 498/27.3a | 652/43.6 | 9.21 | |
| Ni/Al3Fe1-750 | 392/3.8 | 579/16.8 | 658/5.4 | 802/74.0 | 9.45 | |
Moreover, the reduction temperature peaks moved towards higher values with the increase in the calcination temperature. For example, the reduction temperature peaks of the γ-NiO/FeAl2O4 species were boosted from 568 °C to 802 °C with the rise of the calcination temperature from 500 °C to 750 °C.
| Sample | Temperature (°C)/relative amounta (%) | Total NH3 desorption (μmol NH3/gcat) | STEMb (nm) | ||
|---|---|---|---|---|---|
| T1/F1 | T2/F2 | T3/F3 | |||
| a Calculated from Gaussian deconvolution of NH3-TPD profiles.b Mean particle size calculated from STEM results. | |||||
| Ni/Al3Fe1-500 | 194/21.4 | 289/36.9 | 536/41.8 | 777.34 | 11 |
| Ni/Al3Fe1-625 | 189/10.3 | 275/39.5 | 516/50.2 | 881.54 | 10 |
| Ni/Al3Fe1-750 (1) | 180/13.9 | 266/42.0 | 498/44.1 | 433.24 | 20 |
| Ni/Al3Fe1-750 (2) | 177/10.6 | 261/43.7 | 411/45.7 | 337.43 | 41 |
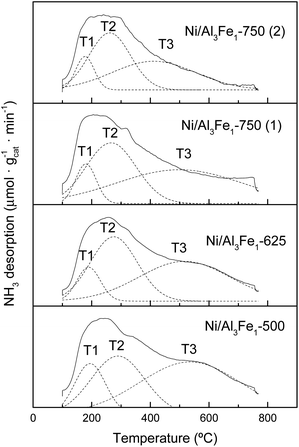
The NH3-TPD profiles of the reduced catalyst are shown in Fig. 7. Previous to the NH3-TPD analysis, the samples were reduced at the same temperature as that used to activate them before the APH reaction: 500 °C for the Ni/Al3Fe1-500 and Ni/Al3Fe1-625, 650 °C for the Ni/Al3Fe1-750 (1) and 725 °C for the Ni/Al3Fe1-750 (2). All catalysts presented three regions characteristic of the strength of the acid sites with maxima at the ranges 177–194 °C, 261–289 °C, and 411–536 °C, corresponding to weak (T1), low-moderate (T2), and strong (T3), respectively.
The proportion of the low-moderate (F2) and strong (F3) acid sites rose when the calcination temperature increased from 500 to 625 °C. Then, raising the calcination temperature to 750 °C favored increasing the proportion of the low-moderate acid sites and decreasing the strong acid sites. In addition, boosting the activation temperature of the Ni/Al3Fe1-750 from 650 (Ni/Al3Fe1-750 (1)) to 725 °C (Ni/Al3Fe1-750 (2)) slightly increased the proportion of the low-moderate and strong acid sites, but diminished the temperature of these acid sites, especially the strong acid sites.
The total amount of acid sites increased slightly from 777.34 to 881.54 μmol NH3/gcat when the calcination temperature was raised from 500 to 625 °C, respectively. However, raising it to 750 °C decreased half of the total amount of acid sites. In addition, increasing the reduction temperature from 650 to 725 °C reduced the amount of acid sites from 433.24 to 337.43 μmol NH3/gcat, respectively.
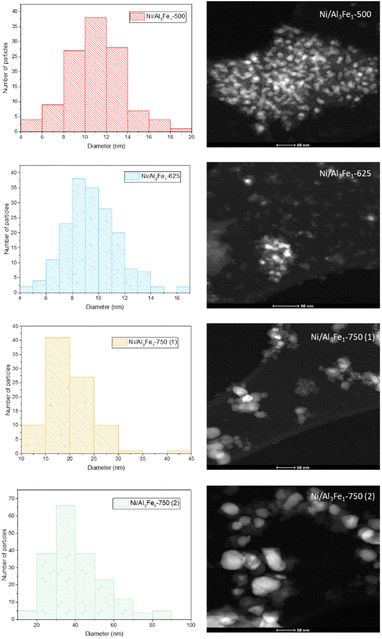
The same trend of the particle sizes obtained by the XRD technique was observed with the STEM technique. Increasing the calcination temperature from 500 to 625 °C decreased the nickel-rich crystallite size slightly from 11 to 10 nm, improving the dispersion. The Ni/Al3Fe1-500 and Ni/Al3Fe1-625 catalysts showed around 34% and 63% of nickel-rich particle sizes below 10 nm, respectively. This corroborates the XRD results and the higher dispersion of the nickel-rich phase on the Ni/Al3Fe1-625 catalyst compared to the Ni/Al3Fe1-500 catalyst. A further increase in calcination temperature to 750 °C caused a diminution in the nickel-rich phase dispersion. In addition, the nickel-rich crystallite size increased from 20 to 41 nm when the Ni/Al3Fe1-750 was reduced at high temperatures, and its dispersion subsequently decreased.
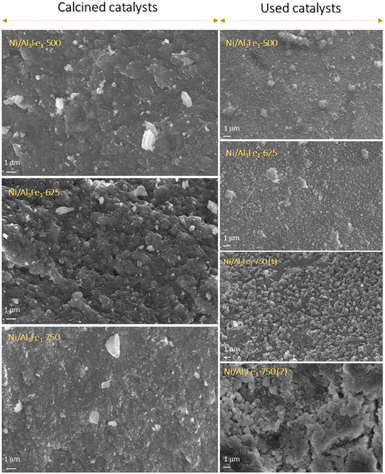
The variations in the morphology depended on the operating conditions, such as hydrothermal temperature, treatment time, and reactant concentrations. The morphologies included cubes, elongated shapes, thick plates, and platelet-like or flower-like particles.48,49
Additionally, elemental analysis of the spent catalysts was performed in order to determine coke formation. Increasing the calcination temperature favored the coke formation expressed using the ratio mg C/(gcatalyst·gglycerol reacted) in the Ni/Al3Fe1 catalyst (1.99 to 4.29 mg C/(gcatalyst·gglycerol reacted)). Meanwhile, boosting the reduction temperature from 650 to 725 °C slightly decreased the coke formation, 4.29 to 3.92 mg C/(gcatalyst·gglycerol reacted) (Table 4). The H content in the used catalysts follows a similar trend to the TGA results (% total weight loss) and could be related to boehmite formation.
| C (wt%) | H (wt%) | Ratio (mg C/(gcatalyst·gglycerol reacted)) | |
|---|---|---|---|
| Ni/Al3Fe1-500 | 1.77 | 0.88 | 1.99 |
| Ni/Al3Fe1-625 | 2.72 | 0.90 | 3.01 |
| Ni/Al3Fe1-750 (1) | 1.74 | 0.41 | 4.29 |
| Ni/Al3Fe1-750 (2) | 1.52 | 0.31 | 3.92 |
Discussion
This study aimed to optimize the calcination temperature of the Ni/Al3Fe1 catalyst in the APH of glycerol without external hydrogen addition. In this context, Ni/Al3Fe1 catalysts calcined at different temperatures (500, 625, and 750 °C) were prepared by the co-precipitation method and tested in the APH of glycerol under the same operating conditions.The results showed that the Ni/Al3Fe1 catalyst calcined at 625 °C presented the best catalytic activity, obtaining a glycerol conversion of around 53%. The proportion of the carbon selectivity to liquid (80%) and gas (20%) products is the same for all catalysts. This could mean the calcination or reduction temperatures did not affect this distribution. Then, the total carbon selectivity to liquid and gas products is determined by the operating conditions, and the catalyst is also influenced. Thus, Garcia et al.30 obtained about 25% and 75% of total carbon selectivity to gas and liquid products, respectively, during the APR of glycerol over Ni/Al coprecipitated catalyst under the same operating conditions (34 bar, 10 wt% glycerol, and 227 °C). The higher carbon selectivity to liquids with the Ni/Al3Fe1 catalyst than with the Ni/Al catalyst could indicate the positive effect of Fe.
The yield to 1,2-PDO, the main liquid product, was 209 mg g−1 glycerol and 192 mg g−1 glycerol for the catalysts calcined at 625 and 500 °C, respectively. The H2 yield, expressed as mg H2/mol C fed, was 47 and 34 for these catalysts, respectively. These results indicate a slight improvement using the catalyst calcined at 625 °C. On the other hand, the catalyst calcined at 750 °C and reduced at two different temperatures (650 and 725 °C) showed low catalytic activity with a 1,2-PDO yield of around 35 mg g−1 glycerol for both catalysts and an H2 yield of 13 and 19 mg H2/mol C fed for the catalysts reduced at 650 and 725 °C, respectively.
The conversion of glycerol is due to reforming reactions that produce gases and liquid phase reactions, mainly by path I (eqn (6)) and path II (eqn (7)).30–32 The acid sites of the catalysts participate in path I by dehydrating glycerol to acetol. In contrast, metal sites of the catalysts are involved in reforming reactions that generate hydrogen and path II by the dehydrogenation/decarbonylation of glycerol.13
The catalysts calcined at low temperatures, 500 °C and 625 °C, presented a high value of acidity and a small size of Ni-rich phase, both favoring the glycerol conversion. The simultaneous reforming reaction of glycerol that produces hydrogen and its participation in the hydrogenation of acetol explained the high 1,2-PDO yield obtained with these catalysts.
In addition, the H2/CO2 ratio in the product gas with the catalysts calcined at 500 and 625 °C was 0.25 and 0.30, respectively, which was significantly lower than 7/3 of the stoichiometric ratio of glycerol reforming, corroborating the participation of hydrogen in liquid phase reactions.36
With the purpose of increasing the knowledge of the influence of the calcination temperature on reaction routes in a liquid phase, Table 5 shows the total carbon selectivity to the main products of path I, acetol and 1,2-PDO, and the total carbon selectivity to the main products of path II, ethylene glycol and ethanol. It is observed that the main reaction route was path I for all the catalysts tested. Moreover, the total carbon selectivity to path I decreased with the increase in the calcination temperature and the reduction temperature using the catalyst calcined at 750 °C. On the other hand, the total carbon selectivity to the products of path II increased with the calcination and reduction temperatures. The tendency observed with the reduction temperature was found previously by Morales-Marin et al.36 in their study of the effect of the reduction temperature on the APR of glycerol over NiAl2O4-derived catalysts. They concluded that the reduction at 700 °C or above enhanced the dehydrogenation mechanism, while the catalysts reduced at below 600 °C favored dehydration/hydrogenation products.
| Path I (acetol + 1,2-PDO) | Path II (ethylene glycol + ethanol) | S1,2-PDO/Sacetol | |
|---|---|---|---|
| Ni/Al3Fe1-500 | 61.3 | 17.5 | 6.8 |
| Ni/Al3Fe1-625 | 60.2 | 17.8 | 7.2 |
| Ni/Al3Fe1-750 (1) | 57.7 | 22.5 | 1.8 |
| Ni/Al3Fe1-750 (2) | 51.7 | 27.7 | 2.4 |
Table 5 also shows the ratio of total carbon selectivity to 1,2-PDO/acetol for the catalysts tested. This ratio is directly related to the hydrogenation activity and was significantly higher for the catalysts calcined at 500 °C and 625 °C. The small size of the Ni-rich phase of these catalysts produced more hydrogen and favored the hydrogenation of acetol to 1,2-PDO.
Freitas et al.13 found that bimetallic CuNi/Al2O3 and CuNi/ZSM-5 catalysts displayed the highest glycerol conversion, 80% and 85%, respectively, with 25% of 1,2-PDO yield at 250 °C and 40 bar, without external hydrogen. They attributed this result to Cu–Ni alloy interaction, high acidity, and good metal dispersion on the catalyst.
Barzegari et al.25 reported that the active surface area and Ni dispersion were gradually diminished by boosting the calcination temperature from 600 to 700 °C. In addition, the catalyst calcined at 600 °C showed the highest catalytic activity. This tendency is in accordance with the results obtained with the Ni/Al3Fe1 catalysts.
Overall, the high catalytic activity for the APH of glycerol without external hydrogen addition was favored with high acidity and good metal dispersion on the catalyst. In this case, the Ni/Al3Fe1-625 catalyst was selected as the best due to its high acidity, high metal dispersion, and lower metal leaching than the Ni/Al3Fe1-500 catalyst. Thus, the Ni/Al3Fe1-625 catalyst demonstrated the best catalytic activity, obtaining the most significant results of H2 and 1,2-PDO yields. Path I was favored at a low calcination temperature (below 625 °C) because the Ni/Al3Fe1-625 catalyst showed the highest acidity and metal dispersion. Besides, increasing the calcination temperature to 750 °C enhanced the selectivity of dehydrogenation products (EG + ethanol) and decreased the H2 yield. At the same calcination temperature (750 °C), boosting the reduction temperature from 650 to 725 °C favored both the selectivity of dehydrogenation products (EG + ethanol) and the H2 yield. This could mean path II was enhanced at high calcination and reduction temperatures (above 725 °C).
Conclusions
An increase in the calcination temperature from 500 to 750 °C produced a significant change in the physicochemical properties of the Ni/Al3Fe1 catalyst and its catalytic activity during the APH of glycerol.The calcined catalyst's surface area was decreased from 233 to 82 m2 g−1 with an increase in the calcination temperature; meanwhile, the pore diameter was increased from 3.3 to 7.4 nm. After its use, acceptable stability in the surface area and pore diameter were observed for the Ni/Al3Fe1 catalysts calcined at 500 °C and 625 °C, while a significant decrease in surface area and increase in pore diameter were determined for the catalyst calcined at 750 °C.
The Ni/Al3Fe1-625 catalyst was selected as the best due to its high acidity, metal dispersion, and catalytic activity, the highest carbon selectivity product being 1,2-PDO. In addition, it experienced less metal leaching than the Ni/Al3Fe1-500 catalyst.
Author contributions
R. Raso: investigation, methodology, formal analysis, validation, visualization, writing – original draft. A. Lete: investigation, validation. L. García: conceptualization, supervision, writing – review & editing, funding acquisition. J. Ruiz: methodology, formal analysis, writing – review & editing. M. Oliva: conceptualization, writing – review & editing. J. Arauzo: supervision, writing – review & editing, funding acquisition.Conflicts of interest
There are no conflicts of interest to declare.Acknowledgements
The authors wish to express their gratitude to the AEI/FEDER, EU (project CTQ2017-86893-R) and to the project PID2020-114985RB-I00 funded by MCIN/AEI/10.13039/501100011033. The authors acknowledge the funding from the Aragón Government (ref. T22_20R), co-funded by FEDER 2014–2020 “Construyendo Europa Desde Aragón.” The authors would also like to acknowledge the use of the Servicio General de Apoyo a la Investigación-SAI of the University of Zaragoza.References
- Y. Guo, M. Azmat, X. Liu, Y. Wang and G. Lu, Appl. Energy, 2012, 92, 218–223 CrossRef CAS
.
- F. Akram, I. ul Haq, S. Raja, A. Mir, S. Qureshi, A. Aqeel and F. Shah, J. Cleaner Prod., 2022, 370, 133479 CrossRef CAS
.
- H. Pan, Q. Xia, Y. Wang, Z. Shen, H. Huang, Z. Ge, X. Li, J. He, X. Wang, L. Li and Y. Wang, Fuel Process. Technol., 2022, 237, 107421 CrossRef CAS
.
- T. Mahlia, Z. Syazmi, M. Mofijur, A. Abas, M. Bilad, H. Ong and A. Silitonga, Renewable Sustainable Energy Rev., 2020, 118, 109526 CrossRef CAS
.
- S. Chozhavendhan, M. V. P. Singh, B. Fransila, R. P. Kumar and G. K. Devi, Curr. Res. Green Sustainable Chem., 2020, 1–2, 1–6 Search PubMed
.
- M. K. Awasthi, S. Sarsaiya, A. Patel, A. Juneja, R. P. Singh, B. Yan, S. K. Awasthi, A. Jain, T. Liu, Y. Duan, A. Pandey, Z. Zhang and M. J. Taherzadeh, Renewable Sustainable Energy Rev., 2020, 127, 109876 CrossRef
.
- R. Cortright, R. Davda and J. Dumesic, Nature, 2002, 418, 964–967 CrossRef CAS PubMed
.
- N. Pandhare, S. Pudi, P. Biswas and S. Sinha, J. Taiwan Inst. Chem. Eng., 2016, 61, 90–96 CrossRef CAS
.
- V. Yfanti, E. Vasiliadou, S. Sklari and A. Lemonidou, J. Chem. Technol. Biotechnol., 2017, 92, 2236–2245 CrossRef CAS
.
- Y. Nakagawa and K. Tomishige, Catal. Sci. Technol., 2011, 1, 179–190 RSC
.
- A. Gonzalez-Garay, M. Gonzalez-Miquel and G. Guillen-Gosalbez, ACS Sustainable Chem. Eng., 2017, 5, 5723–5732 CrossRef CAS
.
- R. Raso, L. Garcia, J. Ruiz, M. Oliva and J. Arauzo, Appl. Catal., B, 2021, 283, 119598 CrossRef CAS
.
- I. Freitas, R. Manfro and M. Souza, Appl. Catal., B, 2018, 220, 31–41 CrossRef CAS
.
- M. El Doukkali, A. Iriondo, N. Miletic, J. Cambra and P. Arias, Int. J. Hydrogen Energy, 2017, 42, 23617–23630 CrossRef CAS
.
- R. Chimentao, B. Miranda, D. Ruiz, F. Gispert-Guirado, F. Medina, J. Llorca and J. Santos, J. Energy Chem., 2020, 42, 185–194 CrossRef
.
- E. D'Hondt, S. de Vyver, B. Sels and P. Jacobs, Chem. Commun., 2008, 6011–6012 RSC
.
- D. Roy, B. Subramaniam and R. Chaudhari, Catal. Today, 2010, 156, 31–37 CrossRef CAS
.
- A. Seretis and P. Tsiakaras, Fuel Process. Technol., 2016, 142, 135–146 CrossRef CAS
.
- A. Soares, G. Perez and F. Passos, Appl. Catal., B, 2016, 185, 77–87 CrossRef CAS
.
- M. Dasari, P. Kiatsimkul, W. Sutterlin and G. Suppes, Appl. Catal., A, 2005, 281, 225–231 CrossRef CAS
.
- F. Cai, D. Pan, J. Ibrahim, J. Zhang and G. Xiao, Appl. Catal., A, 2018, 564, 172–182 CrossRef CAS
.
- V. G. S. Mendonça, I. C. Freitas, R. L. Manfro and M. M. V. M. Souza, Appl. Catal., A, 2022, 645, 118838 CrossRef
.
- R. Raso, L. Garcia, J. Ruiz, M. Oliva and J. Arauzo, Catalysts, 2020, 10, 1482 CrossRef CAS
.
- Z. Bian, W. Zhong, Y. Yu, Z. Wang, B. Jiang and S. Kawi, Int. J. Hydrogen Energy, 2021, 46, 31041–31053 CrossRef CAS
.
- F. Barzegari, M. Kazemeini, M. Rezaei, F. Farhadi and A. Keshavarz, Fuel, 2022, 322, 124211 CrossRef CAS
.
- H. Ozdemir, M. Oksuzomer and M. Gurkaynak, Fuel, 2014, 116, 63–70 CrossRef
.
- X. Li, Q. Wu, B. Zhang, C. Zhang, W. Lin, H. Cheng and F. Zhao, Catal. Today, 2018, 302, 210–216 CrossRef CAS
.
- N. Hamzah, W. Z. a. Y. ABD Samad and M. Ambar, Mater. Sci. Forum, 2017, 888, 518–523 Search PubMed
.
- Z. Xiao, S. Jin, X. Wang, W. Li, J. Wang and C. Liang, J. Mater. Chem., 2012, 22, 16598 RSC
.
- L. Garcia, A. Valiente, M. Oliva, J. Ruiz and J. Arauzo, Int. J. Hydrogen Energy, 2018, 43, 20392–20407 CrossRef CAS
.
- K. Wu, B. Dou, H. Zhang, D. Liu, H. Chen and Y. Xu, Fuel, 2022, 308, 122014 CrossRef CAS
.
- K. Wu, B. Dou, H. Zhang, D. Liu, H. Chen and Y. Xu, J. Energy Inst., 2021, 99, 198–208 CrossRef CAS
.
- J. Remon, J. Gimenez, A. Valiente, L. Garcia and J. Arauzo, Energy Convers. Manage., 2016, 110, 90–112 CrossRef CAS
.
- M. L. Meena, H. Malviya, N. N. Pandhare and P. Biswas, Curr. Res. Green Sustainable Chem., 2022, 5, 100289 CrossRef CAS
.
- A. Arandia, I. Coronado, A. Remiro, A. Gayubo and M. Reinikainen, Int. J. Hydrogen Energy, 2019, 44, 13157–13168 CrossRef CAS
.
- A. Morales-Marin, J. Ayastuy, U. Iriarte-Velasco, M. Gutierrez-Ortiz and C. T. Environm, Appl. Catal., B, 2019, 244, 931–945 CrossRef CAS
.
- A. Reynoso, J. Ayastuy, U. Iriarte-Velasco, M. Gutierrez-Ortiz and C. T. Environm, Appl. Catal., B, 2018, 239, 86–101 CrossRef CAS
.
- M. Thommes, K. Kaneko, A. Neimark, J. Olivier, F. Rodriguez-Reinoso, J. Rouquerol and K. Sing, Pure Appl. Chem., 2015, 87, 1051–1069 CrossRef CAS
.
- L. E. Alzamora, J. R. H. Ross, E. C. Kruissink and L. L. Van Reijen, J. Chem. Soc., Faraday Trans. 1, 1981, 77, 665–681 RSC
.
- J. Chen, L. Yu, J. Sun, Y. Li and W. Xue, J. Eur. Ceram. Soc., 2011, 31, 259–263 CrossRef CAS
.
- K. Kim, B. Kwak, N. Park, T. Lee, S. Lee and M. Kang, Ind. Eng. Chem., 2017, 46, 324–336 CrossRef CAS
.
- D. Shi, R. Wojcieszak, S. Paul and E. Marceau, Catalysts, 2019, 9, 451 CrossRef CAS
.
- L. Wang, D. Li, M. Koike, S. Koso, Y. Nakagawa, Y. Xu and K. Tomishige, Appl. Catal., A, 2011, 392, 248–255 CrossRef CAS
.
- V. Uvarov and I. Popov, Mater. Charact., 2013, 85, 111–123 CrossRef CAS
.
- M. Mirzaee, M. Amini, M. Sadeghi, F. Mousavi and M. Sharbatdaran, Ceram.-Silik., 2005, 49, 40–47 CAS
.
- Z. Wu, Y. Mao, M. Song, X. Yin and M. Zhang, Catal. Commun., 2013, 32, 52–57 CrossRef CAS
.
- F. Meng, P. Zhong, Z. Li, X. Cui and H. Zheng, J. Chem., 2014, 534842 Search PubMed
.
- R. Denigres, G. Rocha, C. Montes and A. Vieira-Coelho, Mater. Res., 2016, 19, 659–668 CrossRef
.
- Z. Wang, Y. Tian, H. Fan, J. Gong, S. Yang, J. Ma and J. Xu, New J. Chem., 2014, 38, 1321–1327 RSC
.
| This journal is © The Royal Society of Chemistry 2023 |


