 Open Access Article
Creative Commons Attribution 3.0 Unported Licence
Advances in studying interfacial reactions in rechargeable batteries by photoelectron spectroscopy
Ida
Källquist
 a,
Ronan
Le Ruyet
 b,
Haidong
Liu
 b,
Ronnie
Mogensen
b,
Ming-Tao
Lee
b,
Ronnie
Mogensen
b,
Ming-Tao
Lee
 b,
Kristina
Edström
 b and
Andrew J.
Naylor
 *b
*b
aDepartment of Physics and Astronomy, Uppsala University, Box 516, 75120 Uppsala, Sweden
bDepartment of Chemistry – Ångström Laboratory, Uppsala University, SE-75121 Uppsala, Sweden. E-mail: andy.naylor@kemi.uu.se
First published on 16th August 2022
Abstract
Many of the challenges faced in the development of lithium-ion batteries (LIBs) and next-generation technologies stem from the (electro)chemical interactions between the electrolyte and electrodes during operation. It is at the electrode–electrolyte interfaces where ageing mechanisms can originate through, for example, the build-up of electrolyte decomposition products or the dissolution of metal ions. In pursuit of understanding these processes, X-ray photoelectron spectroscopy (XPS) has become one of the most important and powerful techniques in a large collection of available tools. As a highly surface-sensitive technique, it is often thought to be the most relevant in characterising the interfacial reactions that occur inside modern rechargeable batteries. This review tells the story of how XPS is employed in day-to-day battery research, as well as highlighting some of the most recent innovative in situ and operando methodologies developed to probe battery materials in ever greater detail. A large focus is placed not only on LIBs, but also on next-generation materials and future technologies, including sodium- and potassium-ion, multivalent, and solid-state batteries. The capabilities, limitations and practical considerations of XPS, particularly in relation to the investigation of battery materials, are discussed, and expectations for its use and development in the future are assessed.
1 Introduction
1.1 Challenges for rechargeable batteries
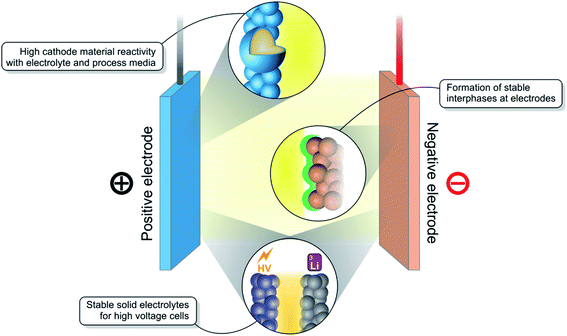
While there are many well-established and reliable rechargeable battery technologies available such as the lead acid battery or nickel metal hydride battery, there is none as energy dense or powerful as the lithium-ion battery (LIB).1 Since their commercialisation, LIBs have enabled a revolution in portable electronic devices.2 Now, they are being manufactured at large scale, bringing down their price and positioning them as the preferred energy storage solution for electric vehicles.3 However, many challenges remain, the most important of which are shown in Fig. 1, in the campaign to further improve their performance and to develop the next-generation of LIBs.Several different chemistries of LIBs exist, offering a variety of energy and power densities. One of the most common cathode (positive electrode) material families, LiNi1−x−yCoxMnyO2 (NMC), encompasses materials such as NMC111 (x, y = 1/3) and the more recent ‘Ni-rich’ NMC811.4 These high Ni content materials, as well as others with a Li excess in the transition metal layer, are well-known to demonstrate a particularly high interfacial reactivity with the liquid electrolyte and with processing solvents during electrode fabrication. The particle surfaces must be coated or doped in order to stabilise the material.5 In the development of new high-voltage cathode materials, novel high-performance and stable electrolytes must too be developed. Electrolyte stability is also important as new anode (negative electrode) materials emerge, such as silicon composites or Li metal. These materials operate at very low electrode potentials and must form stable interfaces with the electrolyte.6
The introduction of more solidified electrolytes such as solid polymer electrolytes (SPEs), gel polymer electrolytes (GPEs), as well as oxide or sulphide glass/ceramic-type electrolytes, is aimed at accessing high-voltage regimes and to provide a greater degree of safety.7 However, compared with liquid electrolytes, they often suffer from poorer wetting at the electrode interfaces leading to poorer Li-ion conductivities and inferior performance.8 Chemical incompatibility with the electrodes can also generate interfacial resistances.
There is little doubt that LIBs will play a large role for years to come, especially in applications that require very high energy or power densities. However, for those applications where low volume or mass is not so important, there are cheaper and/or more sustainable alternatives in the pipeline.9–11
Sodium-ion batteries (SIBs) use analogous electrode materials and electrolytes to LIBs.12 Despite the higher reduction potential of Na+/Na relative to Li+/Li, potentially leading to lower energy densities for SIBs, the high abundance of sodium could allow for cost-effective and sustainable stationary energy storage, for example in the electricity grid. Many challenges remain, however, including the need for a suitable anode material and electrolytes which form stable interfaces against the electrodes.
Potassium-ion batteries (KIBs) offer similar advantages as for SIBs, but with a K+/K reduction potential very close to that of Li+/Li and the possibility to use graphite as an anode. However, such batteries are in very early stages of research and also experience interfacial instabilities.13 Multivalent batteries (e.g. Mg2+, Ca2+, Al3+) are yet another promising future technology, with the ability to double or triple the charge stored per metal ion,14,15 Other interesting areas of research include lithium–sulphur (Li–S) batteries, which suffer from dissolution of polysulfide species into the electrolyte,16 and metal–air batteries (e.g. Li–O2, Na–O2), in which oxygen gas from the atmosphere is reduced at a porous cathode.17
The interfacial stability and the interactivity between components are critical for high-performance batteries. However, due to their inherent inaccessibility and geometry, it is considered particularly difficult to characterise reaction interfaces within batteries. Nonetheless, this is essential when trying to understand the mechanisms underpinning such reactions and to designing protected electrode materials or more stable electrolytes, for instance.
1.2 Characterisation of battery interfaces
Numerous interfaces (the point or area at which two phases meet) exist in a typical Li-ion battery, between components including the electrodes, electrolyte, current collectors, binder particles, and separator.18 The two main interfaces considered to be critical to a well-performing battery are the anode-electrolyte and cathode–electrolyte interfaces. Outside the electrochemical stability window of the electrolyte, at both low and high voltages, the formation of solid interphases (a phase created at the interface of two existing phases, possibly displaying the properties of either or both) can occur on the electrodes. These are the so-called solid electrolyte interphase (SEI) for the anode and most-commonly the cathode electrolyte interphase (CEI) for the cathode.19 Aside from lithiation/delithiation of the electroactive phase, other phenomena that can occur at the anode include Li dendrite growth, particle cracking and reactions of the binder. For the cathode, transition metal redox reactions, dissolution and densification, oxygen redox, phase transitions, and current collector corrosion are of significant interest. Any of these interfacial reactions can affect performance of a battery, giving good reason to study them in detail by various characterisation methods.When discussing battery interfaces, it is the surface regions of components making up the battery that are often referred to. Therefore, surface-sensitive and chemistry-sensitive techniques are commonly employed to probe changes at these surfaces, with respect to the pristine surface, after or during electrochemical testing of the battery.18,20–25
Imaging techniques such as scanning electron microscopy (SEM) and transmission electron microscopy (TEM) provide information on the morphology, particle size, and porosity.26,27 Energy-dispersive X-ray spectroscopy (EDS) or electron energy loss spectroscopy (EELS) are frequently-used complimentary techniques for chemical analysis during the microscopy experiment. In situ or operando TEM experiments can capture interface transformation during heating, cooling or application of an electrical bias, probing the chemical composition and structure of particle surfaces in contact with an electrolyte. These techniques allow for a comprehensive understanding of structure, chemistry and geometry, but are not generally considered as surface-sensitive and provide only elemental compositional analysis. X-ray photoemission electron microscopy (XPEEM) may be considered an alternative imaging technique with greater surface-sensitivity.28
A technique growing in popularity for battery component analysis is time of flight – secondary ion mass spectrometry (ToF-SIMS), which combines the sputtering of a sample surface by a focused primary ion beam and detection of the emitted ions by mass spectrometry.29,30 Despite being a destructive and mainly qualitative technique, ToF-SIMS offers very high surface- and detection-sensitivity including isotope determination.
X-ray absorption spectroscopy (XAS) techniques, or more specifically X-ray absorption near-edge structure (XANES) and extended X-ray absorption fine structure (EXAFS), in transmission mode are bulk techniques that can determine oxidation states of elements in an electrode or whole system.31,32 However, XAS in total electron yield (TEY) or fluorescence yield (FY) modes offer the possibility to obtain information only from the surface regions, typically up to 10's of nanometres depth for TEY or 1 μm for FY.
Other techniques relevant to studying battery interfaces include grazing incidence X-ray diffraction (GI-XRD),33,34 X-ray reflectivity (XRR),35 and various types of scanning probe microscopy (SPM) such as atomic force microscopy (AFM).23
There is one technique, however, which has become a characterisation technique at the forefront of battery research and is now commonplace in the characterisation of battery interfaces. That is X-ray photoelectron spectroscopy (XPS), sometimes referred to as photoelectron spectroscopy (PES), or historically and occasionally still as electron spectroscopy for chemical analysis (ESCA). Some of the various techniques described are summarised in Fig. 2.
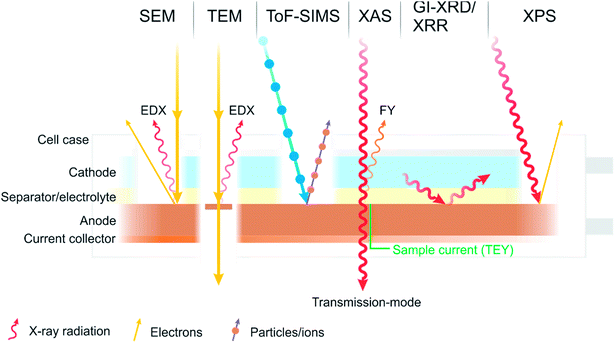 | ||
| Fig. 2 A diagram summarising some of the most common characterisation techniques used to study the interfaces and interphases in batteries. | ||
1.3 X-ray photoelectron spectroscopy
XPS is a highly surface- and chemically-sensitive characterisation technique, traditionally performed, but more recently not always, under ultra-high vacuum (UHV).36 A sample is irradiated with X-ray radiation of a fixed energy (hν), which if the energy is sufficient, causes excitation and ejection of electrons to the vacuum level. The kinetic energy (EK) of the electrons is determined by an electron analyser, which can then be used to determine the binding energy (EB, BE) according to eqn (1), where ϕ is the spectrometer work function. The binding energies of electrons are element specific and are further shifted according to oxidation state and bonding environment of the probed element.| hv = EB + EK + ϕ | (1) |
The surface-sensitivity of XPS stems from the fact that electrons are easily scattered by the sample itself after excitation.37 Therefore, only those ejected from close to the surface of the sample will make it out of the sample and to the analyser. The escape depth is defined by the inelastic mean free path (IMFP) of electrons, where the probability of escape decreases exponentially with greater depth. The IMFP is highly proportional to the electron kinetic energy but is also dependent on the material density, molecular weight, band gap energy and number of valence electrons.38 As a result, the use of X-ray sources of different energies allows for a non-destructive probing of varying analysis depths. This can be an attractive alternative to sputter-etching for depth profiling, which is addressed later. Higher energy sources may also give the possibility to access high energy core level transitions. By far the most common X-ray source on laboratory instruments is an aluminium anode (Al Kα, 1486.7 eV), which is often combined with a monochromator to achieve good energy resolution (∼0.5 eV). Other sources are sometimes used including Mg (Kα, 1253.6 eV), Ag (Lα, 2984.3 eV), Cr (Kα, 5414.7 eV), and even Ga liquid jet (Kα, 9251.7 eV), each offering different flux and line width.39,40
Alternatively, synchrotron radiation sources can offer the possibility to tune the energy of the incident beam, allowing for hard X-ray- (HAXPES) or soft X-ray photoelectron spectroscopy (SOXPES) experiments to be performed.41,42 This gives the experimentalist the option to choose energies corresponding to a variety of probing depths, allowing for a depth profile to be performed. Much higher beam flux can often be achieved with synchrotron sources. However, it is often acknowledged that battery electrodes, especially after cycling, are highly sensitive to radiation.43 Therefore, care must be taken to attenuate or defocus the beam, or to not irradiate the same analysis spot for too long. As is typical with synchrotron measurements, access is competitive, experimental time is limited, extensive sample preparation occurs before the beamtime, and the process of analysing the data can be a long one.
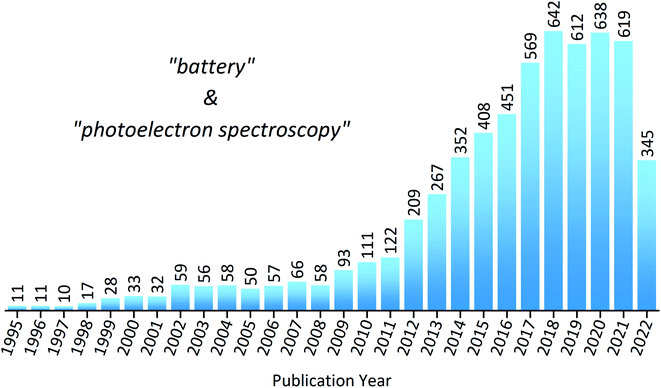
To put into perspective how important XPS is within the field of battery research, a statistical analysis of the literature reveals the substantial increase in publications over the last decade (Fig. 3). However, despite XPS being a powerful technique in materials characterisation, with the ability to determine surface layer thickness and perform quantitative composition analysis, there are many potential pitfalls to be made during measurements or analysis.44,45 This is particularly true in the case of battery materials, which often exhibit complicated chemistry and structure. These practical issues, as well as tips and tricks to achieve success, will be discussed throughout the article.
Previous articles have provided detailed reviews of the use of XPS in studying LIBs and vanadium redox flow batteries.46,47 Here, however, we provide an holistic overview of the use of XPS in studying an extensive variety of modern rechargeable batteries. Our aim is to collect examples of relevant and impactful work in this field to enhance understanding of interfacial chemistry in batteries and how XPS can be used to understand battery interfaces. Such understanding may in addition be applicable to other devices or fields of research.
In the next section, we focus on how XPS is used to characterise the surface regions of electrodes from rechargeable batteries, typically investigating the surface layers built up through decomposition of the electrolyte at the interfaces. However, practical considerations for measurements and data analysis are also discussed, since they are particularly important not only for battery materials but for XPS experiments in general. Following on, we address some of the bulk processes occurring for the battery components and how XPS can, for example, help further the understanding of charge compensation or degradation mechanisms. Then we review some of the latest studies using advanced XPS techniques, employing operando or in situ methodologies to uncover the phenomena in real-time during electrochemical analysis of rechargeable batteries. This section covers both solid-state cells and the development of ambient-pressure systems to study solid–liquid interfaces relevant to batteries. Finally, the state of the field will be summarised and our perspectives on the direction for the use of XPS in studying rechargeable batteries will be offered.
2 The electrode–electrolyte interface
2.1 An introduction to interphases and practical considerations when characterising them
The electrolyte used in commercial LIBs is typically composed of the salt LiPF6 dissolved in a mixture of organic carbonate solvents such as ethylene carbonate (EC) and ethyl methyl carbonate (EMC). In addition, a large number of additives exist and are used to enhance the interfacial stability, cell safety, and/or performance of the electrolyte to transport Li-ions between the two electrodes.48 The exact electrolyte recipes are of course closely-guarded corporate secrets; however, some typical additives, particularly those used in a research laboratory, are known to be fluoroethylene carbonate (FEC), and vinylene carbonate (VC).The organic electrolyte used in modern rechargeable batteries (or, for that matter, any type of electrolyte) has an electrochemical window within which it is considered stable. Below potentials of approximately 0.8 V vs. Li+/Li, organic solvents, such as ethylene carbonate or diethyl carbonate, are known to be thermodynamically unstable towards reduction. This results in their decomposition and formation of the passivating SEI layer, as a new phase on the anode surface.49 The SEI ideally passivates the electrode surface, prohibiting electron transfer, to avoid continuous electrolyte decomposition and consumption. In the ideal case, this results in a kinetically stable system, in which Li+ ions can still diffuse rapidly between electrode and electrolyte. The SEI is generally composed of inorganic and organic, polar and non-polar species, with a high dependency on the electrolyte composition and with thicknesses typically in the range of tens of nanometres. The structure of the SEI, though, has been a topic of much debate over the past three decades, with a double-layered structure and ‘mosaic’ models often referred to.50–53 The CEI is often determined as being even thinner than the typical SEI thickness, making it even more difficult to characterise. In general, it forms through the high-voltage oxidation of the electrolyte at the cathode electrode surface, but some cathode material surfaces are particularly reactive (e.g. Ni-rich, Li-rich materials) and can react in ambient air or in contact with the electrolyte.19,54,55 The nano-length-scales of the interphases formed at battery electrodes, and their intricate chemical structure are the main reasons why their properties and relations to performance remain so elusive, but also why XPS is commonly the chosen technique to characterise them.
In this section, we discuss in broad terms the challenges of characterising such surface layers as the SEI and CEI. Issues of sample preparation, storage, fundamental experimental methodologies and data treatment are considered. In the following parts, we will review specific examples of these phenomena that occur in various types of rechargeable batteries.
2.1.1.1 Exposure to reactive environments. One of the most important things to realise is that lithium and the other alkali metals, often present in elemental form in lab-scale batteries or as compounds in the electrode, electrolyte or SEI/CEI, are highly reactive, even with O2, N2, CO2 and moisture in the air. Schroder et al. performed a study to investigate the effects of exposing silicon electrodes after electrochemical processes to the ambient atmosphere, before using XPS to analyse the surface.56Fig. 4 demonstrates how the composition of the SEI layer can change quite remarkably over a short period of exposure to the ambient atmosphere. The authors propose LiF dissolution in moisture, and the generation of carbonates and oxides (lithium) as the major mechanisms, through various reactions with oxygen and carbon dioxide in the air.
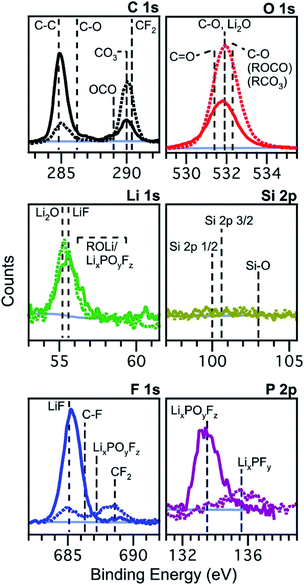 | ||
Fig. 4 XPS spectra of silicon (001) wafer electrodes after preparation by chronoamperometry at 0.01 V vs. Li+/Li for 300 s in an electrolyte of 1 M LiPF6 in ethylene carbonate (EC) and diethyl carbonate (DEC), 1![[thin space (1/6-em)]](https://www.rsc.org/images/entities/char_2009.gif) : :![[thin space (1/6-em)]](https://www.rsc.org/images/entities/char_2009.gif) 1 w/w. Solid lines: measured without exposure; dashed lines: measured after exposure to the atmosphere for 10 minutes. Reprinted with permission from ref. 56. Copyright 2012 American Chemical Society. 1 w/w. Solid lines: measured without exposure; dashed lines: measured after exposure to the atmosphere for 10 minutes. Reprinted with permission from ref. 56. Copyright 2012 American Chemical Society. | ||
Other studies have shown similar phenomena, in particular for the SEI on lithiated graphite electrodes, or the reactivity of the solid electrolyte Li7La3Zr2O12 (LLZO) with moisture and its effect on interfacial resistance.57,58 Studies of Li metal in various organic carbonate-based electrolytes have also revealed the reactivity of alkyl carbonates (ROCO2Li), very often considered a major component of the SEI, with water to form Li2CO3, CO2, and ROH.59
Therefore, to prevent chemical reactions of the samples, especially those extracted from cells after electrochemical testing for ex situ characterisation, it is necessary to transport air-sensitive samples under a protective atmosphere to the load lock of the XPS instrument. This is often achieved using a gas-tight sample transporter containing argon (or other inert gas) or that is under vacuum, to transfer samples from a glovebox where the batteries were disassembled. Where there is no dedicated solution for transfer of air-sensitive samples to an instrument, often a glovebag can be attached to the load-lock entry port of the instrument, flushed several times with argon, and used to load samples into the instrument. However, this rarely provides the same level of reassurance that the samples are unaffected as would a dedicated solution. Fig. 5 shows an array of various devices employed for the transfer of samples between an inert environment (e.g. a glovebox) and an XPS instrument.
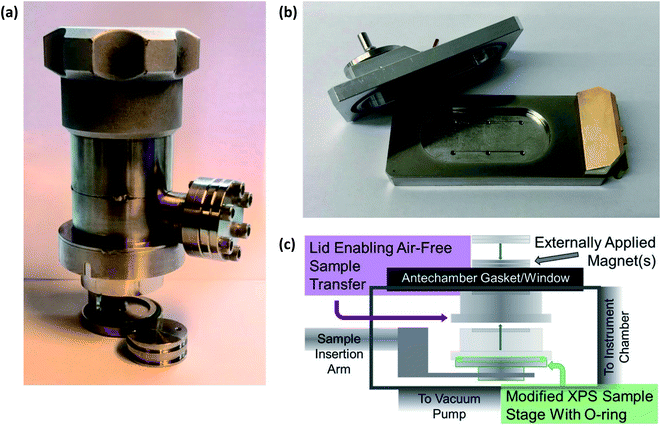 | ||
| Fig. 5 Devices for air-sensitive transfer of samples to XPS instruments. (a) Sample transfer cup for PHI 5500 XPS instrument. (b) Air-sensitive sample shuttle for Kratos AXIS Supra+. (c) A magnetic sealing sample holder: Reprinted with permission from ref. 60. Copyright 2020 American Chemical Society. | ||
While we do not wish to point out specific instances, there are studies in the literature which do not use such devices to prevent air-exposure of sensitive battery samples. Such studies often rely on transferring samples quickly from a glovebox with minimal air-exposure over the course of 10's of seconds. However, in reality it is likely that there is quite significant exposure, especially due to instrument load-lock chambers often taking several minutes to pump down to acceptable pressures. Now with such high competition in the research field, through the production of high-quality science, it is absolutely necessary to always handle air-sensitive battery samples under an inert atmosphere.
Equally important is the way in which samples are stored or shipped before measurements take place. In our experience, the less time there is between removing electrodes from cells and making the measurements, the better. This will give fewer opportunities for reaction of the sample with any potential impurities in the glovebox atmosphere, including oxygen, moisture, and other contaminants. Furthermore, the materials used to package samples for shipping can also contaminate them. For example, many plastics or adhesive tapes contain silicones, which can easily migrate to the sample surface.61 However, sometimes it is necessary to prepare samples days in advance of a synchrotron beamtime or to ship samples to a collaborator's lab for analysis, in which case it is difficult to avoid the necessity to disassemble batteries beforehand and package the samples. One particularly important study, though, demonstrated that the best method to preserve the SEI chemistry is to transport the unopened cells and perform the measurements as soon as possible after opening them.62 It should be noted, however, that this study was performed on lithium-ion batteries where the SEI may remain stable in contact with the electrolyte for several days or weeks. It has been demonstrated that other chemistries, such as SIBs, can suffer from SEI dissolution over relatively short timescales, in which case it may be preferable to remove electrodes from cells as soon as possible after electrochemical testing.63–65 Overall, the general advice is often to avoid plastics and adhesive tapes as much as possible, transport unopened cells if the interfaces are known to be stable; otherwise, use clean glass or metal containers, each containing individual samples to avoid cross-contamination. The same advice is valid for samples stored in the home laboratory for future measurement; storage under ultra-high vacuum or in an inert environment (i.e. a glovebox) is recommended, while trying to avoid contamination from nearby substances.
2.1.1.2 To wash or not to wash? That is really the question. The question of how to store and transport samples without contaminating or exposing them is one that can be addressed relatively easily with the correct understanding and equipment. However, the ‘age-old’ question of whether to wash a battery electrode sample, or not, before performing XPS measurements is somewhat trickier to answer. Through the authors' experiences, and based on a limited literature on the topic,49,57,66–69 several advantages can be suggested to washing a sample, which has the effect of removing the excess electrolyte on the surface of the electrode:
(1) There will be little electrolyte salt residue after drying the electrode that could block the signal from the ‘region of interest’ (e.g. the SEI or CEI), beneath.
(2) There will be less chance of observing ‘charging’ in the XPS spectra during measurement, due to the presence of electronically insulating salt residues (potentially avoid using charge neutralisation).
(3) The salt residues can be highly-prone to beam damage during XPS measurements, therefore limiting the possibility to obtain a suitable spectrum.
(4) The surface will be chemically homogeneous (assuming little contribution to inhomogeneity from electrochemical processes or cell assembly); salt residues could crystallise only in particular areas of the sample.
(5) If using a highly volatile solvent for washing, the sample will dry more quickly, and will avoid the need for elevated temperatures to drive off low vapour pressure electrolyte solvents.
(6) Salt residues from the bottom of the sample will be removed, which otherwise could have prevented electrical conductivity to the spectrometer if performing grounded measurements.
There are also many disadvantages:
(1) The SEI, CEI or other interfacial region of interest may be partially/fully dissolved and removed by the washing solvent.
(2) Washing may lead to some chemical reaction with the solvent, altering the interfacial chemistry.
(3) There may be impurities in the washing solvent which could react with the interfacial species.
(4) A potentially useful ‘internal reference’ (i.e. an electrolyte component, for which one knows the expected binding energy for calibration) may be removed through washing.
Of course, a lot depends on the method used for washing, including its severity, the washing solvent and its purity, the duration, as well as how the residual solvent is removed before measurements (i.e. drying in ambient glovebox conditions, under vacuum, or elevated temperature).57 Somerville et al. investigated the effects of washing graphite electrode after cycling against LiCoO2 with varying amounts of vinylene carbonate (VC) in the electrolyte.66 As can be observed in Fig. 6, the washed electrode exhibited only one fluorine environment, corresponding to the decomposed LiPF6 salt, LixPFy, while the spectra for unwashed electrodes showed peaks for LiF and the intact salt. The authors concluded that washing with DMC would result in the removal, not only of the electrolyte salt, but also of LiF and LixPFy species from the SEI layers.
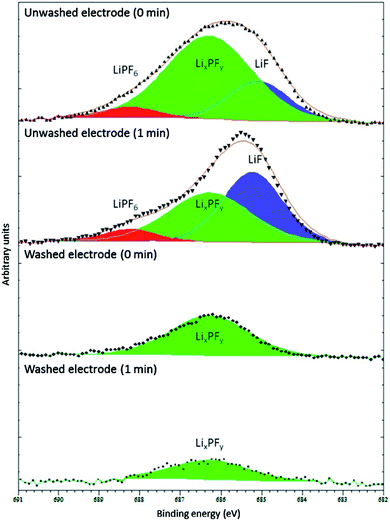 | ||
Fig. 6 F 1s XPS spectra (Al Kα, 1487 eV) from washed (dimethyl carbonate (DMC), 2 min, dried in argon) and unwashed graphite anode from full cells with LiCoO2 cathode and electrolyte of 1 M LiPF6 in ethylene carbonate (EC)/ethyl methyl carbonate (EMC), 3![[thin space (1/6-em)]](https://www.rsc.org/images/entities/char_2009.gif) : :![[thin space (1/6-em)]](https://www.rsc.org/images/entities/char_2009.gif) 7 w/w. The minutes in the figure refer to the duration of Ar+ sputtering before XPS measurement. Reproduced under CC-BY licence from ref. 66. 7 w/w. The minutes in the figure refer to the duration of Ar+ sputtering before XPS measurement. Reproduced under CC-BY licence from ref. 66. | ||
Washing of the electrodes is sometimes said to be the ‘better of two evils’, since you might not gain any information when a thick salt residue forms on an unwashed sample. However, it depends on the system one is investigating and the measurement instrumentation available. It is advisable to make measurements of samples which are washed and some which are unwashed, compare the results and determine what works best in a particular case.
2.1.2.1 Energy-tuned XPS: SOXPES and HAXPES. Through varying the photon energy of the incident X-ray beam, the kinetic energy of the photoelectrons is therefore varied for a given core level at a particular binding energy, according to eqn (1) and as described in Section 1.3. A higher kinetic energy results in a greater IMFP for a given sample material, and therefore leads to a deeper probing depth. Modern laboratory instruments often offer the option of multiple fixed energy sources, as described previously. Using synchrotron facilities, one can often tune the photon energy to almost any value within the operating range. However, this is dependent on the beamline setup and may result in lower flux or a greater line width at particular energies. Synchrotron-based XPS depth profiling is often referred to by two different terms: SOXPES which usually described measurements with photon energies below about 1500 eV, and, HAXPES which describes anything above 2000 eV.46,70–73 These are neither strict definitions, nor are they defined definitively anywhere; some also refer to the range between them (∼1000–3000 eV) as the tender X-ray regime. The advantages of tuning the photon energy to perform depth profiling on battery interfaces are:
(1) It is a non-destructive technique.
(2) One can often choose the desired energy based on the intended probing depth, calculated using, for example, the TPP-2M equation.38
(3) Auger peaks, which have fixed kinetic energies, can be strategically shifted on the binding energy scale to avoid overlapping with photoelectron peaks.
(4) Higher cross-section values are achieved using higher photon energies for some core levels, thereby improving the signal from those elements when compared to using Al Kα radiation.
One disadvantage of using this technique, however, is that spectra contain information from the whole probed depth, including the surface, while the contribution drops off exponentially with greater depth. This can result in misinterpretation of data. A technique that does not experience this issue is ion sputter etching.
2.1.2.2 Ion sputter etching. A well-known method for depth profiling of samples by XPS is to employ monatomic argon ion (Ar+) sputter etching, in which spectra are recorded between regular sample etching periods. In contrast to tuning the photon energy to achieve depth profiling, sputter etching is a destructive technique that removes the top layers of a sample by rostering over a specified area. While this technique works well for metallic samples and some inorganic samples, it is considered chemically damaging for organic materials. Ion-implantation can occur within the surface of the sample and the high ionisation potential can lead to the surface chemistry being substantially altered, leading to unreliable results. For example, it has been demonstrated to cause reduction of transition metals, which could pose a problem for many battery electrodes which contain transition metals.74,75 In general, monatomic argon ion sputter etching is not an appropriate technique for battery electrode samples due to their inhomogeneous nature. Electrodes are almost always composites of an inorganic active material, conductive carbon additive and polymeric binder, and often comprise sensitive SEI/CEI layers. The etching rate depends to a high degree on the hardness of the material; therefore, hard materials (metals/inorganics) will have lower etching rates than for soft materials (organics). Not all materials of the composite will be etched at the same rate, thus leading to preferential sputtering of some materials and resulting in an unreliable depth profile.76,77
To circumvent some limitations posed by monatomic ion etching, one can use a more ‘gentle’ sputtering technique such as argon cluster ion (Arn+) or C60 sputtering.78–80 Gas cluster ion sputtering (GCIS), as the technique is commonly known, can be quite often found as an option on modern XPS instruments. While there are so far few examples for the use of GCIS in battery research, it offers promise due to its ability to sputter etch soft materials without leaving much chemical damage.81,82 This is a result of using large clusters of argon atoms (up to several thousand atoms) with large incident energies (up to tens of thousands eV), giving a low average energy per atom. The low energy prevents significant chemical damage, but the large clusters allow for the removal of material from the sample at appreciable rates (though often not so high rate as for monatomic sputter etching).
GCIS is a technique that is particularly interesting for battery samples, especially when attempting to map the structure of the sensitive SEI layer. There is much work still to be done in this area and we can expect to see an increase in the systematic use of GCIS to study battery materials.
2.1.2.3 Angle-resolved XPS. Finally, the non-destructive technique, angle-resolved XPS (ARXPS) can be considered as another alternative for depth profiling of samples.83,84 A higher take-off angle (e.g. 90°), more of the bulk sample is probed with photoelectrons detected from greater depths. At lower take-off angles (e.g. 30°), photoelectrons from shallower depths are detected resulting in a more surface-sensitive measurement. Particularly for thin-film layered samples, this technique can be useful for determining layer thickness and composition. However, for samples with high roughness and porosity such as battery electrodes, this technique may not give very reliable results.
2.1.3.1 Charging. A well-known and common phenomenon for users of XPS is so-called ‘charging’ of a sample surface. Charging can cause large shifts to higher binding energies, broadening and distortion of peaks.85 This can occur when a source of electrons is not available to replenish those ejected through the photoemission process. This is often the case, for example, when the material under investigation has poor electronic conductivity, is an insulator, or is not properly grounded via the sample holder and stage. There are several methods to largely prevent charging including the use of conductive adhesive tapes, conductive silver paint, mixing the sample with a conductive additive (e.g. carbon black), sputtering a thin conductive layer on the surface, employing a charge neutraliser, or reducing the X-ray power.
Battery electrodes, which are most often composite materials as described previously, can experience differential charging. This is where the different components with varying conductivities cause parts of the sample to have different electron electrochemical potentials. It is therefore recommended to electronically isolate the sample from the instrument ground and use a well-functioning and optimised charge neutraliser to maintain a constant surface potential. This is often called a ‘floating’ configuration. Unfortunately, it is not always possible for instruments where there is not a suitable charge neutralisation system, such as at some synchrotron beamlines. Then, the next best solution is to ground the sample to the instrument and attempt to prevent extensive charging through effective sample preparation.
2.1.3.2 Radiation damage. Battery electrodes, particularly those that have sensitive surface layers after electrochemical cycling, can be susceptible to radiation damage during XPS measurements.43 This can occur due to a high dosing of the sample when the X-ray beam has a high flux or a particular area of the sample is analysed for long period of time. This can result in chemical damage, typically observed for organic or polymeric compounds and can be characterised by comparing spectra of the same core level (e.g. F 1s or C 1s) at the beginning and end of a measurement run. Possible remedies may include reducing the X-ray power, defocusing or attenuating the beam, or measuring for shorter durations on multiple spots (the available options may depend on which instrument is being used).
2.1.3.3 Data analysis. The assignment of peaks to particular atomic environments in XPS data is an incredibly important process for accurate interpretation of the results. The development of an appropriate model with a good quality fit to experimental data requires an exact understanding of the sample, the possible surface reactions that could have occurred and a full overview of binding energy reference values from reference samples, related experiments or from literature. However, binding energy values available in the literature can vary extensively for any element in a specific chemical environment, due to the multiple experimental setups and data analysis methodologies employed. This makes analysis of XPS data challenging for any sample, not only for battery samples. However, for battery samples, the formation of surface layers with unknown chemistry, structure, and their potentially high reactivity adds an extra dimension to the difficulty. In spite of this, XPS is becoming one of the most commonly used techniques for battery electrode characterisation, and there is a large literature with which to compare experimental data.68
There are many potential pitfalls when it comes to background fitting, peak fitting and assignment, as well as presentation of the data and model in a publication.86 One of the most important steps in the data analysis procedure is energy calibration. As was eluded to previously, this can be achieved in multiple ways. If the sample is conductive, a fermi energy calibration should be performed, for example by measuring a known metallic peak. Alternatively, a species with known binding energy is chosen as an internal reference. Often for XPS data, the adventitious carbon (C–C, sp3-hybridised) peak at 284.8 eV is used for energy calibration since it is present very often on the surface of samples that have been in air.
However, for battery samples that may not have been exposed to the air and which may have formed a surface layer containing similar such carbon environments, it may not be useful as a reliable reference. A species that is present in most electrodes and that does not tend to undergo reaction is the conductive carbon additive. This is often referred to as carbon black, but can be any of a number of different products available. The sp2-hybridised carbon environment in these materials usually is observed at approximately 284 eV but can vary depending on the product. Therefore, a reference measurement of the carbon black should be made to help with interpretation and calibration of the sample of interest. Peaks for other species present in the sample can also be used for energy calibration, such as a metal which is known to have a stable oxidation state, or lithium for which there exists absolute binding energies for various compounds.87
Energy calibration for spectra from battery samples often comes with complications. Aside from charging, shifts in binding energy can occur for several reasons. These include the electrode state of charge, electrode electrochemical potential and the presence of an SEI or other surface layer, and can affect peak positions by several eV.88 This is often considered to be the result of an interfacial dipole layer between ‘surface’ and ‘bulk’ components, which causes binding energy shifts between species in the sample.89 Such phenomena can significantly affect the interpretation of results, particularly when binding energy shifts due to lithiated or oxidised phases are also common in battery samples. It is suggested to perform energy calibration to either a surface species or a bulk species, or compare the two different calibrations.
Transition metal spectra are particularly difficult to interpret, especially for battery materials where the metals (e.g. Ni, Mn, Co, Fe, Ti, V, Nb) may be in unusual chemical environments. The determination of oxidation states for these metals is not trivial, particularly when there may be mixtures of states near the surface region of samples. It can be that the peak shape is more indicative of the oxidation state than the binding energy, which can seem counter-intuitive when attempting to analyse the spectra. This is demonstrated in one study that measured spectra for a Ni, Co, and Mn-containing oxide thin film (Fig. 7).90 There are, however, a series of useful literature sources to aid in such analysis.90–92
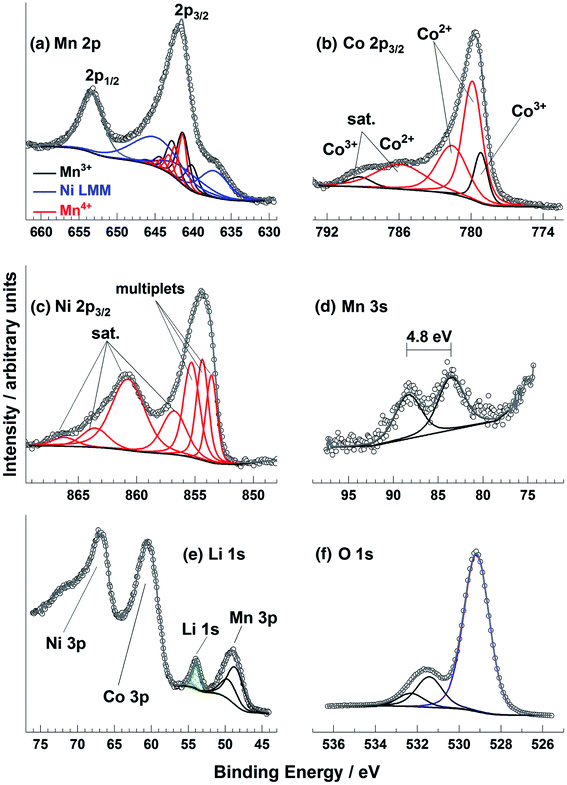 | ||
| Fig. 7 Mn 2p, Co 2p, Ni 2p, Mn 3s, Li 1s, and O 1s XPS spectra for a radio frequency magnetron sputter deposited Li–Ni–Mn–Co–O thin film sample. Reprinted with permission from ref. 90 Copyright 2017 John Wiley & Sons, Ltd. | ||
2.2 Surface phenomena in lithium-ion batteries
XPS analysis was used to probe the surface changes of various NMC materials when exposed to water. Wood et al. evaluated the water compatibility of four different NMC powders with increasing Ni content during water-based processing, which is aimed at reducing cost and environmental impact.100 Only a minor change was observed in carbon and oxygen spectra for the Li2CO3 layer on the surface of NMC after aqueous processing. The layer remains quite thin, characterised by the continued presence of the transition metal oxide peak.
With a similar nanometre thickness range to the SEI on the anode, XPS is a powerful tool in analysing the electronic structure, chemical composition, and geometry of the CEI and/or the cathode surface. While energy-tuned XPS often allows for characterisation of the entire surface, interphase, and some part of the bulk, in this section we will focus on the surface and interphase phenomena, but exploring the bulk in a later section. XPS can contribute in a unique way to understanding the chemical/electrochemical reactions during charge/discharge processes, and can be effective in helping to understand the formation and evolution of the CEI layer but also the complex reactions occurring from the cathode itself.
2.2.3.1 Structure, composition and formation mechanisms. The CEI forms as a result of electrochemical reactions at the cathode surface where it is in contact with the electrolyte. These reactions can include the precipitation of solids at the surface. The dominating factors that affect the CEI formation can be mainly ascribed to the initial surface specific adsorption behaviour and solvated coordination behaviour as illustrated in Fig. 8.102,103 The specific adsorption on the electrode determines the initial structure and chemical composition of the interface, while the solvated coordination structures of the electrolyte serve as a method for repair of the interphase during cycling.
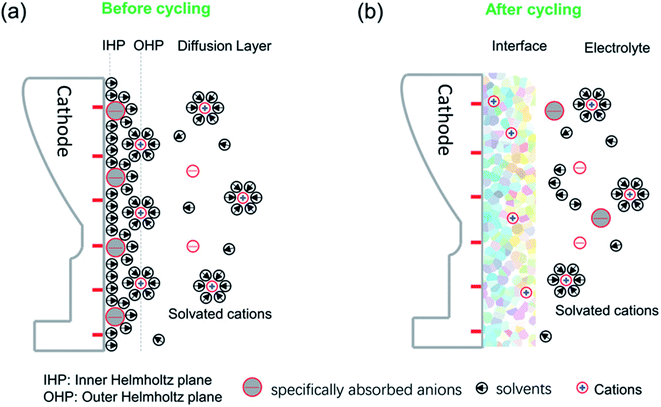 | ||
| Fig. 8 A schematic diagram of the cathode–electrolyte interface before and after cycling and the formed CEI after cycling. (a) The ions and solvents will be specifically absorbed on the inner Helmholtz plane (IHP) before cycling. (b) The specific species of the IHP and the solvated groups become oxidized or otherwise decomposed during cycling, along with the disappearance of the IHP. Reproduced under CC-BY licence from ref. 103. | ||
Demonstrating some parallels to the SEI formation, carbonate-based electrolytes undergo oxidation reactions to form the CEI at the cathode surface during charge.104 The composition of the CEI is a highly debated subject and is very much dependent on numerous factors. As a result, the proposed composition of the CEI varies from one publication to the next, as operating conditions and other parameters such as electrolyte composition, can be very different.105,106 Thus, it is not possible to give a general composition or structure of the CEI. However, there are some ideal properties that it is thought the CEI should exhibit, including low thickness, high density, low ionic resistivity and electron conductivity, as well as good electrochemical and mechanical stability. Fig. 9 presents a schematic diagram for the composition and structure of the CEI thought to form on an NMC cathode in LIBs. As is shown, a large number of different inorganic compounds and a complex mosaic structure are formed at the NMC material surface.
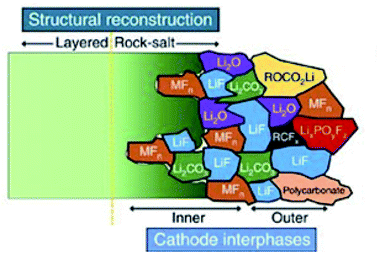 | ||
| Fig. 9 A schematic diagram of the microstructure and chemical composition of the CEI at the interface between a typical NMC cathode and carbonate-based electrolyte. Reproduced under CC-BY licence from ref. 107. | ||
It is understood that the surface chemistry of the cathode material can play a significant role in the CEI formation and its composition. Huang et al. suggested that the stability of the CEI on NMC811 could be influenced by the synthesis method employed (rapid co-precipitation and spray-drying routes to produce spherical NMC811).108 The chemical composition of the formed CEI on the NMC811 from different synthesis methods before and after cycling were determined by XPS. In comparison to the pristine materials, the cycled electrodes had a greater surface content of oxygen, fluorine, and phosphorus, while a decrease in carbon was observed. From peak fitting of the data, the increase in the above elements mainly originates from the formation of electrolyte decomposition products, such as LiF, LiPxOy, Li2CO3, and various organic compounds, that make up the CEI. Comparing the cycled NMC materials synthesised by the different routes, the surface layer of rapid co-precipitation-NMC has much larger amounts of the CEI products, which is ascribed to the more severe interfacial reactions. These reactions consume a large amount of active transferable lithium, leading to an increase in the interfacial resistance and a loss in capacity.
The CEI is a very dynamic entity, changing in chemistry and structure during long-term cycling of the battery. XPS analysis of cycled LiNi0.7Co0.15Mn0.15O2 electrodes, presented in Fig. 10, reveals the CEI composition after calendar ageing and after 100 cycles.107 While the pristine material shows that a native film of Li2CO3 exists on the particle surfaces, upon ageing in the electrolyte and cycling, various electrolyte degradation products are formed. Such products are thought to include semicarbonates, LiF, MFx, LixPOyFz and RCFx. There is a noticeable increase in the thickness of the CEI for the aged electrode when compared with the cycled electrodes, characterised by the relative intensities of peaks for CEI species against the peaks for bulk components (i.e. O2− and C–C). Furthermore, an effect of the secondary particle size was reported; the CEI appears to have a greater thickness for the larger particle size. The authors also find that the conductive carbon additive in the electrode can have a significant effect on the CEI evolution. The CEI formed initially on the carbon additive can be exchanged readily with the cathode particle surface, suggesting closely intertwined interactions between the cathode material and the carbon. Therefore, it is not necessarily accurate to study CEI formation in model systems in the absence of carbon additives or binders.
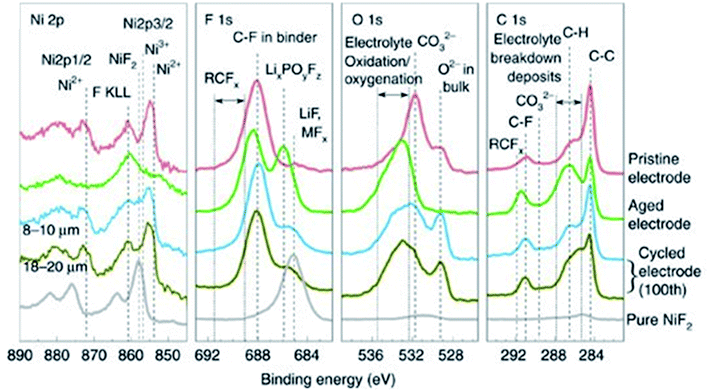 | ||
Fig. 10 XPS spectra (Ni 2p, F 1s, O 1s, C 1s) of LiNi0.7Mn0.15Co0.15O2 electrodes (pristine, aged, and cycled electrodes with 8–10 and 18–20![[thin space (1/6-em)]](https://www.rsc.org/images/entities/char_2009.gif) μm particle sizes) and pure NiF2. Reproduced under CC-BY licence from ref. 107. μm particle sizes) and pure NiF2. Reproduced under CC-BY licence from ref. 107. | ||
The use of electrolyte additives is an important strategy to improve the electrochemical performance of batteries. Such compounds added to the electrolyte, typically in concentrations of <10%, are often designed to improve interfacial chemistry.109–113
The role of tris(trimethylsilyl) phosphite (TMSPi) as an electrolyte additive to improve the electrochemical performance of NMC811/Si–graphite cells was investigated by synchrotron-based XPS depth profiling.114 The morphological and compositional differences of the CEI and SEI were probed for the cathode and anode, respectively. As shown in Fig. 11, the formed CEI with TMSPi on the NMC811 cathodes displayed an increased amount of alkyl carbonates/carboxylates, with a decreased amount of PFxOy species. Moreover, this TMSPi-derived CEI on the cathode can effectively suppress the polyvinylidene fluoride (PVDF) binder degradation and the cathode to anode “cross-talk” of the migration of the decomposed CFx species.
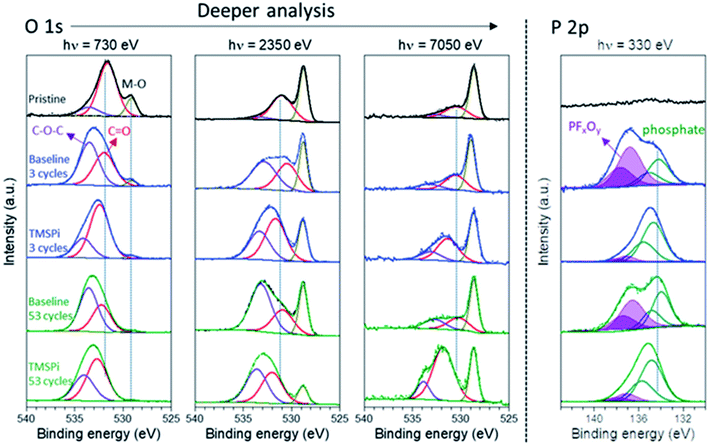 | ||
| Fig. 11 O 1s and P 2p XPS spectra (at three photon energies) of the pristine and cycled NMC811 electrodes taken from discharged cells after up to 53 cycles with and without 2 wt% TMSPi as an electrolyte additive. Reproduced under CC-BY licence from ref. 114. | ||
In another study, it was found using synchrotron XPS that the Li-rich disordered rocksalt oxyfluoride material Li2VO2F reacted very strongly with the organic electrolyte, resulting in a rapid degradation of the material and its capacity to store charge.115 To mitigate this detrimental issue, electrolyte additives including lithium bis(oxalato)borate (LiBOB), lithium difluoro(oxalato)borate (LiODFB), and glycolide were employed.116 Through further XPS studies it was found that the improved capacity retention was due to the formation of a protective CEI at the cathode surface, preventing excessive degradation of the oxyfluoride material. Other strategies including doping of the oxyfluoride material with either titanium or iron, or employing AlF3 particle coatings, also proved effective in boosting capacity retention through stabilisation of the cathode surfaces.117,118
2.2.3.2 Cross-talk. Electrolyte additives are also useful in preventing transition metal dissolution from cathode materials. The transition metal ions in cathodes act as the redox centres through which the storage of Li+ ions is charge compensated. One of the biggest challenges for many cathode materials, especially those next-generation high-capacity materials containing elements such as manganese, iron or vanadium, is transition metal dissolution. The loss of these redox centres from the material itself inherently leads to a capacity fading.119–121 This process not only alters the surface structure of the cathode material particles, but equally as important, can affect the structure and composition of both the CEI and the SEI on the anode. This occurs through a process known as ‘cross-talk’, where species migrate from one side of the cell to the other, for example transition metals from the cathode dissolving in the electrolyte then depositing on the anode. XPS can again be used as an effective technique to detect the transition metals deposited at either electrode surface, even in small concentrations, and perform a quantitative analysis.
Ochida et al. demonstrated, using XPS measurements of graphite anodes, the deposition of metallic manganese and subsequent oxidation to MnO under open-circuit conditions.123 This work suggested that the deposition of Mn metal on the graphite could be largely affected by the selected additives. At the same time, the slight differences of the deposited Mn or Mn-based compounds on the graphite electrode could be identified by XPS. Similar with no additive, the cyclic ether additive, 1,4,7,10,13,16-hexaoxacyclooctadecane (18C6), could not suppress the deposition of Mn since a peak at around 639 eV (640 eV for without additive) could be identified as Mn metal. On the other hand, 1.4 wt% 4,7,13,16,21,24-hexaoxa-1,10-diazabicyclo hexacosane (C222) additive were found to effectively suppress the Mn deposition due to no peak in the Mn 2p spectrum as observed by XPS shown in Fig. 12. In addition, some other transition metal dissolution phenomena on the cycled electrodes were confirmed by the XPS spectra, such as V (V 2p) and Fe (Fe 2p).122,124 For example, the V 2p spectra in Fig. 10b indicated that the dissolved vanadium from the Li2−xVO2F cathode was deposited on the anode surface during cycling. The deconvolution of vanadium gives the V 2p3/2 peak at 516.1 eV and the V 2p1/2 peak at 523.5 eV, respectively, and indicates the deposited vanadium has a +4 oxidation state.
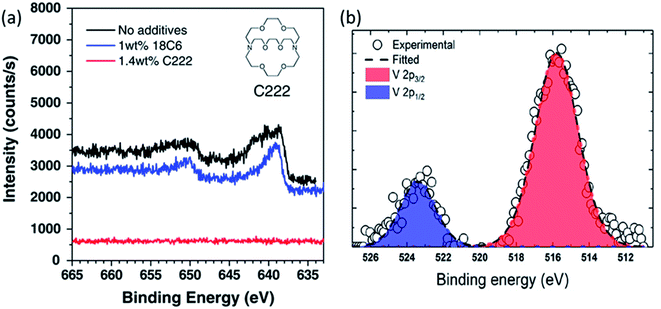 | ||
| Fig. 12 (a) Mn 2p spectra of graphite electrodes after 5 cycles with LiMn2O4 cathodes in 1 M LiClO4/EC + DEC with and without the 18C6 or C222 cyclic ether additives. Reproduced from ref. 119 with permission from the Royal Society of Chemistry. (b) V 2p core level of the vanadium deposited on the anode. Reprinted with permission from ref. 122. Copyright 2019 American Chemical Society. | ||
In summary, sustained efforts have achieved a fundamental understanding in terms of the components, structure, and the formation mechanisms of the CEI layers, as well as how they influence the overall properties of the cells. It has been found that electrolyte additives, surface coatings, particle size and the chemistry of the cathode material itself can have a large influence on the CEI properties and hence on the overall performance of a cell.
Xu et al. studied the interfaces within SPE-based graphite half cells using XPS.127 Samples were prepared by dissolving the polyethylene oxide (PEO)-based SPE from the cell in acetonitrile. It was found that the SPE contained up to 2300 ppm H2O, depending on the preparation method, which resulted in extensive LiOH formation on the graphite electrode surface after one discharge (lithiation). For the same interface, evidence of LiTFSI (lithium bis(trifluoromethanesulfonyl)imide) decomposition was also presented. At the Li-SPE interface, mostly LiF and lithium alkoxides were formed. The SEI products in the SPE cell were vastly different to the carbonate or PEO-type polymers typically found at electrode interfaces after cycling with a liquid electrolyte.
The use of gel/polymer electrolytes often show a greater degree of stability towards high-voltage cathode materials, compared with liquid electrolytes. The poly(vinylene carbonate-acrylonitrile)-based gel polymer electrolyte (PVN-GPE), which was synthesised through copolymerisation of vinylene carbonate and acrylonitrile, exhibited a large electrochemical stability window.128 This “5 V class” polymer electrolyte was used to demonstrate excellent cycling performance of LiNi0.5Mn1.5O4/Li metal cells. The authors used XPS to characterise the cathode electrolyte interface (CEI) on the LNMO after 200 cycles, finding generally less intense signals for the peaks attributed to electrolyte decomposition, when compared with a similar experiment using a liquid electrolyte. It is thought that the strong adhesion of the GPE to the electrode reduces the available active sites for electrolyte decomposition. Furthermore, the high oxidation stability of the GPE and its compatibility with the cathode suppresses the formation of the CEI.
The removal of liquid from the electrolyte conveniently allows the development of in situ and operando methodologies still under ultra-high vacuum and investigation of potential next-generation all-solid-state battery technologies. XPS is also an essential tool in the investigation of many other potential next-generation technologies, particularly those not based on lithium.
2.3 Interfacial reactions in ‘beyond Li-ion’ technologies
Similar principles are applied when employing XPS to study battery types other than LIBs. This is especially true for chemistries that similarly rely on kinetic stabilization by surface layer formation but as some selected examples will show the use of XPS goes beyond SEI studies.A very closely related system is the KIB that often use graphite anodes.129,130 SIBs constitute another active field of battery science; however, these are unable to use graphite without the co-intercalation of solvents.131,132 XPS has been found to be a valuable tool in studying both SIBs and KIBs.133–138 Going even further into novel systems, we find multivalent-ion batteries based on magnesium and calcium that present further unique challenges and require some unique solutions.139,140
This being said, a notable example of the use of XPS for SIB studies is from Muñoz-Márquez et al.,143 that investigated the SEI formation on Na2Ti3O7 anodes (Fig. 13a). In their work they describe several important points to SIB-XPS measurements: (1) they reaffirm that the SEI in SIB consists mostly of inorganic compounds, (2) they show that there are organic compounds formed that are being dissolved during the charging of the anode, and (3) they show that PVDF binder reacts with sodium to form NaF. The energy calibration for XPS studies of SIBs can often be done using the graphitic carbon peak at ∼284 eV that is commonly present due to the carbon active material or conductive carbon additives. However, in SIB systems this peak is not always visible as the SEI grows beyond the probing depth of most in-house XPS instruments. This issue, combined with the surface charging effects that results, are somewhat mitigated by analysis of the Auger parameter (α) for Na, by determining the energy shift between the Na 1s photoelectron line and the Na KL23L23 Auger signal (Fig. 13b).
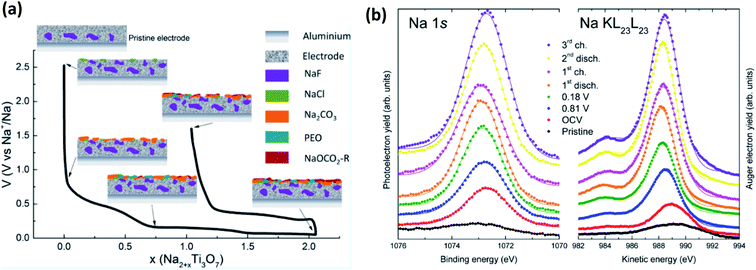 | ||
| Fig. 13 (a) The composition and evolution of the SEI on Na2Ti3O7 electrodes as determined by XPS. (b) Na 1s XPS spectra and Na KL23L23 Auger transition spectra for electrodes at different states of charge. Reprinted with permission from ref. 143. Copyright 2015 American Chemical Society. | ||
Ether and carbonate electrolytes result in significantly different SEI composition and function, which is well described in investigations where glymes and carbonates are used in conjunction with TiO2 and hard carbon anodes.144,145 They use XPS measurements combined with ion-sputtering to reveal that ethers have a significantly higher proportion of inorganic compounds in the inner SEI layer than carbonates (Fig. 14). This is shown by the rapidly decreasing carbon signal with sputtering depth as compared to the carbonate electrolyte in the TiO2 system while the hard carbon showed a continual rise in NaF content during sputtering. The large difference in SEI properties between ethers and carbonates are also evident in alloy systems. Wang et al.146 utilized XPS to characterise bismuth anodes where the SEI from G2-glyme was found to contain polyethers and sodium alkoxides, whereas the carbonate instead formed polyesters and sodium alkylcarbonates.
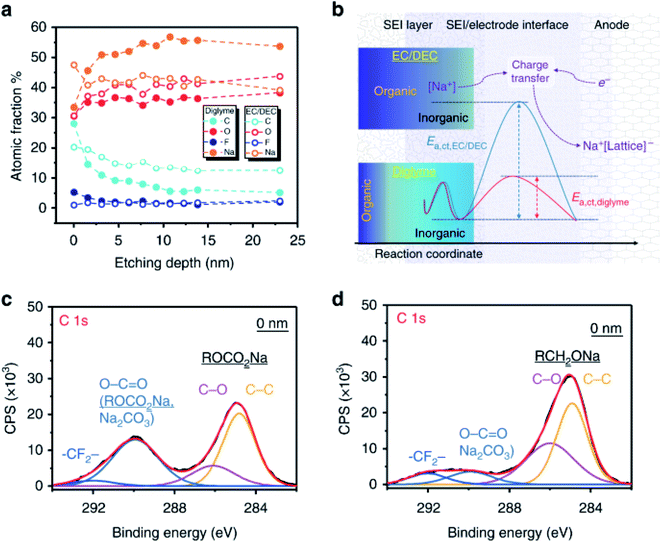 | ||
| Fig. 14 (a) Quantitative analysis of XPS data from sputtering depth profiling of the SEI formed from ether and carbonate electrolytes. (b) Schematic diagrams for the SEI composition. (c) C 1s spectrum for the electrode with carbonate-SEI before sputter-etching. (d) C 1s spectrum for the electrode with ether-SEI before sputter-etching. Reproduced under CC-BY licence from ref. 144. | ||
Ethers enable the use of graphite as an anode for SIB through the co-intercalation of the solvent, albeit at the cost of capacity and energy. This co-intercalation of solvent is however quite interesting from an SEI analysis perspective since any SEI must allow solvent molecules to pass through in order for the system to function. The initial investigations of this system by Maibach et al.147 makes use of synchrotron-based depth profiling. The authors describe a system where the NaFSI salt decomposes to form a thin (<8 nm) passivation layer below 0.5 V vs. Na+/Na that allows the solvent and Na-ions to pass through. It cannot be ruled out that the ethers participate in the SEI formation in these systems although their reduction stability should allow them to endure the cycling environment.
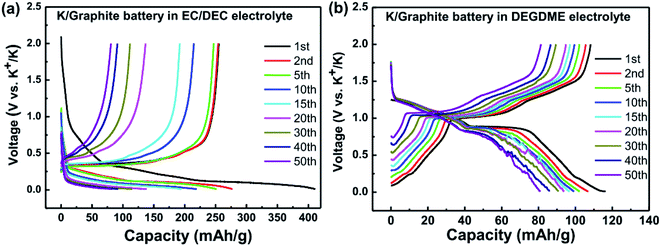 | ||
| Fig. 15 Galvanostatic voltage profiles for K/graphite cells using (a) carbonate, and (b) ether electrolytes. Reprinted from,148 with permission from Elsevier. | ||
In the case of carbonate electrolytes and graphite, it has been reported that significant SEI formation occurs during the first discharge and that it forms organic alkoxides, potassium alkyl carbonates and potassium carbonate with subsequent increases in fluorine contains species as cycling progresses.148,149
There is, however, some disagreement as to the composition and thickness of the SEI. Lei et al.148 report that the SEI thickness is less than 4 nm after the first discharge based on high resolution TEM measurements, supported by XPS measurements where a signal at 285 eV is attributed to the K–C species. In contrast, Naylor et al.149 use SOXPES and HAXPES to describe the SEI in a very similar system and found that it would reach up 50 nm in thickness based on the complete disappearance of the graphite/KCx peaks (Fig. 16). The authors also report that the thickness depends on the state of charge with a clear increase of the SEI thickness during discharge and subsequent thinning during charge.
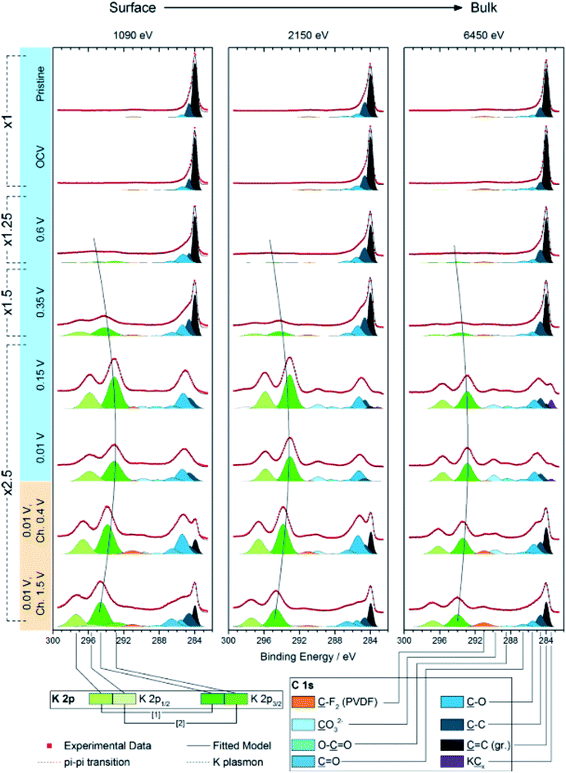 | ||
| Fig. 16 K 2p – C 1s XPS spectra measured using SOXPES/HAXPES for graphite electrodes at various states of charge from carbonate-based electrolytes. Reprinted with permission from ref. 149. Copyright 2015 American Chemical Society. | ||
As in the case of sodium metal, the potassium electrode is also reported to be problematic as it decomposes carbonate electrolytes. Lei et al.148 shows that the SEI formed on the potassium metal in carbonates is continually growing with detrimental effects on the performance of the graphite electrode. In fact, a lot of the degradation seen in half-cells can be reversed simply by replacing the potassium counter electrode (CE). This shows just like in the case of sodium half-cells that investigators must be very careful to not let the influence of the metallic alkali counter electrode skew their results.
While potassium graphite systems are usually compared to LIB system, potassium hard carbon finds its most relevant comparison in sodium. Unfortunately, there has been very little work on using hard carbon anodes for potassium systems. XPS measurements by Chen et al.150 indicate that the SEI goes through the same processes of thickness variation as described for the K-graphite system, as presented in Fig. 17. This can be inferred by the intensity shift of the substrate carbon peak, though the authors make no such claim.
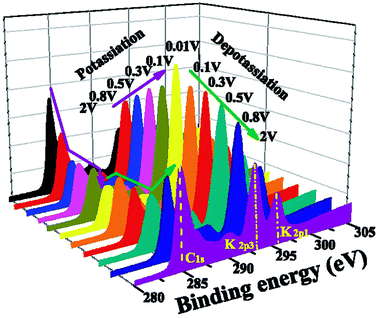 | ||
| Fig. 17 K 2p – C 1s XPS spectra of hard carbon electrodes at various states of charge from potassium systems, showing the increase and subsequent decrease in the substrate signal. Reprinted from ref. 150, with permission from Elsevier. | ||
In magnesium-ion batteries, the blocking nature of the SEI formed on Mg metal anodes can be overcome by several strategies. One compelling example is by Matsui et al.155 that uses intermetallic compounds such as Mg3Bi2 to facilitate the deposition of Mg2+. In this work XPS is used to show that the passivation layer consists of MgF2 from the decomposition of the bis(trifluoromethylsulfonyl)amide (TFSA−) anion (Fig. 18a). The authors detect little difference in the SEI layer between the electrochemically inactive Mg3Sb2, pure Mg anodes and the active Mg3Bi2 anode. However, the Mg 2p XPS spectra show that Mg exists as Mg2+ in Mg3Bi2 and this is claimed to lead to fast reaction kinetics and could thus explain the striking difference in electrochemical performance.
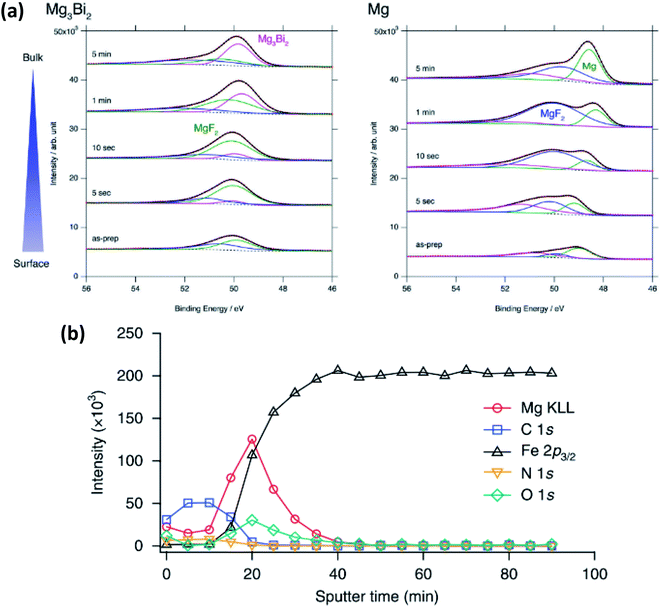 | ||
| Fig. 18 (a) Mg 2p XPS spectra after sputter-etch depth profiling for Mg3Bi2 and Mg thin films immersed in 0.5 mol L−1 Mg(TFSA)2 in BuMeG3 solution for 24 h. Reproduced under CC-BY licence from ref. 155. (b) XPS sputter-etch depth profiles of a Mg-coated stainless-steel electrode in 0.5 M Mg(TFSI)2-PC electrolyte. Reprinted by permission from Nature Chemistry156 Copyright 2018. | ||
Another example, from Son et al.,156 uses artificial passivation layers to avoid the blocking nature of the Mg metal in carbonate electrolytes by applying a thin layer of thermal-cyclized polyacrylonitrile (cPAN) and magnesium triflate. This layer allows for impressive stripping and plating performance in propylene carbonate (PC) and even allows for stable cycling with water present in the electrolyte. The use of XPS provides insights into the nature of the passivation layer and combined with sputter-etching confirms that the Mg is actually deposited below the artificial SEI (Fig. 18b).
Calcium has many of the same issues as magnesium and these challenges are exacerbated by the low reduction potential of Ca metal that is very close to that of lithium. Although it has been proven possible to plate and strip calcium in carbonates at moderate temperatures,157 there is a need to improve the Ca diffusion through the SEI. This can be done in several ways. In the work of Wang et al.,158 tin is used as an alloying anode for Ca in a strategy reminiscent of the intermetallic compounds used for Mg. The surface layer formed on the Sn anode consist of CaF2 and Ca(PF6)2 originating from the salt used in the electrolyte. The fluorine compounds appear together with organic species such as (RCOCO2)− formed by a ternary mixture of carbonates used as the solvent. As we have seen earlier, graphite can be used together with ethers to promote intercalation of ions by wrapping them in a solvation sheath. Prabakar et al.159 used this strategy and found that G4-glyme would lead to reversible intercalation of Ca2+ in graphite. The authors used XPS to show that G1–G3 glymes did insert Ca ions but that they were trapped in the structure. Further measurements at different stages of charge of the graphite showed that, not only did the calcium signal intensify during the insertion, but the carbon signal from G4 was seen to appear as well (Fig. 19).
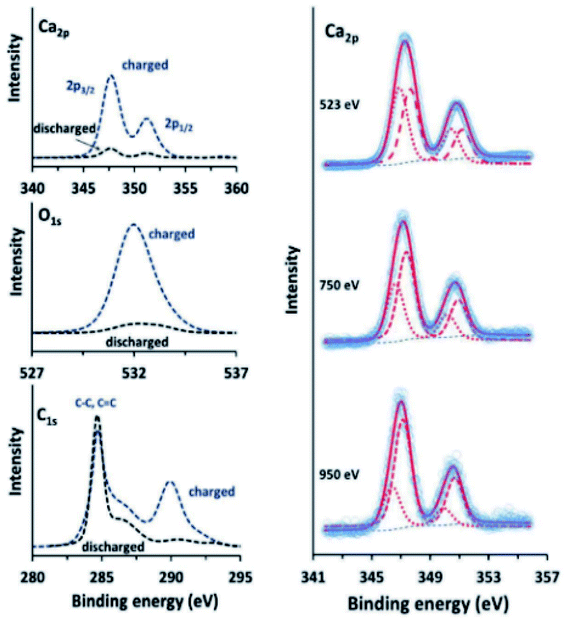 | ||
| Fig. 19 Ca 2p, O 1s, and C 1s XPS spectra (left) of charged and discharged (−2.9 and −0.2 V vs. SHE, respectively) graphite electrodes in a calcium system using G4-glyme electrolyte. Ca 2p XPS spectra (right) of charged graphite electrodes, measured using synchrotron radiation at different photon energies, showing the presence of surface Ca2+. Reproduced under CC-BY licence from ref. 159. | ||
In summary, the chemistries proposed for technologies beyond LIBs come with many issues and a lot of these are surface related. XPS experiments can be useful in addressing many of these challenges. The most common use is of course for SEI analysis, but we have also seen examples where oxidation states of the bulk anodes as well as co-intercalated solvents in graphite have been detected and proved instrumental for the analysis.
3 Bulk material phenomena characterised by XPS
Where the surface layers on an electrode material are thin enough or when using a high enough photon energy (HAXPES measurements), it is possible to probe the ‘bulk’ electronic structure of the material. Depending on the size of particles making up a composite electrode, this may still, though, be considered as very surface sensitive. For battery materials in particular, it is interesting to study the oxidation states of the transition metals, which are most often the redox centres involved in charge compensation when charging or discharging the battery.160,161 However, in recent years oxygen redox activity has become an interesting topic to investigate, especially since such activity can lead to greater capacities.162,1633.1 Transition metal redox activity
The redox activity of V in Li2VO2F cathodes was reported to be analysed by XPS as displayed in Fig. 20.115 The binding energy difference between the MO peak (∼530 eV) and the V 2p3/2 peak can be used as a measure of the vanadium oxidation state, where a larger energy difference corresponds to a lower oxidation state. The values expected for the V3+, V4+, and V5+ are 14.7, 14.2, and 12.8 eV, respectively. The oxidation state in the fully delithiated state is expected to be 5+, and in the fully lithiated state, it is expected to be 3+. A combination of these two extremes was used as a first approximation to fit the data. Using SOXPES and HAXPES, it was shown the vanadium was gradually oxidized to a non-redox active V5+ state during cycling, starting from the surface and extending further into the bulk after 50 cycles.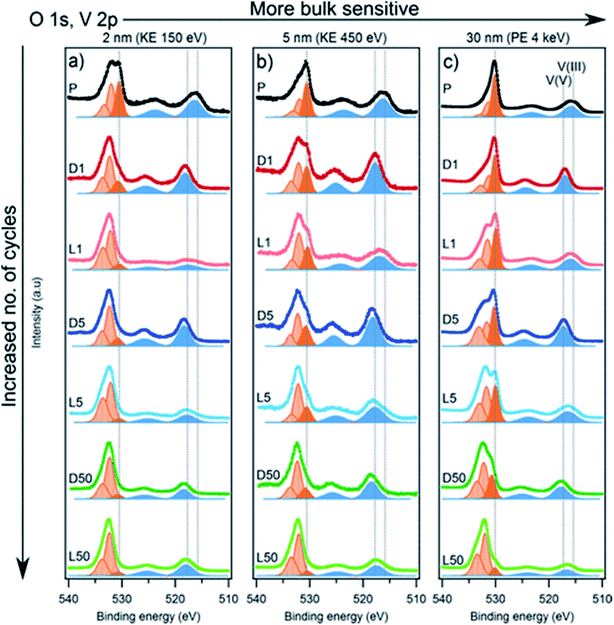 | ||
| Fig. 20 The spectra of O 1s, V 2p with the tuned photon energies aiming at detecting the different depths ranging from interphase layer to bulk part. Vanadium contribution is indicated by blue peaks while dark orange corresponds to the MO and light orange to surface oxygen compounds. Reproduced under CC-BY licence from ref. 115. | ||
3.2 Oxygen redox activity
The Li-rich layered oxides are attractive cathode materials for next-generation LIBs due to their high reversible specific capacity (>250 mA h g−1). However, the origin of their abnormal capacity of the Li-rich layered oxides is still ambiguous; oxygen loss and/or oxygen redox reactions have been proposed to explain the phenomenon.164,165 XPS has been employed to reveal the evolution process of oxygen in various Li-rich materials.89,166,167A systematic XPS study combining core and valence spectra at different stages of the charge/discharge process was performed to analyse the redox chemistry of Li-rich Li2Ru1−yMnyO3 and Li2Ru1−ySnyO3 where electronic changes affect both oxygen and the transition metals.168,169Fig. 21a shows the O 1s core spectrum with two peaks at 529.5 and 531.6 eV corresponding to O2− anions belonging to the crystalline network and corresponding to weakly adsorbed surface species, respectively, the latter being also responsible for the weak signal at ∼533.2 eV. The component at 530.5 eV reappears/disappears on subsequent charges/discharges, demonstrating the redox activity of oxygen. Consequently, such a mechanism is proposed with help of XPS results for Li-rich oxides. On oxidation, the reaction Ru6+–O2− → Ru5+ + O− (i.e. hole in the oxygen) ultimately ends by the condensation of O22− (peroxo-like) species, instead of releasing O2 gas.
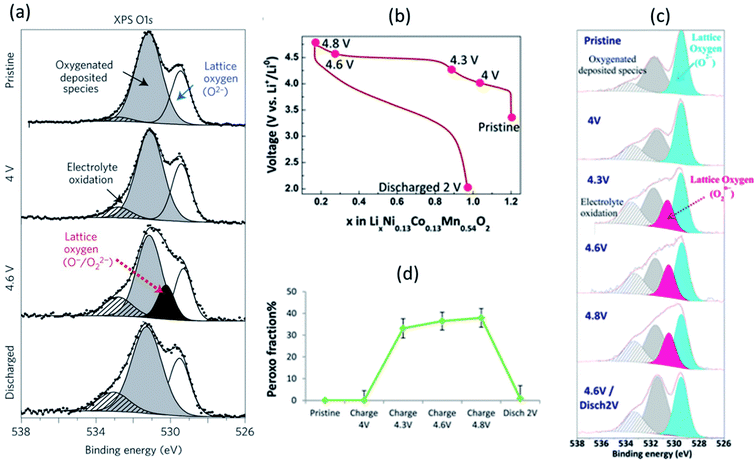 | ||
| Fig. 21 XPS spectra (hν = 1487 eV) of (a) O 1s core level for Li2Ru0.5Sn0.5O3 with, from top to bottom, the spectra collected for the pristine electrode and the electrodes charged to 4 V, 4.6 V, and discharged to 2.0 V. The first charge/discharge of Li1.2Ni0.13Co0.13Mn0.54O2: (c) voltage profile over the first cycle, (b) XPS core peaks O 1s, (c) fraction of lattice oxygen attributed to peroxo-like species. Reprinted by permission from Nature Materials (Copyright 2013) ref. 169. Reproduced under CC-BY licence from ref. 166. | ||
The anionic redox process alongside the first cycle of Li-rich layered oxide Li1.2Ni0.13Co0.13Mn0.54O2 at different states of charge/discharge (Fig. 21b) was also investigated by XPS.166 The evolution of O 1s core peaks are shown in Fig. 21c. No change from the pristine electrode to 4 V occurs, while the characteristic peroxo-like component (a new peak at 530.5 eV) is identified at 4.3, 4.6, and 4.8 V. Upon discharge, the peroxo-like signature disappears and, as compared to the pristine, a similar shape of the spectrum is restored, with only some more oxygenated deposited species. These results are consistent with a redox activity of oxygen and support that oxidation of oxide ions occurs just before and during the high-voltage plateau. It can be seen that a significant involvement of the oxygen lattice is observed through XPS for Li1.2Ni0.13Co0.13Mn0.54O2 electrode with a peroxo contribution, and the relative portion of peroxo-like species is provided in Fig. 21d.
Apart from in-house XPS measurements, HAXPES is a very helpful technique to understand the redox evolution of the lattice oxygen, since the chemical state information on the lattice structure buried beneath the surface-oxygenated products can be effectively detected due to its deeper probing depth.170,171 By virtue of HAXPES analysis, Shimoda et al. confirmed the formation of O− ions as bulk oxygen species in the Li-rich Li[Li0.25Ni0.20Mn0.55]O1.93 material during initial charge/discharge processes.172 Overall, all these works demonstrate that XPS is a powerful tool for understanding cationic/anionic redox mechanisms in high-capacity electrode materials.
4 In situ and operando XPS measurements
4.1 All-solid-state batteries
As described in the previous sections, the interfaces between the electrolyte and the electrodes and the formed interphases are crucial in the battery function and durability. In the case of solid electrolytes, four kinds of interphases can be described:
• The stable interphase: an interface between the solid electrolyte and the electrode where no reactions occur.
• The mixed conducting interphase (MCI): in this case the solid electrolyte reacts with the electrode and forms an interphase having both good electronic and ionic conductivity. It can be considered unstable as electron transfer will allow a continuous growth of the interphase.
• The solid electrolyte interphase (SEI): in this case the solid electrolyte also reacts with the electrode but the formed interphase has a poor electronic conductivity and an ionic conductivity high enough to allow a good functioning of the battery. The low electronic conductivity generally makes this interphase electrochemically stable, but not necessarily mechanically or chemically stable.
• The blocking interphase: an interphase with a too low ionic conductivity that would lead to the battery failing.
From these four interphases, only three are functional: the stable interphase, the MCI and the SEI, which are illustrated in Fig. 22. It is clear that the interfaces in ASSBs need to be well understood but they are difficult to access by surface-sensitive techniques and their analysis is mainly restricted to electrochemical measurements which are chemically unspecific. XPS is therefore a technique of choice to characterise them. Indeed, the advantage of ASSBs compared to standard batteries using liquid electrolytes is that they can be stable under ultra-high vacuum that is often needed for XPS analysis. In this part we review various XPS studies as applied to ASSBs.
 | ||
| Fig. 22 Interphases in ASSBs. (a) The stable interphase. (b) The mixed conducting interphase (MCI). (c) The solid electrolyte interphase (SEI). Reprinted from ref. 175, with permission from Elsevier. | ||
 | ||
| Fig. 23 (a) Scheme of a typical all-solid-state cell. (b) XPS measurements of the different parts of all-solid-state cell after different number of electrochemical cycling. Reprinted from ref. 177, with permission from Elsevier. | ||
These examples show that ex situ XPS is interesting to understand the interphases in ASSBs. However, ex situ analyses suffer from experimental limitations. Various relaxation processes can occur after the reaction of the electrolyte with the electrode material. The samples can also be contaminated during their preparation. Finally, using several samples for different states of charge or time of contact with an electrode, may lead difficulties in energy calibration and component assignment.182 To overcome these drawbacks, different strategies are available as follows.
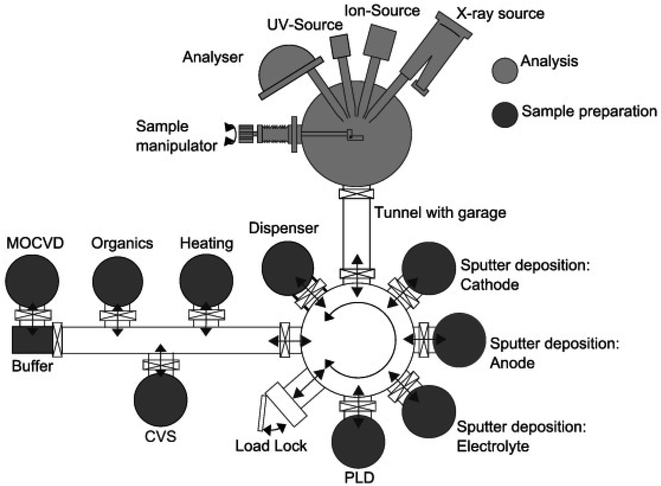 | ||
| Fig. 24 Example of in vacuo system with the DAISY-BAT having its deposition chambers connected to an XPS analysis unit, all being under vacuum. Reprinted from ref. 188, with permission from Elsevier. | ||
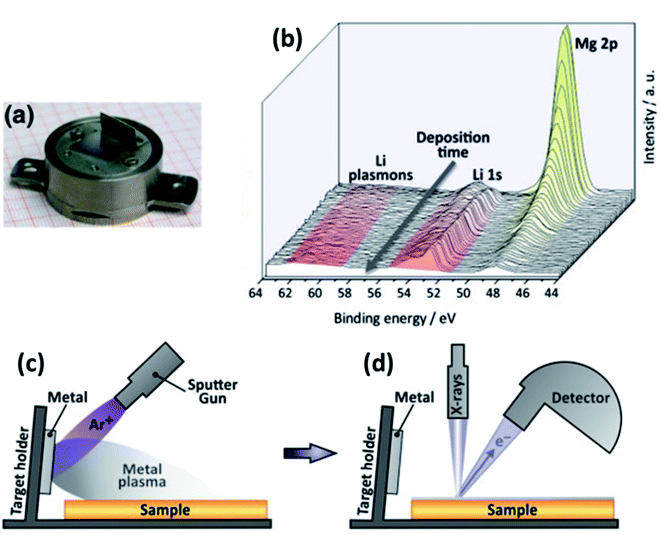 | ||
| Fig. 25 An experimental set-up for in situ XPS. (a) Modified XPS sample holder with electrode active material target. (b) Calibration XPS measurement of Li sputtering onto MgO substrate. (c) Illustration of the in situ sputtering using an ion gun. (d) Illustration of the XPS analysis after in situ sputtering. Reprinted from ref. 175, with permission from Elsevier. | ||
Wenzel et al. studied LLTO by the described in situ methodology. They first observed the intensity of the signal from LLTO decreasing because of the deposition of a thin layer of Li. Nevertheless, the signal of Li 1s from Li metal was not detected meaning that the atoms of Li reacted rapidly with the solid electrolyte. Only the Ti 2p signal was affected during the Li deposition. The modification of the Ti 2p signals was due to the reduction of Ti passing from Ti4+ to lower oxidation states Ti3+, Ti2+ and Ti0. They could quantify each of these species and show that while Ti3+ and Ti2+ were reaching a maximum, Ti4+ was constantly decreasing and Ti0 increasing. It confirmed the solid electrolyte reduction by Li metal. The ex situ observation of the solid electrolyte reduction showed only the formation of Ti3+, meaning that the simple contact of LLTO with Li was insufficient to observe the complete reaction. The reduction of LLTO leads to the formation of an interphase with higher electronic conductivity; this was confirmed by alternating current impedance spectroscopy. This interphase is an MCI and it explained why LLTO is so unstable versus Li.175 It is line with previous observation from Yang et al.176 This first example shows that in situ XPS coupled with other techniques such as impedance spectroscopy is powerful to determine the stability of an interphase. Wenzel et al. studied also Li10GeP2S12 (LGPS).190 They first used electrochemical measurements, including time-resolved impedance spectroscopy, to observe the evolution of the interphase between the solid electrolyte and the Li electrode. Two resistance-constant phase element (R//CPE) components were used in series to model the ionic conductivity of the solid electrolyte and the interphase. When they extracted the resistance of the interphase they saw that it increased very fast at the beginning, and thereafter slowing down. This observation indicated a fast formation of the interphase. With cyclic voltammetry, they measured the polarisation resistance at different times and observed the same behaviour as with impedance spectroscopy. They also performed in situ XPS to get more information about the interphase. The sample was cooled done to between −80 °C and −90 °C to avoid release of sulphur in the ultra-high vacuum environment and also to slow down the interfacial reactions. They could clearly see the reduction of Ge, P and S. Ge might be reduced to Ge metal or Li–Ge alloy, but the lack of data on these compounds made it hard to be conclusive. P was reduced forming Li3P which is unstable. S was forming Li2S which is the most common degradation product of sulphide-based electrolytes. Interestingly, they could quantify the amount of the different species upon Li deposition. The amount of reduced P was constantly increasing while Li2S increased at first before stabilising. With the combination of time-resolved electrochemical measurement and in situ XPS, they could determine the formation rate and the composition of the interphase of LGPS with Li. They could say that this interphase grew fast and was thick because of the formation of metallic species enhancing the electronic percolation through it. It formed an MCI. An MCI was also observed for Li1.6Al0.5Ge1.5(PO4)3 (LAGP), Li1.6Al0.5Ti0.95Ta0.5(PO4)3 (LATTP), and a commercial Ti- and Ge-containing material for the same reasons.189,191 Similarly, Wenzel et al. studied Li7P3S11. Performing time-resolved impedance spectroscopy on a Li/Li7P3S11/Li symmetrical cell, a resistance increase was seen, indicative of interphase formation. However, the resistance eventually reaches a stable value meaning that the interphase reached a kinetic equilibrium. To perform the XPS measurements, the sample was cooled down to −80 °C to avoid sulphur sublimation. They observed the reduction of Li7P3S11 with the formation of Li2S and Li3P (see Fig. 26). Their quantities increase fast before reaching a stable value. This stabilisation can be explained by the fact that the formed interphase was mainly made of Li2S which has poor ionic and electronic conductivity. These results matched the electrochemical ones and showed that the interphase between Li7P3S11 and Li metal can be considered as a stable SEI.192 The same group also studied Na3PS4. They showed electrochemically that the interphase resistance increased significantly, becoming the dominant contribution of the overall resistance after 10 h of contact with Na metal. The XPS measurements showed that the quantity of decomposition products, Na2S and Na3P, increases and seems to approach a limit but no saturation was reached during the time of measurement which might be due to the sluggish reaction kinetics at low temperature. There was also a large error for the quantification of P because of its small quantity and low photoionisation cross-section.193 They showed as well that Na-β′′-Al2O3 is perfectly stable versus Na metal.193 Zhang et al. showed that Na3Zr2Si2PO12 would form a stable SEI with Na. In their study, only a small amount of Zr and Si got reduced. The stabilisation of the interphase was also shown by impedance spectroscopy. After 15 min of contact between Na3Zr2Si2PO12 and Na, the interphase resistance stabilised and remained stable up to 30 days.194 The in situ XPS technique was also used to study the reaction between LiPSON and Li. It was observed that upon Li deposition, the signal for P and N decreased while that for Li2O and Li2S increased. From this, it could be concluded that the interphase that was formed in this case consists mainly of Li2O and Li2S rather than Li3N and Li3P as in the case of LiPON.188,195
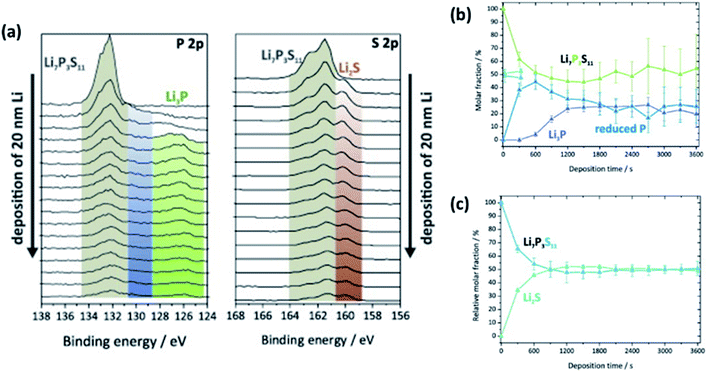 | ||
| Fig. 26 (a) In situ XPS measurements of Li7P3S11 solid electrolyte on which Li is deposited. Relative molar fractions of (b) phosphorus and (c) sulphur species for different times of Li deposition. Reprinted from ref. 192, with permission from Elsevier. | ||
Wood et al. proposed a different in situ XPS technique using what they called a “virtual electrode” (see Fig. 27). They build a cell made of Li3PS4 solid electrolyte pressed on a Li foil. Then they used a flux of low-energy electrons to attract Li+ ions at the bare electrolyte surface where they were reduced. This layer of Li could be removed applying UV photons ejecting valence electrons from Li metal. The formation of Li+ at the surface drove the Li+ migration towards the Li foil on the back of the stack. Using this technique, they could show the formation of an interphase made of Li2S and Li–P species but they had a problem of oxygen contamination.196
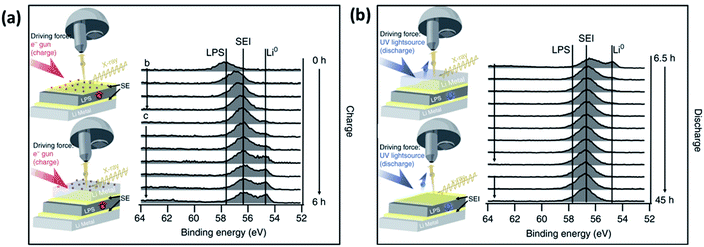 | ||
| Fig. 27 In situ XPS set-up using a “virtual electrode” and the resulting spectra in (a) charge and (b) discharge. Reprinted from ref. 196, under a CC-BY license. | ||
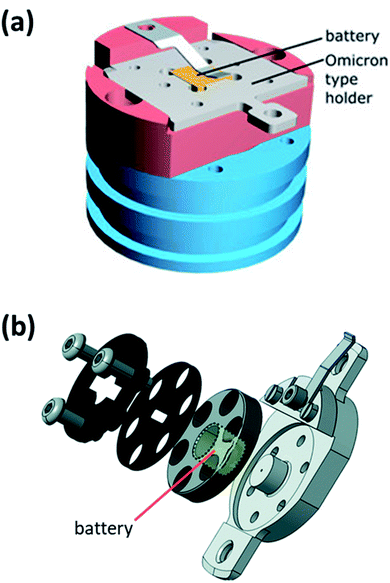 | ||
| Fig. 28 Different set-ups used for operando XPS. (a) Sample holder for micro-batteries. Reprinted from ref. 200, with permission from AIP Publishing. (b) Sample holder for bulk ASSBs. Reprinted from ref. 182. | ||
In 2000, Tonti et al. performed operando XPS measurements by coating Na-β′′-Al2O3 on TiS2. They cycled the cell using a thin graphite layer as counter electrode. They observed the intercalation of Na and after several cycles, the irreversible formation of Na2S and some Na metal.201 Tonti et al. repeated the experiment and this time they tried to measure the electrochemical potential of the TiS2 electrode from the XPS measurements. They used the shift of the binding energy upon cycling to determine a chemical potential of the Na ions and could correlate it with the actual potential of the TiS2 electrode.202 The same group prepared an ASSB using a pellet of homemade NASICON (Na3.3Sc0.3Zr1.7(SiO4)2(PO4)) with a thin film of NaxCoO2 cathode deposited by pulsed laser deposition (PLD). On the other side, a Pt counter electrode was sputtered. They observed that during cycling, the asymmetric signal due to different crystallographic positions for Na was decreasing as it was removed from the material during charge and increased again during discharge. From the Co 2p spectra, it was possible to see a shoulder growing next to the Co3+ signal. This shoulder was due to the formation of Co4+ during desodiation of the cathode. This kind of measurement allows the characterisation of the bulk active material without being affected by an SEI formation.200 It could be corroborated with other kinds of measurements to determine the complex electrochemical mechanisms. Wu et al. performed operando XPS on a classical ASSB made of pressed stacks of the different constituents of the battery. They used a glass electrolyte made of (Li2S)3–P2S5 (LPS), LCO composite cathode and lithium-indium alloy as anode. The cathode was a composite electrode made of a mixture of LPS, LCO and VGCF (vapour grown carbon nanofiber). The anode was made of two parts, the In–Li alloy separated from the solid electrolyte by a composite buffer layer made of In, LPS and VGCF. They performed the measurements during potentiostatic steps because of the time required to acquire the XPS spectra (see Fig. 29). For both S 2p and P 2p spectra a shoulder was observed upon cycling. These shoulders were due to the oxidation of the solid electrolyte with the formation of polysulphides, i.e. change in phosphorous environment from PS43− to P2Sx, and the polymerization reaction of PS43− tetrahedrons through the formation of bridging P–S–P and P–S–S–P bonds. The intensity of the shoulders decreased upon delithiation, confirming the redox-activity of the decomposition products. They also observed a shift of the binding energy upon cycling. This shift could be used to gain information on the possible overpotential experienced by the surface of the different materials in the working electrode (WE). It is interesting to note that the operando XPS could allow to have a quite precise idea of what is the actual potential at which the oxidation of a solid electrolyte happens as the decomposition products are directly probed. They measured a linear correlation between the applied voltage and the binding energy shift. They could determine that all the conductive species were following the applied working electrode voltage change. The solid electrolyte surface, on the other hand, did not follow the applied voltage change, as it is insulating and thus not in electronic equilibrium with the working electrode. Another experiment performed without VGCF in the working electrode showed that the LCO still did not experience an overpotential and thus a working electrode without carbon could be used to increase the energy density and decrease the decomposition of the solid electrolyte as LCO has a lower specific surface area than VGCF.182 Liu et al. also performed operando measurements to study the interphase stability of LLZO against LFP (LiFePO4). They observed a shift in binding energy proportional to the applied voltage as described by Wu et al. The interphase between LLZO and LFP was stable as no evolution of the spectra was observed upon cycling, even after 100 cycles.186
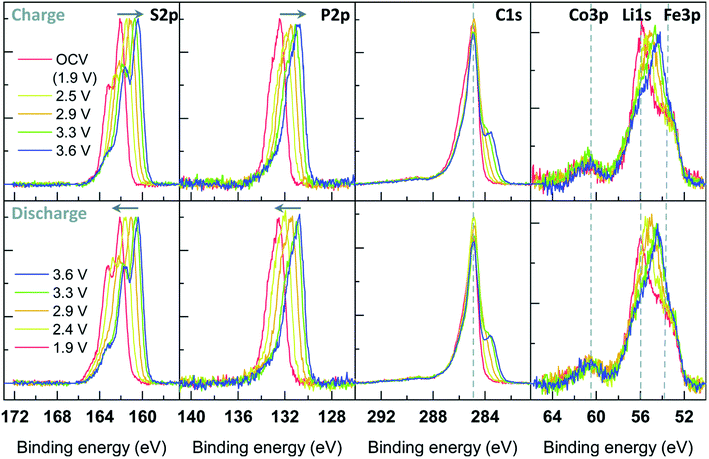 | ||
| Fig. 29 Operando XPS experimental results during potentiostatic measurement of a working electrode made of 45 wt% LCO, 50 wt% amorphous (Li2S)3–P2S5 and 5 wt% VGCF cycled vs. InLix. Reprinted from ref. 182. | ||
4.2 Liquid electrolyte systems
A first step towards achieving this was realized when XPS instruments were developed to allow for measurements at near-ambient pressures. With near-ambient pressures both gases and most liquids can be kept stable within the analysis chamber, making it possible to probe solid/gas, liquid/gas and solid/liquid interfaces of importance for many different research areas, including catalysis, environmental science and electrochemistry.203–206 In this review focus is placed on how APXPS can be used for electrochemical applications, and in particular for the study of liquid electrolyte/electrode interfaces in batteries. Important improvements of the instruments and methodology are presented, and different methods to investigate the solid/liquid interfaces as well as important results are highlighted. Although several successful studies have already been performed on solid/liquid interfaces, these measurements remain very challenging. A continued development of the instruments and methodology is necessary to further enhance the signal from the interface, in order to facilitate operando measurements on 'real' batteries.
Today, APXPS instruments are available both in-house212 and at synchrotron facilities.213 A typical instrument design is shown in Fig. 30.211 Considering the discussion above, the aperture size R is usually in the order of 0.1–1 mm, allowing for pressures up to ∼100 mbar.214,215 Synchrotron light with well-focused beams has allowed for decreasing the slit width without losing many photoelectron counts. In addition to this, the differential pumping stages have been developed with the addition of electron lenses, to make sure the electrons are focused on the analyser openings. In this way, significantly higher count rates can be realized, despite the small apertures. These developments have allowed for increasing the maximum pressures available by several orders of magnitude compared to the first instruments.216–218
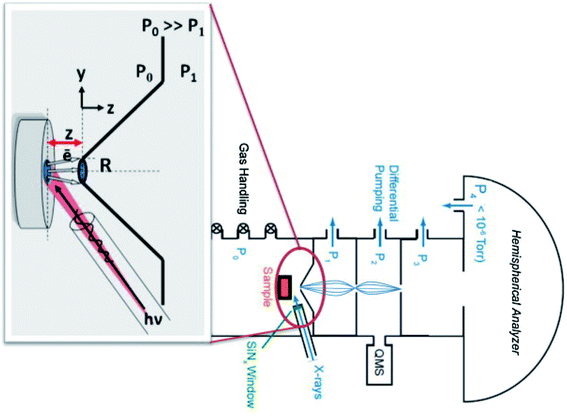 | ||
| Fig. 30 A schematic illustration of an APXPS instrument. Reprinted from ref. 211, with permission from Elsevier. | ||
Using this type of setup, several measurements on solid/gas and liquid/gas interfaces have been realized. However, since several of the instruments available use soft X-rays (<2000 eV) solid/liquid interfaces remains a challenge to access due to the limited IMFP of electrons through liquids (in the order of nm). Thus, to be able to probe the interface, either the liquid layer or the solid layer must be very thin. The most common approach to achieve this for electrochemical measurements is the ‘dip-and-pull’ approach,214,219 where the solid sample (electrode) is immersed in the liquid (electrolyte) and then slowly pulled up to create a thin liquid meniscus.220 If the wetting between the solid sample and the liquid is favourable (the contact angle is small) a measurement point at the end of the meniscus will exist where the liquid is thin enough to see through. An alternative way to probe the solid/liquid interface is to use a thin solid membrane that can be probed through to see also the bulk liquid.221 In both cases, it is important that the setup can be made as realistic as possible, to gain the most useful results.
Once a solid/liquid interface has been created, the final step for operando measurements on batteries is to design a setup where also electrochemical measurements can be performed. This can relatively easily be realized building on the dip-and-pull method. To create an electrochemical cell, an electrolyte beaker is placed in the APXPS chamber (commonly on a bottom plate connected to a manipulator), and then three electrodes are connected to an electrode housing attached to a top manipulator. The electrode housing can then be then lowered to immerse the electrodes in the electrolyte, creating a working electrochemical cell. To create the solid/liquid interface to be measured, the electrodes are dipped in the electrolyte and then slowly retracted from the beaker. The electrode of interest (usually the working electrode) is put in front of the analyser, with the counter and reference electrode mounted behind it. This setup is schematically illustrated in Fig. 31. While APXPS instrument are becoming more commonplace, the capability of performing electrochemical measurements simultaneously is not readily available. Currently, there are only a few beamlines in the world with an electrochemical setup allowing for operando APXPS measurements of solid/liquid interfaces.214,222
 | ||
| Fig. 31 (a) Illustration of the electrolyte beaker and electrode housing used for the dip-and-pull method. (b) Pt 4f and O 1s spectra recorded at two different voltages. A shift in energy is seen for the O 1s peak stemming from the electrolyte, while the Pt signal (stemming from the working electrode) remains fixed. Reproduced under CC-BY licence from ref. 214. | ||
Due to its sensitivity towards different chemical environments, APXPS is a highly useful tool to investigate the electronic structure of the solvated ions in different electrolyte solvents. El Kazzi et al.224 use a liquid jet setup to show that the ion electronic structure changes as a result from different solvation environments, depending on the solvent used. Also, smaller amounts of additives can change the ion electronic structure, which can be crucial for electrical double layer (EDL) and SEI formation. In addition, Maibach et al.225 investigate a static liquid droplet, and show that the presence of salt changes the stability of the drop and affect the solvation of hydrocarbons. It is also seen that the ions are accumulated at the surface, forming an ion concentration gradient towards the bulk of the drop.
Since APXPS not only can probe the chemical environment and oxidation state of an element, but also changes in electron electrochemical potential differences, it is an optimal tool to study the reactions occurring in an electrochemical cell during cycling. For example, Favaro et al.219 have shown that APXPS can be used to study the EDL built up at any charged surface. In this experiment a polycrystalline gold working electrode is used together with a water based 0.1–80.0 mM potassium hydroxide with 1.0 M pyrazine electrolyte. Using the dip-and-pull methodology, a thin liquid meniscus is created (∼30 nm), allowing for probing the solid/liquid interface. The solid/liquid interface is probed at different applied voltages to the WE. As indicated in Fig. 32, the full width half maximum (FWHM) of the spectroscopic peaks can be correlated to the voltage drop. This is explained by a relative shift in BE of the liquid water depending on the local electrochemical potential, that will vary within the EDL. Favaro et al.219 also show that the measured FWHM correlates well with electrochemical measurements of the double layer capacitance, and can also be used to localize the point of zero charge.
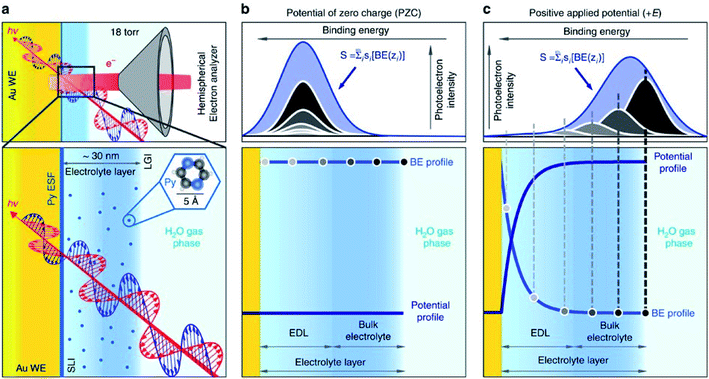 | ||
| Fig. 32 (a) Schematic illustration of the measurement setup. (b) At the point of zero charge, there is no charged layer at the gold electrode/electrolyte interface, and the binding energy is the same throughout the electrolyte. (c) When a voltage is applied to the electrode, an EDL is formed, resulting in a voltage gradient over the EDL layer. This gradient can be studied by the increased FWHM of the electrolyte peak measured by APXPS. Reproduced under CC-BY licence from ref. 219. | ||
Another study investigating the solid/liquid interface operando is performed by Axnanda et al.214 This study is pioneering in showing the electrochemical functionality of the thin liquid meniscus. The thickness and electrochemical properties of the liquid meniscus is in this study investigated for a platinum working electrode and a water based 6 M KF solution as electrolyte. The authors compare the intensity of the Pt peak before and after the dip-and-pull procedure to estimate the liquid layer thickness, which is calculated to 13 nm. Further, simulations of a model interface are used to estimate the optimal photon energy to maximize the signal from the interface, which in this case would be approximately 4 keV. To confirm that the electrolyte layer is conductive and in contact with the bulk electrolyte the shifts in BE of the PE peaks stemming from the electrolyte components are studied, as shown in Fig. 33(b) and (c). Finally, the functionality of the thin electrolyte layer is tested by holding the voltage of the Pt WE at an oxygen evolution reaction potential while measuring XPS operando. Although improvements in signal-to-noise ratio is required to fully analyse the oxidation of the platinum electrode, new higher BE peaks can be identified, as seen in Fig. 33(d), showing that the Pt can be oxidized during the APXPS measurements, and that the thin electrolyte layer is electrochemically active and functional.
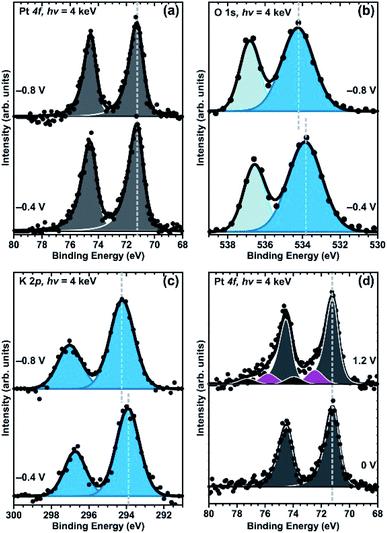 | ||
| Fig. 33 APXPS spectra of Pt 4f (a) and (d) O 1s (b), and K 2p (c) core levels. The relative shifts of the electrolyte peaks (both salt and solvent) confirm the conductivity of the liquid layer, and the oxidation of the Pt electrode can be identified through the high binding energy peaks in (d). Reproduced under CC-BY licence from ref. 214. | ||
From the many studies performed on SEI layers ex situ, it is known that these interphases are highly complex and consists of different degradation products stemming from electrode side reactions, electrolyte reduction and salt degradation. Since the interphase layer is made up by reactions between the solid and liquid, it is challenging to extract the signal stemming from the interphase, especially since the signal is attenuated by the liquid layer. To enhance the signal from the interphase as much as possible, it is useful to be able to tune the photon energy. Depending on the thickness of the liquid electrolyte layer, photon energies corresponding to tender X-rays (2–7 keV) are usually preferable.226
In addition, to be able to form a thin liquid layer, the contact angle between the solid and liquid has to be small. To achieve this the surface geometry as well as the sample composition is important. Hence, for some material combinations where liquid droplets are formed on the solid surface rather than thin films, it might not be possible to probe the solid/liquid interface with the dip-and-pull method. For battery materials this can be an issue for porous composite electrodes, which are generally used in commercial batteries to ensure a well-functioning ion transport. The pores improve the wetting of the material, which in the case of APXPS can cause the whole electrode to become soaked and thereby prevent probing the solid underneath the (too thick) liquid layer. This can be avoided by using dense thin film electrodes, only consisting of the active material (no conductive additives or binder). Thus, to study the solid/liquid interface directly the wetting properties need to be carefully considered.
In two recent papers by Källquist et al. the potential differences over the solid/liquid interface are probed for a model system,227 and for a battery cell consisting of LTO as WE, LCO as CE and a Li metal as RE.228 In these studies, results from probing only the liquid (not the interface) are presented and discussed. It is shown that during charge transfer over the solid/liquid interface, the shifts seen in kinetic energy of the electrolyte peaks deviates from a 1 eV/V slope, expected during EDL charging (i.e. when no charge transfer occurs). The results show that the electron electrochemical potential of the electrolyte is changed versus the RE, indicating an excess of charges in the electrolyte while the battery is cycled. It is suggested that the driving force for the change in electron electrochemical potential of the electrolyte stems from the movement of Li-ions over the interface, in order to equilibrate the Li-ion electrochemical potential. Finally, it is seen that the shifts in kinetic energy of the electrolyte peaks depend on the reactions occurring at the interface, where a phase transition reaction, single phase reaction, or pure EDL-charging gives substantially different shifts. This is illustrated in Fig. 34.
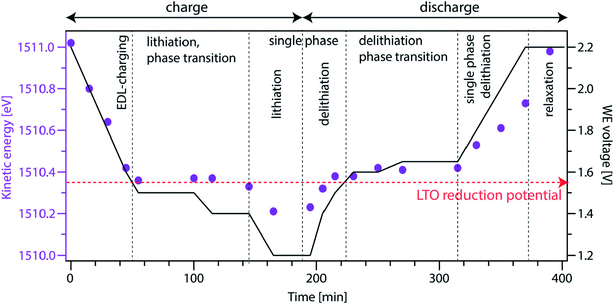 | ||
| Fig. 34 Kinetic energy of the electrolyte peaks as a function of time (purple dots) and WE voltage as a function of time (black line). The kinetic energy shifts of the electrolyte are different depending on the type of reactions occurring at the WE/electrolyte interface. Reproduced under CC-BY licence from ref. 228. | ||
Using operando APXPS it is thus possible to follow the electron electrochemical potential of the electrolyte directly (which cannot be achieved by pure electrochemical measurements). Furthermore, it is possible to gain insights of the changes in Li chemical potential of the WE depending on the shifts of the electrolyte peaks as a function of WE voltage. This information can be highly useful to further understand the kinetics of the redox reactions occurring at the solid/liquid interface.
So far, operando APXPS measurements on solid/liquid interfaces of battery systems are scarce, and recognized as highly challenging measurements due to the thickness limitation inherent to the APXPS technique, while the cell still needs to be functional from an electrochemical perspective. Today, numerous operando studies have been performed on solid-state batteries (see Section 4.1.5) and operando studies have also been successfully performed on ionic liquids (facilitated by their low vapour pressure).229 These studies show that operando (AP)XPS has unique capabilities to provide information on oxidation state, potential differences and surface layer formation during battery cycling. In addition, the measurements of bulk liquid phases show that there are in principle nothing preventing operando APXPS studies of solid/liquid interfaces, although the slow ionic transport in a nm thin meniscus needs to be considered when interpreting the results and kinetics of the system. Proof of concept operando measurements have also been published in the paper by Zhu et al.,222 where a thin film LCO electrode is used to successfully probe the solid/liquid interface during battery cycling using an APXPS setup at MAX IV. Based on these promising studies, it is our strong belief that these emerging measurements will become more and more common in the coming years.
5 Summary and perspectives
The use of XPS for routine measurements of battery materials has increased significantly in recent years, particularly in the past decade. This is most definitely a result of increasing research focus within the battery field, but likely also due to a realisation that interfacial studies of batteries are necessary in understanding their performance and to advance the knowledge. XPS has proven itself to be the go-to technique for battery interface studies. A basic characterisation of battery materials already comes with its own challenges, especially involving some important considerations to make when measuring samples ex situ (i.e. sample storage, washing). However, many XPS instruments allow for more complicated experiments to be performed as well, including angle-resolved XPS and sputter-etching. Therefore, XPS has been shown to be a highly versatile and multi-faceted technique that can be used to explore battery materials in a number of different ways.In this review we have focused on some of the experimental and analysis considerations that should be made, especially for battery materials that are often very reactive when exposed to the atmosphere and due to their often-complex composite structures. We have opted to present a snapshot of the latest uses of XPS in the advancing lithium-ion battery field, as well as how it is helping to overcome challenges posed by new technologies beyond lithium-ion. For many such technologies, XPS is an invaluable tool to study the interfacial reactions of electrodes when in contact with the electrolyte. This is especially true for the upcoming SIBs, which suffer from instabilities at the interfaces much more than what is considered for LIBs.
XPS offers the possibility to gain a large amount of information about a sample, covering not only the chemical composition, structure and thickness of a surface layer, but also oxidation states of transition metals and other elements in the bulk material structure. Depth profiles studying both the surface and bulk regions can be created using various methodologies, but particularly interesting is to use synchrotron radiation where the photon energy can be varied to probe multiple depths. This expands the information gained about the sample to determine, for example, the structure of a surface layer or to understand the charge compensation mechanisms for an active material.
The technique itself is also under constant development, and innovative new in situ or operando methodologies to study solid-state batteries present exciting ways to advance the understanding of how materials in such systems function and what are their limitations. Likewise, for liquid electrolyte systems, ambient-pressure methodologies being developed offer an excellent way to study the fundamental reactions between electrode materials and various components of a liquid electrolyte.
The use of XPS to study battery materials and the development of the technique itself is helping to advance the battery field and push the limits of existing and next-generation technologies. It is helping to answer questions about battery interfaces, both from a very fundamental point of view, whilst also allowing investigations from a highly applied and industrial perspective. It is expected that work from both standpoints will become even more widespread and thorough in the future, in order to address the challenges posed with regard to battery interface chemistry. With advances in high throughput experimentation, we expect that even larger amounts of data that are collected during measurements will require novel analysis methodologies. This will likely include the use of machine learning algorithms and extensive libraries of reference compounds, as well as advanced computational methods to rationalise experimental data by prediction of interfacial reactions in batteries. This will certainly become more relevant with increasingly complex systems, which perhaps involve materials coatings, mixed/composite active materials, and electrolytes with even more components than currently. Fundamental studies of the electrolyte reactions at electrode surfaces are becoming more important than ever as we seek stable interfaces. We expect, therefore, that ambient-pressure measurements for in situ or operando experiments will become increasingly relevant and will improve the understanding of electrolyte decomposition in ‘real’ battery systems. Likewise, as the interest in solid-state batteries grows, operando XPS on such systems will become more routine. This is something, however, that still requires a large amount of development.
While we are only just seeing the initial growth of XPS studies for battery materials, there remains many avenues for continued development of the technique and potential for major breakthroughs in the battery field.
List of abbreviations
| 18C6 (cyclic ether) | 1,4,7,10,13,16-Hexaoxacyclooctadecane |
| AFM | Atomic force microscopy |
| ALS | Advanced light source |
| APXPS | Ambient-pressure X-ray photoelectron spectroscopy |
| ASSB | All-solid-state battery |
| BE | Binding energy |
| BESSY | Berlin electron storage ring society for synchrotron radiation |
| C222 (cyclic ether) | 4,7,13,16,21,24-Hexaoxa-1,10-diazabicyclo hexacosane |
| CE | Counter electrode |
| CEI | Cathode electrolyte interphase |
| CVS | Chemical vapour synthesis |
| CPE | Constant phase element |
| DAISY-BAT | DArmstadt Integrated SYstem for BATtery Research |
| DAISY-MAT | DArmstadt Integrated SYstem for MATerials Research |
| DEC | Diethyl carbonate |
| DMC | Dimethyl carbonate |
| EC | Ethylene carbonate |
| EDL | Electrical double layer |
| EDS | Energy-dispersive X-ray spectroscopy |
| EELS | Electron energy loss spectroscopy |
| EMC | Ethyl methyl carbonate |
| ESCA | Electron spectroscopy for chemical analysis |
| EXAFS | Extended X-ray absorption fine structure |
| FEC | Fluoroethylene carbonate |
| FWHM | Full width half maximum |
| FY | Fluorescence yield |
| G1 | Monoglyme; dimethoxyethane |
| G2 | Diglyme; bis(2-methoxyethyl) ether |
| G3 | Triglyme; triethylene glycol dimethyl ether |
| G4 | Tetraglyme; tetraethylene glycol dimethyl ether |
| GCIS | Gas cluster ion sputtering |
| GI-XRD | Grazing incidence X-ray diffraction |
| GPE | Gel polymer electrolyte |
| HAXPES | Hard X-ray photoelectron spectroscopy |
| IHP | Inner Helmholtz plane |
| IMFP | Inelastic mean free path |
| KIB | Potassium-ion battery |
| LAGP | Li1.6Al0.5Ge1.5(PO4)3 |
| LATTP | Li1.6Al0.5Ti0.95Ta0.5(PO4)3 |
| LCO | LiCoO2 |
| LFP | LiFePO4 |
| LGPS | Li10GeP2S12 |
| LIB | Lithium-ion battery |
| LiBOB | Lithium bis(oxalato)borate |
| LiODFB | Lithium difluoro(oxalato)borate |
| LiPON | Lithium phosphorus oxynitride |
| LiPSON | Lithium phosphorous sulfuric oxynitride |
| LLTO | La0.56Li0.33TiO3 |
| LLZO | Li7La3Zr2O12 |
| LNMO | LiNi0.5Mn1.5O4 |
| LPS | (Li2S)3–P2S5 |
| LTO | Li4Ti5O12 |
| MCI | Mixed conducting interphase |
| MOCVD | Metal organic chemical vapour deposition |
| NASICON | Na3.3Sc0.3Zr1.7(SiO4)2(PO4) |
| NCA | LiNi1−x−yCoxAlyO2 |
| NMC | LiNi1−x−yCoxMnyO2 |
| OCV | Open circuit voltage |
| OHP | Outer Helmholtz plane |
| PAN | Polyacrylonitrile |
| PC | Propylene carbonate |
| PCL | Polycaprolactone |
| PEO | Polyethylene oxide |
| PES | Photoelectron spectroscopy |
| PLD | Pulsed laser deposition |
| PTMC | Poly(trimethylene carbonate) |
| PVDF | Polyvinylidene fluoride |
| PVN | Poly(vinylene carbonate-acrylonitrile) |
| RE | Reference electrode |
| SEI | Solid electrolyte interphase |
| SEM | Scanning electron microscopy |
| SIB | Sodium-ion battery |
| SOXPES | Soft X-ray photoelectron spectroscopy |
| SPE | Solid polymer electrolyte |
| SPM | Scanning probe microscopy |
| TEM | Transmission electron microscopy |
| TEY | Total electron yield |
| TFSA | Bis(trifluoromethylsulfonyl)amide |
| TFSI | Bis(trifluoromethanesulfonyl)imide |
| TMSPi | Tris(trimethylsilyl) phosphite |
| ToF-SIMS | Time of flight – secondary ion mass spectrometry |
| TPP-2M | Equation of Tanuma, Powell, and Penn |
| UHV | Ultra-high vacuum |
| VC | Vinylene carbonate |
| VGCF | Vapour grown carbon nanofibres |
| WE | Working electrode |
| XANES | X-ray absorption near-edge structure |
| XAS | X-ray absorption spectroscopy |
| XPS | X-ray photoelectron spectroscopy |
| XRR | X-ray reflectivity |
Conflicts of interest
There are no conflicts of interest to declare.Acknowledgements
The authors acknowledge funding from the BIG-MAP project. This project has received funding from the European Union's Horizon 2020 research and innovation programme under grant agreement No. 957189. The project is part of BATTERY 2030+, the large-scale European research initiative for inventing the sustainable batteries of the future. Financial support from ST and UP for Energy to the Ångström Advanced Battery Centre is also acknowledged.References
- H. D. Yoo, E. Markevich, G. Salitra, D. Sharon and D. Aurbach, Mater. Today, 2014, 17, 110–121 CrossRef CAS.
- J. B. Goodenough and K. S. Park, J. Am. Chem. Soc., 2013, 135, 1167–1176 CrossRef CAS PubMed.
- T. Placke, R. Kloepsch, S. Dühnen and M. Winter, J. Solid State Electrochem., 2017, 21, 1939–1964 CrossRef CAS.
- J. Xu, F. Lin, M. M. Doeff and W. Tong, J. Mater. Chem. A, 2017, 5, 874–901 RSC.
- A. Manthiram, J. C. Knight, S.-T. Myung, S.-M. Oh and Y.-K. Sun, Adv. Energy Mater., 2016, 6, 1501010 CrossRef.
- E. Peled and S. Menkin, J. Electrochem. Soc., 2017, 164, A1703–A1719 CrossRef CAS.
- J. Li, C. Ma, M. Chi, C. Liang and N. J. Dudney, Adv. Energy Mater., 2015, 5, 1401408 CrossRef.
- Y. Xiao, Y. Wang, S.-H. Bo, J. C. Kim, L. J. Miara and G. Ceder, Nat. Rev. Mater., 2020, 5, 105–126 CrossRef CAS.
- A. El Kharbachi, O. Zavorotynska, M. Latroche, F. Cuevas, V. Yartys and M. Fichtner, J. Alloys Compd., 2020, 817, 153261 CrossRef CAS.
- C. P. Grey and D. S. Hall, Nat. Commun., 2020, 11, 6279 CrossRef CAS PubMed.
- Y. Tian, G. Zeng, A. Rutt, T. Shi, H. Kim, J. Wang, J. Koettgen, Y. Sun, B. Ouyang, T. Chen, Z. Lun, Z. Rong, K. Persson and G. Ceder, Chem. Rev., 2021, 121, 1623–1669 CrossRef CAS PubMed.
- M. Á. Muñoz-Márquez, D. Saurel, J. L. Gómez-Cámer, M. Casas-Cabanas, E. Castillo-Martínez and T. Rojo, Adv. Energy Mater., 2017, 7, 1700463 CrossRef.
- A. J. Naylor, M. Carboni, M. Valvo and R. Younesi, ACS Appl. Mater. Interfaces, 2019, 11, 45636–45645 CrossRef CAS PubMed.
- A. Ponrouch, J. Bitenc, R. Dominko, N. Lindahl, P. Johansson and M. R. Palacin, Energy Storage Mater., 2019, 20, 253–262 CrossRef.
- R. Dominko, J. Bitenc, R. Berthelot, M. Gauthier, G. Pagot and V. Di Noto, J. Power Sources, 2020, 478, 229027 CrossRef CAS.
- M. T. Lee, H. Liu and D. Brandell, Batteries Supercaps, 2020, 3, 1370–1376 CrossRef CAS.
- M. A. Rahman, X. Wang and C. Wen, J. Electrochem. Soc., 2013, 160, A1759–A1771 CrossRef CAS.
- C. R. Birkl, M. R. Roberts, E. McTurk, P. G. Bruce and D. A. Howey, J. Power Sources, 2017, 341, 373–386 CrossRef CAS.
- K. Edström, T. Gustafsson and J. O. Thomas, Electrochim. Acta, 2004, 50, 397–403 CrossRef.
- A. M. Tripathi, W. N. Su and B. J. Hwang, Chem. Soc. Rev., 2018, 47, 736–751 RSC.
- R. Hausbrand, G. Cherkashinin, M. Fingerle and W. Jaegermann, J. Electron Spectrosc. Relat. Phenom., 2017, 221, 65–78 CrossRef CAS.
- A. J. Cowan and L. J. Hardwick, Annu. Rev. Anal. Chem., 2019, 12, 323–346 CrossRef CAS PubMed.
- M. Gauthier, T. J. Carney, A. Grimaud, L. Giordano, N. Pour, H. H. Chang, D. P. Fenning, S. F. Lux, O. Paschos, C. Bauer, F. Maglia, S. Lupart, P. Lamp and Y. Shao-Horn, J. Phys. Chem. Lett., 2015, 6, 4653–4672 CrossRef CAS PubMed.
- J. Lu, T. Wu and K. Amine, Nat. Energy, 2017, 2, 17011 CrossRef CAS.
- T. Waldmann, A. Iturrondobeitia, M. Kasper, N. Ghanbari, F. Aguesse, E. Bekaert, L. Daniel, S. Genies, I. J. Gordon, M. W. Löble, E. De Vito and M. Wohlfahrt-Mehrens, J. Electrochem. Soc., 2016, 163, A2149–A2164 CrossRef CAS.
- Y. Yuan, K. Amine, J. Lu and R. Shahbazian-Yassar, Nat. Commun., 2017, 8, 1–14 CrossRef PubMed.
- J. Wu, M. Fenech, R. F. Webster, R. D. Tilley and N. Sharma, Sustainable Energy Fuels, 2019, 3, 1623–1646 RSC.
- M. Mirolo, D. Leanza, L. Höltschi, C. Jordy, V. Pelé, P. Novák, M. El Kazzi and C. A. F. Vaz, Anal. Chem., 2020, 92, 3023–3031 CrossRef CAS PubMed.
- I. V. Veryovkin, C. E. Tripa, A. V. Zinovev, S. V. Baryshev, Y. Li and D. P. Abraham, Nucl. Instrum. Methods Phys. Res., Sect. B, 2014, 332, 368–372 CrossRef CAS.
- T. Sui, B. Song, J. Dluhos, L. Lu and A. M. Korsunsky, Nano Energy, 2015, 17, 254–260 CrossRef CAS.
- S. M. Bak, Z. Shadike, R. Lin, X. Yu and X. Q. Yang, NPG Asia Mater., 2018, 10, 563–580 CrossRef.
- P. Ghigna and E. Quartarone, JPhys Energy, 2021, 3, 032006 CrossRef CAS.
- S. M. Bhaway, Z. Qiang, Y. Xia, X. Xia, B. Lee, K. G. Yager, L. Zhang, K. Kisslinger, Y. M. Chen, K. Liu, Y. Zhu and B. D. Vogt, ACS Nano, 2017, 11, 1443–1454 CrossRef CAS PubMed.
- A. V. Llewellyn, A. Matruglio, D. J. L. Brett, R. Jervis and P. R. Shearing, Condens. Matter, 2020, 5, 1–28 Search PubMed.
- C. Cao, H. G. Steinrück, B. Shyam, K. H. Stone and M. F. Toney, Nano Lett., 2016, 16, 7394–7401 CrossRef CAS PubMed.
- H. Rensmo and H. Siegbahn, Chimia, 2015, 69, 22–29 CrossRef CAS PubMed.
- C. J. Powell and A. Jablonski, Nucl. Instrum. Methods Phys. Res., Sect. A, 2009, 601, 54–65 CrossRef CAS.
- C. J. Powell and A. Jablonski, NIST Electron Inelastic-Mean-Free-Path Database, Version 1.2, SRD 71, National Institute of Standards and Technology, Gaithersburg, MD, 2010 Search PubMed.
- B. F. Spencer, S. Maniyarasu, B. P. Reed, D. J. H. Cant, R. Ahumada-Lazo, A. G. Thomas, C. A. Muryn, M. Maschek, S. K. Eriksson, T. Wiell, T. L. Lee, S. Tougaard, A. G. Shard and W. R. Flavell, Appl. Surf. Sci., 2021, 541, 148635 CrossRef CAS.
- C. Kalha, N. K. Fernando, P. Bhatt, F. O. L. Johansson, A. Lindblad, H. Rensmo, L. Z. Medina, R. Lindblad, S. Siol, L. P. H. Jeurgens, C. Cancellieri, K. Rossnagel, K. Medjanik, G. Schonhense, M. Simon, A. X. Gray, S. Nemsak, P. Lomker, C. Schlueter and A. Regoutz, J. Phys.: Condens. Matter, 2021, 33, 233001 CrossRef CAS PubMed.
- T. L. Lee and D. A. Duncan, J. Synchrotron Radiat., 2018, 31, 16–22 CrossRef.
- O. Sambalova, E. Billeter, J. Mann, T. Miyayama, D. Burnat, A. Heel, D. Bleiner and A. Borgschulte, Surf. Interface Anal., 2020, 52, 811–817 CrossRef CAS.
- K. Ciosek Högström, The Complex Nature of the Electrode/Electrolyte Interfaces in Li-ion Batteries: Towards Understanding the Role of Electrolytes and Additives Using Photoelectron Spectroscopy, PhD thesis, Uppsala University, 2014 Search PubMed.
- M. R. Linford, V. S. Smentkowski, J. T. Grant, C. R. Brundle, P. M. A. Sherwood, M. C. Biesinger, J. Terry, K. Artyushkova, A. Herrera-Gómez, S. Tougaard, W. Skinner, J. J. Pireaux, C. F. McConville, C. D. Easton, T. R. Gengenbach, G. H. Major, P. Dietrich, A. Thissen, M. Engelhard, C. J. Powell, K. J. Gaskell and D. R. Baer, Microsc. Microanal., 2019, 26, 1–2 CrossRef PubMed.
- D. R. Baer, K. Artyushkova, C. Richard Brundle, J. E. Castle, M. H. Engelhard, K. J. Gaskell, J. T. Grant, R. T. Haasch, M. R. Linford, C. J. Powell, A. G. Shard, P. M. A. Sherwood and V. S. Smentkowski, J. Vac. Sci. Technol., A, 2019, 37, 031401 CrossRef PubMed.
- B. Philippe, M. Hahlin, K. Edström, T. Gustafsson, H. Siegbahn and H. Rensmo, J. Electrochem. Soc., 2016, 163, A178–A191 CrossRef CAS.
- V. Shutthanandan, M. Nandasiri, J. Zheng, M. H. Engelhard, W. Xu, S. Thevuthasan and V. Murugesan, J. Electron Spectrosc. Relat. Phenom., 2019, 231, 2–10 CrossRef CAS.
- A. M. Haregewoin, A. S. Wotango and B. J. Hwang, Energy Environ. Sci., 2016, 9, 1955–1988 RSC.
- E. Peled, J. Electrochem. Soc., 1979, 126, 2047–2051 CrossRef CAS.
- X. Yu and A. Manthiram, Energy Environ. Sci., 2018, 11, 527–543 RSC.
- E. Peled, D. Golodnitsky and G. Ardel, J. Electrochem. Soc., 1997, 144, L208–L210 CrossRef CAS.
- K. Edström, M. Herstedt and D. P. Abraham, J. Power Sources, 2006, 153, 380–384 CrossRef.
- E. Peled, J. Power Sources, 1983, 9, 253–266 CrossRef CAS.
- R. Jung, R. Morasch, P. Karayaylali, K. Phillips, F. Maglia, C. Stinner, Y. Shao-Horn and H. A. Gasteiger, J. Electrochem. Soc., 2018, 165, A132–A141 CrossRef CAS.
- W. M. Dose, I. Temprano, J. P. Allen, E. Björklund, C. A. O'Keefe, W. Li, B. L. Mehdi, R. S. Weatherup, M. F. L. De Volder and C. P. Grey, ACS Appl. Mater. Interfaces, 2022, 14, 13206–13222 CrossRef CAS PubMed.
- K. W. Schroder, H. Celio, L. J. Webb and K. J. Stevenson, J. Phys. Chem. C, 2012, 116, 19737–19747 CrossRef CAS.
- S. Malmgren, K. Ciosek, R. Lindblad, S. Plogmaker, J. Kühn, H. Rensmo, K. Edström and M. Hahlin, Electrochim. Acta, 2013, 105, 83–91 CrossRef CAS.
- A. Sharafi, S. Yu, M. Naguib, M. Lee, C. Ma, H. M. Meyer, J. Nanda, M. Chi, D. J. Siegel and J. Sakamoto, J. Mater. Chem. A, 2017, 5, 13475–13487 RSC.
- D. Aurbach, I. Weissman, A. Schechter and H. Cohen, Langmuir, 1996, 12, 3991–4007 CrossRef CAS.
- J. D. Schneider, D. B. Agocs and A. L. Prieto, Chem. Mater., 2020, 32, 8091–8096 CrossRef CAS.
- F. A. Stevie, R. Garcia, J. Shallenberger, J. G. Newman and C. L. Donley, J. Vac. Sci. Technol., A, 2020, 38, 063202 CrossRef CAS.
- S. Rensfelt, XPS-analysis of the SEI in lithium batteries: An investigation of the effect of storage on the solid electrolyte interphase of lithium ion batteries, Bachelor thesis, Uppsala University, 2017 Search PubMed.
- R. Mogensen, D. Brandell and R. Younesi, ACS Energy Lett., 2016, 1, 1173–1178 CrossRef CAS.
- L. A. Ma, A. J. Naylor, L. Nyholm and R. Younesi, Angew. Chem., Int. Ed., 2021, 60, 4855–4863 CrossRef CAS PubMed.
- M. Moshkovich, Y. Gofer and D. Aurbach, J. Electrochem. Soc., 2001, 148, E155 CrossRef CAS.
- L. Somerville, J. Bareño, P. Jennings, A. McGordon, C. Lyness and I. Bloom, Electrochim. Acta, 2016, 206, 70–76 CrossRef CAS.
- R. Fong, U. von Sacken and J. R. Dahn, J. Electrochem. Soc., 1990, 137, 2009–2013 CrossRef CAS.
- P. Verma, P. Maire and P. Novák, Electrochim. Acta, 2010, 55, 6332–6341 CrossRef CAS.
- S. Malmgren, K. Ciosek, M. Hahlin, T. Gustafsson, M. Gorgoi, H. Rensmo and K. Edström, Electrochim. Acta, 2013, 97, 23–32 CrossRef CAS.
- S. Mukherjee, P. K. Santra and D. D. Sarma, Hard X-ray Photoelectron Spectroscopy (HAXPES), Springer International Publishing, Cham, 2016, vol. 59 Search PubMed.
- C. Weiland, A. K. Rumaiz, P. Pianetta and J. C. Woicik, J. Vac. Sci. Technol., A, 2016, 34, 030801 CrossRef.
- B. Philippe, R. Dedryvère, J. Allouche, F. Lindgren, M. Gorgoi, H. Rensmo, D. Gonbeau and K. Edström, Chem. Mater., 2012, 24, 1107–1115 CrossRef CAS.
- K. Ciosek Högström, S. Malmgren, M. Hahlin, H. Rensmo, F. Thébault, P. Johansson and K. Edström, J. Phys. Chem. C, 2013, 117, 23476–23486 CrossRef.
- D. Leinen, A. Fernández, J. P. Espinós and A. R. González-Elipe, Surf. Interface Anal., 1993, 20, 941–948 CrossRef CAS.
- G. Panzner, B. Egert and H. P. Schmidt, Surf. Sci., 1985, 151, 400–408 CrossRef CAS.
- C. Chaneliere, J. L. Autran, R. A. B. Devine and B. Balland, Mater. Sci. Eng., R, 1998, 22, 269–322 CrossRef.
- E. Lewin, J. Counsell and J. Patscheider, Appl. Surf. Sci., 2018, 442, 487–500 CrossRef CAS.
- N. Sanada, A. Yamamoto, R. Oiwa and Y. Ohashi, Surf. Interface Anal., 2004, 36, 280–282 CAS.
- C. M. Goodwin, Z. E. Voras and T. P. BeebeJr, J. Vac. Sci. Technol., A, 2018, 36, 051507 CrossRef PubMed.
- R. Simpson, R. G. White, J. F. Watts and M. A. Baker, Appl. Surf. Sci., 2017, 405, 79–87 CrossRef CAS.
- M. A. Isaacs, J. Davies-Jones, P. R. Davies, S. Guan, R. Lee, D. J. Morgan and R. Palgrave, Mater. Chem. Front., 2021, 5, 7931–7963 RSC.
- M. Jiang, X. Wu, Q. Zhang, D. L. Danilov, R. A. Eichel and P. H. L. Notten, Electrochim. Acta, 2021, 398, 139316 CrossRef CAS.
- J. Kim, F. Buchner and R. J. Behm, Phys. Chem. Chem. Phys., 2018, 20, 18319–18327 RSC.
- A. M. Kia, J. Speulmanns, S. Bönhardt, J. Emara, K. Kühnel, N. Haufe and W. Weinreich, Appl. Surf. Sci., 2021, 564, 150457 CrossRef.
- D. R. Baer, K. Artyushkova, H. Cohen, C. D. Easton, M. Engelhard, T. R. Gengenbach, G. Greczynski, P. Mack, D. J. Morgan and A. Roberts, J. Vac. Sci. Technol., A, 2020, 38, 031204 CrossRef CAS.
- G. H. Major, T. G. Avval, B. Moeini, G. Pinto, D. Shah, V. Jain, V. Carver, W. Skinner, T. R. Gengenbach, C. D. Easton, A. Herrera-Gomez, T. S. Nunney, D. R. Baer and M. R. Linford, J. Vac. Sci. Technol., A, 2020, 38, 061204 CrossRef CAS.
- K. N. Wood and G. Teeter, ACS Appl. Energy Mater., 2018, 1, 4493–4504 CrossRef CAS.
- F. Lindgren, D. Rehnlund, I. Källquist, L. Nyholm, K. Edström, M. Hahlin and J. Maibach, J. Phys. Chem. C, 2017, 121, 27303–27312 CrossRef CAS.
- J. Maibach, F. Lindgren, H. Eriksson, K. Edström and M. Hahlin, J. Phys. Chem. Lett., 2016, 7, 1775–1780 CrossRef CAS PubMed.
- R. Azmi, V. Trouillet, M. Strafela, S. Ulrich, H. Ehrenberg and M. Bruns, Surf. Interface Anal., 2018, 50, 43–51 CrossRef CAS.
- M. C. Biesinger, L. W. M. Lau, A. R. Gerson and R. S. C. Smart, Appl. Surf. Sci., 2010, 257, 887–898 CrossRef CAS.
- M. C. Biesinger, B. P. Payne, A. P. Grosvenor, L. W. M. Lau, A. R. Gerson and R. S. C. Smart, Appl. Surf. Sci., 2011, 257, 2717–2730 CrossRef CAS.
- A. Andersson, A. Henningson, H. Siegbahn, U. Jansson and K. Edström, J. Power Sources, 2003, 119–121, 522–527 CrossRef CAS.
- H. Liu, Y. Yang and J. Zhang, J. Power Sources, 2006, 162, 644–650 CrossRef CAS.
- D. P. Abraham, R. D. Twesten, M. Balasubramanian, I. Petrov, J. McBreen and K. Amine, Electrochem. Commun., 2002, 4, 620–625 CrossRef CAS.
- J. Eom, M. G. Kim and J. Cho, J. Electrochem. Soc., 2008, 155, A239 CrossRef CAS.
- X. Zheng, X. Li, Z. Wang, H. Guo, Z. Huang, G. Yan and D. Wang, Electrochim. Acta, 2016, 191, 832–840 CrossRef CAS.
- N. V. Faenza, L. Bruce, Z. W. Lebens-Higgins, I. Plitz, N. Pereira, L. F. J. Piper and G. G. Amatucci, J. Electrochem. Soc., 2017, 164, A3727–A3741 CrossRef CAS.
- A. Grenier, H. Liu, K. M. Wiaderek, Z. W. Lebens-Higgins, O. J. Borkiewicz, L. F. J. Piper, P. J. Chupas and K. W. Chapman, Chem. Mater., 2017, 29, 7345–7352 CrossRef CAS.
- M. Wood, J. Li, R. E. Ruther, Z. Du, E. C. Self, H. M. Meyer, C. Daniel, I. Belharouak and D. L. Wood, Energy Storage Mater., 2020, 24, 188–197 CrossRef.
- Q. Li, Y. Wang, X. Wang, X. Sun, J. N. Zhang, X. Yu and H. Li, ACS Appl. Mater. Interfaces, 2020, 12, 2319–2326 CrossRef CAS PubMed.
- Z. Liu, Acta Phys.-Chim. Sin., 2019, 35, 1293–1294 CAS.
- C. Yan, R. Xu, Y. Xiao, J. Ding, L. Xu, B. Li and J. Huang, Adv. Funct. Mater., 2020, 30, 1909887 CrossRef CAS.
- I. Takahashi, H. Kiuchi, A. Ohma, T. Fukunaga and E. Matsubara, J. Phys. Chem. C, 2020, 124, 9243–9248 CrossRef CAS.
- Q. Li, Y. Wang, X. Wang, X. Sun, J. N. Zhang, X. Yu and H. Li, ACS Appl. Mater. Interfaces, 2020, 12, 2319–2326 CrossRef CAS PubMed.
- H. Wang, X. Li, F. Li, X. Liu, S. Yang and J. Ma, Electrochem. Commun., 2021, 122, 106870 CrossRef CAS.
- W. Li, A. Dolocan, P. Oh, H. Celio, S. Park, J. Cho and A. Manthiram, Nat. Commun., 2017, 8, 1–10 CrossRef.
- B. Huang, D. Liu, L. Zhang, K. Qian, K. Zhou, X. Cai, F. Kang and B. Li, ACS Appl. Energy Mater., 2019, 2, 7403–7411 CrossRef CAS.
- L. Madec, R. Petibon, J. Xia, J.-P. Sun, I. G. Hill and J. R. Dahn, J. Electrochem. Soc., 2015, 162, A2635–A2645 CrossRef CAS.
- C. Xu, F. Jeschull, W. R. Brant, D. Brandell, K. Edström and T. Gustafsson, J. Electrochem. Soc., 2018, 165, A40–A46 CrossRef CAS.
- A. K. Haridas, Q. A. Nguyen, T. Terlier, R. Blaser and S. L. Biswal, ACS Appl. Mater. Interfaces, 2021, 13, 2662–2673 CrossRef CAS PubMed.
- H. Q. Pham, M. T. Nguyen, M. Tarik, M. El Kazzi and S. Trabesinger, ChemSusChem, 2021, 14, 2461–2474 CrossRef CAS PubMed.
- Y. Li, W. Li, R. Shimizu, D. Cheng, H. N. Nguyen, J. Paulsen, S. Kumakura, M. Zhang and Y. S. Meng, Adv. Energy Mater., 2022, 12, 2103033 CrossRef CAS.
- H. Liu, A. J. Naylor, A. S. Menon, W. R. Brant, K. Edström and R. Younesi, Adv. Mater. Interfaces, 2020, 7, 2000277 CrossRef CAS.
- I. Källquist, A. J. Naylor, C. Baur, J. Chable, J. Kullgren, M. Fichtner, K. Edström, D. Brandell and M. Hahlin, Chem. Mater., 2019, 31, 6084–6096 CrossRef.
- I. Källquist, J. F. Martin, A. J. Naylor, C. Baur, M. Fichtner, J. F. Colin, D. Brandell, K. Edström and M. Hahlin, J. Phys. Chem. C, 2020, 124, 12956–12967 CrossRef.
- A. J. Naylor, I. Källquist, D. Peralta, J.-F. Martin, A. Boulineau, J.-F. Colin, C. Baur, J. Chable, M. Fichtner, K. Edström, M. Hahlin and D. Brandell, ACS Appl. Energy Mater., 2020, 3, 5937–5948 CrossRef CAS PubMed.
- C. Baur, I. Källquist, J. Chable, J. H. Chang, R. E. Johnsen, F. Ruiz-Zepeda, J.-M. Ateba Mba, A. J. Naylor, J. M. Garcia-Lastra, T. Vegge, F. Klein, A. R. Schür, P. Norby, K. Edström, M. Hahlin and M. Fichtner, J. Mater. Chem. A, 2019, 7, 21244–21253 RSC.
- C. Zhan, T. Wu, J. Lu and K. Amine, Energy Environ. Sci., 2018, 11, 243–257 RSC.
- H. Liu, X. Zhang, X. He, A. Senyshyn, A. Wilken, D. Zhou, O. Fromm, P. Niehoff, B. Yan, J. Li, M. Muehlbauer, J. Wang, G. Schumacher, E. Paillard, M. Winter and J. Li, J. Electrochem. Soc., 2018, 165, A1886–A1896 CrossRef CAS.
- H. Liu, J. Wang, X. Zhang, D. Zhou, X. Qi, B. Qiu, J. Fang, R. Kloepsch, G. Schumacher, Z. Liu and J. Li, ACS Appl. Mater. Interfaces, 2016, 8, 4661–4675 CrossRef CAS PubMed.
- M. A. Cambaz, B. P. Vinayan, S. A. Pervez, R. E. Johnsen, H. Geßwein, A. A. Guda, Y. V. Rusalev, M. K. Kinyanjui, U. Kaiser and M. Fichtner, Chem. Mater., 2019, 31, 7941–7950 CrossRef CAS.
- M. Ochida, Y. Domi, T. Doi, S. Tsubouchi, H. Nakagawa, T. Yamanaka, T. Abe and Z. Ogumi, J. Electrochem. Soc., 2012, 159, A961–A966 CrossRef CAS.
- W. Liu, J. Li, W. Li, H. Xu, C. Zhang and X. Qiu, Nat. Commun., 2020, 11, 3629 CrossRef CAS PubMed.
- M. A. Cabañero Martínez, N. Boaretto, A. J. Naylor, F. Alcaide, G. D. Salian, F. Palombardini, E. Ayerbe, M. Borras and M. Casas-Cabanas, Adv. Energy Mater., 2022, 2201264 CrossRef.
- C. Sångeland, J. Mindemark, R. Younesi and D. Brandell, Solid State Ionics, 2019, 343, 115068 CrossRef.
- C. Xu, B. Sun, T. Gustafsson, K. Edström, D. Brandell and M. Hahlin, J. Mater. Chem. A, 2014, 2, 7256–7264 RSC.
- P. Wang, J. Chai, Z. Zhang, H. Zhang, Y. Ma, G. Xu, H. Du, T. Liu, G. Li and G. Cui, J. Mater. Chem. A, 2019, 7, 5295–5304 RSC.
- R. Rajagopalan, Y. Tang, X. Ji, C. Jia and H. Wang, Adv. Funct. Mater., 2020, 30, 1909486 CrossRef CAS.
- B. John, V. Anoopkumar and T. D. Mercy, ACS Appl. Energy Mater., 2020, 3, 9478–9492 CrossRef.
- K. M. Abraham, ACS Energy Lett., 2020, 5, 3544–3547 CrossRef CAS.
- N. Tapia-Ruiz, A. R. Armstrong, H. Alptekin, M. A. Amores, H. Au, J. Barker, R. Boston, W. R. Brant, J. M. Brittain, Y. Chen, M. Chhowalla, Y. S. Choi, S. I. R. Costa, M. C. Ribadeneyra, S. A. Cussen, E. J. Cussen, W. I. F. David, A. V. Desai, S. A. M. Dickson, E. I. Eweka, J. D. Forero-Saboya, C. P. Grey, J. M. Griffin, P. Gross, X. Hua, J. T. S. Irvine, P. Johansson, M. O. Jones, M. Karlsmo, E. Kendrick, E. Kim, O. V. Kolosov, Z. Li, S. F. L. Mertens, R. Mogensen, L. Monconduit, R. E. Morris, A. J. Naylor, S. Nikman, C. A. O'Keefe, D. M. C. Ould, R. G. Palgrave, P. Poizot, A. Ponrouch, S. Renault, E. M. Reynolds, A. Rudola, R. Sayers, D. O. Scanlon, S. Sen, V. R. Seymour, B. Silván, M. T. Sougrati, L. Stievano, G. S. Stone, C. I. Thomas, M. M. Titirici, J. Tong, T. J. Wood, D. S. Wright and R. Younesi, JPhys Energy, 2021, 3, 031503 CrossRef CAS.
- F. Allgayer, J. Maibach and F. Jeschull, ACS Appl. Energy Mater., 2022, 5, 1136–1148 CrossRef CAS.
- S. Kaushik, K. Kubota, J. Hwang, K. Matsumoto and R. Hagiwara, ACS Appl. Mater. Interfaces, 2022, 14, 14302–14312 CrossRef CAS PubMed.
- Z. Wang, W. Zhuo, J. Li, L. Ma, S. Tan, G. Zhang, H. Yin, W. Qin, H. Wang, L. Pan, A. Qin and W. Mai, Nano Energy, 2022, 98, 107243 CrossRef CAS.
- G. Zhang, J. Li, Y. Fan, Y. Liu, P. Zhang, X. Shi, J. Ma, R. Zhang and Y. Huang, Energy Storage Mater., 2022, 51, 559–567 CrossRef.
- T. Hosaka, A. Noda, K. Kubota, K. Chiguchi, Y. Matsuda, K. Ida, S. Yasuno and S. Komaba, ACS Appl. Mater. Interfaces, 2022, 14, 23507–23517 CrossRef CAS PubMed.
- Q. Zhang, Z. Wang, X. Li, H. Guo, W. Peng, J. Wang and G. Yan, J. Power Sources, 2022, 541, 231726 CrossRef CAS.
- P. Canepa, G. Sai Gautam, D. C. Hannah, R. Malik, M. Liu, K. G. Gallagher, K. A. Persson and G. Ceder, Chem. Rev., 2017, 117, 4287–4341 CrossRef CAS PubMed.
- Y. Liang, H. Dong, D. Aurbach and Y. Yao, Nat. Energy, 2020, 5, 646–656 CrossRef CAS.
- R. Mogensen, J. Maibach, W. R. Brant, D. Brandell and R. Younesi, Electrochim. Acta, 2017, 245, 696–704 CrossRef CAS.
- C. Bommier, D. Leonard, Z. Jian, W. F. Stickle, P. A. Greaney and X. Ji, Adv. Mater. Interfaces, 2016, 3, 1600449 CrossRef.
- M. A. Muñoz-Márquez, M. Zarrabeitia, E. Castillo-Martínez, A. Eguía-Barrio, T. Rojo and M. Casas-Cabanas, ACS Appl. Mater. Interfaces, 2015, 7, 7801–7808 CrossRef PubMed.
- K. Li, J. Zhang, D. Lin, D. W. Wang, B. Li, W. Lv, S. Sun, Y. B. He, F. Kang, Q. H. Yang, L. Zhou and T. Y. Zhang, Nat. Commun., 2019, 10, 725 CrossRef CAS PubMed.
- P. Bai, Y. He, P. Xiong, X. Zhao, K. Xu and Y. Xu, Energy Storage Mater., 2018, 13, 274–282 CrossRef.
- C. Wang, L. Wang, F. Li, F. Cheng and J. Chen, Adv. Mater., 2017, 29, 1702212 CrossRef PubMed.
- J. Maibach, F. Jeschull, D. Brandell, K. Edström and M. Valvo, ACS Appl. Mater. Interfaces, 2017, 9, 12373–12381 CrossRef CAS PubMed.
- Y. Lei, D. Han, J. Dong, L. Qin, X. Li, D. Zhai, B. Li, Y. Wu and F. Kang, Energy Storage Mater., 2020, 24, 319–328 CrossRef.
- A. J. Naylor, M. Carboni, M. Valvo and R. Younesi, ACS Appl. Mater. Interfaces, 2019, 11, 45636–45645 CrossRef CAS PubMed.
- C. Chen, M. Wu, Y. Wang and K. Zaghib, J. Power Sources, 2019, 444, 227310 CrossRef CAS.
- J. D. Forero-Saboya, D. S. Tchitchekova, P. Johansson, M. R. Palacín, A. Ponrouch, J. D. Forero-Saboya, D. S. Tchitchekova, M. R. Palacín, A. Ponrouch and P. Johansson, Adv. Mater. Interfaces, 2022, 9, 2101578 CrossRef CAS.
- D. Tripathy, M. H. Viswanatha, H. Makri Nimbegondi Kotresh, P. V. Babu and S. Sampath, ACS Appl. Mater. Interfaces, 2022, 14, 26671–26681 CrossRef CAS PubMed.
- D. Zhang, D. Du, J. Zhang, Z. Feng and T. Sun, J. Electrochem. Soc., 2022, 169, 040530 CrossRef.
- X. Wang, X. Zhang, G. Zhao, H. Hong, Z. Tang, X. Xu, H. Li, C. Zhi and C. Han, ACS Nano, 2022, 16, 6093–6102 CrossRef CAS PubMed.
- M. Matsui, H. Kuwata, D. Mori, N. Imanishi and M. Mizuhata, Front. Chem., 2019, 7, 1–10 CrossRef PubMed.
- S. B. Son, T. Gao, S. P. Harvey, K. X. Steirer, A. Stokes, A. Norman, C. Wang, A. Cresce, K. Xu and C. Ban, Nat. Chem., 2018, 10, 532–539 CrossRef CAS PubMed.
- A. Ponrouch, C. Frontera, F. Bardé and M. R. Palacín, Nat. Mater., 2016, 15, 169–172 CrossRef CAS PubMed.
- M. Wang, C. Jiang, S. Zhang, X. Song, Y. Tang and H. M. Cheng, Nat. Chem., 2018, 10, 667–672 CrossRef CAS PubMed.
- S. J. Richard Prabakar, A. B. Ikhe, W. B. Park, K. C. Chung, H. Park, K. J. Kim, D. Ahn, J. S. Kwak, K. S. Sohn and M. Pyo, Adv. Sci., 2019, 6, 1902129 CrossRef CAS PubMed.
- J. L. White, F. S. Gittleson, M. Homer and F. El Gabaly, J. Phys. Chem. C, 2020, 124, 16508–16514 CrossRef CAS.
- Z. Zhang, X. Wang, Y. Bai and C. Wu, Green Energy Environ., 2021, 7, 606–635 CrossRef.
- R. A. House, U. Maitra, L. Jin, J. G. Lozano, J. W. Somerville, N. H. Rees, A. J. Naylor, L. C. Duda, F. Massel, A. V. Chadwick, S. Ramos, D. M. Pickup, D. E. McNally, X. Lu, T. Schmitt, M. R. Roberts and P. G. Bruce, Chem. Mater., 2019, 31, 3293–3300 CrossRef.
- L. A. Ma, F. Massel, A. J. Naylor, L. C. Duda and R. Younesi, Commun. Chem., 2019, 2, 125 CrossRef.
- G. Assat, D. Foix, C. Delacourt, A. Iadecola, R. Dedryvère and J.-M. Tarascon, Nat. Commun., 2017, 8, 2219 CrossRef PubMed.
- G. Assat and J.-M. Tarascon, Nat. Energy, 2018, 3, 373–386 CrossRef CAS.
- D. Foix, M. Sathiya, E. McCalla, J.-M. Tarascon and D. Gonbeau, J. Phys. Chem. C, 2016, 120, 862–874 CrossRef CAS.
- S. Han, Y. Xia, Z. Wei, B. Qiu, L. Pan, Q. Gu, Z. Liu and Z. Guo, J. Mater. Chem. A, 2015, 3, 11930–11939 RSC.
- M. Sathiya, K. Ramesha, G. Rousse, D. Foix, D. Gonbeau, A. S. Prakash, M. L. Doublet, K. Hemalatha and J.-M. Tarascon, Chem. Mater., 2013, 25, 1121–1131 CrossRef CAS.
- M. Sathiya, G. Rousse, K. Ramesha, C. P. Laisa, H. Vezin, M. T. Sougrati, M.-L. Doublet, D. Foix, D. Gonbeau, W. Walker, a S. Prakash, M. Ben Hassine, L. Dupont and J.-M. Tarascon, Nat. Mater., 2013, 12, 827–835 CrossRef CAS PubMed.
- A. J. Naylor, E. Makkos, J. Maibach, N. Guerrini, A. Sobkowiak, E. Björklund, J. G. Lozano, A. S. Menon, R. Younesi, M. R. Roberts, K. Edström, M. S. Islam and P. G. Bruce, J. Mater. Chem. A, 2019, 7, 25355–25368 RSC.
- K. Luo, M. R. Roberts, R. Hao, N. Guerrini, D. M. Pickup, Y.-S. Liu, K. Edström, J. Guo, A. V Chadwick, L. C. Duda and P. G. Bruce, Nat. Chem., 2016, 8, 684–691 CrossRef CAS PubMed.
- K. Shimoda, T. Minato, K. Nakanishi, H. Komatsu, T. Matsunaga, H. Tanida, H. Arai, Y. Ukyo, Y. Uchimoto and Z. Ogumi, J. Mater. Chem. A, 2016, 4, 5909–5916 RSC.
- T. Famprikis, P. Canepa, J. A. Dawson, M. S. Islam and C. Masquelier, Nat. Mater., 2019, 18, 1278–1291 CrossRef CAS PubMed.
- W. D. Richards, L. J. Miara, Y. Wang, J. C. Kim and G. Ceder, Chem. Mater., 2016, 28, 266–273 CrossRef CAS.
- S. Wenzel, T. Leichtweiss, D. Krüger, J. Sann and J. Janek, Solid State Ionics, 2015, 278, 98–105 CrossRef CAS.
- K.-Y. Yang, I.-C. Leu, K.-Z. Fung, M.-H. Hon, M.-C. Hsu, Y.-J. Hsiao and M.-C. Wang, J. Mater. Res., 2008, 23, 1813–1825 CrossRef CAS.
- J. Auvergniot, A. Cassel, D. Foix, V. Viallet, V. Seznec and R. Dedryvère, Solid State Ionics, 2017, 300, 78–85 CrossRef CAS.
- J. Auvergniot, A. Cassel, J. B. Ledeuil, V. Viallet, V. Seznec and R. Dedryvère, Chem. Mater., 2017, 29, 3883–3890 CrossRef CAS.
- F. Han, T. Gao, Y. Zhu, K. J. Gaskell and C. Wang, Adv. Mater., 2015, 27, 3473–3483 CrossRef CAS PubMed.
- X. Wu, M. El Kazzi and C. Villevieille, J. Electroceram., 2017, 38, 207–214 CrossRef CAS.
- R. Koerver, F. Walther, I. Aygün, J. Sann, C. Dietrich, W. G. Zeier and J. Janek, J. Mater. Chem. A, 2017, 5, 22750–22760 RSC.
- X. Wu, C. Villevieille, P. Novák and M. El Kazzi, Phys. Chem. Chem. Phys., 2018, 20, 11123–11129 RSC.
- S. Jacke, J. Song, G. Cherkashinin, L. Dimesso and W. Jaegermann, Ionics, 2010, 16, 769–775 CrossRef CAS.
- J. Song, S. Jacke, G. Cherkashinin, S. Schmid, Q. Dong, R. Hausbrand and W. Jaegermann, Electrochem. Solid-State Lett., 2011, 14, A189 CrossRef CAS.
- M. Haruta, S. Shiraki, T. Ohsawa, T. Suzuki, A. Kumatani, Y. Takagi, R. Shimizu and T. Hitosugi, Solid State Ionics, 2016, 285, 118–121 CrossRef CAS.
- Z. Liu, G. Li, A. Borodin, X. Liu, Y. Li and F. Endres, J. Solid State Electrochem., 2019, 23, 2107–2117 CrossRef CAS.
- E. K. W. Andersson, C. Sångeland, E. Berggren, F. O. L. Johansson, D. Kühn, A. Lindblad, J. Mindemark and M. Hahlin, J. Mater. Chem. A, 2021, 9, 22462–22471 RSC.
- A. Schwöbel, R. Hausbrand and W. Jaegermann, Solid State Ionics, 2015, 273, 51–54 CrossRef.
- P. Hartmann, T. Leichtweiss, M. R. Busche, M. Schneider, M. Reich, J. Sann, P. Adelhelm and J. Janek, J. Phys. Chem. C, 2013, 117, 21064–21074 CrossRef CAS.
- S. Wenzel, S. Randau, T. Leichtweiß, D. A. Weber, J. Sann, W. G. Zeier and J. Janek, Chem. Mater., 2016, 28, 2400–2407 CrossRef CAS.
- A. I. Inozemtseva, V. A. Vizgalov, O. O. Kapitanova, G. Panin, J. J. Velasco Vélez, D. M. Itkis, D. Y. Usachov and L. V. Yashina, J. Electrochem. Soc., 2020, 167, 110533 CrossRef CAS.
- S. Wenzel, D. A. Weber, T. Leichtweiss, M. R. Busche, J. Sann and J. Janek, Solid State Ionics, 2016, 286, 24–33 CrossRef CAS.
- S. Wenzel, T. Leichtweiss, D. A. Weber, J. Sann, W. G. Zeier and J. Janek, ACS Appl. Mater. Interfaces, 2016, 8, 28216–28224 CrossRef CAS PubMed.
- Z. Zhang, S. Wenzel, Y. Zhu, J. Sann, L. Shen, J. Yang, X. Yao, Y.-S. Hu, C. Wolverton, H. Li, L. Chen and J. Janek, ACS Appl. Energy Mater., 2020, 3, 7427–7437 CrossRef CAS.
- F. Michel, M. Becker, J. Janek and A. Polity, Phys. Status Solidi A, 2020, 257, 1900336 CrossRef CAS.
- K. N. Wood, K. X. Steirer, S. E. Hafner, C. Ban, S. Santhanagopalan, S.-H. Lee and G. Teeter, Nat. Commun., 2018, 9, 2490 CrossRef PubMed.
- M. Mirolo, X. Wu, C. A. F. Vaz, P. Novák and M. El Kazzi, ACS Appl. Mater. Interfaces, 2021, 13, 2547–2557 CrossRef CAS PubMed.
- K. Hikima, K. Shimizu, H. Kiuchi, Y. Hinuma, K. Suzuki, M. Hirayama, E. Matsubara and R. Kanno, J. Am. Chem. Soc., 2022, 144, 236–247 CrossRef CAS PubMed.
- H. Kiuchi, K. Hikima, K. Shimizu, R. Kanno, F. Toshiharu and E. Matsubara, Electrochem. Commun., 2020, 118, 106790 CrossRef CAS.
- C. Guhl, P. Kehne, Q. Ma, F. Tietz, L. Alff, P. Komissinskiy, W. Jaegermann and R. Hausbrand, Rev. Sci. Instrum., 2018, 89, 073104 CrossRef PubMed.
- D. Tonti, C. Pettenkofer and W. Jaegermann, Electrochem. Solid-State Lett., 2000, 3, 220–223 CrossRef CAS.
- D. Tonti, C. Pettenkofer and W. Jaegermann, J. Phys. Chem. B, 2004, 108, 16093–16099 CrossRef CAS.
- L. Trotochaud, A. R. Head, O. Karslioǧlu, L. Kyhl and H. Bluhm, J. Phys.: Condens. Matter, 2017, 29, 053002 CrossRef PubMed.
- C. H. Wu, R. S. Weatherup and M. B. Salmeron, Phys. Chem. Chem. Phys., 2015, 17, 30229–30239 RSC.
- E. J. Crumlin, Z. Liu, H. Bluhm, W. Yang, J. Guo and Z. Hussain, J. Electron Spectrosc. Relat. Phenom., 2015, 200, 264–273 CrossRef CAS.
- X. Liu, W. Yang and Z. Liu, Adv. Mater., 2014, 26, 7710–7729 CrossRef CAS PubMed.
- H. Siegbarn, L. Asplund, P. Kelfve, K. Hamrin, L. Karlsson and K. Siegbahn, J. Electron Spectrosc. Relat. Phenom., 1974, 5, 1059–1079 CrossRef.
- H. Siegbahn and K. Siegbahn, J. Electron Spectrosc. Relat. Phenom., 1973, 2, 319–325 CrossRef CAS.
- H. Siegbahn, L. Asplund, P. Kelfve and K. Siegbahn, J. Electron Spectrosc. Relat. Phenom., 1975, 7, 411–419 CrossRef CAS.
- D. F. Ogletree, H. Bluhm, G. Lebedev, C. S. Fadley, Z. Hussain and M. Salmeron, Rev. Sci. Instrum., 2002, 73, 3872 CrossRef CAS.
- E. J. Crumlin, H. Bluhm and Z. Liu, J. Electron Spectrosc. Relat. Phenom., 2013, 190, 84–92 CrossRef CAS.
- C. Arble, M. Jia and J. T. Newberg, Surf. Sci. Rep., 2018, 73, 37–57 CrossRef CAS.
- A. Shavorskiy, O. Karslioglu, I. Zegkinoglou and H. Bluhm, J. Synchrotron Radiat., 2014, 27, 14–23 CrossRef.
- S. Axnanda, E. J. Crumlin, B. Mao, S. Rani, R. Chang, P. G. Karlsson, M. O. M. Edwards, M. Lundqvist, R. Moberg, P. Ross, Z. Hussain and Z. Liu, Sci. Rep., 2015, 5, 1–12 Search PubMed.
- J. J. Velasco-Vélez, V. Pfeifer, M. Hävecker, R. Wang, A. Centeno, A. Zurutuza, G. Algara-Siller, E. Stotz, K. Skorupska, D. Teschner, P. Kube, P. Braeuninger-Weimer, S. Hofmann, R. Schlögl and A. Knop-Gericke, Rev. Sci. Instrum., 2016, 87, 053121 CrossRef PubMed.
- Y. Takagi, T. Nakamura, L. Yu, S. Chaveanghong, O. Sekizawa, T. Sakata, T. Uruga, M. Tada, Y. Iwasawa and T. Yokoyama, Appl. Phys. Express, 2017, 10, 076603 CrossRef.
- D. E. Starr, M. Favaro, F. F. Abdi, H. Bluhm, E. J. Crumlin and R. van de Krol, J. Electron Spectrosc. Relat. Phenom., 2017, 221, 106–115 CrossRef CAS.
- M. Salmeron and R. Schlögl, Surf. Sci. Rep., 2008, 63, 169–199 CrossRef CAS.
- M. Favaro, B. Jeong, P. N. Ross, J. Yano, Z. Hussain, Z. Liu and E. J. Crumlin, Nat. Commun., 2016, 7, 1–8 Search PubMed.
- W. N. Hansen, J. Electroanal. Chem., 1983, 150, 133–140 CrossRef CAS.
- R. Endo, D. Watanabe, M. Shimomura and T. Masuda, Appl. Phys. Lett., 2019, 114, 173702 CrossRef.
- S. Zhu, M. Scardamaglia, J. Kundsen, R. Sankari, H. Tarawneh, R. Temperton, L. Pickworth, F. Cavalca, C. Wang, H. Tissot, J. Weissenrieder, B. Hagman, J. Gustafson, S. Kaya, F. Lindgren, I. Kallquist, J. Maibach, M. Hahlin, V. Boix, T. Gallo, F. Rehman, G. D'Acunto, J. Schnadta and A. Shavorskiy, J. Synchrotron Radiat., 2021, 28, 624–636 CrossRef CAS PubMed.
- P. M. Dietrich, L. Gehrlein, J. Maibach and A. Thissen, Crystals, 2020, 10, 1–13 CrossRef.
- M. El Kazzi, I. Czekaj, E. J. Berg, P. Novák and M. A. Brown, Top. Catal., 2016, 59, 628–634 CrossRef CAS.
- J. Maibach, I. Källquist, M. Andersson, S. Urpelainen, K. Edström, H. Rensmo, H. Siegbahn and M. Hahlin, Nat. Commun., 2019, 10, 3080 CrossRef PubMed.
- M. Favaro, F. Abdi, E. Crumlin, Z. Liu, R. van de Krol and D. Starr, Surfaces, 2019, 2, 78–99 CrossRef CAS.
- I. Källquist, F. Lindgren, M. T. Lee, A. Shavorskiy, K. Edström, H. Rensmo, L. Nyholm, J. Maibach and M. Hahlin, ACS Appl. Mater. Interfaces, 2021, 13, 32989–32996 CrossRef PubMed.
- I. Källquist, T. Ericson, F. Lindgren, H. Chen, A. Shavorskiy, J. Maibach and M. Hahlin, ACS Appl. Mater. Interfaces, 2022, 14, 6465–6475 CrossRef PubMed.
- W. Wang, Y. Wang, C. H. Wang, Y. W. Yang and Y. C. Lu, Energy Storage Mater., 2021, 36, 341–346 CrossRef.
| This journal is © The Royal Society of Chemistry 2022 |


