Ultrafast dissociation of ammonia: Auger Doppler effect and redistribution of the internal energy
Oksana
Travnikova
 *a,
Edwin
Kukk
b,
Farzad
Hosseini
 ac,
Sari
Granroth
b,
Eero
Itälä†
b,
Tatiana
Marchenko
 a,
Renaud
Guillemin
 a,
Iyas
Ismail
 a,
Roba
Moussaoui
a,
Loïc
Journel
a,
Roba
Moussaoui
a,
Loïc
Journel
 a,
John
Bozek
b,
Ralph
Püttner
 d,
Pavel
Krasnov
 ef,
Victor
Kimberg
 ef,
Faris
Gel'mukhanov
 efg,
Maria Novella
Piancastelli
 ah and
Marc
Simon
 a
a
aSorbonne Université, CNRS, UMR 7614, Laboratoire de Chimie Physique-Matière et Rayonnement, F-75005 Paris, France. E-mail: oksana.travnikova@sorbonne-universite.fr
bDepartment of Physics and Astronomy, University of Turku, FI-20014 Turku, Finland
cSynchrotron SOLEIL, L'Orme des Merisiers, Saint-Aubin, F-91192 Gif-sur-Yvette Cedex, France
dFachbereich Physik, Freie Universität Berlin, D-14195 Berlin, Germany
eDepartment of Theoretical Chemistry and Biology, KTH Royal Institute of Technology, 10691 Stockholm, Sweden
fInternational Research Center of Spectroscopy and Quantum Chemistry - IRC SQC, Siberian Federal University, 660041 Krasnoyarsk, Russia
gInstitute for Methods and Instrumentation in Synchrotron Radiation Research FG-ISRR, Helmholtz-Zentrum Berlin für Materialien und Energie, Albert-Einstein-Strasse 15, 12489 Berlin, Germany
hDepartment of Physics and Astronomy, Uppsala University, SE-751 20 Uppsala, Sweden
First published on 14th February 2022
Abstract
We study vibrationally-resolved resonant Auger (RAS) spectra of ammonia recorded in coincidence with the NH2+ fragment, which is produced in the course of dissociation either in the core-excited 1s−14a11 intermediate state or the first spectator 3a−24a11 final state. Correlation of the NH2+ ion flight times with electron kinetic energies allows directly observing the Auger-Doppler dispersion for each vibrational state of the fragment. The median distribution of the kinetic energy release EKER, derived from the coincidence data, shows three distinct branches as a function of Auger electron kinetic energy Ee: Ee + 1.75EKER = const for the molecular band; EKER = const for the fragment band; and Ee + EKER = const for the region preceding the fragment band. The deviation of the molecular band dispersion from Ee + EKER = const is attributed to the redistribution of the available energy to the dissociation energy and excitation of the internal degrees of freedom in the molecular fragment. We found that for each vibrational line the dispersive behavior of EKERvs. Ee is very sensitive to the instrumental uncertainty in the determination of EKER causing the competition between the Raman (EKER + Ee = const) and Auger (Ee = const) dispersions: increase in the broadening of the finite kinetic energy release resolution leads to a change of the dispersion from the Raman to the Auger one.
1 Introduction
Absorption of an X-ray photon by a molecule may lead to the excitation of a localized core electron to a specific unoccupied valence orbital. The created core–hole states are highly unstable and decay on a very short timescale emitting a photon (radiative decay) or a so-called Auger electron (non-radiative or Auger decay). Core excitation of molecules by soft X-rays creates core holes with lifetimes of a few femtoseconds (typically, 3–8 fs), which is a sufficient duration for light nuclei to move away from their equilibrium geometry. This results in a competition between two dynamical processes: electronic relaxation of the excited system and its nuclear dynamics. Ultrafast dissociation (UFD) is an extreme example of such a competition, where electronic decay occurs after dissociation. UFD was observed for the first time for CS2 and SF6 molecules in 19781 and HBr in 1986.2More complete information on molecular dynamics is obtained by performing electron–ion coincidence measurements, where the correlation of emitted electrons with ionic fragments allows disentangling dissociation mechanisms.3–9
Furthermore, the so-called Auger–Doppler (AD) effect10 has been observed for the spectral lines pertaining to the atomic fragments formed after UFD for O2,9,11–13 CH3Cl,3 SF6,14,15 O3,16 HF/DF.17 The AD effect is the red/blue shift of kinetic energies for Auger electrons emitted from the fragments moving away/towards the detector, respectively. At the same time, an opposite shift can be observed for the corresponding ionic fragments, which are typically measured by an ion time-of-flight spectrometer facing an electron analyzer in a coincidence setup.5,9
The maximum of the Doppler shift ![[scr D, script letter D]](https://www.rsc.org/images/entities/char_e523.gif) max can be described by a simple model:
max can be described by a simple model:
![[scr D, script letter D]](https://www.rsc.org/images/entities/char_e523.gif) max ∼ 0.5 eV for O29,11). However, in heteroatomic molecules the Doppler shift will be small for the heavy fragment because the released kinetic energy is transferred mainly to the light co-fragment. In the latter case, the Doppler effect could be observed as broadening of the fragment lines. Advanced spectroscopic techniques allow simultaneous detection of energy-resolved fast Auger electrons and ions in coincidence for each ionisation event. In such measurements, ions travelling in the opposite directions after dissociation can be distinguished and correlated to the kinetic energies of electrons emitted from them, which allows observation of small Auger–Doppler splittings, indiscernible by single-channel electron spectroscopy.3
max ∼ 0.5 eV for O29,11). However, in heteroatomic molecules the Doppler shift will be small for the heavy fragment because the released kinetic energy is transferred mainly to the light co-fragment. In the latter case, the Doppler effect could be observed as broadening of the fragment lines. Advanced spectroscopic techniques allow simultaneous detection of energy-resolved fast Auger electrons and ions in coincidence for each ionisation event. In such measurements, ions travelling in the opposite directions after dissociation can be distinguished and correlated to the kinetic energies of electrons emitted from them, which allows observation of small Auger–Doppler splittings, indiscernible by single-channel electron spectroscopy.3
In this work we demonstrate the first observation of the AD effect for a molecular fragment produced by UFD with a light co-fragment. In contrast to the previously studied AD effect for atomic fragments, electronic decay of molecular fragments is usually accompanied by vibrational excitations. Therefore, high kinetic energy resolution is required for such measurements. Using the newly available GPES (Gas-Phase End Station) coincidence setup,18 equipped with a high-resolution hemispherical electron analyser and permanently installed at the soft X-ray beamline FinEstBeAMS of the MAX IV synchrotron radiation facility in Sweden, we recorded resonant Auger decay spectra at the N 1s edge (∼400 eV) for the NH3 molecule in the gas phase following core excitation to the dissociative lowest unoccupied molecular orbital (LUMO, 4a1) in coincidence with ions.
The core-excited 1s−14a11 state of NH3 undergoes UFD on a few femtosecond (fs) timescale (N 1s lifetime τ = 5 fs) leading to the ejection of a neutral hydrogen atom and a core-excited neutral  co-fragment (eqn (1)), which relaxes by Auger decay, leading predominantly to the singly charged NH2+ ion.
 | (1) |
Evidence of UFD in gas-phase ammonia molecules was first observed by resonant Auger electron spectroscopy in 2003 by Hjelte et al.19 as a series of peaks separated by ∼390 meV, corresponding to the vibrational progression of the ã+ state of the NH2+ ion. These lines stay constant at the kinetic energy of about 382 eV when the photon energy is tuned across the 1s−14a11 resonance, while the participator Auger-decay lines originating from the undissociated ammonia molecules disperse linearly owing to the energy conservation law. This is explained in the previous works by the resonant Auger decay in the fragment taking place when the wave packet reaches a location on the potential energy surface where the curves for the intermediate and final states are parallel, and the residual energy goes to the nuclear motion.
Using GPES coincidence setup we achieved electron kinetic energy resolution, which is comparable to the single-channel resonant Auger spectroscopy measurements reported in ref. 19 allowing vibrational resolution for the ã+ state of the NH2+ ion. The AD shift, experimentally observed in our work, for the heavy counter-ion after N–H bond fission in the core-excited ammonia is comparable to the intrinsic N 1s core–hole lifetime broadening (∼130 meV) and, therefore, cannot be resolved in single-channel photoemission spectroscopy.
Furthermore, we show that the measured kinetic energy release gives direct information about the redistribution of the internal energy left in the system among different vibrational and rotational modes. In the previous studies concerning ultrafast dissociation leading to an atomic fragment, EKER follows linearly the photon energy across the resonance with the slope of 1, i.e. the total energy left in the system after resonant Auger decay is transferred to the kinetic energy of the atomic fragment.5,9 However, in the case of molecular fragments possessing several vibrational degrees of freedom, there are more ways to dissipate the internal energy as well as to excite recoil-induced vibrations and rotations.20 Dispersion of the EKER with the electron energy, extracted from the experimental data for the NH2+–H dissociation channel, shows that about 43% of the internal energy remaining in the system after emission of the resonant Auger electron is transferred to vibrations, while recoil-induced rovibronic excitations are weak owing to the relatively high mass ratio of the co-fragments (mNH2/mH = 16![[thin space (1/6-em)]](https://www.rsc.org/images/entities/char_2009.gif) :
:![[thin space (1/6-em)]](https://www.rsc.org/images/entities/char_2009.gif) 1).
1).
2 Experiment
2.1 Resonant Auger electron–ion coincidence measurements
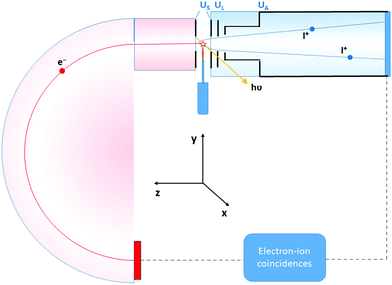
The experiment was performed at the Estonian-Finnish beamline (FinEstBeAMS) of the MAX IV synchrotron radiation source in Lund, Sweden. The beamline21 is equipped with a SX700 type monochromator manufactured by FMB Feinwerk-und Messtechnik GmbH, receiving radiation from an Apple II type undulator. Horizontally polarized radiation was used in this experiment. Ammonia sample (99![[thin space (1/6-em)]](https://www.rsc.org/images/entities/char_2009.gif) 999% purity) was introduced into the Gas-phase Endstation (GPES)18 through a needle via a dosing valve, to the experimental chamber (pressure of 4–5 × 10⁻⁶ mbar). The molecular jet from the needle crossed the monochromatized photon beam at the centre of the sample region (Fig. 1), and photoelectrons were detected by a modified Scienta R4000 hemispherical electron analyzer, equipped with a fast 40 mm diameter microchannel plate (MCP) and a resistive anode (Quantar Inc.) position-sensitive detector. The electron detector provided triggers for the pulsed ion extraction voltage US across the source region of a modified Wiley-McLaren type ion time-of-flight (TOF) spectrometer.18 The ions were then accelerated to the final energy by the drift tube voltage UA, first passing a lens element with UL, modifying the radial distribution and focusing. Ions were detected by a Roentdek 80 mm MCP and HEX-anode detector, recording ion flight times (TOFs) and radial hit positions. The electron energy and ion TOFs and ion positions of impact data were combined into a coincidence dataset. In addition, non-coincident “random” triggers for ion extraction were generated at a constant rate, interleaved with the electron triggers. The ions collected using the random triggers were added to the dataset and were used in the analysis for statistical subtraction of the false coincidence background from the electron–ion coincidence (PEPICO) maps, ion momentum and the EKER distributions.
999% purity) was introduced into the Gas-phase Endstation (GPES)18 through a needle via a dosing valve, to the experimental chamber (pressure of 4–5 × 10⁻⁶ mbar). The molecular jet from the needle crossed the monochromatized photon beam at the centre of the sample region (Fig. 1), and photoelectrons were detected by a modified Scienta R4000 hemispherical electron analyzer, equipped with a fast 40 mm diameter microchannel plate (MCP) and a resistive anode (Quantar Inc.) position-sensitive detector. The electron detector provided triggers for the pulsed ion extraction voltage US across the source region of a modified Wiley-McLaren type ion time-of-flight (TOF) spectrometer.18 The ions were then accelerated to the final energy by the drift tube voltage UA, first passing a lens element with UL, modifying the radial distribution and focusing. Ions were detected by a Roentdek 80 mm MCP and HEX-anode detector, recording ion flight times (TOFs) and radial hit positions. The electron energy and ion TOFs and ion positions of impact data were combined into a coincidence dataset. In addition, non-coincident “random” triggers for ion extraction were generated at a constant rate, interleaved with the electron triggers. The ions collected using the random triggers were added to the dataset and were used in the analysis for statistical subtraction of the false coincidence background from the electron–ion coincidence (PEPICO) maps, ion momentum and the EKER distributions.
The electron energy window for a coincidence dataset is determined by the electron acceleration/retardation and the pass energy Ep of the analyzer, its width being about 8% of Ep. For different electron energy resolution/energy coverage optimization, data with Ep = 50, 100 and 200 eV were recorded, with the entrance slit of the spectrometer at 0.8 mm (for Ep = 50 and 100 eV) and 1.5 mm (for Ep = 200 eV), giving the estimated electron energy resolution of 160, 315 and 900 meV full-width at half-maximum (FWHM), respectively. The exit slit of the monochromator was set to 20–30 µm to give a sufficiently low electron rate of 10–20 el s−1, which corresponded to the estimated photon bandwidth of 60–80 meV FWHM. Two sets of the ion extraction and acceleration voltages (US = ±100 V, UA = −620 V and US = ±200 V, UA = −1240 V) were used, to allow checking for consistency in ion momentum determination.
The resonant features in the N 1s photoabsorption spectrum were determined by measuring total ion yield as a function of photon energy just below the N 1s ionization threshold of NH3. The spectrum, presented in Fig. 2, shows the first resonant transition N 1s → 4a1 at 400.66 eV (energy-calibrated according to ref. 22), and the strongest 1s → 2e resonance at 402.33 eV. The two arrows denote the excitation energies at which the Auger electron–ion coincidence measurements were performed – at the maximum of the 1s → 4a1 resonance and at about +230 meV detuning. The energy for the positive detuning was chosen to be above the barrier which is present on the N 1s−14a1 potential energy surface of NH3 (170 meV23).
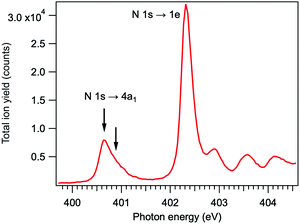 | ||
| Fig. 2 Total ion yield spectrum of ammonia across the resonant excitations in the N 1s photoabsorption. | ||
In the TOF spectrum of ammonia, recorded at the N 1s → 4a1 resonance, only the H+ and NH2+ ions are present in coincidence with the resonant Auger electrons, detected in the kinetic energy range of 379–384 eV. Resonant Auger transitions at lower kinetic energies start to produce also the N+ and NH+ ions.
2.2 High-resolution resonant Auger measurements
Additionally, single-channel high-resolution resonant Auger decay spectra were recorded using a R4000 hemispherical electron analyser from Scienta-Omicron, which is permanently installed at the PLEIADES beamline of the synchrotron SOLEIL in Saint-Aubin, France.15 NH3 was introduced to the home-build gas cell and the pressure in the chamber was kept constant at about 2.5e−5 bar. A high flux grating containing 600 lines per mm with varied line spacing and varied groove depth was used for the measurements. The monochromator slit was set to 20 µm, which results in a soft X-ray beam with the bandwidth of about 56 meV around the N 1s edge (∼400 eV). The estimated electron energy resolution was 40 meV for the used electron analyser settings (entrance slit 0.8 mm and pass energy 20 eV). The measurements were performed using circularly polarised light, as it delivers the highest flux around 400 eV. The possible drifts in photon energy position were monitored by recording an ion yield spectrum using a Channeltron detector, installed downstream from the electron analyser at the PLEIADES gas-phase end-station. The resonant Auger decay spectrum, presented in Fig. 3 was recorded during the total accumulation time of about 24 hours, at the photon energy of 400.86 eV, corresponding to the detuning of +200 meV from the top of the N 1s → 4a1 resonance. Additional angular resolved measurements were performed using linear vertical and horizontal X-ray light polarisation to observe a difference in the broadening of the fragment lines due to the Auger Doppler effect11 for 0° and 90° polarisation relative to the electron emission axis. The analysis of the last measurements confirmed that for the 0° light polarisation there is a small increase in the peak widths of the vibrationally-resolved lines of the NH2+ fragment in the electron kinetic energy region of 381–382 eV.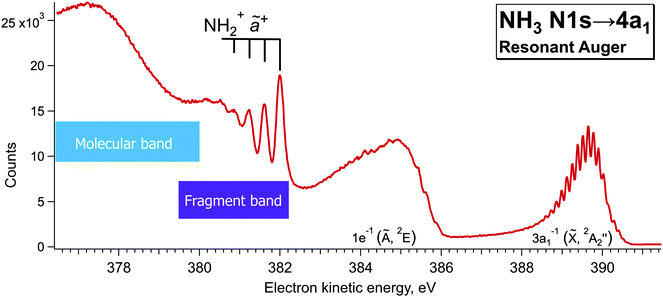 | ||
| Fig. 3 High-resolution resonant Auger decay spectrum recorded at ħω = 400.86 eV with hemispherical electron analyser at the beamline PLEIADES of the synchrotron SOLEIL. | ||
3 General features of resonant Auger spectrum of NH3
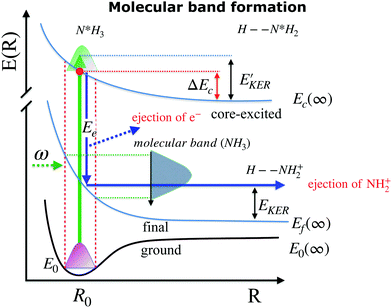
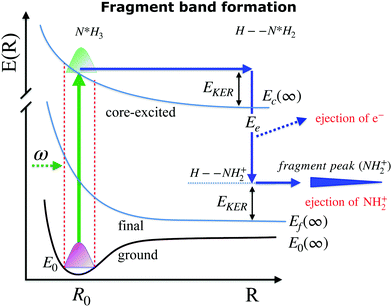
When ammonia is core excited to the dissociative 1s−14a11 state it starts to decay to the manifold of the final cationic states emitting the Auger electron with momentum k and kinetic energy Ee.The Auger transitions, occurring near the equilibrium geometry of the ground-state ammonia and in the UFD fragment  (eqn (1)), form the Auger spectrum shown in Fig. 3 which consists of two qualitatively different profiles – so-called molecular and fragment bands.7 The transitions near the equilibrium ground-state geometry shape the so-called molecular band (Fig. 4) while the Auger decays in the
  core-excited fragment (R = ∞) produce the fragment band (Fig. 5).2,7,24–26
One can distinguish two qualitatively different spectral regions: the band below 382 eV, related to the first spectator molecular state (3a1)−2(4a1)1, see ref. 27; and the kinetic energy region comprising Auger decays to ![[X with combining tilde]](https://www.rsc.org/images/entities/char_0058_0303.gif) and à participator final states with valence electron vacancy in the HOMO (3a1) and HOMO−1 (1e) molecular orbitals of NH3, respectively. The sharp lines, which are seen in the electron kinetic energy region of 380 < Ee < 382 eV, correspond to the N–H symmetric stretching vibrations of the ã+ final state ((1a1)2(2a1)2(1b2)2(3a1)2) of the NH2+ ion reached after Auger decay in the core-excited N*H2 fragment.19 The width of the spectral lines constituting this so-called fragment band is defined by the lifetime broadening of the core-excited state Γ and the Auger Doppler broadening. In contrast, the 3a−11 band shows much narrower vibrational lines which correspond to the resonant Auger decays to the final bound state. The widths of the spectral lines in this case are defined by the photon bandpath width and lifetime broadening of the final state Γf which is usually much smaller than Γ.7,11,24
and à participator final states with valence electron vacancy in the HOMO (3a1) and HOMO−1 (1e) molecular orbitals of NH3, respectively. The sharp lines, which are seen in the electron kinetic energy region of 380 < Ee < 382 eV, correspond to the N–H symmetric stretching vibrations of the ã+ final state ((1a1)2(2a1)2(1b2)2(3a1)2) of the NH2+ ion reached after Auger decay in the core-excited N*H2 fragment.19 The width of the spectral lines constituting this so-called fragment band is defined by the lifetime broadening of the core-excited state Γ and the Auger Doppler broadening. In contrast, the 3a−11 band shows much narrower vibrational lines which correspond to the resonant Auger decays to the final bound state. The widths of the spectral lines in this case are defined by the photon bandpath width and lifetime broadening of the final state Γf which is usually much smaller than Γ.7,11,24
In our high-resolution RAS spectrum, recorded with low signal-to-noise ratio (Fig. 3), we can clearly distinguish the NH2+ fragment lines up to ν = 3 vibrational component in the 381–382 eV kinetic energy region. In Fig. 3 we can also notice hints of vibrational lines with ν > 3 close to 380 eV. However, their relative intensities indicate that they might originate from a different vibrational progression than the one visible at 381–382 eV; however, attribution of those lines goes beyond the scope of the present paper.
Notably, the spectral resolution allows resolving the bending vibrational progression of the participator ![[X with combining tilde]](https://www.rsc.org/images/entities/char_0058_0303.gif) final state for NH3+ (Ee ∼ 389–390 eV), which is below the life-time broadening of Γ ∼ 130 meV for N 1s. This is possible owing to the narrow bandwidth of the exciting X-rays resulting in the so-called Auger Resonant Raman (ARR) conditions, when the finite life-time Γ of the core-excited intermediate state does not contribute to the RAS cross section for molecular Auger decay. The width of the RAS lines is hence defined by the instrumental resolution (photon bandwidth and electron kinetic energy resolution) and lifetime broadening of the final state Γf. Contrary, the spectral features of the fragment in Fig. 3 appear considerably broader. The width of the vibrational lines of this so-called fragment band is defined by the lifetime broadening of the core-excited state Γ and the Auger-Doppler broadening. Therefore, the Raman line narrowing below the core–hole lifetime width, which takes place for the molecular band, does not hold for the fragment band.24,26 The variation of the line widths can be used as a tool to distinguish molecular and fragment bands in RAS, which allows us confirming the fragment nature of the lines in the 381–382 eV region and removing the doubts in their attribution, raised in the theoretical work by Takahashi et al.27
final state for NH3+ (Ee ∼ 389–390 eV), which is below the life-time broadening of Γ ∼ 130 meV for N 1s. This is possible owing to the narrow bandwidth of the exciting X-rays resulting in the so-called Auger Resonant Raman (ARR) conditions, when the finite life-time Γ of the core-excited intermediate state does not contribute to the RAS cross section for molecular Auger decay. The width of the RAS lines is hence defined by the instrumental resolution (photon bandwidth and electron kinetic energy resolution) and lifetime broadening of the final state Γf. Contrary, the spectral features of the fragment in Fig. 3 appear considerably broader. The width of the vibrational lines of this so-called fragment band is defined by the lifetime broadening of the core-excited state Γ and the Auger-Doppler broadening. Therefore, the Raman line narrowing below the core–hole lifetime width, which takes place for the molecular band, does not hold for the fragment band.24,26 The variation of the line widths can be used as a tool to distinguish molecular and fragment bands in RAS, which allows us confirming the fragment nature of the lines in the 381–382 eV region and removing the doubts in their attribution, raised in the theoretical work by Takahashi et al.27
In addition to the conventional resonant Auger decay spectrum shown in Fig. 3 we measured also the Auger spectra in coincidence with the NH2+ cation, which can be formed either following the dissociation in the intermediate neutral core-excited state N*H3 or in the final molecular state NH3+. The information provided by the coincidence experiment is much richer than in conventional single-channel Auger electron measurements, since both the momentum of the Auger electron k and the momentum of the cation p can be derived. One of the main advantages of the coincidence technique is that we know precisely the orientation in space of the dissociating H2N−H bond, which is selected by the momentum of the fragment p. The photoelectron–photoion coincidence spectrum was measured in a relatively narrow electron kinetic energy range of the RAS spectrum and is shown in Fig. 6. The bottom panel of Fig. 6 will be discussed in more detail later in Section 4.1. The blue curve in the top panel of Fig. 6 is a resonant Auger electron spectrum, integrated for the NH2+ ions, shown in the bottom panel. A series of 3–4 peaks, separated by about 390 meV and attributed to Auger decay in a fragment ion after ultrafast dissociation, can be clearly distinguished. To the best of our knowledge, this is the first vibrationally resolved coincidence measurement for such high electron kinetic energies.
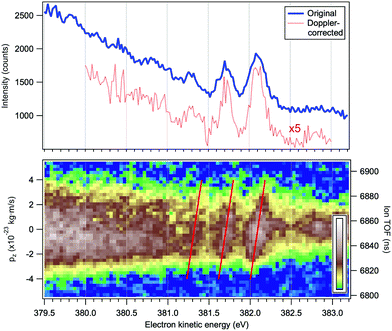 | ||
| Fig. 6 Top panel: Resonant Auger electron spectrum following the N 1s → 4a1 excitation at the top of the resonance, at ħω = 400.66 eV. The blue curve corresponds to all detected electrons and the red curve to the electrons detected in coincidence with a single NH2+ ion and corrected for the Doppler energy shift. Bottom panel: Electron–ion coincidence (PEPICO) map of the Auger electrons and the NH2+ ions. The tilted red lines were derived using a purely analytical expression for the Doppler shift (eqn (4)). The vertical scales give the flight times of the ions (right) and the corresponding values pz of the ion momenta projected on the TOF spectrometer's axis (left). | ||
As it will be explained below, knowing the NH2+ ion momentum and assuming momentum conservation in the course of the two-body dissociation process, we can obtain the kinetic energy release (EKER) for the NH3+ → NH2+ + H and NH20 → NH2+ channels, following 1s → 4a1 photoexcitation. The kinetic energy release EKER as a function of Auger electron energy Ee, based on the median momentum of the NH2+ ions, is presented in Fig. 7.
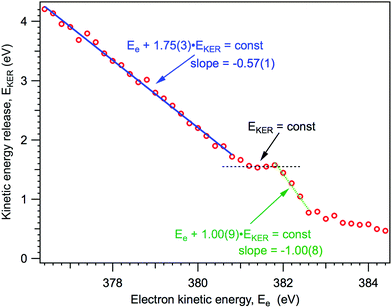 | ||
| Fig. 7 Kinetic energy release in the dissociation events, based on the median momentum of the NH2+ ions. | ||
From Fig. 7 we can note three distinct features of the ion EKER as a function of the kinetic energy of resonant Auger electrons: (1) a monotonous increase of the EKER with the slope of −1.00(9) in the region preceding the fragment band (Ee > 382 eV); (2) the presence of plateau in the region of the fragment band; and (3) a monotonous increase with the slope of −0.57(1) of EKER with decrease of the Auger electron kinetic energy for the molecular band (Ee < 380 eV). These different peculiar behaviours of kinetic energy release EKER in the molecular and fragment band regions are discussed in the following Sections 4.2 and 4.3 together with the other new information provided by the coincidence measurements.
4 Energetic and dynamic behaviour of the fragment band
Since the Auger electron is ejected with momentum k from the NH2+ dissociated fragment freely moving with the velocity v, each vibrational line of NH2+, is Doppler shifted 7,10,11
4.1 Auger–Doppler effect for the NH2+ fragment band
Contrary to the thermal Doppler effect, high values of the Auger electron (k) and the fragment momenta (p) lead to large AD shift and have a significant influence on the spectral shape of the fragment lines:| Ee = ħωcf + ενc − ενf + k·v | (2) |
 is the momentum of the electron while v = p/M is the velocity vector of the NH2+ fragments with mass M ≡ mNH2 which is predominantly parallel to the dissociating H2N–H bond. We choose the z-axis parallel to k. The AD effect was first observed in conventional Auger spectra of randomly oriented molecules as the splitting of the Auger spectral features when the Auger electron was detected along the polarization vector e of X-ray field11.
Contrary to conventional Auger spectroscopy, energy selected Auger-electron–photoion coincidence technique allows to ‘directly’ observe the Doppler shift k·v, because now both electron k and cation p momenta are well defined owing to the fixed geometry of the detection in the coincidence setup, where the electrons and ions are collected at opposite angles along the z-axis (Fig. 1).
In the following, we concentrate on the coincidence analysis of the electrons and ions, measured at the N 1s → 4a1 resonance.
The bottom panel of Fig. 6 is an electron–ion coincidence map of the NH2+ ions with the resonant Auger electrons. The width of the horizontal band reflects the broadening of the ion TOF peak at various coincident electron energies. One can observe an overall broadening towards lower electron kinetic energies indicating an increase in the momentum the ion obtains in the dissociation event. The momentum scale for the component pz is attached to the PEPICO map, as discussed later. The fragment peaks in the electron spectrum correspond to specific features in the PEPICO map – a tilted pattern is observed for each peak. Next, we demonstrate that these are signature features of the Doppler effect in the Auger electron emission.
The acceptance angle for electrons is ≤15 degrees from the axis, whereas the ions were collected, in principle, from the full 4π solid angle. However, the initial momentum of the ions along the z-axis affects the flight time of the ions, broadening the peaks in the ion TOF spectrum. This deviation from the nominal flight time is in a good approximation proportional to the axial momentum component pz, which then allows determining, from the actual flight time, the pz value for each ion.
In a Wiley-McLaren type ion TOF spectrometer, the relationship between the change in the flight time, dT, and the initial momentum component of the ion, pz, is in a good approximation given by the accelerating force Fs in the source region:
 | (3) |
 . A more accurate conversion is obtained by numerical ion flight trajectory simulations, which also include the effects of the delayed application of the ion extraction voltage Us following the ionization event.18 The delay, caused by both the flight time of the coincident electron and the switching times in the electronics, was about 500 ns. According to the simulations, pz = (−9.14 × 10⁻²⁵) × ΔT, which is used for obtaining the pz values of the ions from the coincidence dataset.
Knowing the momentum pz of the electron emitter ion along the emission direction allows us to calculate the Doppler correction to the electron's velocity and kinetic energy in the laboratory frame. When the kinetic energy of the electron from an emitter at rest is Ee, the change in its energy, when emitted from a moving ion, is
 | (4) |
 and neglected the deviation of the electron emission from the z-axis. Taking Ee = 382 eV gives
  . The tilted red lines in the bottom panel of Fig. 6 mark the changes due to the Doppler effect in the kinetic energy of the resonant Auger electrons emitted from a NH2+ fragment. These lines were derived using the analytical relationship (4) derived above. As can be seen, they represent the observed patterns very well.
In the top panel of Fig. 6 the red dotted curve shows the “Doppler-corrected” spectrum, in which the Doppler shift was removed before generating the spectrum. Ideally, the Doppler energy correction should be done for each electron that was detected in coincidence with a NH2+ fragment, on an event-by-event basis. The Doppler shift can be obtained using eqn (4) and the measured pz value for the ion. However, in an actual measurement, events may contain false coincident NH2+ ions originating from a different molecule than the one from which the detected electron was emitted, whereas the true coincident ion could remain undetected. Clearly, Doppler correction from false coincidences can not improve the spectral resolution and its effectiveness, therefore, depends strongly on the quality of the coincident dataset. In the present experiment, the requirement of high electron energy resolution reduced the transmission of electron spectrometer, which made it impractical to obtain coincidence data of high purity (minimal contribution from false coincidences). From comparison with the random-triggered dataset, we estimated that 41% of all detected NH2+ ions were true coincidences with the resonant Auger electrons, and thus event-by-event Doppler correction would not be very efficient.
Instead, we performed the Doppler correction on histograms, in which case the false coincidence contribution can be eliminated. From the PEPICO map of Fig. 6, where the false coincidence background was first subtracted, a series of electron spectra were generated by slicing the ion TOF scale. Each slice spectrum then corresponds (within a narrow range) to a certain value of ΔT and pz, and the Doppler shifts  can be calculated for all slices. Then, the slices were shifted by
  and added up, to obtain the red curve in the top panel of Fig. 6. As expected, the resulting “Doppler-corrected” spectrum exhibits narrowing of the peaks, as one source of broadening has been removed.
4.2 E KER dispersion features of the fragment band
In this section we elaborate on the appearance of the following features observed in Fig. 7: (1) the plateau in the region of about 381–382 eV, which corresponds to the ν = 0, 1, 2, 3 vibrationally excited ã+ state of the NH2+ fragment ion (see the Auger spectrum Fig. 3); (2) monotonous decrease of EKER with the slope = −1 in the region Ee > 382 eV. The last branch of the dispersion EKERvs. Ee lying in the molecular region will be discussed in the next section. As we already clarified from the Auger spectrum (Fig. 3), the plateau region (Ee = 381–382 eV) can be almost exclusively attributed to the late Auger decay during the UFD process.To give insight into the physical reason of the EKER dependence on the energy of the Auger electron Ee let us write down the cross section of the coincidence process in the fragment region.
First, we derive the “coincidence” cross section. To avoid cumbersome analysis we neglected here the lifetime vibrational interference (LVI) of intermediate vibrational levels7,24,28
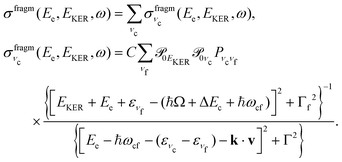 | (5) |
 | (6) |
 and Pcf = |〈νc|νf〉(fragm)|2 are the FC factors of bound–bound photoabsorption transition in the NH3 molecule and the Auger decay in core-excited fragment N*H2, respectively, Ω = ω − ωV0 is the detuning of ω relative to the frequency of the vertical absorption transition ωV0 = (Ec(R0) − E0)/ħ, ΔEc = Ec(R0) − Ec(∞), ħωcf = Ec(∞) − Ef(∞),
  and
and  is the gradient of the potential energy curve Ec(R) of the core-excited state at the equilibrium R0. Since the dissociative broadening Δ of the studied core-excited state is much larger than Γ and Γf, the broad FC factor
  (6) plays a minor role in the studied process. The RAS cross section
 | (7) |
![[X with combining tilde]](https://www.rsc.org/images/entities/char_0058_0303.gif) final state for NH3+ (Ee ∼ 389–390 eV) is well resolved and the NH2+ fragment lines at Ee ∼ 381–382 eV appear considerably broader owing to the contribution of Γ ∼ 130 meV.
final state for NH3+ (Ee ∼ 389–390 eV) is well resolved and the NH2+ fragment lines at Ee ∼ 381–382 eV appear considerably broader owing to the contribution of Γ ∼ 130 meV.
Let us analyse the partial “coincidence” cross section  (eqn (5)) where the signal is collected from different directions of p:
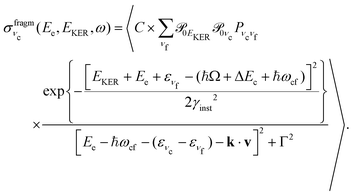 | (8) |
 is approximately constant, therefore the kinetic energy resolution
  . Since this value is in fact much larger than the lifetime broadening of the final state Γf: γinst ≫ Γf, we replaced the Lorentzian {[EKER + Ee + ενf − (ħΩ + ΔEc + ħωcf)]2 + Γf2}−1 in eqn (8) by a Gaussian that represents the experimental broadening.
Because of the averaging over the directions of the fragment momentum p, the peak position of the partial cross section  (see eqn (8)) does not depend on the Doppler shift and
  exhibits a maximum when two resonant conditions are fulfilled
| EKER = −(Ee + ενf) + ħΩ + ΔEc + ħωcf, Ee = ħωcf + ενc − ενf. | (9) |
| EKER = −ενc + const | (10) |
| EKER = −ενc + ΔEc + ħΩ = const, Ee = ħωcf + ενc − ενf. | (11) |
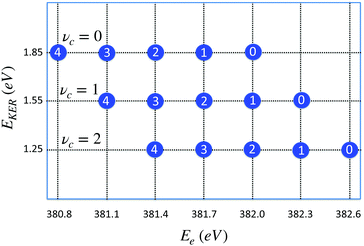 | ||
| Fig. 8 Distribution of maxima of the total cross section σfragm(Ee,EKER,ω) (eqn (8)) in the (EKER,Ee) plane. Labels in circles show the vibrational quantum number of the final state νf = 0,1,2,3,4. Calculation is performed using eqn (11) for νc = 0,1,2 and harmonic potentials for core-excited and final states with vibrational frequencies ωvib = 0.385 eV. ωcf = 382 eV. Δ = 1, ΔEc = Ec(R0) − Ec(∞) = 2 eV, Ω = 0. When νc increases the distribution is shifted to the right (to higher values of) Ee = ωcf + ενc − ενf, while EKER = −ενc + ΔEc + Ω decreases (see eqn (11)). | ||
The distribution of the maxima (11) of the “coincidence” cross section (eqn (8)) displayed in Fig. 8 shows that the slope of the EKER(Ee) is 0 (horizontal) when the number of populated vibrational levels in the core-excited state is significantly smaller than the number of the final vibrational states. This is the case of the experimentally observed dependence in the electron kinetic energy region 381 eV < Ee < 382 eV (see Fig. 7). This result is fully in line with the RAS spectrum shown in Fig. 3 since the fragment decay shows a vibrational progression which is typical for starting at νc = 0.29 Progressions starting at vc > 0 would show different intensity distributions; in particular a progression starting from vc = 1 would show the vc = 1 → vf = 0 transition at 382.3 eV. From the absence of such a peak we can conclude that contributions from vc > 0 can be neglected.
In a general case, when the numbers of core-excited and final-state vibrational levels are comparable, the slope of the function EKER(Ee) can deviate significantly from 0.
Additional details of the relationship between the kinetic energy release in the dissociation and the Auger electron energy can be obtained from the investigation of the EKER distribution curves. In Fig. 9a and b, the experimental distributions N(EKER) are presented as two-dimensional histograms, allowing to show their evolution with the electron energy (Ee). Panel (a) shows the unnormalised distributions, thus reflecting also the variations of the intensity in the coincident Auger electron spectrum. Panel (b) gives all the distributions (vertical slices) as normalized to unity, and thus the variations seen reflect solely the changes in the shape of N(EKER). As can be seen from the comparison of panels (a) and (b), the distinct vertical lines in (a) arise mainly from the increased cross section at these vibrational peak positions in the Auger spectrum, and the actual changes in the N(EKER) are minor (panel b). The distribution (N(EKER)) gradually broadens as the electron energy decreases (resulting in lower peak values and correspondingly less contrast in panel b).
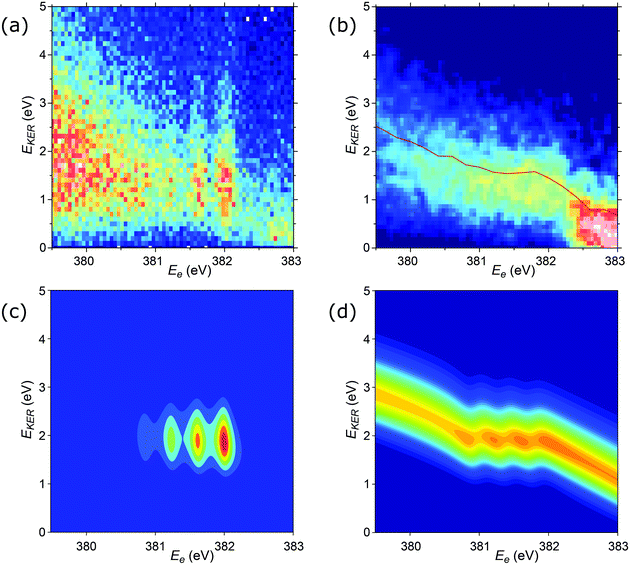 | ||
| Fig. 9 2D plots for the distributions of EKER as a function of resonant Auger electron energy Ee for the fragment band region. (a) Experimentally derived EKER as a function of Ee measured at the top of the resonance, at ħω = 400.66 eV. (b) Experimental data derived from the normalised momentum distribution as a function of Ee. The normalisation was done by the area for each bin of electron kinetic energy Ee. The red curve is the EKER distribution, derived from the median momentum of the NH2+ ion (see Fig. 7). The observed intensity at Ee > 382.5 eV corresponds to the high-binding-energy tail of the molecular participator state e−1 of NH3+. (c) Theoretical cross section calculated by eqn (8) displaying four vibrational lines with the tails dispersing as Ee = const in agreement with the experimental panel (a). (d) Normalised theoretical cross section σfragmnorm(Ee,EKER,ω) (12) featuring that the dispersion of the tails of the vibrational line ν = 0 at Ee > 382 eV is close to EKER + Ee = const in agreement with the experimental panel (b) and Fig. 7. Calculations were performed for νc = 0, νf = 0,1,2,3, Ω = 0, Γ = HWHM = 0.11 eV, P00 = 0.4, P01 = 0.3, P02 = 0.2, P03 = 0.1. Γ is the experimental HWHM broadening of the RAS vibrational lines. In simulations, we used experimentally derived dependence γinst(EKER) = 0.09 + 0.282EKER0.6. | ||
We also computed normalised theoretical cross sections, which were derived from eqn (8):
 | (12) |
![[scr P, script letter P]](https://www.rsc.org/images/entities/char_e52f.gif) 0EKER (eqn (6)) in eqn (8) for the cross section:
0EKER (eqn (6)) in eqn (8) for the cross section: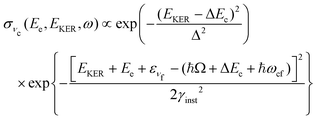 | (13) |
| EKER = const, and EKER + Ee = const | (14) |
The cross section (eqn (8)), being the product of the Gaussian and the Lorentzian, has two resonant features given by eqn (11). The maximum of the Lorentzian evolves along the vertical line Ee = const, while the maximum of the Gaussian follows the dispersion along the tilted line EKER = −Ee + const with the slope equal to −1. Apparently, when γinst ≤ Γ the Gaussian plays a major role, which results in a tilted dispersion EKER = −Ee + const. With increase of the ratio γinst/Γ the horizontal dispersion starts to compete with the tilted dispersion and the dispersion line EKER(Ee) rotates clockwise (Fig. 10) and approaches the vertical line Ee = const when γinst/Γ ≫ 1. The instrumental broadening γinst is dependent on EKER and is larger in average than Γ. We computed the dispersion of each vibrational spectral line using eqn (8) neglecting the Doppler effect and taking into account the experimental dependence of γinst on Ee. The calculated dispersion EKER(Ee) is close to the vertical one in agreement with the measurements (see Fig. 9a).
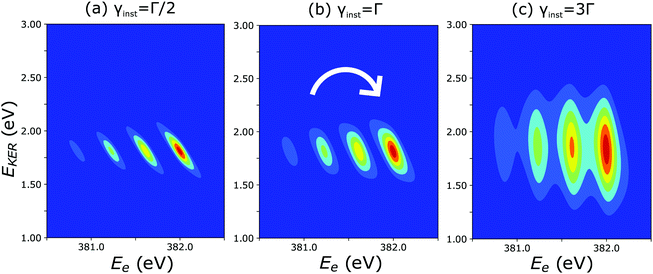 | ||
| Fig. 10 Theoretical 2D plots of EKER as a function of Ee calculated by eqn (8): the dispersion of vibrational lines ‘rotates’ clockwise with increase of the ratio γinst/Γ (see text for more details). | ||
4.3 Molecular band: redistribution of available energy
The molecular band is formed by the Auger transitions near the equilibrium ground state geometry R0 of NH3 (Fig. 4), contrary to the Auger decays in the core-excited already dissociated fragment far away from R0 which produce the fragment band (Fig. 5).The region below Ee < 381 eV is largely dominated by molecular Auger decay, taking place at the NH2–H bond distances close to the ground-state geometry of ammonia, where the NH2+ fragment is formed by the dissociation in the final state after emission of the Auger electron. In this case, the partitioning of the internal energy left in the system after Auger decay occurs in the final molecular state of the NH3+ ion.
To describe the coincidence measurements of the molecular band with the dissociative final state we should use the following expression for the cross section:
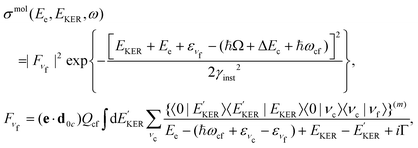 | (15) |
 and EKER correspond to the dissociative nuclear state along the reaction coordinate. The kinetic energy release
  and EKER are depicted in Fig. 4.
In the case explored in this work for dissociative core-excited and final states, the spectral width of the RAS amplitude Fνf is defined by the spectral width of the continuum–continuum FC amplitude  25
25
 | (16) |
| EKER + Ee + εinf = const, εinf = ενf + εrot | (17) |
Neglecting internal degrees of freedom gives the equation
| EKER + Ee = const. | (18) |
| Ee + 1.75(3) × EKER = const | (19) |
In the following, we discuss the possible ways of partitioning of the internal energy between rotational and translational degrees of freedom.
We consider the dissociation of AB3 molecule (NH3 in the present study) which has a trigonal pyramidal shape
| AB3 → AB2 + B | (20) |
The total available energy
| Eav = ω − ωf0 − Ee = EKER + εinf | (21) |
| PAB2 + PB = 0, JAB2 + JB = 0 | (22) |
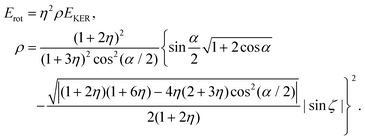 | (23) |
 | (24) |
Since the dimensionless mass parameter
 | (25) |
Conclusion: the recoil-induced rotational excitation is small for molecules with a light dissociating atom (for example, the hydrogen atom, B = H). However, Erot can become approaching EKER when masses MA and MB are comparable; in this case the recoil-induced rotational heating is important and has to be taken into account.
The physical mechanism of this important dynamical effect is briefly described along the following lines. The core-excited NH3 molecule is pyramidal in its equilibrium geometry with the angle α ∼ 108°, similar to the one of its ground state.19,23 We can assume that it may decay to the final state with the planar equilibrium geometry, which is dissociative along the H2N–H bond. When the planar final state is reached after the Auger decay, the NH2 group rotates from pyramidal to planar geometry at the same time as the H2N–H bond elongation starts to proceed. When the N–H bond is “suddenly” broken, the NH2+ fragment becomes free but it continues the free rotation. In this case, the rotational energy is then borrowed from the energy of the chemical bond.
As an example, it was demonstrated that for the photodissociation of valence-excited H2O37 94% of the bond dissociation energy is transformed into the rotational energy (Erot ≈ 0.94EKER) of the OH fragment. Thus we can not exclude that the observed 43% loss of the dissociation energy might be related to the rotational excitation of the NH2+ caused by the transformation from pyramidal (in the ground or core-excited state) to planar geometry in the final dissociative state.
| BAB → BA⋯B | (26) |
| E(R,r) ≈ Vtr(R) + Vvib(r,R) | (27) |
5 Conclusions
We have performed a coincidence study of the ultrafast dissociation process occurring in ammonia upon excitation of the N 1s core electron to the antibonding LUMO (4a1) orbital. The new coincidence setup GPES, permanently installed at the FinEstBeAMS beamline of the MAX IV synchrotron radiation facility in Lund, Sweden, allows achieving high resolution for resonant Auger electrons which are correlated to ion momenta measured simultaneously for each ionisation event.Correlation of NH2+ ion flight times with Auger electron kinetic energy shows directly a dispersion of each vibrational resonance of the UFD fragment, which is attributed to the Auger–Doppler effect caused by ejection of the electron from the moving  radical in the core-excited state.
Furthermore, the median distributions of kinetic energy release as a function of electron kinetic energy show prominent dispersion behaviors in different regions of the corresponding RAS spectrum, particularly in the regions of the so-called molecular and fragment bands: molecular band Ee + 1.75EKER = const, fragment band EKER = const and Ee + EKER = const for the region preceding the fragment band. These dispersions are explained with the help of theory and trends for more general cases are provided in this work. A particularly interesting dispersion is observed in the molecular-band region, corresponding to the Auger decays to the first spectator (3a214a11) state, which deviates significantly from EAuger + EKER = const, previously observed in all the coincidence studies of UFD cases, exploiting ejection of an atomic fragment. The ‘loss’ of translational energy of the NH2+ ion is attributed to the redistribution of the available energy to the dissociation energy and excitation of the internal degrees of freedom of the fragment in the course of the dissociation in the final state.
An unusual distribution of EKER within each vibrational state of the fragment is demonstrated to be caused by the competition between the Raman EKER + Ee = const and Auger dispersion Ee = const: when the broadening by the finite kinetic energy release resolution increases, the slope of the linear dispersion rotates from the Raman to the Auger dispersion.
Moreover, we have recorded an ultra-high-resolution single-channel RAS spectrum with low signal-to-noise ratio, where very different line widths are observed for the vibrational components of the fragment and molecular bands. Auger decays to the final bound ![[X with combining tilde]](https://www.rsc.org/images/entities/char_0058_0303.gif) state (3a−11) form much narrower vibrational lines with the spectral width limited by the instrumental resolution, while the fragment band consists of lines with the width defined by the lifetime broadening of the core-excited state and the Doppler broadening.
state (3a−11) form much narrower vibrational lines with the spectral width limited by the instrumental resolution, while the fragment band consists of lines with the width defined by the lifetime broadening of the core-excited state and the Doppler broadening.
To conclude, this work demonstrates a great potential of the high-resolution Auger electron – ion momenta imaging technique for the future studies of the partitioning of the excess energy between internal degrees of freedom in dissociating molecular fragments.
Conflicts of interest
There are no conflicts to declare.Acknowledgements
We acknowledge MAX IV Laboratory for time on Beamline FinEstBeAMS under Proposal 20180420. Research conducted at MAX IV, a Swedish national user facility, is supported by the Swedish Research council under contract 2018-07152, the Swedish Governmental Agency for Innovation Systems under contract 2018-04969, and Formas under contract 2019-02496. We acknowledge SOLEIL Synchrotron in France for time on the PLEIADES beamline under Proposals No. 20201704. We are grateful to MAXIV and SOLEIL staff for smoothly running the facility. V. K. acknowledges the Swedish Research Council, Project No. 2019-03470. F. G also acknowledges support by Helmholtz-Zentrum Berlin für Materialien und Energie GmbH. F. G. P. K. and V. K. acknowledge also the Russian Science Foundation, Project No. 21-12-00193. O. T. acknowledges financial support from the French Agence Nationale de la Recherche (ANR) through the MUSTACHE project (ANR-18-CE30-0015).Notes and references
- H. Ågren, J. Nordgren, L. Selander, C. Nordling and K. Siegbahn, Phys. Scr., 1978, 18, 499 CrossRef.
- P. Morin and I. Nenner, Phys. Rev. Lett., 1986, 56, 1913 CrossRef CAS PubMed.
- C. Miron, P. Morin, D. Céolin, L. Journel and M. Simon, J. Chem. Phys., 2008, 128, 154314 CrossRef PubMed.
- M. N. Piancastelli, R. Guillemin, M. Simon, H. Iwayama and E. Shigemasa, J. Chem. Phys., 2013, 138, 234305 CrossRef CAS PubMed.
- H. Sann, T. Havermeier, C. Müller, H.-K. Kim, F. Trinter, M. Waitz, J. Voigtsberger, F. Sturm, T. Bauer, R. Wallauer, D. Schneider, M. Weller, C. Goihl, J. Tross, K. Cole, J. Wu, M. S. Schöffler, H. Schmidt-Böcking, T. Jahnke, M. Simon and R. Dörner, Phys. Rev. Lett., 2016, 117, 243002 CrossRef CAS PubMed.
- T. Jahnke, V. Mergel, O. Jagutzki, A. Czasch, K. Ullmann, R. Ali, V. Frohne, T. Weber, L. P. Schmidt, S. Eckart, M. Schöffler, S. Schößler, S. Voss, A. Landers, D. Fischer, M. Schulz, A. Dorn, L. Spielberger, R. Moshammer, R. Olson, M. Prior, R. Dörner, J. Ullrich, C. L. Cocke and H. Schmidt-Böcking, in High-Resolution Momentum Imaging-From Stern's Molecular Beam Method to the COLTRIMS Reaction Microscope, ed. B. Friedrich and H. Schmidt-Böcking, Springer International Publishing, Cham, 2021, pp. 375–441 Search PubMed.
- F. Gel'mukhanov, M. Odelius, S. P. Polyutov, A. Föhlisch and V. Kimberg, Rev. Mod. Phys., 2021, 93, 035001 CrossRef.
- K. Le Guen, C. Miron, D. Céolin, R. Guillemin, N. Leclercq, M. Simon, P. Morin, A. Mocellin, O. Björneholm, A. Naves de Brito and S. L. Sorensen, J. Chem. Phys., 2007, 127, 114315 CrossRef CAS PubMed.
- X.-J. Liu, Q. Miao, F. Gel'mukhanov, M. Patanen, O. Travnikova, C. Nicolas, H. Ågren, K. Ueda and C. Miron, Nat. Photon., 2014, 9, 120 CrossRef.
- F. Gel'mukhanov, H. Ågren and P. Sałek, Phys. Rev. A: At., Mol., Opt. Phys., 1998, 57, 2511 CrossRef.
- O. Björneholm, M. Bässler, A. Ausmees, I. Hjelte, R. Feifel, H. Wang, C. Miron, M. N. Piancastelli, S. Svensson, S. L. Sorensen, F. Gel'mukhanov and H. Ågren, Phys. Rev. Lett., 2000, 84, 2826 CrossRef PubMed.
- O. Björneholm, J. Chem. Phys., 2001, 115, 4139–4149 CrossRef.
- R. Guillemin, M. Simon and E. Shigemasa, Phys. Rev. A: At., Mol., Opt. Phys., 2010, 82, 051401 CrossRef.
- M. Kitajima, K. Ueda, A. De Fanis, T. Furuta, H. Shindo, H. Tanaka, K. Okada, R. Feifel, S. L. Sorensen, F. Gel'mukhanov, A. Baev and H. Ågren, Phys. Rev. Lett., 2003, 91, 213003 CrossRef CAS PubMed.
- O. Travnikova, J.-C. Liu, A. Lindblad, C. Nicolas, J. Söderström, V. Kimberg, F. Gel'mukhanov and C. Miron, Phys. Rev. Lett., 2010, 105, 233001 CrossRef PubMed.
- L. Rosenqvist, K. Wiesner, A. Naves de Brito, M. Bässler, R. Feifel, I. Hjelte, C. Miron, H. Wang, M. N. Piancastelli, S. Svensson, O. Björneholm and S. L. Sorensen, J. Chem. Phys., 2001, 115, 3614 CrossRef CAS.
- K. Wiesner, A. Naves de Brito, S. L. Sorensen, F. Burmeister, M. Gisselbrecht, S. Svensson and O. Björneholm, Chem. Phys. Lett., 2002, 354, 382–388 CrossRef CAS.
- K. Kooser, A. Kivimäki, P. Turunen, R. Pärna, L. Reisberg, M. Kirm, M. Valden, M. Huttula and E. Kukk, J. Synchrotron Radiat., 2020, 27, 1080–1091 CrossRef CAS PubMed.
- I. Hjelte, M. N. Piancastelli, C. M. Jansson, K. Wiesner, O. Björneholm, M. Bässler, S. L. Sorensen and S. Svensson, Chem. Phys. Lett., 2003, 370, 781–788 CrossRef CAS.
- E. Kukk, D. Céolin, O. Travnikova, R. Püttner, M. N. Piancastelli, R. Guillemin, L. Journel, T. Marchenko, I. Ismail, J. Martins, J.-P. Rueff and M. Simon, New J. Phys., 2021, 23, 063077 CrossRef CAS.
- R. Pärna, R. Sankari, E. Kukk, E. Nõmmiste, M. Valden, M. Lastusaari, K. Kooser, K. Kokko, M. Hirsimäki, S. Urpelainen, P. Turunen, A. Kivimäki, V. Pankratov, L. Reisberg, F. Hennies, H. Tarawneh, R. Nyholm and M. Huttula, Nucl. Instrum. Methods Phys. Res., Sect. A, 2017, 859, 83–89 CrossRef.
- J. Schirmer, A. B. Trofimov, K. J. Randall, J. Feldhaus, A. M. Bradshaw, Y. Ma, C. T. Chen and F. Sette, Phys. Rev. A: At., Mol., Opt. Phys., 1993, 47, 1136–1147 CrossRef CAS PubMed.
- N. Walsh, A. Sankari, J. Laksman, T. Andersson, S. Oghbaie, F. Afaneh, E. P. Månsson, M. Gisselbrecht and S. L. Sorensen, Phys. Chem. Chem. Phys., 2015, 17, 18944–18952 RSC.
- F. Gel'mukhanov and H. Ågren, Phys. Rep., 1999, 312, 87–330 CrossRef.
- F. Gelmukhanov and H. Ågren, Phys. Rev. A: At., Mol., Opt. Phys., 1996, 54, 379–393 CrossRef CAS PubMed.
- O. Björneholm, S. Sundin, S. Svensson, R. R. T. Marinho, A. Naves de Brito, F. Gel'mukhanov and H. Ågren, Phys. Rev. Lett., 1997, 79, 3150–3153 CrossRef.
- O. Takahashi, K. Matsuyama, K. Tabayashi and K. Yamasaki, J. Phys. B, 2009, 42, 245102 CrossRef.
- F. Gel'mukhanov, L. Mazalov and A. Kondratenko, Chem. Phys. Lett., 1977, 46, 133–137 CrossRef.
- O. Travnikova, C. Miron, M. Bässler, R. Feifel, M. Piancastelli, S. Sorensen and S. Svensson, J. Electron Spectrosc. Relat. Phenom., 2009, 174, 100 CrossRef CAS.
- D. Céolin, J.-C. Liu, V. Vaz da Cruz, H. Ågren, L. Journel, R. Guillemin, T. Marchenko, R. K. Kushawaha, M. N. Piancastelli, R. Püttner, M. Simon and F. Gel'mukhanov, Proc. Natl. Acad. Sci. U. S. A., 2019, 116, 4877–4882 CrossRef PubMed.
- Q. Miao, O. Travnikova, F. Gel'mukhanov, V. Kimberg, Y.-P. Sun, T. D. Thomas, C. Nicolas, M. Patanen and C. Miron, J. Phys. Chem. Lett., 2015, 6, 1568–1572 CrossRef CAS PubMed.
- Y.-P. Sun, C.-K. Wang and F. Gel'mukhanov, Phys. Rev. A: At., Mol., Opt. Phys., 2010, 82, 052506 CrossRef.
- J.-C. Liu, V. Vaz da Cruz, S. Polyutov, A. Föhlisch and F. Gel'mukhanov, Phys. Rev. A, 2019, 100, 053408 CrossRef CAS.
- K. E. Holdy, L. C. Klotz and K. R. Wilson, J. Chem. Phys., 1970, 52, 4588–4599 CrossRef CAS.
- H. B. Levene, J. Nieh and J. J. Valentini, J. Chem. Phys., 1987, 87, 2583–2593 CrossRef CAS.
- R. Schinke, Photodissociation Dynamics: Spectroscopy and Fragmentation of Small Polyatomic Molecules, Cambridge University Press, 1993 Search PubMed.
- H. Wang, Y. Yu, Y. Chang, S. Su, S. Yu, Q. Li, K. Tao, H. Ding, J. Yang, G. Wang, L. Che, Z. He, Z. Chen, X. Wang, W. Zhang, D. Dai, G. Wu, K. Yuan and X. Yang, J. Chem. Phys., 2018, 148, 124301 CrossRef PubMed.
- R. Dixon, Mol. Phys., 1989, 68, 263–278 CrossRef CAS.
- J. D. Rodrguez, M. G. González, L. Rubio-Lago and L. Bañares, Phys. Chem. Chem. Phys., 2014, 16, 406–413 RSC.
- C. Xie, J. Ma, X. Zhu, D. H. Zhang, D. R. Yarkony, D. Xie and H. Guo, J. Phys. Chem. Lett., 2014, 5, 1055–1060 CrossRef CAS PubMed.
- R. C. Couto, V. V. Cruz, E. Ertan, S. Eckert, M. Fondell, M. Dantz, B. Kennedy, T. Schmitt, A. Pietzsch, F. F. Guimarães, H. Ågren, F. Gel'mukhanov, M. Odelius, V. Kimberg and A. Föhlisch, Nat. Commun., 2017, 8, 14165 CrossRef CAS PubMed.
Footnote |
| † Present address: Top Analytica, Ruukinkatu 4, FI-20540, Turku Finland. |
| This journal is © the Owner Societies 2022 |


