Rapid synthesis of Cu2O hollow spheres at low temperature and their catalytic performance for the decomposition of ammonium perchlorate†
Tao-Tao
Lv
ab,
Huai-Zhong
Xing
c,
Hong-Mei
Yang
c,
Hui-Xiang
Wang
*a,
Jing
Shi
a,
Jing-Pei
Cao
 *ab and
Bao-Liang
Lv
 *ab
*ab
aState Key Laboratory of Coal Conversion, Institute of Coal Chemistry, Chinese Academy of Sciences, Taiyuan 030001, China. E-mail: wanghx@sxicc.ac.cn; lbl604@sxicc.ac.cn; Fax: +86 351 4041153; Tel: +86 351 4063121
bJiangsu Province Engineering Research Center of Fine Utilization of Carbon Resources, China University of Mining & Technology, Xuzhou 221116, China. E-mail: caojingpei@cumt.edu.cn
cChangzhi Comprehensive Inspection and Testing Center, Changzhi 046000, China
First published on 11th September 2021
Abstract
In catalytic reactions, a large specific surface area usually means more active sites. Hollow structures can provide lots of surface sites to catalyze the reaction or fix the reaction center, but the preparation process is mostly complex. In this work, using NH4+ as a structure-directing agent and ascorbic acid (AA) as a reducing agent, combined with the self-transformation process of metastable aggregated particles and the local Ostwald ripening mechanism, hollow Cu2O nanospheres with a large specific surface area (30.9 m2 g−1) were rapidly synthesized by a one-step method at low temperature. In the thermal decomposition of ammonium perchlorate (AP), it was found that the decomposition temperatures at low temperature and high temperature decreased by 31.6 °C and 125 °C, respectively. Compared with pure AP, the heat release increased by 1.5 times, and the reaction activation energy reduced by 56.0%. This is because the Cu2O hollow spheres have a larger specific surface area, and the adsorption capacity is improved owing to the loose and porous structure. The catalytic area and active sites for continuous reaction are increased, and thus the Cu2O hollow spheres exhibited excellent catalytic performance.
1. Introduction
Morphology and size have great influences on the performance of nanomaterials. Hollow nanostructures have attracted increasing attention due to their advantages including a large specific surface area, low density and strong carrying capacity, and thereby are potentially applied in many fields,1–3 such as high-performance catalysts, drug delivery carriers, lithium-ion battery materials, gas sensors, etc. However, for crystalline materials, the formation of hollow structures is a thermodynamically repressive process during crystal growth on account of the high surface energy.4As a transition metal oxide with a variable valence state, Cu2O has been widely used in the field of catalysis owing to its advantages, such as low cost, non-toxicity, abundance and easy synthesis, and its catalytic performance is closely related to its structure and morphology.5–7 Ammonium perchlorate (AP) is one of the main oxidants used in composite propellants, and the combustion behavior of propellants is bound up with the thermal decomposition of AP.8,9 Studies have proved that the addition of a catalyst can convert the proton transfer mechanism of AP decomposition into the electron transfer mechanism, resulting in the decrease of decomposition temperature.9–13 Since Cu2O tends to capture or release surface lattice oxygen in redox reactions, it is considered to be one of the most promising thermal combustion catalysts.5,14,15 Compared with solid particles, on account of the existence of internal and external surfaces, the Cu2O hollow structure can provide a large number of surface sites to catalyze the reaction or fix the reaction center, and pore structures can carry out rapid mass transfer and sieving, thereby improving the reaction efficiency.16–18 At present, there are two kinds of general methods for preparing hollow nanomaterials: template strategy19,20 and emulsion synthesis.21,22 It is worth noting that the synthesis methods based on the template strategy are faced with the problem of removing the template, which greatly limits their practical application; most emulsion synthesis methods require high temperature and high-pressure reaction conditions, and the processes are relatively complex. Therefore, it is imperative to develop a simple and mild method to control the synthesis of Cu2O hollow structure on the based on the existing research.
In this study, we successfully introduced NH4+ and synthesized uniformly dispersed Cu2O hollow spheres by a one-step method under the action of a reducing agent, without using any templates or etchants. The formation of Cu2O hollow spheres has undergone the self-transformation process of metastable aggregated particles and local Ostwald ripening, and the obtained samples have a large specific surface area and lots of active sites, exhibiting excellent catalytic performance in AP decomposition.
2. Experimental
2.1 Materials
All chemical reagents were analytically pure and used without further purification. Copper nitrate trihydrate [Cu(NO3)2·3H2O, 99.0–102.0%], ammonium nitrate (NH4NO3, 99.0%), sodium hydroxide (NaOH, 96.0%), absolute ethyl alcohol (C2H6O, 99.7%), and AP (NH4ClO4, 99.9%) were purchased from Sinopharm Chemical Reagent Co. Ltd. Ascorbic acid (AA, C6H8O6, 96.0%) was obtained from Shanghai Aladdin Bio-Chem Technology Co. Ltd. Doubly deionized water was used for all solution preparations.2.2 Synthesis of Cu2O hollow spheres
In a typical procedure, 0.365 g (1.5 mmol) Cu(NO3)2·3H2O and 0.12 g (1.5 mmol) NH4NO3 were added to 150 mL deionized water simultaneously, then the mixture was treated with continuous ultrasonication for 5 min. After the reactants are completely dissolved, the beaker was placed in a water bath set at 50 °C. After magnetic stirring for 10 min and the temperature had stabilized, 5 mL NaOH solution (1.0 M) was added dropwise, and blue Cu(OH)2 precipitates were formed immediately. After 5 min, black flocculent objects appeared in the solution. At this time, 7.5 mL of C6H8O6 (0.6 M) was quickly added dropwise to the above solution, and the black solution appeared brown and then gradually turned orange within a few seconds. Then, it was kept in the water bath for 30 min for nanocrystal growth. After the reaction, the sample was collected by centrifugation and washed with deionized water and anhydrous ethanol several times. Finally, the sample was dried in a vacuum drying oven at 60 °C for 6 h to obtain a solid product.2.3 Instruments and characterization
The morphology and size of the synthesized sample were characterized by scanning electron microscopy (SEM, JSM-7900F). Transmission electron microscopy (TEM), high-resolution transmission electron microscopy (HRTEM), and EDX mapping images were obtained on a JEM-2100F. X-ray photoelectron spectroscopy (XPS) experiments were carried out on a Kratos Axis Ultra DLD system at room temperature with Al Kα radiation and a multichannel detector. The crystallographic structures of the as-synthesized sample were determined with X-ray powder diffraction (XRD) using a Bruker AXS D8 Advance diffractometer. The UV-vis absorption spectra were acquired with the use of a HITACHI U-4100 spectrophotometer. The specific surface area of the sample was evaluated using the Brunauer–Emmett–Teller method with an Autosorb-iQ2.2.4 Catalytic activity measurements
To study the catalytic performance of the Cu2O materials on the thermal decomposition of AP, AP (98 mg) and Cu2O (2 mg) were mixed and ground in an agate mortar for a long time to ensure the homodispersion of Cu2O (a small amount of absolute ethyl alcohol was added to the mixtures during the grinding). Then, the mixtures were dried in a vacuum oven at 60 °C for 5 h. Thermogravimetric and differential scanning calorimetry (TG–DSC) analysis of pure AP and the AP–Cu2O mixtures was performed through a Netzsch DSC 449 F3 (Germany) under a N2 flow of 20 mL min−1 and at a heating rate of 5 °C min−1 from 50 to 600 °C. The TG–DSC experiment was performed in a sealed crucible with pinholes in each lid. In addition, in order to study the thermal behavior of Cu2O and AP by using the DSC data for kinetic calculation, DSC tests were also performed at heating rates of 10, 15 and 20 K min−1, respectively.3. Results and discussion
3.1 Microstructure characterization
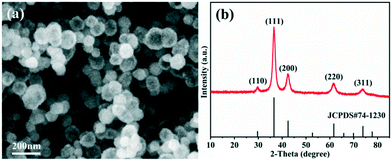
The morphology observation and structural analysis of the synthesized sample are displayed in Fig. 1. The SEM image (Fig. 1a) clearly confirms that the sample is a hollow sphere with a diameter of 80–120 nm, and the particles are highly uniform and well dispersed. The XRD pattern (Fig. 1b) exhibits that all the diffraction peaks are clearly attributed to the Cu2O cubic phase without other impurity peaks, and its lattice constant is a = 4.27 Å (JCPDS No. 74-1230). The five diffraction peaks at 29.7°, 36.6°, 42.5°, 61.6° and 73.9° can be matched with the (110), (111), (200), (220) and (311) crystal planes of cubic Cu2O, respectively. All the diffraction peaks are broadened, suggesting that the obtained spheres should consist of smaller nanocrystals. The grain size is calculated based on the Scherrer equation, and the result demonstrates that the Cu2O hollow spheres consist of small particles with an average particle size of 12 nm.The detailed structure information of the sample was obtained by TEM and HRTEM as shown in Fig. 2. Similar to the SEM image, the low magnification TEM image (Fig. 2a) confirms that the sample consists of hollow spheres with uniform dispersion which are composed of small crystallites. It is also noted that the inner surface and outer surface of the hollow sphere are relatively rough, and the shell is obviously not a single crystal structure. The TEM image of a single particle (Fig. 2b) shows that the wall thickness of the hollow sphere is ∼15 nm, and the diameter of the small crystallites composing the hollow sphere is 10–15 nm, which is close to the result calculated by the Scherrer equation. To further analyze the hollow structure, the composition line scan analysis of a single nanostructure (Fig. 2c) was carried out by HAADF-STEM energy dispersive X-ray spectroscopy (HAADF-STEM-EDX), and it is found that strong Cu and O peaks appear on both sides of the element content distribution curve, and gradually weaken towards the contour center. The EDX mapping images (Fig. S1a†) also clearly prove that the particles are indeed composed of Cu and O, and the element distribution is very uniform. In addition, EDX energy spectrum analysis (Fig. S1b†) demonstrates that the atomic ratio of Cu/O in the synthesized sample is close to 2![[thin space (1/6-em)]](https://www.rsc.org/images/entities/char_2009.gif) :
:![[thin space (1/6-em)]](https://www.rsc.org/images/entities/char_2009.gif) 1, further confirming that the obtained product is hollow Cu2O. The N element content is 0, indicating that NH4+ has been thoroughly removed, and the purity of the sample is high. The HRTEM image exhibits that the lattice stripe spacings of 0.31 nm and 0.25 nm (Fig. 2d) correspond to the (110) and (111) equivalent planes of cubic Cu2O, respectively. The SAED image in the inset displays highly diffused and relatively sharp diffraction rings without obvious diffraction spots, and the rings from inside to outside correspond to the (110), (111), (200), (220) and (311) crystal planes of Cu2O, respectively, revealing the polycrystalline structure of the Cu2O hollow spheres.
1, further confirming that the obtained product is hollow Cu2O. The N element content is 0, indicating that NH4+ has been thoroughly removed, and the purity of the sample is high. The HRTEM image exhibits that the lattice stripe spacings of 0.31 nm and 0.25 nm (Fig. 2d) correspond to the (110) and (111) equivalent planes of cubic Cu2O, respectively. The SAED image in the inset displays highly diffused and relatively sharp diffraction rings without obvious diffraction spots, and the rings from inside to outside correspond to the (110), (111), (200), (220) and (311) crystal planes of Cu2O, respectively, revealing the polycrystalline structure of the Cu2O hollow spheres.
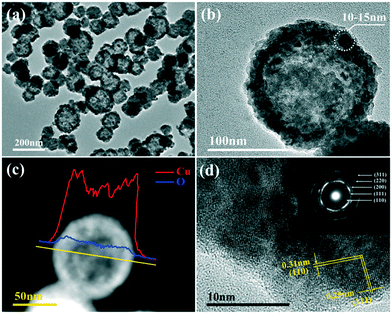 | ||
| Fig. 2 (a) Low magnification TEM image of the Cu2O hollow spheres; (b) TEM image of a single Cu2O hollow sphere; (c) corresponding EDX line scan; (d) HRTEM image (inset: SAED image). | ||
3.2 Growth process of the sample
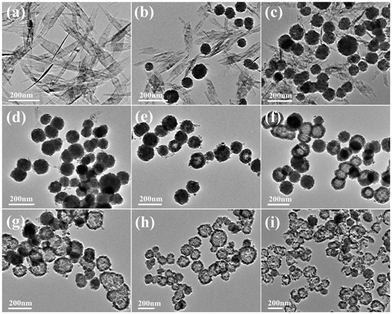
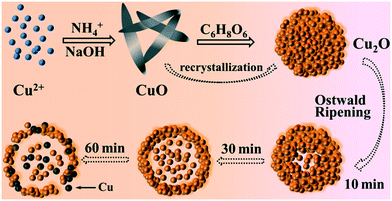
In order to study the growth process of the Cu2O hollow spheres, the structure evolution of the product at different reaction stages was observed firstly by TEM. As shown in Fig. 3a, the nanosheets with a length of 300–500 nm were obtained after adding NaOH for 5 min. The XRD pattern (Fig. S2a†) displayed that all the peaks could be attributed to monoclinic CuO, without other impurity peaks, and its growth orientation was [111] (Fig. S3a and b†). The CuO nanosheets quickly decomposed and aggregated to form small particles after adding a reducing agent (AA), and primary nanocrystalline particles were self-agglomerated to form nanospheres with diameters of 60–100 nm after 10 s (Fig. 3b). As the reaction proceeded, the amount of CuO flakes gradually decreased and that of spherical particles increased (Fig. 3c). The main peaks of the XRD pattern (Fig. S2b†) matched Cu2O, implying that most of the CuO species were converted to Cu2O after 1 min. This was due to the addition of the reducing agent, and a similar transformation process had been reported in the literature.22,23 The CuO nanocrystals were reduced and self-assembled to form Cu2O nanospheres, and the color change during this period indicated that this was a rapid chemical transformation process. When the reaction progressed to about 5 min (Fig. 3d), all the particles had transformed into nanospheres, suggesting that the CuO phase almost completely transformed into Cu2O. On account of the rapid reaction process, Cu2O spheres with a solid core were first formed. During the transformation process, the pH of the solution hardly changed, maintaining a stable chemical environment for the formation of the hollow Cu2O spheres. After 10 minutes of reaction, some Cu2O nanospheres began to appear as hollow structures (Fig. 3e), and it was inferred that the interior of the spheres was dissolved. Subsequently, the dissolution inside the particles gradually increased and expanded to the outside of the particles (Fig. 3f, reacted for 20 min). This accounted for the fact that the microcrystals located in the core had a higher surface energy than those in the outer surface and were dissolved easily, thus reducing the total energy of the system.22,24–26 Finally, when the reaction time was 30 min, the particles all transformed into Cu2O hollow spheres with a relatively uniform size (Fig. 3g). By further extending the reaction to 60 min (Fig. 3h), the wall thickness of the hollow spheres was further decreased and rupture occurred. The XRD pattern (Fig. S2c†) confirmed that a small amount of metal Cu appeared at this time. This was because of the excessive amount of the reducing agent (AA) added before and the generated Cu2O was further reduced, indicating that there was an optimal time for obtaining pure Cu2O. When the reaction lasted for 120 min (Fig. 3i), the hollow spheres collapsed into fragments in a large area.Combining with the change of the solution color in the reaction process, it can be concluded that the precursor Cu2+ quickly generated blue Cu(OH)2 precipitates after adding NaOH. After heating for a few minutes, Cu(OH)2 was converted into CuO through a series of reactions. After the addition of the reducing agent, divalent CuO was gradually reduced to monovalent Cu2O. Based on the peak position and relative intensity of the XRD spectrum, it was observed that there were differences in the optimal growth orientation: the direction changed from [111] to [111] and [110]. With the progress of the reaction, the crystal structure of Cu2O didn't change, but the crystallinity gradually increased. It is worth noting that the hollow nanospheres maintained a high uniformity, and the particle size becomes larger and larger with the extension of reaction time, showing an expanding trend. According to the above results, it is found that the growth process is consistent with Ostwald ripening.24 The formation of the Cu2O hollow spheres can be summarized as follows: (i) CuO nanosheets are generated; (ii) CuO nanosheets are decomposed and recrystallized into Cu2O nanospheres; (iii) crystal aging and Ostwald ripening dissolve the Cu2O spheres to form hollow spheres.
To further explore the formation mechanism of the Cu2O hollow spheres, the samples were characterized by XPS and UV-vis. In the peak fitting of Cu LMM (Fig. S4a†), there are two peaks at 569.4 eV and 570.3 eV (Cu2O) at the reaction time of 30 min, and the peak at 574.6 eV represents the transition state of the Cu LMM spectrum.27,28 Except for the two peaks at 570.4 eV and 573.6 eV (Cu2O) at the reaction time of 60 min, the peak at 568.3 eV confirms that Cu metal has appeared,27,28 and they are consistent with the XRD result. At the same time, the fitting analysis of the O1s spectrum shows (Fig. S5†) that the peak at 531.6 eV is attributed to the adsorbed oxygen on the surface of the Cu2O crystallites (530.5 eV: lattice oxygen, 533.7 eV: adsorbed H2O).28,29 The peak area of 531.6 eV in the 30 min sample is larger, indicating that more oxygen was adsorbed on the surface of the Cu2O hollow spheres at this time, which was conducive to promoting the catalytic performance of subsequent AP decomposition. According to the literature, the optical absorption band of Cu2O in solution is located at 443–502 nm.28,30,31 At different stages in the synthesis of the Cu2O hollow spheres, the UV-vis absorption spectra in this band changes significantly as shown in Fig. S4b.† The absorbance barely changes within 5 min of adding AA (i and ii), which is the formation process of Cu2O. In the 10–20 min period (iii and iv), the absorption peaks decrease slightly, suggesting that the inside of the particles is dissolved. As the reaction goes on, the absorption peak of Cu2O blue shifts and decreases gradually after 30 min (v–viii). The result proves that the concentration of Cu2O decreases in the solution because some Cu2O is reduced to Cu by excess AA. Previous studies have demonstrated that the optical absorption changes due to the morphology and crystallinity of the Cu2O crystals, and a blue shift occurs when the grain size decreases or the particles appear hollow.31,32 Therefore, it is more reasonable to attribute the blue shift here to the hollowing of the sphere structures.
3.3 Formation mechanism of the Cu2O hollow spheres
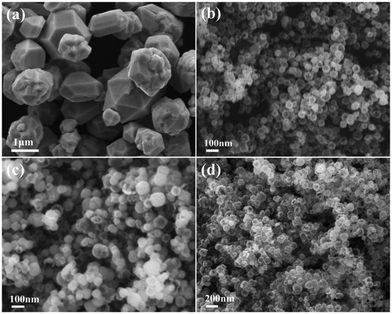
Generally, the crystal growth behavior is controlled by kinetics and thermodynamics, and the shapes of the product can be changed by adjusting the corresponding reaction parameters.23,33 In this system, the effects of NH4+ concentration and reaction temperature on the final morphology of the Cu2O crystals were studied. Fig. 4a shows the SEM image of the Cu2O particles obtained at 50 °C for 30 min without NH4+. It is clear that the particles are polyhedral solids with sharp edges and an uneven size (0.5–1.5 μm). Other experimental parameters remained unchanged, and the product is hollow spherical with a uniform size at higher concentrations of NH4+ (Fig. 4b). The particle size is smaller than before, but the wall thickness of the hollow sphere increases. Therefore, it is believed that NH4+ plays a vital role in guiding the nucleation and pelletization of Cu2O as a surface modifier. Reaction temperature is also an important factor affecting the formation of hollow spheres. When the temperature drops to 35 °C, the morphology of the Cu2O spheres is similar to the final target product (Fig. 4c), except that only a small amount of particles dissolve inside and a slight hollow structure appears. The Cu2O particles are all hollow after 30 min as the temperature rises to 65 °C, but the surface of the sphere is cracked to varying degrees (Fig. 4d). We could draw a conclusion that hollow spheres can be formed at lower temperatures, but it takes a longer time. Increasing the reaction temperature can accelerate the reaction and shorten the core evacuation time of the sphere. Although this can improve the efficiency of the Ostwald ripening, it is accompanied by the reduction of some Cu2O microcrystals to metal Cu, resulting in the shell thinning and even collapse of the hollow nanospheres.Based on the experimental results and analyses, the formation mechanism of the Cu2O hollow spheres can be explained by the self-phase transformation process of metastable aggregated particles and the local Ostwald ripening, and the formation process is described by the schematic diagram in Fig. 5. When inorganic crystals are formed under equilibrium conditions, their crystal behavior depends on the relative order of surface energies.34,35
The facets with high surface energies would generally suffer disappearance or reduction from the final appearance, while the facets with a lower energy grow slowly and eventually occupy the outer surface of the particle.7,16 The relative order of the surface energy can be modified by adding inorganic additives during crystal growth.36,37 In this part, the introduction of NH4+ proved the feasibility of the strategy. In the solution containing NH4+, Cu2+ ions can be chelated to form a copper–ammine complex (Cu(NH3)42+). The pH value of the solution is higher when NaOH is added. The reactant quickly aggregates into flocs, and Cu(NH3)42+ is converted into copper hydroxide (Cu(OH)2) (Fig. S3a†). Because of the Jahn–Teller effect, Cu(OH)2 may form tetrahydroxy copper anions [Cu(OH)4].2–38 Finally, thermodynamically stable CuO is produced as a consequence of its low solubility in water. Due to the anisotropy of the adsorption stability, preferential adsorption will reduce the surface energy of the binding surface, thereby inhibiting the growth of the crystal plane and leading to the change of the final morphology.37 In this system, the crystal structure of CuO is a nanosheet with the (111) crystal plane exposed. After adding AA, the CuO nanosheets are reduced and self-assembled into Cu2O nanocrystals during the rapid chemical reaction.39 The remaining NH4+ in the solution can serve as a stabilizer like the surfactant to prevent the further growth of the product to form smaller nanoparticles.40 Presumably, NH4+ also acts as a structure-directing agent.36 Driven by the minimization of interfacial energy, the Cu2O crystallites are rapidly aggregated into nanospheres to reduce the surface energy of the nanocrystals.24,41 The chemical reactions at this stage are as follows:
Although the formation of smaller crystallites is kinetically favored during the initial polymerization process, larger metastable spherical aggregates are thermodynamically favored.26,42 Obviously, the subsequent dissolution process starts from the interior of the spherical aggregates as the crystallites located in the inner cores have higher surface energies, and the Cu2O polycrystals gradually recrystallize along with the dissolution of crystallites or amorphous domains in the inner core.22,24–26 They became larger and have better crystallized domains in the shells, while the particles inside became hollow. With the Ostwald ripening occuring, the shell thickness of the Cu2O hollow spheres gradually decreases. The target product was obtained at 30 min, reached the thin-shell limit at 120 min and finally collapsed. This clearly proves that the particles undergo a symmetric hollowing process from the inside to the outside in the Ostwald ripening process. The Ostwald ripening of the Cu2O particles is a continuous process under current experimental conditions. However, once the product is separated from the reaction mixture, the Ostwald ripening will be interrupted, suggesting that the Ostwald ripening process can be stopped at any point in order to obtain Cu2O hollow spheres with a controlled shell thickness.
3.4 Catalytic performance of the Cu2O hollow spheres in AP decomposition
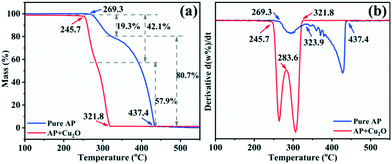
Studies have confirmed that transition metal oxides have excellent catalytic activity in the thermal decomposition of AP,10,43,44 so the catalytic performance of the synthesized Cu2O hollow spheres is characterized by AP decomposition as a probe reaction. Fig. 6a displays the TG curves for pure AP and AP with the Cu2O hollow spheres, and the results are obtained at a heating rate of 5 °C min−1. The first derivative curves (DTG) of the two TG curves are obtained by Proteus analysis, and marked with the same color curve in Fig. 6b. The weight loss stage in the TG curve is determined by the inflection point in the DTG data. For pure AP, the thermal decomposition process experiences two stages of weight loss as shown in the DTG curve: the first stage is at 269.3–323.9 °C, with a weight loss of 19.3%, and AP is partially decomposed into intermediates (such as NH3 and HClO4); in the second stage, the weight loss is 80.7% (323.9–437.4 °C), and this is caused by the complete decomposition of AP into volatile products.9,13 After adding the catalyst Cu2O hollow spheres, the decomposition temperature range of AP is reduced to 245.7–321.8 °C, and in particular the temperature is 115.6 °C lower than that of pure AP in the second step of decomposition. The weight loss in the first stage increases by 22.8% compared with pure AP, and the weight loss in the second stage is relatively reduced, indicating that Cu2O has a significant catalytic effect on the thermal decomposition of AP. At the same time, it can be seen from the DTG curves that the decomposition curvature after adding the catalyst is greater than that of pure AP decomposition, revealing that the decomposition reaction process of AP proceeds faster under the action of the catalyst. It is well known that most transition metal oxides can catalyze the decomposition of perchlorate ions and ammonia oxidation. The high catalytic efficiency of the Cu2O hollow spheres for AP decomposition lies in the large specific surface area of the hollow structure composed of small grains.8,12,43The heat released by AP decomposition in the presence or absence of the Cu2O hollow spheres was measured by DSC in a N2 atmosphere (Fig. 7a). The decomposition of pure AP is divided into three steps. The endothermic peak at 247.9 °C is the crystal structure of AP from orthorhombic to cubic, and there is no mass change during this process.9,13 The first exothermic peak is at 295.9 °C, exactly corresponding to the LTD process and representing the partial decomposition of AP accompanied by the formation of intermediate products.9,13 The second exothermic peak at 431.9 °C is the HTD process, corresponding to the complete decomposition of the intermediate products into volatile products.9,13 Under the catalysis of the Cu2O hollow spheres, the endothermic peak hardly changes, but the position of the exothermic peak has changed obviously, and the LTD and HTD temperatures decreased by 31.6 and 125 °C, respectively. In particular, the significant reduction of the HTD phase can efficiently shorten the flame delay time of the propellant. At the same time, the thermal effect of the AP decomposition reaction, namely the enthalpy change, is explored by calculating the peak area.
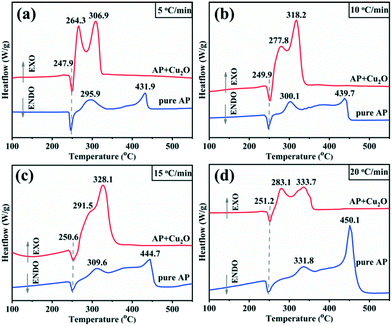 | ||
| Fig. 7 DSC thermographs of AP and the mixture of AP with Cu2O at different heating rates: (a) 5 °C min−1; (b) 10 °C min−1; (c) 15 °C min−1; (d) 20 °C min−1. | ||
It can be seen from Table S1† that the addition of a catalyst has little impact on the endothermic value in the initial stage of the crystal structure transformation. However, from the beginning of low-temperature decomposition to the end of high-temperature decomposition, adding catalysts not only increases the total DSC value, but also increases the exothermic peak area significantly: the exothermic peak area of pure AP decomposition is 247.6 J g−1, and 603.1 J g−1 in the presence of catalysts, which increased by nearly 1.5 times, and in particular the heat released in the HTD stage increased sharply. It is generally believed that the more heat released, the more easily the reaction proceeds, implying that the Cu2O hollow spheres have an obvious catalytic effect on the decomposition of AP.
Fig. 7 displays the DSC curves of pure AP and AP with Cu2O at different heating rates (5, 10, 15 and 20 °C min−1) in a covered crucible, to further explore the thermal decomposition kinetics to study the influence of the catalyst's structural morphology on the activation energy for AP decomposition. The decomposition temperature of AP depends on the heating rate with or without the Cu2O additive. The relationship between the exothermic peak temperature and the heating rate can be described by the Kissinger equation.45 In the formula, β is the heating rate (K min−1), Tp is the peak temperature (K), R is the ideal gas constant (8.314 J mol−1 K−1), Ea is the apparent activation energy (kJ mol−1), and A is the exponential factor (min−1).
According to the calculation results in Table 1, the scatter plots of ln(β/Tp2) as a function of 1/Tp with or without the Cu2O additive and their linear fitting were depicted (Fig. 8). The correlation coefficients are 0.9893 and 0.9929, respectively, revealing that the fitting offset is small and there is a good linear relationship between the experimental data and the fitting line. The activation energy (Ea) of the sample can be calculated from the slope −Ea/R. For pure AP, the activation energy for HTD is calculated to be 315.75 kJ mol−1. Under the condition of adding the Cu2O hollow spheres, the activation energy for AP decomposition reduces to 138.96 kJ mol−1, with a decrease of up to 56.0%. The activation energy for AP decomposition is not a separate parameter for describing the decomposition process. The value of the pre-exponential factor A should also be considered, and the ratio of Ea/ln(A) can be used to describe the reactivity.45 Generally, a larger proportion means greater stability of the reactants. For the samples, the Ea/ln(A) ratios of pure AP and AP with the Cu2O hollow spheres are 3.2 and 5.1, respectively. Obviously, the Cu2O hollow spheres have good catalytic activity.
| Sample | T p/°C | E a (kJ mol−1) | A (min−1) | R 2 | |||
|---|---|---|---|---|---|---|---|
| 5 °C min−1 | 10 °C min−1 | 15 °C min−1 | 20 °C min−1 | ||||
| Pure AP | 431.9 | 439.7 | 44.7 | 450.1 | 315.75 | 9.86 × 10²² | 0.9893 |
| AP + Cu2O | 306.9 | 318.2 | 328.1 | 333.7 | 138.96 | 8.39 × 10¹¹ | 0.9929 |
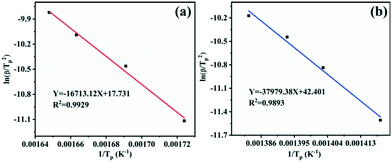 | ||
| Fig. 8 Plots of ln(β/Tp2) versus reciprocal peak temperature 1/Tp for different specimens: (a) the mixture of AP with the Cu2O hollow spheres; (b) pure AP. | ||
As a complex heterogeneous catalytic reaction, AP decomposition includes the coupling reaction of the solid phase and gas phase, so gas-phase products easily adsorb on the surface of particles.9,46 However, in the initial stage of decomposition, the adsorption of HClO4 and NH3 on the AP surface hindered its further decomposition, resulting in the incomplete reaction of NH3 and HClO4.9,10 Nanoparticles have a larger specific surface area owing to their tiny size. The small particle size and high specific surface area improve the mixing between the reactants and catalyst particles, thereby increasing the contact area and the accessibility at most reaction sites, i.e. there are many active sites on the surface of the particles.8,9,43 Although the decomposition of AP starts inside the crystal lattice, the consumption of ammonia by the perchloric acid and perchlorate material occurs on the surface of the AP.43 There are two stages of AP decomposition: LTD and HTD. The main control step in the LTD stage is the transfer of electrons from ClO4− to NH4+, and the control step in the HTD stage is the conversion of O2 to superoxide ions (O2−), and then they react with NH3 to generate N2O, NO2 and H2O.9,11,47 Therefore, the formation of superoxide ions on the surface of the catalyst is an important step in the catalytic process.
The accessibility of active sites of thermal combustion catalysts largely depends on their particle size and specific surface area. The synthesized samples are hollow nanospheres composed of crystallites (diameter ∼12 nm), and many mesopores and macropores appear owing to the loose structure of the Cu2O hollow spheres. The specific surface area of the sample is larger (30.90 m2 g−1), and it has a higher pore volume (0.31 cm3 g−1) and adsorption capacity (N2 adsorption amount: 200 cm3 g−1 STP) compared to Cu2O nanocages (16.60 m2 g−1, 0.07 cm3 g−1, 47 cm3 g−1 STP, respectively) (Fig. 9), which gives it more excellent catalytic performance in AP decomposition. The intermediate products formed by low temperature decomposition of AP can be adsorbed on the surface of the small particles of the hollow spheres, and the results confirm that the catalytic area and active sites for subsequent reactions are increased.13 According to the electron transfer mechanism, the binary metal oxide Cu2O has partially filled d orbitals and effective sites (positive holes on the catalyst surface).48 Due to the special microcrystalline structure of the hollow spheres, there are a large number of coordination unsaturated Cu atoms, and they can absorb the material with excess electrons on its surface and tend to stabilize, while the nitrogen atom of AP contains excess electrons. Since the excess electrons of the nitrogen atoms are absorbed by Cu atoms, the N–X bond becomes weak and easy to break, which is beneficial to the production of NH3.8,9,48 At the same time, the atomic oxygen formed on the Cu2O surface efficiently promoted the oxidation reaction of NO, thus increasing the total heat release and accelerating the decomposition of AP.12 Compared with the samples synthesized in previous work, we found that the Cu2O hollow spheres displayed better catalytic performance in AP decomposition (Tables S2 and S3†).40
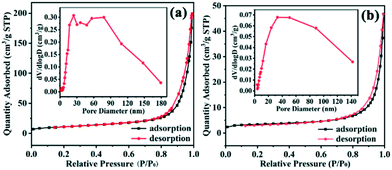 | ||
| Fig. 9 N2 adsorption–desorption isotherms and corresponding pore size distributions (inset) of (a) the Cu2O hollow spheres and (b) Cu2O nanocages. | ||
4. Conclusions
In summary, we quickly synthesized Cu2O hollow spheres at low temperature by a simple method without a template and surfactant. This formation is the result of the combined effect of the self-transformation process of metastable aggregated particles and the local Ostwald ripening, and this process is supported by the experiment of the generation process. On account of the large specific surface area which comes from the loose and porous structure of the Cu2O hollow spheres, the adsorption capacity is improved, and the catalytic area and active sites for the continuous reaction are greatly increased, thereby sharply reducing the temperature and activation energy required for AP thermal decomposition, showing excellent catalytic performance.Conflicts of interest
There are no conflicts to declare.Acknowledgements
This work was supported by the National Natural Science Foundation of China (No. 21972158), the Shanxi Province Science Foundation for Youths (201901D211583) and the Doctoral Start-up Foundation of Shanxi Province (SQ2019006).References
- K. Huang, Y. Sun, Y. Zhang, X. Wang, W. Zhang and S. Feng, Adv. Mater., 2019, 31, 1801430 CrossRef PubMed.
- S. Hyuk Im, U. Jeong and Y. Xia, Nat. Mater., 2005, 4, 671–675 CrossRef CAS PubMed.
- P. Jiang, J. F. Bertone and V. L. Colvin, Science, 2001, 291, 453–457 CrossRef CAS PubMed.
- Q. Wang, Q. Kuang, K. Wang, X. Wang and Z. Xie, RSC Adv., 2015, 5, 61421–61425 RSC.
- X. Wang, C. Liu, B. Zheng, Y. Jiang, L. Zhang, Z. Xie and L. Zheng, J. Mater. Chem. A, 2013, 1, 282–287 RSC.
- W. H. Ke, C. F. Hsia, Y. J. Chen and M. H. Huang, Small, 2016, 12, 3530–3534 CrossRef CAS PubMed.
- S. Sun, X. Zhang, Q. Yang, S. Liang, X. Zhang and Z. Yang, Prog. Mater. Sci., 2018, 96, 111–173 CrossRef CAS.
- S. Chaturvedi and P. N. Dave, J. Saudi Chem. Soc., 2013, 17, 135–149 CrossRef CAS.
- D. L. Sivadas, D. Thomas, M. S. Haseena, T. Jayalatha, G. Rekha Krishnan, S. Jacob and R. Rajeev, J. Therm. Anal. Calorim., 2019, 138, 1–10 CrossRef CAS.
- L. Zhou, S. Cao, L. Zhang, G. Xiang, J. Wang, X. Zeng and J. Chen, J. Hazard. Mater., 2020, 392, 122358 CrossRef CAS PubMed.
- Y. Lan, M. Jin and Y. Luo, J. Sol-Gel Sci. Technol., 2014, 74, 161–167 CrossRef.
- Z. W. Han, Y. C. Han and S. Xu, J. Therm. Anal. Calorim., 2013, 116, 273–278 CrossRef.
- C. Wang, H. Zhang, Y. Ye, R. Shen and Y. Hu, Thermochim. Acta, 2013, 568, 161–164 CrossRef CAS.
- Y. Ramdani, Q. Liu, G. Huiquan, P. Liu, A. Zegaoui and J. Wang, Vacuum, 2018, 153, 277–290 CrossRef CAS.
- Y. Shang and L. Guo, Adv. Sci., 2015, 2, 1500140 CrossRef PubMed.
- D. Deng, K. S. Novoselov, Q. Fu, N. Zheng, Z. Tian and X. Bao, Nat. Nanotechnol., 2016, 11, 218–230 CrossRef CAS PubMed.
- S. Sun, Q. Yang, S. Liang and Z. Yang, CrystEngComm, 2017, 19, 6225–6251 RSC.
- Q. Guo, Y. Li and W. Zeng, Phys. E, 2019, 114, 113564 CrossRef CAS.
- X. Wang, J. Feng, Y. Bai, Q. Zhang and Y. Yin, Chem. Rev., 2016, 116, 10983–11060 CrossRef CAS PubMed.
- Q. Wang, Y. Jia, M. Wang, W. Qi, Y. Pang, X. Cui, W. Ji and J. Yi, J. Phys. Chem. C, 2015, 119, 22066–22071 CrossRef CAS.
- H. Yang and Z.-H. Liu, Cryst. Growth Des., 2010, 10, 2064–2067 CrossRef CAS.
- L. Zhang and H. Wang, ACS Nano, 2011, 5, 3257–3267 CrossRef CAS PubMed.
- X. Zhao, Z. Bao, C. Sun and D. Xue, J. Cryst. Growth, 2009, 311, 711–715 CrossRef CAS.
- H. C. Zeng, Curr. Nanosci., 2007, 3, 177–181 CrossRef CAS.
- X. Wang, J. A. van Bokhoven and D. Palagin, Phys. Chem. Chem. Phys., 2017, 19, 30513–30519 RSC.
- C. C. Yec and H. C. Zeng, J. Mater. Chem. A, 2014, 2, 4843–4851 RSC.
- I. Platzman, R. Brener, H. Haick and R. Tannenbaum, J. Mater. Chem. C, 2008, 112, 1101–1108 CAS.
- R. Ji, W. Sun and Y. Chu, ChemPhysChem, 2013, 14, 3971–3976 CrossRef CAS PubMed.
- X. Han, F. Liao, Y. Zhang, Z. Yuan, H. Chen and C. Xu, Mater. Lett., 2018, 210, 31–34 CrossRef CAS.
- W. C. Huang, L. M. Lyu, Y. C. Yang and M. H. Huang, J. Am. Chem. Soc., 2012, 134, 1261–1267 CrossRef CAS PubMed.
- C. Lu, L. Qi, J. Yang, X. Wang, D. Zhang, J. Xie and J. Ma, Adv. Mater., 2005, 17, 2562–2567 CrossRef CAS.
- R. Bardhan, N. K. Grady, T. Ali and N. J. Halas, ACS Nano, 2010, 4, 6169–6179 CrossRef CAS PubMed.
- S. Sun and Z. Yang, Chem. Commun., 2014, 50, 7403–7415 RSC.
- Y. Sui, W. Fu, Y. Zeng, H. Yang, Y. Zhang, H. Chen, Y. Li, M. Li and G. Zou, Angew. Chem., Int. Ed., 2010, 49, 4282–4285 CrossRef CAS PubMed.
- D. Ramimoghadam, M. Z. Hussein and Y. H. Taufiq-Yap, Int. J. Mol. Sci., 2012, 13, 13275–13293 CrossRef CAS PubMed.
- M. J. Siegfried and K. S. Choi, J. Am. Chem. Soc., 2006, 128, 10356–10357 CrossRef CAS PubMed.
- Y. Sui, W. Fu, H. Yang, Y. Zeng, Y. Zhang, Q. Zhao, Y. Li, X. Zhou, Y. Leng, M. Li and G. Zou, Cryst. Growth Des., 2010, 10, 99–108 CrossRef CAS.
- Y. Cudennec and A. Lecerf, Solid State Sci., 2003, 5, 1471–1474 CrossRef CAS.
- K. Chen, S. Song and D. Xue, CrystEngComm, 2013, 15, 10028–10033 RSC.
- T. T. Lv, H. X. Wang, X. B. Ren, L. C. Wang, R. M. Ding, J. P. Cao and B. L. Lv, CrystEngComm, 2020, 22, 8214–8220 RSC.
- J. Park, J. Joo, S. G. Kwon, Y. Jang and T. Hyeon, Angew. Chem., Int. Ed., 2007, 46, 4630–4660 CrossRef CAS PubMed.
- J. Xu, Y. B. Tang, W. Zhang, C. S. Lee, Z. Yang and S. T. Lee, Cryst. Growth Des., 2009, 9, 4524–4528 CrossRef CAS.
- J. Wang, W. Zhang, Z. Zheng, Y. Gao, K. Ma, J. Ye and Y. Yang, J. Alloys Compd., 2017, 724, 720–727 CrossRef CAS.
- S. Chaturvedi and P. N. Dave, J. Exp. Nanosci., 2011, 7, 205–231 CrossRef.
- B. Andri
![[c with combining breve]](https://www.rsc.org/images/entities/char_0063_0306.gif) ić, T. Kova
ić, T. Kova![[c with combining breve]](https://www.rsc.org/images/entities/char_0063_0306.gif) ić and I. Klarić, Polym. Degrad. Stab., 2003, 79, 265–270 CrossRef.
ić and I. Klarić, Polym. Degrad. Stab., 2003, 79, 265–270 CrossRef. - Y. Wang, X. Xia, J. Zhu, Y. Li, X. Wang and X. Hu, Combust. Sci. Technol., 2010, 183, 154–162 CrossRef.
- T. Zhang, Y. Guo, C. Li, Y. Li, J. Li, F. Zhao and H. Ma, Adv. Powder Technol., 2020, 31, 4510–4516 CrossRef CAS.
- B. K. Meyer, A. Polity, D. Reppin, M. Becker, P. Hering, B. Kramm, P. J. Klar, T. Sander, C. Reindl and C. Heiliger, in Semiconductors and Semimetals, Elsevier, 2013, vol. 88, pp. 201–226 Search PubMed.
Footnote |
| † Electronic supplementary information (ESI) available: EDX analysis results of the Cu2O hollow spheres, XRD patterns of the products in different reaction stages, peak fitting of the Cu LMM and O1s spectra of the samples obtained at 30 and 60 min, UV-vis spectra of the Cu2O products under different reaction times, and comparison of the DSC data of Cu2O and other catalysts and Cu2O with different morphologies. See DOI: 10.1039/d1ce00663k |
| This journal is © The Royal Society of Chemistry 2021 |

