Lyotropic liquid crystal phase behavior of a cationic amphiphile in aqueous and non-stoichiometric protic ionic liquid mixtures†
Dilek
Yalcin
,
Calum J.
Drummond
 and
Tamar L.
Greaves
 *
*
School of Science, College of Science, Engineering and Health, RMIT University, GPO Box 2476, Melbourne, Victoria 3001, Australia. E-mail: tamar.greaves@rmit.edu.au
First published on 15th September 2020
Abstract
Protic ionic liquids (PILs) are the largest and most tailorable known class of non-aqueous solvents which possess the ability to support amphiphile self-assembly. However, little is known about the effect of solvent additives on this ability. In this study, the lyotropic liquid crystal phase (LLCP) behavior of the cationic surfactant cetyltrimethylammonium bromide (CTAB) was investigated in the model PILs of ethylammonium nitrate (EAN) and ethanolammonium nitrate (EtAN), and derived multi-component solvent systems containing them to determine phase formation and diversity with changing solvent composition. The solvent systems were composed of water, nitric acid and ethylamine (or ethanolamine), with 26 unique compositions for each PIL covering the apparent pH and ionicity ranges of 0–13.5 and 0–11 M, respectively. The LLCPs were studied using cross polarized optical microscopy (CPOM) and small and wide-angle X-ray scattering (SAXS/WAXS). Partial phase diagrams were constructed for CTAB concentrations of 50 wt% and 70 wt% in the temperature range of 25 °C to 75 °C to characterise the effect of surfactant concentration and temperature on the LLCPs in each solvent environment. Normal micellar (L1), hexagonal (H1) and bicontinuous cubic (V1) phases were identified at both surfactant concentrations, and from temperatures as low as 35 °C, with large variations dependent on the solvent composition. The thermal stability and diversity of phases were greater and broader in solvent compositions with excess precursor amines present compared to those in the neat PILs. In acid-rich solvent combinations, the same phase diversity was found, though with reduced onset temperatures of phase formation; however, some structural changes were observed which were attributed to oxidation/decomposition of CTAB in a nitric acid environment. This study showed that the ability of PIL solutions to support amphiphile self-assembly can readily be tuned, and that the ability of PILs to promote amphiphile self-assembly is robust, even with other solvent species present.
Introduction
The use of ionic liquids (ILs) as solvents and solvent additives has been explored in a broad range of applications, including organic and inorganic reactions,1–3 catalysis,1,3–5 analytical systems,6,7 separation processes,3–5 and biological systems5,7–11 due to their desirable and tunable properties. Among many, one recognised property of a number of protic ILs (PILs), and some aprotic ILs, is their ability to act as a medium promoting self-assembly of amphiphiles, such as surfactants, lipids and block copolymers.7,12–15 However, little is currently known about the effect solvent additives, such as acids or bases, have on the ability of PILs to promote amphiphile self-assembly.The self-assembly of amphiphiles is strongly dependent on the solvent–solute interactions. Typically, phase formation and diversity are controlled by varying the chemical structure of the amphiphile. However, the phase formation can also be altered by modifying the solvent medium, such as through co-solvent addition, or non-aqueous solvents such as ILs.16 A molten salt, pyridinium chloride, was first reported in the late 1960's with self-assembly supporting ability.17 In the late 1970's, ethylene glycol was one of the first reported non-aqueous self-assembly promoting liquids identified.18 Since then, numerous molecular solvents have been reported as amphiphile self-assembly media, including small glycol solvents of glycerol, alkanediols, small amides consisting of alkylformamides, and some other solvents such as hydrazine, dimethyl sulfoxide, formic acid, 2-aminoethanol, ethylene diamine and acetonitrile.17,19 ILs are the largest non-aqueous solvent class known which possesses a self-assembly promoting ability.17 Based on this capability they are being investigated for use in a broad range of applications including sol–gel processes,16,20 biocatalysis,16,21,22 microencapsulation,23 nano-material synthesis16,20,24 and drug delivery.16,21
To date, a number of protic ILs, and to a lesser extent aprotic ILs, have been reported as amphiphile self-assembly media.13–15,17,19,25 These include ILs with primary, secondary and tertiary alkylammonium and 1-alkyl-3-methylimidazolium cations combined with various anions such as nitrate, formate, acetate, bis(trifluoromethanesulfonyl)imide, hexafluorophosphate and tetrafluoroborate anions.17 A broad range of amphiphiles self-assemble in these ILs, including ionic and non-ionic surfactants such as cetyltrimetylammonium bromide (CTAB),7,12,26–28 sodium dodecylsulfate (SDS),29 polyoxyethylene alkyl ethers (CnEm, where n = 12, 14, 16, 18 and m = 2, 4, 6, 8),14,22,30 diblock/triblock copolymers,31–34 Gemini,35 Triton X-100,36 lipidic surfactant Myverol37,38 and Phytantriol.37 The most common lyotropic liquid crystal phases of these amphiphiles identified in these ILs include normal and inverse phases of micellar, discrete cubic, hexagonal, bicontinuous cubic, and lamellar phases.25 The phase formation and the sequence of phase transitions depends on the amphiphile, its concentration, and external environmental conditions such as temperature and pH.16,21 While numerous amphiphile/IL/co-solvents have been investigated, the vast majority are microemulsions where the IL has been used as the amphiphile, the polar phase or as the nonpolar phase.39–42
We previously used a high-throughput approach to characterize a broad range of aqueous, non-stoichiometric PIL solvents in terms of surface tension, apparent pH and liquid nanostructure, which are the properties strongly affecting the ability of a solvent to promote self-assembly.43 Our findings showed that the selected solvent properties can be tailored through varying the water content as well as the non-stoichiometry, and general trends for each solvent property were obtained.43 Surface tension of these solvents exhibited a strong dependence on the acid–base ratio for the samples with excess precursor amines present, whereas when excess precursor acids were present in the medium the surface tension varied more strongly with the water content. Moreover, the presence of excess acid had little effect on the intermediate range length scale of the liquid nanostructure, while significant increases in correlation length were observed with either increasing water content or excess precursor amine.43 However, it is yet to be determined which IL species interact with the amphiphiles, and the role of these species at different IL–water concentrations. For example, will the role of the species change with dilution such as ILs acting as salts in water or as water in ILs? Similarly, what role will different proportions of excess acid and base play?
Here we have investigated the lyotropic liquid crystal phase (LLCP) behaviour of a cationic surfactant, CTAB, in multicomponent solvent systems of non-stoichiometric and aqueous PILs, which were composed of water + ethylamine + nitric acid, and water + ethanolamine + nitric acid, with varying mole fractions of each component. These solvents were prepared by mixing neat PILs, ethylammonium nitrate (EAN) and ethanolammonium nitrate (EtAN), with water and precursor acid (or base). These PILs were selected as they have previously been reported as good self-assembly support media for CTAB.26 Their aqueous and non-stoichiometric combinations have the desired properties of self-assembly promoting solvents of high surface tension and negligible or no liquid nanostructure.43 In a previous study, both neat PILs, as well as water, exhibited the ability to support normal hexagonal, (H1) normal cubic (V1) and lamellar (Lα) LLCPs as the CTAB concentration and temperature increased. The thermal stability ranges were the broadest in water followed by EAN and then EtAN.26 The main focus of this work was to explore the effect of PIL non-stoichiometry and water content on the phase behavior of CTAB, and to identify the LLCPs supported. This was done to provide insight into how robust the ability of PILs to promote self-assembly is, and how it is affected by varying the solvent composition, and hence the pH and ionicity of the solvent.
Experimental method
Materials
All reagents were used as received. The amines and acid used were ethylamine (70%, Sigma-Aldrich), ethanolamine (99.5%, Sigma-Aldrich) and nitric acid (70%, Ajax FineChem), respectively. The amphiphile used was cetyltrimethylammonium bromide (CTAB, Sigma-Aldrich).Sample preparation
The neat PILs were synthesized through a proton transfer reaction from the Brønsted acids to the Brønsted bases, where the acid was added to the base dropwise, as previously reported.44 The base was kept in an ice bath, and its temperature was monitored to keep it close to 5 °C to prevent side reactions. The PILs were then dried using a rotary evaporator followed by freeze-drying. The water contents of the neat PILs were determined using a Mettler Toledo C20 Karl–Fischer titrator, and were 0.6 mol% and 2.4 mol% for EAN and EtAN, respectively. Typically, 0.1 mL of 50 w/w% solution of the ionic liquid in diluted anhydrous methanol was injected for analysis. Proton nuclear magnetic resonance (1H NMR) were taken of neat PILs dissolved in deuterated dimethyl sulfoxide (DMSO-d6) on a Bruker 300 MHz instrument, with each measurement involving 32 scans, with a relaxation time of 1 second.An experimental design approach called Latin Hypercube Sampling (LHS) was used to select 26 PIL–water–acid (or base) combinations for EAN and EtAN separately, with the details previously reported.43 All PIL–water–acid (or base) solutions were prepared gravimetrically using Milli-Q water and precursor acids (or bases) added to the neat PIL. This led to a total of 53 solvents, consisting of water, and 26 PIL containing solvents for both EAN and EtAN.
Samples containing 50 wt% and 70 wt% of CTAB were prepared in all PIL–water–acid (or base) solutions of EAN and EtAN, as well as in pure water for comparison. Sonication and vortexing was used to homogenize each sample, and they were then left to equilibrate at ambient temperature for at least two weeks prior to characterization. This selection of solvents, each with two CTAB concentrations, led to coverage of a large compositional space with only 106 samples.
Concentration gradients of CTAB in all 52 PIL solvent systems was achieved through compressing CTAB powder between a microscope slide and coverslip, prior to the addition of the PIL–solvent on the edge of the coverslip, as previously reported.37 The solvent was drawn between the two glass surfaces by capillary action, establishing a concentration gradient with neat PIL–solvent and neat CTAB as the two extremes and liquid crystals, if any, between these.
Characterization
The determination and identification of the LLCPs formed was done based on the characteristic diffraction peaks in the SAXS region using “AXcess” software, which is described by Seddon et al.45 The relative peak positions for a hexagonal phase (H1) with p6m symmetry are  , for cubic phases (V1) with Im
![[3 with combining macron]](https://www.rsc.org/images/entities/char_0033_0304.gif) m symmetry
m symmetry  , with Pn
![[3 with combining macron]](https://www.rsc.org/images/entities/char_0033_0304.gif) m symmetry
m symmetry  , with
  symmetry
  , and for a lamellar phase (Lα) are 1
![[thin space (1/6-em)]](https://www.rsc.org/images/entities/char_2009.gif) :
:![[thin space (1/6-em)]](https://www.rsc.org/images/entities/char_2009.gif) 2
2![[thin space (1/6-em)]](https://www.rsc.org/images/entities/char_2009.gif) :
:![[thin space (1/6-em)]](https://www.rsc.org/images/entities/char_2009.gif) 3
3![[thin space (1/6-em)]](https://www.rsc.org/images/entities/char_2009.gif) :
:![[thin space (1/6-em)]](https://www.rsc.org/images/entities/char_2009.gif) 4.46 The lattice d-spacings of the phases have been obtained from the AXcess program calculated based on Bragg's law, d ≈ 2π/qSAXS.47
4.46 The lattice d-spacings of the phases have been obtained from the AXcess program calculated based on Bragg's law, d ≈ 2π/qSAXS.47
Results
The lyotropic liquid crystal phase behavior of CTAB in a total of 53 different EAN and EtAN derived solvent combinations, including neat PILs and neat water, were initially identified through penetration scans using cross-polarised optical microscopy (CPOM) from 25 °C to 100 °C. This enabled the full concentration gradient from neat solvent to neat CTAB to be observed with increasing temperature, with the limitation that the specific CTAB concentrations were not known at each phase boundary. At room temperature, CTAB was mostly in a crystalline form (Lc) in each CTAB–solvent system, including water. Upon contact with solvents and heating, it was observed that there was a general phase progression from hexagonal (H1) to isotropic (bicontinuous cubic, V1), and to a lesser extent, to lamellar (Lα). A summary of the LLCPs of CTAB in EAN and EtAN derived solvents, along with the solvent compositions, are given in Tables S1 and S2 in the ESI,† respectively. These compositions are ordered by increasing water content down the table, and it should be noted that the acid to base ratio varies substantially in each table. All results are described and discussed in terms of excess precursor amine or acid, and the samples are defined as base-rich and acid-rich samples. Representative CPOM images are provided for CTAB in neat water, neat EAN and neat EtAN along with acid-rich and base rich compositions of EAN and EtAN derived samples in Fig. S1 in the ESI.†The observed phases in CTAB–water, CTAB–neat EAN and CTAB–neat EtAN were consistent with our previous findings.26 The phase formation onset temperature in neat EAN and EtAN shifted to a higher temperature, by about 25 °C, for each of the three phases (hexagonal, cubic and lamellar) compared to those in water.
For both EAN and EtAN derived samples in the presence of excess amine (base-rich compositions), it was observed that the phase formation was dominantly affected by the amount of water present. For these base-rich samples the onset temperature of phase formation decreased with increasing water content and approached the values for where water was the only solvent. The phase diversity and stability were maintained in most of the base-rich compositions of EAN and EtAN derived samples. This was observed to a greater extent in EtAN derived samples, which was attributed as predominantly due to the ethanolamine precursor also having a self-assembly promoting ability.19
In contrast, the phase formation and thermal stability were dramatically affected by the presence of excess acid (acid-rich compositions), with the water content also affecting the self-assembly. The onset temperatures of the phases shifted to lower temperatures than that of neat EAN and EtAN with increasing water content. However, a smaller proportion of the acid-rich solvents supported hexagonal and cubic phases compared to the base-rich compositions. The phases formed in the acid-rich solvents had lower thermal stability and all melted between 46–87 °C whereas, the phases in the neat solvents were thermally stable to above 100 °C. However, partial decomposition/oxidation of CTAB occurred in the majority of acid-rich compositions on contact with the solvent, which was evident by the color change from white to yellow and orange, and even to red depending on the excess acid concentration.
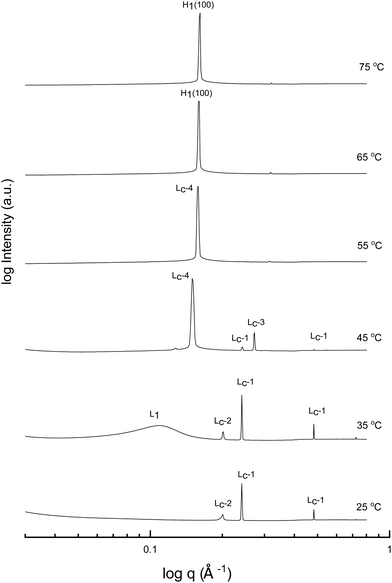
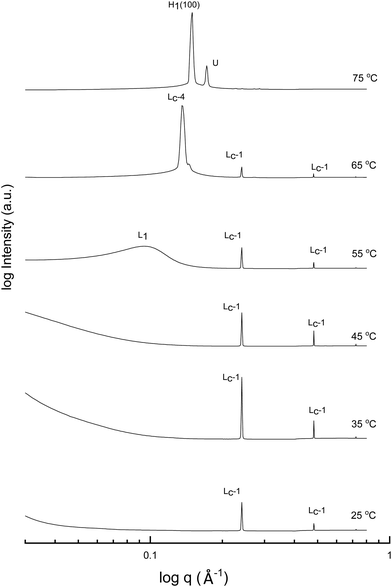
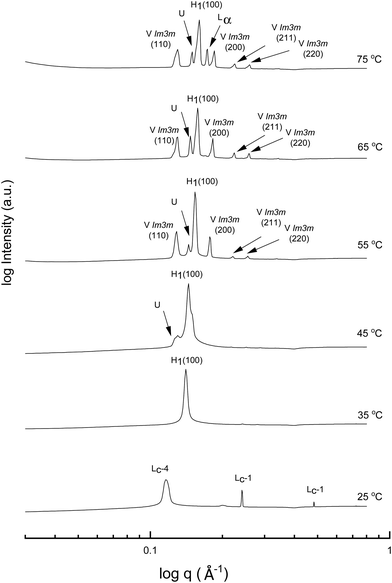
A more detailed phase identification and characterization study was performed on samples containing fixed concentrations of CTAB, using small and wide-angle X-ray scattering (SAXS/WAXS). SAXS and WAXS patterns were acquired at temperatures between 25 °C and 75 °C, for 50 wt% and 70 wt% CTAB in each of the 53 solvent conditions, including neat water and neat PILs. Higher temperatures could not be obtained due to the temperature limitations of the instrumentation used. The absence of sharp peaks in the WAXS region from 0.75 to 2.85 Å−1 was used as a criterion for phases being LLCP rather than just crystalline CTAB. The LLCPs were then characterized from their SAXS patterns, with the peaks matched with the defined phases in the AXcess program. Fig. 1–3 show the SAXS patterns acquired at different temperatures for 70 wt% CTAB in neat EAN, neat EtAN and water, respectively, along with the phases identified. Similarly, those for 50 wt% CTAB in neat EAN, neat EtAN and water are provided in Fig. S2–S4 in the ESI,† respectively. In addition, the SAXS patterns acquired for neat CTAB are provided in Fig. S5 in the ESI,† showing the presence of lamellar surfactant crystals below 65 °C and the formation of thermotropic lamellar liquid phases as the temperature increased from 25 °C to 75 °C.
Upon heating, the phase transitions generally progressed from crystalline CTAB, to micellar, and then to hexagonal and cubic in the neat solvents, consistent with our CPOM results, and previous studies.26 There were four crystalline lamellar forms observed in the SAXS patterns, and these have been labelled as Lc-1, Lc-2, Lc-3 and Lc-4. The crystalline state was assigned due to the samples having sharp peaks in the WAXS region, while the peaks in the SAXS region corresponded to a lamellar phase. The dominant crystalline phase observed for CTAB in the neat solvents was assigned as Lc-1, a minor crystalline phase was assigned as Lc-2, which was only present in a few samples and mostly at low temperatures, Lc-3 was only present in the more extreme acidic or basic environments, and Lc-4 had the same peak positions as the thermotropic crystalline phase of neat CTAB.
The liquid crystal phase behavior obtained for 70 wt% CTAB in both neat EAN and EtAN was similar, as shown in Fig. 1 and 2, respectively. As expected, hexagonal phase formation of 70 wt% CTAB in neat EAN took place above 55 °C, whereas it occurred at a slightly higher temperature in neat EtAN of above 60 °C. Moreover, micellization (L1) started at a lower temperature in neat EAN compared to in neat EtAN, but higher than that observed in water. Similar phase diversity and behaviour was observed for 50 wt% CTAB in EAN and EtAN, as shown in Fig. S2 and S3 (ESI†), respectively.
Although, the onset of cubic phase formation was observed at 73 °C in both PILs through CPOM analysis, the cubic phase formation was not observed in the SAXS patterns of 70 wt% CTAB in neat EAN. As the surfactant concentrations were not fixed for each sample during microscopic penetration scans, this suggests that the cubic phase is not present at either 50 wt% or 70 wt% of CTAB concentrations in neat EAN. However, in neat EtAN a transient phase formation, denoted as U, can be seen from the SAXS pattern at 75 °C in Fig. 2. This transient phase is thought likely to develop into a cubic phase at higher temperatures.
Regarding the phases identified in water, the sharp peaks in the WAXS region for samples containing 70 wt% and 50 wt% CTAB in water disappeared at 35 °C, indicating a transition from a crystalline to a liquid crystalline phase. The liquid crystal phase was identified as hexagonal and can be seen in the SAXS patterns in Fig. 3 and Fig. S4 (ESI†) for the 70 wt% and 50 wt% CTAB, respectively. A bicontinous cubic phase was present from 55 °C for both concentrations and was identified as a primitive nanostructure with Im![[3 with combining macron]](https://www.rsc.org/images/entities/char_0033_0304.gif) m symmetry. The cubic and hexagonal phases co-existed up to 75 °C, which was in good accordance with the CPOM observations. The lamellar liquid crystal phase (Lα) was only observed at 75 °C.
m symmetry. The cubic and hexagonal phases co-existed up to 75 °C, which was in good accordance with the CPOM observations. The lamellar liquid crystal phase (Lα) was only observed at 75 °C.
In addition to the neat solvents, SAXS and WAXS patterns were obtained for 50 wt% and 70 wt% CTAB in all EAN and EtAN derived solvent compositions, which led to a total of 53 different solvent compositions for each CTAB concentration. The exact solvent compositions are given in Tables S1 and S2 of the ESI† for the EAN and EtAN derived solvents, respectively. In addition to the phases observed in the neat solvents, the highly basic or highly acidic solvent compositions led to the formation of normal hexagonal (H1) and bicontinuous cubic (V1) phases, which also had sharp peaks present in the WAXS regions. This suggests a partial phase formation takes place, possibly governed by the presence of water, and is discussed in more detail in later sections.
Phase identification (base-rich solvent compositions)
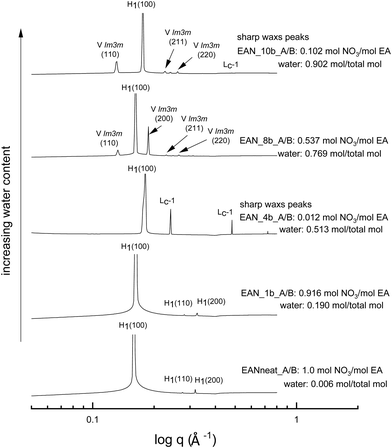
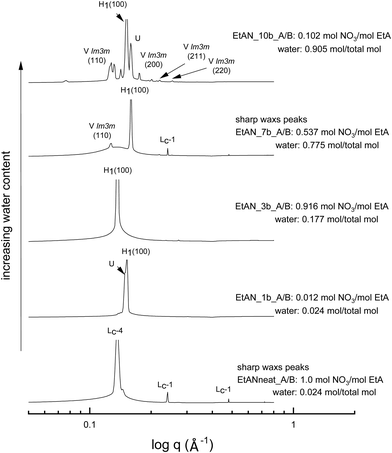
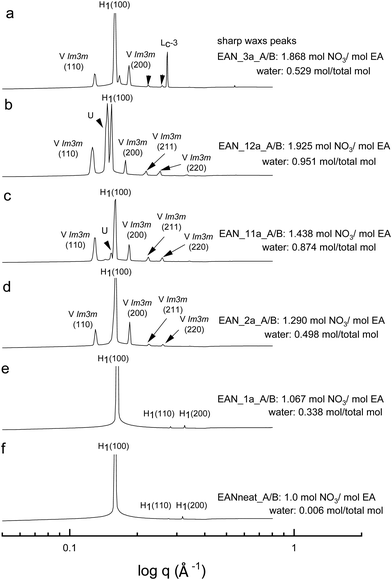
The SAXS patterns of 70 wt% CTAB in four representative base-rich EAN compositions, along with that of neat EAN, are given in Fig. 4. The water content of samples increases from bottom to top, with various acid-to-base (A/B) ratios. The temperature of 65 °C was selected for comparison due to the neat EAN system having no sharp WAXS peaks at this temperature. From Fig. 4 it is clear that the water content, as well as the basicity, exhibited a significant effect on phase formation and diversity. The more water rich samples had a greater range of LLCP present, such as for EAN_10b and EAN_8b.Most of the base-rich samples had the ability to support hexagonal, cubic and lamellar phases according to the CPOM and SAXS/WAXS analysis. However, for the two solvent compositions with the highest basicities EAN_4b and EAN_10b, characteristic lamellar crystalline peaks (Lc-1) in the SAXS region as well as sharp WAXS peaks were observed at 65 °C and 75 °C. There was a corresponding shift in the q positions of the hexagonal peaks for these samples suggesting a reduction in the lattice spacing. The phases were identified from the SAXS/WAXS patterns for both the 50 wt% (Fig. S6 in the ESI†) and the 70 wt% of CTAB (Fig. 4), with both sets of data having similar patterns.
The equivalent solvent compositions were also selected for the representative EtAN derived base-rich samples to enable a direct comparison with their EAN derived counterparts. Fig. 5 shows the SAXS patterns of 70 wt% CTAB in 4 different EtAN derived compositions along with in neat EtAN. The hexagonal phase formation in neat EtAN occurred only above 65 °C, and hence is not evident in Fig. 5. Similar to the findings obtained in EAN derived solvents, it is clear that increasing either the basicity or water content had a reducing effect on the onset temperatures of phase formations. Contrary to the EAN precursor of ethylamine, ethanolamine has self-assembly supporting ability for CTAB, which is evident from the SAXS results of the two highest basicity samples, EtAN_1b and EtAN_10b (Fig. 5). This is consistent with previous literature which reported that di- and triethanolamine promote self-assembly of CTAB into hexagonal and lamellar phases.19 At the lower CTAB concentration (50 wt%), many of the base-rich EtAN derived solvents were found to support hexagonal phase formation, as shown in Fig. S7 in the ESI† for representative examples.
Phase identification (acid-rich solvent compositions)
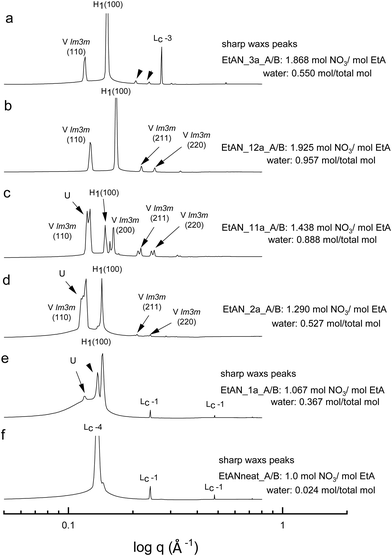
All the acid-rich compositions were also investigated between 25 °C and 75 °C. The SAXS patterns of 70 wt% CTAB in four acid-rich solvent combinations for both EAN and EtAN were selected as representative examples, and are shown in Fig. 6 and 7, respectively, along with the phases in the neat ILs. The corresponding SAXS patterns of 50 wt% CTAB are provided in Fig. S8 and S9 in the ESI.† In Fig. 6 and 7, SAXS patterns from b to f correspond to decreasing water content and acidity, while SAXS patterns labelled as ‘a’ have a solvent composition with a high A/B ratio, and a moderate water content.As indicated in the selected SAXS patterns in Fig. 6 and 7, the same LLCPs were identified in both acid-rich EAN and acid-rich EtAN derived solvent compositions. It must be noted that the lowest water contents were 0.338 mol and 0.367 mol in EAN and EtAN derived solvents (EAN_1a and EtAN_1a), respectively, as the acid precursor used in sample preparation was 70% by vol. aqueous nitric acid solution. In all acid-rich compositions, the water content seemed to have the greatest effect on both hexagonal and cubic phase formations, with highest water proportions leading to the highest reduced onset temperatures, according to the SAXS/WAXS and CPOM analysis. In Fig. 6 and 7, the SAXS patterns of samples from f to b displayed a phase transition from hexagonal to cubic with increasing water content and acidity. However, from the SAXS patterns at the top (a), where solvents (EAN_3a and EtAN_3a) contain moderate amount of water but high acidity, there was coexisting liquid crystal and crystalline phases present, which was evident by the presence of both characteristic peaks of LLCPs and lamellar crystalline surfactant peaks.
According to the CPOM examination, the LLCPs formed in many of the acid-rich compositions of both EAN and EtAN were thermally unstable above 65 °C, as shown in Tables S1 and S2 in the ESI† respectively, and for most of them a color change was also observed due to the probable oxidation of CTAB upon contact with the strong oxidizer of nitric acid. Despite this, the presence of LLCPs in acid-rich samples were evident based on the SAXS/WAXS analysis within the temperature range of 25 °C to 75 °C. This is thought to happen due to anion exchange between excess NO3− and Br− of CTAB, leading to the formation of amphiphilic cetyltrimethylammonium nitrate (CTAN), which may potentially exhibit a similar phase behaviour in acid-rich EAN and EtAN derived solvent combinations. This is speculative and would require further investigation to confirm. For simplicity in this study the LLCPs formed in acid-rich compositions were considered as those of CTAB. In general, it appeared that the phase formation in acid-rich samples highly depends on the amount of water present in the solvent medium whereas the phase stability is more dominantly affected by the change in acidity.
Phase diagrams
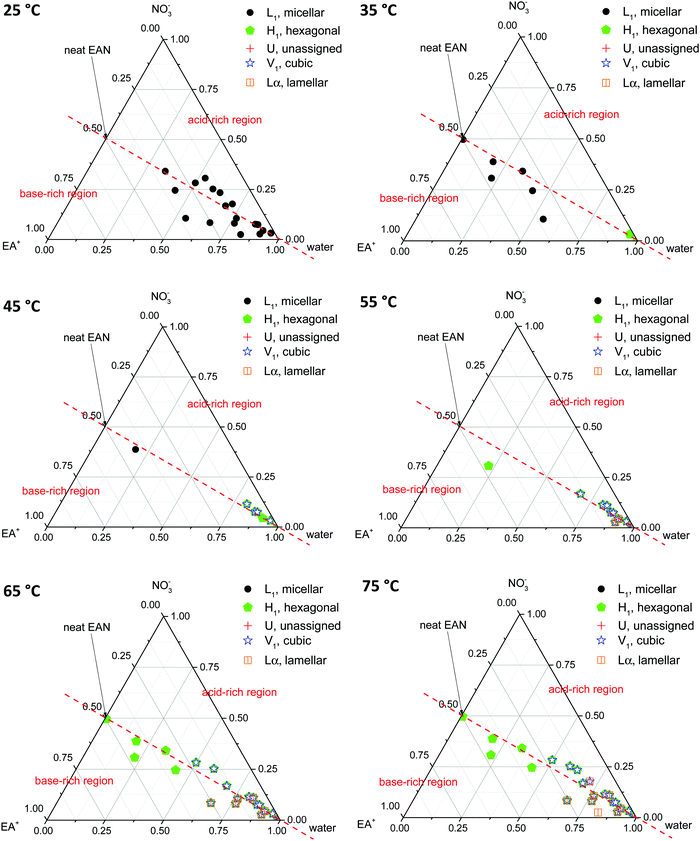
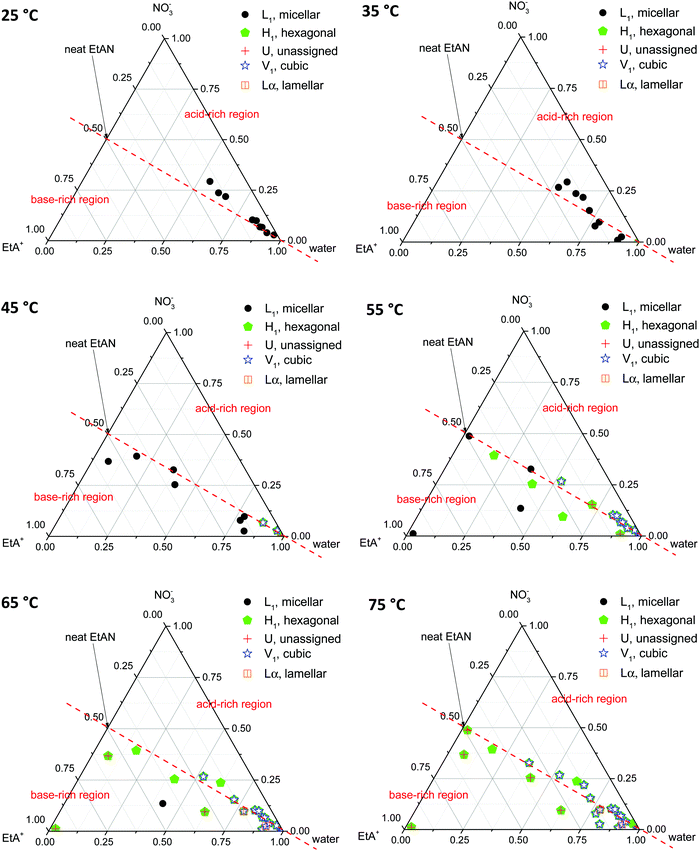
Phase diagrams were constructed from the LLCPs identified in the SAXS/WAXS data obtained for both CTAB concentrations, in all EAN and EtAN derived solvent compositions, at all temperatures. In constructing the phase diagrams, we focused on all five LLCPs where there were no sharp WAXS peaks present according to the scattering data. These included micellar (L1), normal hexagonal (H1), normal primitive cubic (V1, Im![[3 with combining macron]](https://www.rsc.org/images/entities/char_0033_0304.gif) m), unassigned transient (U) and lamellar (Lα) liquid crystal phases. The solvents which seemed to support some LLCPs, but still had sharp WAXS peaks present, were excluded from the phase diagrams. The approximate phase diagrams for 70 wt% of CTAB in EAN and EtAN derived solvent compositions were constructed at each temperature, and are given in Fig. 8 and 9, respectively. The corresponding phase diagrams for 50 wt% of CTAB are provided in Fig. S10 and S11 in the ESI,† respectively.
m), unassigned transient (U) and lamellar (Lα) liquid crystal phases. The solvents which seemed to support some LLCPs, but still had sharp WAXS peaks present, were excluded from the phase diagrams. The approximate phase diagrams for 70 wt% of CTAB in EAN and EtAN derived solvent compositions were constructed at each temperature, and are given in Fig. 8 and 9, respectively. The corresponding phase diagrams for 50 wt% of CTAB are provided in Fig. S10 and S11 in the ESI,† respectively.
From Fig. 8 and 9 it is clear that the phase formation and transition from micellar to hexagonal and then to cubic and lamellar of 70 wt% CTAB in both EAN and EtAN derived solvents occurs initially in the solvent combinations where there is a high amount of water present. At 25 °C, the micellar phase (L1) was evident in most of the base-rich and acid-rich compositions of EAN where the mol fraction of water was higher than 0.25, whereas L1 formation was observed at 35 °C and 45 °C in the base-rich samples with a water mol fraction less than 0.25 (Fig. 8). On the other hand, micelles were only formed in acid-rich combinations of EtAN having water mol fractions higher than 0.5. The micellization in base-rich EtAN combinations occurred between 45 °C and 65 °C, depending on the basicity of compositions (Fig. 9).
The formation of hexagonal (H1) and bicontinous cubic (V1) phases started at 45 °C in water, and in some of the acid-rich combinations of EAN having water mol fractions higher than 0.75. Only H1 was present for solvents with a water mol fraction below 0.5, H1 + V1 were present for water mol fractions of 0.5 to 0.75, and H1 + V1 + Lα were observed in samples with water mol fractions higher than 0.75 (Fig. 8). A similar trend was also observed in EtAN derived combinations. Although the compositional range for phase transitions were similar to those observed in EAN derived solvents, more base-rich EtAN combinations promoted LLCP formation, including those having a water mol fraction of less than 0.5 (Fig. 9). As mentioned previously, this is attributed to the self-assembly promoting ability of the precursor ethanolamine.19
The phase diagrams constructed for 50 wt% CTAB in EAN and EtAN derived solvents are provided in Fig. S10 and S11 in the ESI,† respectively. From these, the phase transition from micellar (L1) to hexagonal (H1) and to an unassigned transient (U) phase was observed for most of the solvent combinations as temperature was increased from 25 °C to 70 °C. At 70 °C, almost all solvent compositions supported a hexagonal phase (H1) in both EAN and EtAN derived combinations. However, there was only one solvent composition (EAN_10b: water = 0.902 mol and A/B = 0.102) which supported normal bicontinuous cubic phase (V1) formation. In addition, an unassigned transient phase (U), along with H1, was observed in EAN based solvents with a water mol fraction higher than 0.5. Similarly, a cubic phase was only observed in one of the EtAN acid-rich compositions (EtAN_11a: water = 0.888 mol and A/B = 1.438), which was present even at 48 °C and stable up to 70 °C.
Lattice parameters of hexagonal (H1) and bicontinuous cubic (V1) phases
The lattice parameters of the LLCPs provide an insight into the effects of changing structures, solvent conditions, amphiphile concentration and temperature. The lattice parameters of the hexagonal (H1) and bicontinuous cubic (V1) phases were calculated through the AXcess program, and the calculated lattice parameters of LLCPs for 50 wt% and 70 wt% of CTAB at 70 °C and 65 °C are summarized in Table 1.![[3 with combining macron]](https://www.rsc.org/images/entities/char_0033_0304.gif) m)) phases at 70 °C and 65 °C for 50 wt% and 70 wt% CTAB concentrations
m)) phases at 70 °C and 65 °C for 50 wt% and 70 wt% CTAB concentrations
| Solvent system | CTAB concentration (wt%) | Lattice parameter (in Å) | |
|---|---|---|---|
| H1 | V1 (Im![[3 with combining macron]](https://www.rsc.org/images/entities/char_0033_0304.gif) m) m) |
||
| Water | 50 (70 °C) | 40.6 (58 °C) | 67.2 |
| 70 (65 °C) | 39.5 | 68.0 | |
| Neat EAN | 50 (70 °C) | 41.8 | — |
| 70 (65 °C) | 39.2 | — | |
| Acid-rich EAN solvents | 50 (70 °C) | 40.2–44.5 | — |
| 70 (65 °C) | 38.3–40.9 | 67.9–69.7 | |
| Base-rich EAN solvents | 50 (70 °C) | 39.1–44.6 | 67.2 |
| 70 (65 °C) | 37.9–39.7 | 66.2–67.8 | |
| Neat EtAN | 50 (70 °C) | 46.5 | — |
| 70 (65 °C) | 41.8 (75 °C) | — | |
| Acid-rich EtAN solvents | 50 (70 °C) | 43.2–50.3 | 72.2 |
| 70 (65 °C) | 37.2–43.9 | 69.4–73.0 | |
| Base-rich EtAN solvents | 50 (70 °C) | 42.1–49.4 | — |
| 70 (65 °C) | 40.0–45.6 | 68.8–70.2 | |
From Table 1, it is apparent that the lattice parameters were highly dependent on both the CTAB concentration and the solvent composition, with temperature having a lesser effect. The lattice parameter of the hexagonal phase of CTAB, and to a lesser extent those of the cubic phase, were the highest in neat EtAN, followed by neat EAN, and then water, at either temperature. Although this may be caused by the size reducing effect of increased temperature since the H1 phase started to form in neat EAN and water at lower temperatures, it is known that EtAN has a relatively similar solvophobicity to that of water and a markedly increased solvophobicity compared to EAN. These findings were in good accordance with the previously reported values where a homologous surfactant CTAC was used instead of CTAB in neat EAN, neat EtAN and water.46
For all cases, the lattice parameters of H1 phases were higher where the CTAB concentration was 50 wt% compared to 70 wt%. This suggests that the swelling and solvophobic effects are more dominant at lower surfactant concentrations. The lattice parameter ranges of H1 phases in acid-rich and base-rich EAN were similar, though the acid-rich compositions were slightly larger. Similar findings were observed for H1 phases of 50 wt% CTAB in EtAN derived solvents, however at 70 wt% of CTAB the lattice parameters of the H1 phase in base-rich EtAN were bigger than those formed in acid-rich EtAN compositions.
Regarding bicontinuous cubic phase (V1) formation, the amphiphile concentration as well as the solvent composition exhibited a profound effect, as discussed previously, and this can clearly be seen from Table 1. The cubic phase (V1) was present in water, but not in either neat EAN or neat EtAN. However, varying the water fraction and non-stoichiometry enabled the PIL based solvents to support V1 formation at the two CTAB concentrations investigated. The lattice parameters for the V1 phase was less affected by the increased amphiphile concentration than was observed for the H1 phase. Similarly, the cubic structures formed were slightly bigger in EtAN derived solvents than those in EAN derived solvents or water.
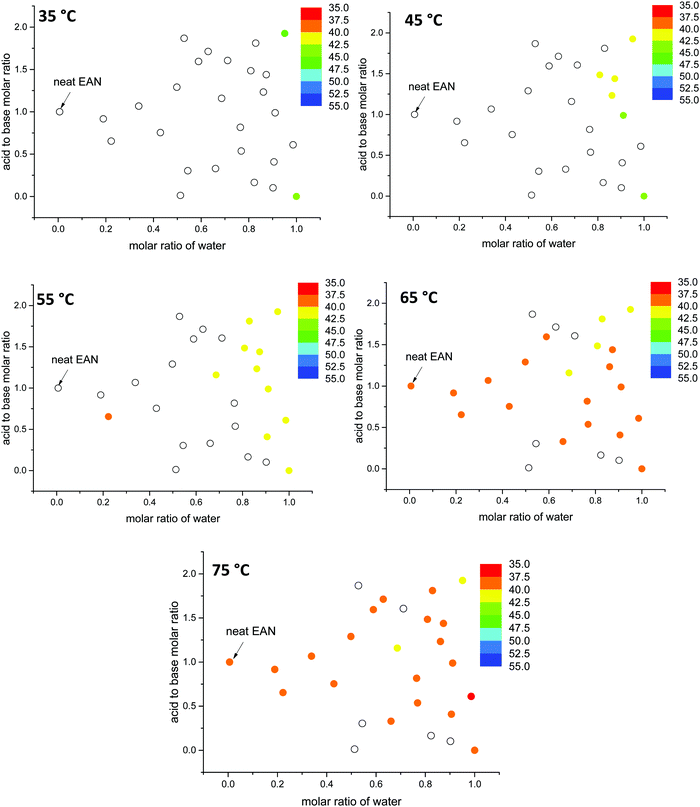
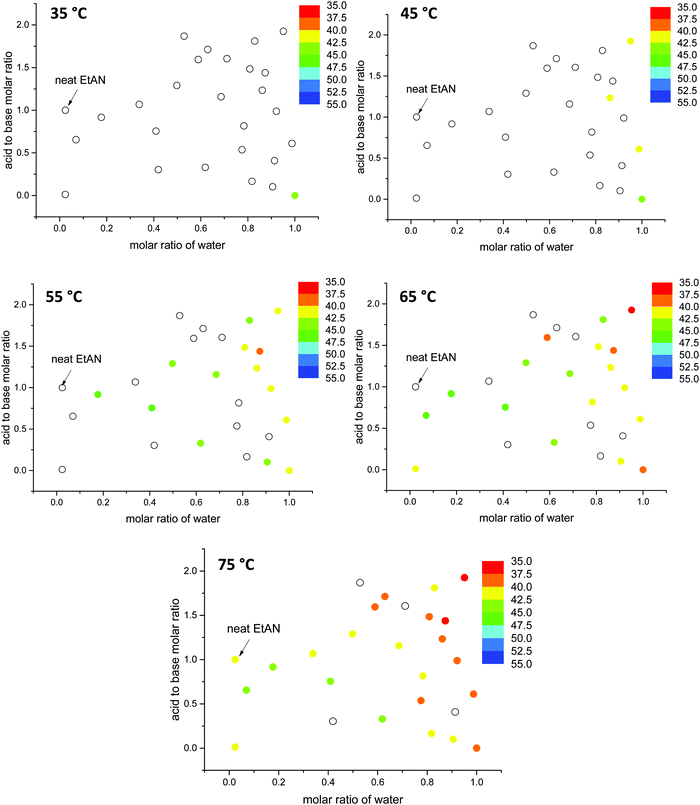
The lattice parameters for the hexagonal phase (H1) of 70 wt% CTAB are plotted in Fig. 10 and 11, for EAN and EtAN derived solvents respectively. The corresponding values of 50 wt% CTAB were also provided in Fig. S12 and S13 (ESI†), respectively. These plots allow the effect of solvent composition, temperature and amphiphile concentration on the phase formation to be visually observed. The color scales were kept the same for these figures for ease of comparison. From Fig. 10 and 11 it can be seen that with increasing temperature the lattice parameter of the hexagonal phase decreased, and the total number of solvent environments supporting the hexagonal phase increased. As the temperature went from 25 °C to 75 °C the unit cell reduced from about 45 Å to 37 Å for almost all solvent conditions. In EtAN derived solvents, the lattice parameters were slightly higher than the corresponding EAN derived solvents, and the same trends were observed.
A similar comparative analysis was done for the bicontinuous cubic phase (V1), and the resulting lattice parameter values calculated in EAN and EtAN derived solvents are given in Fig. S14 and S15 in the ESI,† respectively, for 70 wt% CTAB. The corresponding plots of 50 wt% CTAB concentration are provided in Fig. S16 and S17 in the ESI,† respectively. Only temperatures from 45 °C to 75 °C are included in Fig. S14 and S15 in the ESI,† because no cubic phases were present at lower temperatures in either EAN or EtAN derived solvents. From Fig. S14 (ESI†) it can be seen that the lattice parameters of cubic phases in EAN derived solvents ranged from 70.7 Å to 65.8 Å with a slight decrease in unit cell size with increasing temperature. It is more obvious from these results that the cubic phase was only formed when the water mol fraction in the solvent environment was higher than 0.5, and was retained regardless of how acidic or basic the solvent was. At 65 °C a total of 15 different solvent compositions out of 27 promoted the cubic phase formation. Unsurprisingly, the unit cell sizes calculated in EtAN derived solvents were larger than those in EAN derived solvents, and ranged from 76.0 Å to 67.7 Å, where the size reducing effect of increasing temperature was also observed (Fig. S15, ESI†). At 65 °C, a total of 13 different solvent compositions out of 27, most of which had a water mol fraction higher than 0.7, promoted the cubic phase formation.
Relation between Gordon parameters (G), liquid nanostructure and the formation of LLCPs
In the literature, many ILs have been reported as nanostructured liquids, and this occurs from nanoscale segregation of polar and nonpolar moieties due to solvophobic, electrostatic and hydrogen bonding interactions.47–49 The liquid nanostructure of a broad range of alkylammonium class PILs, including neat EAN and neat EtAN, have been extensively characterized, and it has been stated that PILs containing either di- and trialkyl ammonium cation and/or hydroxyl groups, have low or negligible intermediate range order (correlation distance d1) corresponding to a less structured liquid.5,47 Moreover, less structured PILs were found to be better promoters of self-assembly and supported more diverse LLCPs.47 From our previous results, the aqueous and non-stoichiometric combinations of EAN and EtAN were found to have no or negligible liquid nanostructure.43 Our findings show good agreement with the previous finding as many compositions of EAN and EtAN were shown to have self-assembly promoting ability.46In addition, it is known that the Gordon parameter (G) can be used as a guide to the likelihood of a solvent being a good self-assembly medium.37 It is defined as G = γLV/Vm−1/3, where γLV is the surface tension at the air–liquid interface, and Vm is molar volume.37 The higher G value of a solvent indicates a greater likelihood of a good self-assembly medium with greater phase diversity and thermal stability. The G values of various classes of ILs, along with molecular solvents, have been previously compiled by Greaves et al.17 The highest reported G value for a protic IL is 1.448 J mol1/3 m−3 for ethanolammonium formate, and the lowest is 0.576 J mol1/3 m−3 for ethylammonium butyrate.17,26,37
Here, the G values of all 53 aqueous and non-stoichiometric EAN and EtAN derived solvents including neat PILs and water were calculated, and the numeric values are given in Tables S3 and S4 (ESI†), respectively. The findings are discussed below in terms of the relation between the G value of solvents and LLCP formation. In calculation of G values, the previously reported experimental surface tension values of these solvents were used.43 Since density values were unavailable, the molar volumes of these multicomponent mixtures were calculated based on the molar fractions of each component assuming ideal mixing took place. Using this method, the molar volume of neat EAN based on the molar fractions of each component (Xwater = 0.006, XNO3 = 0.497 and XEA = 0.497) resulted in a G value of 1.264 J mol1/3 m−3. This led to slightly higher G values for neat EAN as well as the neat EtAN (1.553 J mol1/3 m−3) than those previously reported.26 Consequently, these should not be considered as absolute values, but as a self-consistent series. In Fig. 12, the calculated G values of EAN and EtAN derived solvents are plotted as color-map graphs with only compositions which supported the formation of H1 and V1 LLCPs included.
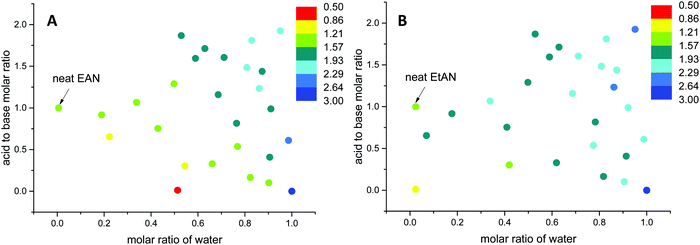 | ||
| Fig. 12 The change in Gordon parameters of (A) EAN derived and (B) EtAN derived solvent compositions in J mol1/3 m−3. | ||
The G values for EAN derived solvents were from 0.806 J mol1/3 m−3 (EAN_4b) to 2.474 J mol1/3 m−3 (EAN_13b) excluding neat EAN and water. From Fig. 12A, it can be seen that G values of acid-rich compositions were from 1.438 J mol1/3 m−3 (EAN_1a) to 2.130 J mol1/3 m−3 (EAN_12a), and were higher than those of base-rich compositions, except for one base-rich composition (EAN_13b) with the highest water content and moderate basicity of all base-rich compositions. A similar trend was observed for EtAN derived compositions with slightly higher G values than those of their EAN derived counterparts due to the increased solvophobicity (Fig. 12B). The lowest and highest G values for base-rich EtAN compositions were 1.199 J mol1/3 m−3 (EtAN_1b) and 2.263 J mol1/3 m−3 (EtAN_13b), respectively. Those for acid-rich compositions ranged from 1.625 J mol1/3 m−3 (EtAN_4a) to 2.535 J mol1/3 m−3 (EtAN_12a).
When the compositions plotted in Fig. 12 were compared with those plotted in Fig. 10, 11 and Fig. S14, S15 (ESI†), it was evident that there was a minimum G value required for the formation of H1 and V1 LLCPs in these aqueous and non-stochiometric PIL solvents. For the self-consistent G values calculated in this study, the minimum G values for the likelihood of H1 phase formation at 65 °C was 1.20 J mol1/3 m−3 for either EAN or EtAN derived compositions. For V1 phase formation at 65 °C, G should be higher than 1.55 J mol1/3 m−3 and 1.75 J mol1/3 m−3 for EAN and EtAN derived compositions, respectively.
Furthermore, all our results and findings in this study suggest that CTAB interacts more with PIL cations and water rather than the PIL nitrate anion. This most likely reflects bromide anions having stronger complexation than nitrate anions, and hence behaving as stronger competitive counter-ions to CTAB. The alkyl chain of the ethylammonium cation and that of ethanolammonium cation to a lesser extent increases the non-polar moieties in the solvent medium and can potentially act as a co-surfactant and lead to an increase in the mean curvature of CTAB, and hence influence LLCP formation. Although the acid-rich compositions were found to support LLCP formation, this ability is mainly attributed to the presence of water.
Conclusion
The LLCP formation and behaviour of two different concentrations of a cationic surfactant, CTAB, were explored in multicomponent solvent systems of water/ethylamine/nitric acid and water/ethanolamine/nitric acid through cross polarized optical microscopy and SAXS/WAXS analysis. The amphiphile concentration, solvent composition and effect of temperature was investigated on the lyotropic liquid crystal phases present, and their thermal stability. In general, the transition of phases followed the order from micellar to hexagonal to cubic, and to lamellar phases to a lesser extent. Thermal stability of the formed LLCPs were greater in base-rich solvent combinations than the acid-rich counterparts. For the studied range of solvent systems, samples with water mole fractions higher than 0.5 were more likely to promote the formation of cubic phases at higher temperatures. Generally, in acid-rich samples even at low surfactant concentrations and low temperatures, the cubic phase formation was observed, however these were not as thermally stable as those formed in the base-rich solvents. The presence of excess amines, either ethylamine or ethanolamine, increased the thermal stability of phases, although they also increased the onset temperatures of phase formation. Consequently, a broad composition region was identified where the LLCPs were supported in these aqueous and non-stoichiometric PIL derived solvents.This study clearly showed that PIL solvent environments can be modified substantially through additions of acidic, basic and water species, while still retaining their ability to promote the self-organisation behavior of a cationic amphiphile. Self-assembly systems with diverse phase formation are extremely desirable and advantageous for a range of applications, and the use of tailorable PILs enables greater functionalisation and control over the solvent environment than conventional aqueous solvents.
Conflicts of interest
There are no conflicts to declare.Acknowledgements
This research was undertaken in part on the SAXS/WAXS beamline at the Australian Synchrotron, Melbourne, Australia.References
- T. Welton, Room-Temperature Ionic Liquids. Solvents for Synthesis and Catalysis, Chem. Rev., 1999, 99, 2071–2083 Search PubMed.
- J. S. Wilkes, A Short History of Ionic Liquids - from Molten Salts to Neoteric Solvents, Green Chem., 2002, 4, 73–80 Search PubMed.
- R. Giernoth, Task-specific ionic liquids, Angew. Chem., Int. Ed., 2010, 49(16), 2834–2839 Search PubMed.
- N. D. Khupse and A. Kumar, Ionic liquids: New materials with wide applications, Indian J. Chem., 2010, 49A, 635–648 Search PubMed.
- T. L. Greaves and C. J. Drummond, Protic Ionic Liquids: Evolving Structure-Property Relationships and Expanding Applications, Chem. Rev., 2015, 115, 11379–11448 Search PubMed.
- M. Shukla and S. Saha, A Comparative Study of Piperidinium and Imidazolium Based Ionic Liquids: Thermal, Spectroscopic and Theoretical Studies, Ionic Liquids - New Aspects for the Future, 2013 Search PubMed.
- T. L. Greaves and C. J. Drummond, Protic Ionic Liquids: Properties and Applications, Chem. Rev., 2008, 108, 206–237 Search PubMed.
- J. Pernak, I. Goc and I. Mirska, Anti-microbial activities of protic ionic liquids with lactate anion, Green Chem., 2004, 6(7), 323–329 Search PubMed.
- F. Van Rantwijk and R. A. Sheldon, Biocatalysis in Ionic Liquids, Chem. Rev., 2007, 107, 2757–2785 Search PubMed.
- C. A. Angell, N. Byrne and J. P. Belieres, Parallel Developments in Aprotic and Protic Ionic Liquids: Physical Chemistry and Applications, Acc. Chem. Res., 2007, 40, 1228–1236 Search PubMed.
- J. Pernak, T. Rzemieniecki and K. Materna, Ionic liquids “in a nutshell” (history, properties and development), CHEMIK, 2016, 70, 471–480 Search PubMed.
- B. Fernandez-Castro, T. Mendez-Morales, J. Carrete, E. Fazer, O. Cabeza, J. R. Rodriguez, M. Turmine and L. M. Varela, Surfactant self-assembly nanostructures in protic ionic liquids, J. Phys. Chem. B, 2011, 115(25), 8145–8154 Search PubMed.
- T. Inoue and H. Yamakawa, Micelle formation of nonionic surfactants in a room temperature ionic liquid, 1-butyl-3-methylimidazolium tetrafluoroborate: surfactant chain length dependence of the critical micelle concentration, J. Colloid Interface Sci., 2011, 356(2), 798–802 Search PubMed.
- M. U. Araos and G. G. Warr, Self-Assembly of Nonionic Surfactants into Lyotropic Liquid Crystals in Ethylammonium Nitrate, a Room-Temperature Ionic Liquid, J. Phys. Chem. B, 2005, 109, 14275–14277 Search PubMed.
- R. Atkin, S. M. C. Bobillier and G. G. Warr, Propylammonium Nitrate as a Solvent for Amphiphile Self-Assembly into Micelles, Lyotropic Liquid Crystals, and Microemulsions, J. Phys. Chem. B, 2010, 114, 1350–1360 Search PubMed.
- C. Fong, T. Le and C. J. Drummond, Lyotropic liquid crystal engineering-ordered nanostructured small molecule amphiphile self-assembly materials by design, Chem. Soc. Rev., 2012, 41(3), 1297–1322 Search PubMed.
- T. L. Greaves and C. J. Drummond, Solvent nanostructure, the solvophobic effect and amphiphile self-assembly in ionic liquids, Chem. Soc. Rev., 2013, 42(3), 1096–1120 Search PubMed.
- A. Ray, Micelle Formation in Pure Ethylene Glycol, J. Am. Chem. Soc., 1969, 91, 6511–6512 Search PubMed.
- E. C. Wijaya, T. L. Greaves and C. J. Drummond, Linking molecular/ion structure, solvent mesostructure, the solvophobic effect and the ability of amphiphiles to self-assemble in non-aqueous liquids, Faraday Discuss., 2013, 167, 191–215 Search PubMed.
- Y. He, Z. Li, P. Simone and T. P. Lodge, Self-Assembly of Block Copolymer Micelles in an Ionic Liquid, J. Am. Chem. Soc., 2006, 128, 2745–2750 Search PubMed.
- T. Kaasgaard and C. J. Drummond, Ordered 2-D and 3-D nanostructured amphiphile self-assembly materials stable in excess solvent, Phys. Chem. Chem. Phys., 2006, 8(43), 4957–4975 Search PubMed.
- C. Patrascu, F. Gauffre, F. Nallet, R. Bordes, J. Oberdisse, N. de Lauth-Viguerie and C. Mingotaud, Micelles in ionic liquids: aggregation behavior of alkyl poly(ethyleneglycol)-ethers in 1-butyl-3-methyl-imidazolium type ionic liquids, ChemPhysChem, 2006, 7(1), 99–101 Search PubMed.
- C. E. Conn and C. J. Drummond, Nanostructured bicontinuous cubic lipid self-assembly materials as matrices for protein encapsulation, Soft Matter, 2013, 9(13), 3449–3464 Search PubMed.
- S. Thomaier and W. Kunz, Aggregates in Mixtures of Ionic Liquids, J. Mol. Liq., 2007, 130, 104–107 Search PubMed.
- T. L. Greaves and C. J. Drummond, Ionic liquids as amphiphile self-assembly media, Chem. Soc. Rev., 2008, 37(8), 1709–1726 Search PubMed.
- T. L. Greaves, A. Weerawardena, C. Fong and C. J. Drummond, Many Protic Ionic Liquids Mediate Hydrocarbon-Solvent Interactions and Promote Amphiphile Self-Assembly, Langmuir, 2007, 23, 402–404 Search PubMed.
- C. R. Lopez-Barron and N. J. Wagner, Structural Transitions of CTAB Micelles in a Protic Ionic Liquid, Langmuir, 2012, 28(35), 12722–12730 Search PubMed.
- T. L. Greaves, A. Weerawardena, I. Krodkiewska and C. J. Drummond, Protic Ionic Liquids: Physicochemical Properties and Behavior as Amphiphile Self-Assembly Solvents, J. Phys. Chem. B, 2008, 112, 896–905 Search PubMed.
- J. L. Anderson, V. Pino, E. C. Hagberg, V. V. Sheares and D. W. Armstrong, Surfactant solvation effects and micelle formation in ionic liquids, Chem. Commun., 2003, 2444–2445 Search PubMed.
- W. J. Cheong and P. W. Carr, The Surface Tension of Mixtures of Methanol, Acetonitrile, Tetrahydrofuran, Isopropanol, Tertiary Butanol and Dimethyl-Sulfoxide with Water at 25 °C, J. Liq. Chromatogr., 1987, 10, 561–581 Search PubMed.
- Z. He and P. Alexandridis, Micellization Thermodynamics of Pluronic P123 (EO20PO70EO20) Amphiphilic Block Copolymer in Aqueous Ethylammonium Nitrate (EAN) Solutions, Polymers, 2017, 10(2), 32–50 Search PubMed.
- Y. Li, L. S. Wang, Y. X. Feng and C. N. Zhang, Activity Coefficients of Organic Solutes at Infinite Dilution in Ionic Liquids. 1. 1-Hexyl-3-Methylimidazolium Hexafluorophosphate and 1-Octyl-3-MethylimidazoliumHexafluorophosphate and Their Application to Alkane/Aromatic and Aromatic/Aromatic Hydrocarbon Separation, Ind. Eng. Chem. Res., 2011, 50, 10755–10764 Search PubMed.
- L. Wang, X. Chen, Y. Chai, J. Hao, Z. Sui, W. Zhuang and Z. Sun, Lyotropic liquid crystalline phases formed in an ionic liquid, Chem. Commun., 2004, 2840–2841 Search PubMed.
- C. R. López-Barrón, D. Li, N. J. Wagner and J. L. Caplan, Triblock Copolymer Self-Assembly in Ionic Liquids: Effect of PEO Block Length on the Self-Assembly of PEO–PPO–PEO in Ethylammonium Nitrate, Macromolecules, 2014, 47(21), 7484–7495 Search PubMed.
- Q. Li, X. Wang, X. Yue and X. Chen, Phase transition of a quaternary ammonium Gemini surfactant induced by minor structural changes of protic ionic liquids, Langmuir, 2014, 30(6), 1522–1530 Search PubMed.
- N. Li, Y. Gao, L. Zheng, J. Zhang, L. Yu and X. Li, Studies on the Micropolarities of bmimBF4/TX-100/Toluene Ionic Liquid Microemulsions and Their Behaviors Characterized by UV-Visible Spectroscopy, Langmuir, 2007, 23, 1091–1097 Search PubMed.
- T. L. Greaves, A. Weerawardena, C. Fong and C. J. Drummond, Formation of Amphiphile Self-Assembly Phases in Protic Ionic Liquids, J. Phys. Chem. B, 2007, 111, 4082–4088 Search PubMed.
- L. J. Chen, S. Y. Lin, C. C. Huang and E. M. Chen, Temperature dependence of critical micelle concentration of polyoxyethylenated non-ionic surfactants, Colloids Surf., A, 1998, 135(1–3), 175–181 Search PubMed.
- C. Qin, J. Chai, J. Chen, Y. Xia, X. Yu and J. Liu, Studies on the phase behavior and solubilization of the microemulsion formed by surfactant-like ionic liquids with ε-β-fish-like phase diagram, Colloid Polym. Sci., 2008, 286(5), 579–586 Search PubMed.
- O. Zech and W. Kunz, Conditions for and characteristics of nonaqueous micellar solutions and microemulsions with ionic liquids, Soft Matter, 2011, 7(12), 5507–5513 Search PubMed.
- B. Hong, J. Lai, L. Leclercq, M. Collinet-Fressancourt, J. M. Aubry, P. Bauduin and V. Nardello-Rataj, Binary and ternary phase behaviors of short double-chain quaternary ammonium amphiphiles: surface tension, polarized optical microscopy, and SAXS investigations, J. Phys. Chem. B, 2013, 117(47), 14732–14742 Search PubMed.
- J. C. Thater, T. Sottmann and C. Stubenrauch, Alcohol as tuning parameter in an IL-containing microemulsion: The quaternary system EAN –n- octane–C 12 E 3 –1-octanol, Colloids Surf., A, 2016, 494, 139–146 Search PubMed.
- D. Yalcin, C. J. Drummond and T. L. Greaves, High-Throughput Approach to Investigating Ternary Solvents of Aqueous Non-Stoichiometric Protic Ionic Liquids, Phys. Chem. Chem. Phys., 2019, 21, 6810–6827 Search PubMed.
- T. L. Greaves, A. Weerawardena, C. Fong, I. Krodkiewska and C. J. Drummond, Protic Ionic Liquids: Solvents with Tunable Phase Behavior and Physicochemical Properties, J. Phys. Chem. B, 2006, 110, 22479–22487 Search PubMed.
- J. M. Seddon, A. M. Squires, C. E. Conn, O. Ces, A. J. Heron, X. Mulet, G. C. Shearman and R. H. Templer, Pressure-jump X-ray studies of liquid crystal transitions in lipids, Philos. Trans. R. Soc., A, 2006, 364(1847), 2635–2655 Search PubMed.
- Z. Chen, T. L. Greaves, C. Fong, R. A. Caruso and C. J. Drummond, Lyotropic liquid crystalline phase behaviour in amphiphile-protic ionic liquid systems, Phys. Chem. Chem. Phys., 2012, 14(11), 3825–3836 Search PubMed.
- T. L. Greaves, D. F. Kennedy, S. T. Mudie and C. J. Drummond, Diversity Observed in the Nanostructure of Protic Ionic Liquids, J. Phys. Chem. B, 2010, 114, 10022–10031 Search PubMed.
- R. Hayes, G. G. Warr and R. Atkin, Structure and Nanostructure in Ionic Liquids, Chem. Rev., 2015, 115, 6357–6426 Search PubMed.
- A. Triolo, O. Russina, H. J. Bleif and E. Di Cola, Nanoscale Segregation in Room Temperature Ionic Liquids, J. Phys. Chem. B, 2007, 111, 4641–4644 Search PubMed.
Footnote |
| † Electronic supplementary information (ESI) available. See DOI: 10.1039/d0sm01298j |
| This journal is © The Royal Society of Chemistry 2020 |

