Iodine doped composite with biomass carbon dots and reduced graphene oxide: a versatile bifunctional electrode for energy storage and oxygen reduction reaction†
Van Chinh
Hoang
 a,
Khang Ngoc
Dinh
ab and
Vincent G.
Gomes
 *a
*a
aThe University of Sydney, School of Chemical and Biomolecular Engineering, NSW 2006, Australia. E-mail: vincent.gomes@sydney.edu.au
bEnergy Research Institute @ NTU (ERI@N), Interdisciplinary Graduate School, Nanyang Technological University, Singapore 637553, Singapore
First published on 21st September 2019
Abstract
We prepared carbon dots (CDs) via a sustainable, low-cost synthetic route employing eggplant biomass. A three-dimensionally porous composite consisting of eggplant-CDs and reduced graphene oxide (RGO) was first synthesized via one-pot hydrothermal process. The as-synthesized RGO/CD hybrid was further deoxygenated with HI acid to enhance ionic conductivity and introduce iodine dopants in the structure. The I-doped graphene/CD composite exhibited specific capacitances of 432 and 460 F g−1 at 2 mV s−1 and 1 A g−1 with excellent capacitance retention of 68.4% and 76.5%, as the scan rate and current density increased from 2 to 1000 mV s−1 and from 1 to 100 A g−1, respectively. Superior cycling stability of 94.6% capacitance retention over 10![[thin space (1/6-em)]](https://www.rsc.org/images/entities/char_2009.gif) 000 cycles at 10 A g−1 was measured. As an electrocatalyst for oxygen reduction reaction (ORR) in 0.1 M KOH, the composite demonstrated an onset potential of 0.93 V vs. RHE and a kinetic limiting current density of 19.8 mA cm−2 at 0.1 V vs. RHE with an average electron transfer number of 3.57. The I-doped graphene/CD composite showed excellent ORR stability with current density retention of 97.7% under electrochemical stress (0.65 V vs. RHE) in comparison with 43.4% of the benchmark Pt/C under similar conditions. Thus, a sustainable process was developed to synthesize a multifunctional electrode based on agricultural wastes for energy storage and ORR.
000 cycles at 10 A g−1 was measured. As an electrocatalyst for oxygen reduction reaction (ORR) in 0.1 M KOH, the composite demonstrated an onset potential of 0.93 V vs. RHE and a kinetic limiting current density of 19.8 mA cm−2 at 0.1 V vs. RHE with an average electron transfer number of 3.57. The I-doped graphene/CD composite showed excellent ORR stability with current density retention of 97.7% under electrochemical stress (0.65 V vs. RHE) in comparison with 43.4% of the benchmark Pt/C under similar conditions. Thus, a sustainable process was developed to synthesize a multifunctional electrode based on agricultural wastes for energy storage and ORR.
1. Introduction
Increasing energy demands have spurred intense exploration of green, sustainable and renewable energy conversion and storage systems including metal–air batteries, fuel cells and electrochemical capacitors. Supercapacitors, as electrochemical energy storage devices, have demonstrated advantageous features of high power density, fast charge/discharge rate and long cycle stability,1 yet their widespread applications are inhibited by the low energy density compared to the conventional lithium ion batteries.2 Likewise, energy conversion systems in terms of metal–air batteries and fuel cells have been considered as alternative production technologies to replace the use of fossil fuels. However, the commercialization of these energy conversion devices is hindered by the prohibitive cost of scarce noble metals such as Pt, Pd-based electrocatalysts and sluggish reaction kinetics of the ORR at the cathode.3 Previous studies have reported that the efficiency of supercapacitors and ORR is based on the properties of electrode materials.4,5 Therefore, developing multifunctional electrode materials with high capacitance and excellent ORR activity at low cost is highly desirable.Typically, high conductivity materials with large surface area, abundant pore structures with high chemical and thermal stabilities have proven to be ideal for electrochemical energy conversion and storage.6,7 In this sense, carbon materials have been intensively studied because of their abundant nature, good electronic conductivity, large surface area, chemical inertness, tunable morphology and functionality.8 Among them, heteroatom-doped graphene has recently drawn attention as an electrode material in supercapacitors as well as a metal-free ORR electrocatalyst.9,10 However, the low density of carbon edge sites and low degree of practically achievable electrochemically active surface area (ECSA) induced by adverse aggregation/stacking nature of graphene nanosheets have limited its commercial viability.11 To resolve this issue, the incorporation of graphene with transition metal oxides could provide 3D structures with increased ECSA and introduce pseudocapacitance/catalytic active sites,4,5 yet this may seriously sacrifice both cyclability and rate capability of graphene12 or limit the ORR kinetics due to insufficient electronic conductivity of these oxides.13 Recently, the combination of graphene with other classes of carbon nanomaterials including carbon nanotube, carbon nanofiber and fullerenes has shown an efficient way to enhance electrochemical properties.14 Nevertheless, it remains challenging to reduce the cost of these additives for the industrial scale-up of the resultant composites.
Carbon quantum dot, a relatively new allotrope of 0D carbon nanomaterial, possesses high electrical conductivity, rapid electron transfer, chemical stability, low toxicity and ease of surface functionalization, which points to bright promise of CDs in energy storage and conversion applications.15,16 In contrast, the main obstacle for commercializing CDs are synthesis of high quality and environmentally friendly CDs at a low cost. In an alternative approach, price neutral and sustainable CDs could be obtained from abundant biomass resources, for instance eggs, soy milk, vegetables and plant leaves.14,17 Recent reports have documented the design and synthesis of graphene and CD composites as electrode materials for supercapacitors14,18–20 and fuel cells.18,21,22 For instance, our group reported the supercapacitor performance of RGO/biomass-derived CDs with a CD![[thin space (1/6-em)]](https://www.rsc.org/images/entities/char_2009.gif) :
:![[thin space (1/6-em)]](https://www.rsc.org/images/entities/char_2009.gif) GO mass ratio of 1
GO mass ratio of 1![[thin space (1/6-em)]](https://www.rsc.org/images/entities/char_2009.gif) :
:![[thin space (1/6-em)]](https://www.rsc.org/images/entities/char_2009.gif) 2, which delivered a maximum capacitance of 278 F g−1 at 0.2 A g−1 in 1 M H2SO4 electrolyte with an excellent capacitance retention of 60% as the current density rose to 100 A g−1 and superior cycle life with 96.1% capacitance retention over 10
2, which delivered a maximum capacitance of 278 F g−1 at 0.2 A g−1 in 1 M H2SO4 electrolyte with an excellent capacitance retention of 60% as the current density rose to 100 A g−1 and superior cycle life with 96.1% capacitance retention over 10![[thin space (1/6-em)]](https://www.rsc.org/images/entities/char_2009.gif) 000 cycles at a current density of 20 A g−1.14 In another case, N,S co-doped RGO/CD hybrid demonstrated to be electrochemical activity towards ORR with an O2 reduction peak at −0.17 V (vs. Ag/AgCl), an onset potential of 0.02 V (vs. Ag/AgCl) and an electron transfer number in the range of 3.5–3.75.18 The enhanced capacitance and electrocatalytic activity might derive from the reduced graphene restacking/aggregation and increased active sites due to numerous edge/surface defects on the surface/interface of RGO/CDs.18,22 However, modest capacitance values and limited ORR performance may be assigned to the high oxygen content on RGO/CD composites, triggering low electrical conductivity.19 Therefore, an effective deoxygenation is needed to increase their electrical conductivity for practical applications.
000 cycles at a current density of 20 A g−1.14 In another case, N,S co-doped RGO/CD hybrid demonstrated to be electrochemical activity towards ORR with an O2 reduction peak at −0.17 V (vs. Ag/AgCl), an onset potential of 0.02 V (vs. Ag/AgCl) and an electron transfer number in the range of 3.5–3.75.18 The enhanced capacitance and electrocatalytic activity might derive from the reduced graphene restacking/aggregation and increased active sites due to numerous edge/surface defects on the surface/interface of RGO/CDs.18,22 However, modest capacitance values and limited ORR performance may be assigned to the high oxygen content on RGO/CD composites, triggering low electrical conductivity.19 Therefore, an effective deoxygenation is needed to increase their electrical conductivity for practical applications.
Generally, deoxygenating GO to produce high-quality graphene could be obtained by thermal annealing and chemical reduction.23 Compared with thermal reduction method, which is time consuming and requires high temperatures (over 450 °C), chemical reduction is advantageous for rapid mass production and requires a lower temperature.23 Chemical reduction has entailed use of reducing agents including hydrazine or NaBH4 which reduce GO in the solution phase only and increase of RGO sheet resistance, hence empeding their widespread adoption for the deoxygenation of solid materials.24,25 Recently, hydriodic acid (HI) has been demonstrated to efficiently reduce GO films into high quality RGO with much increased electrical conductivity, higher graphitization degree and iodine doping within 2–15 min.24,26 The iodine-doping not only increased pseudocapacitance of graphene,25 but also disrupted the electroneutrality of graphitic carbon frameworks of graphene, polarizing the adjacent carbon atoms for O2 adsorption, and favoring ORR by weakening the O–O bond strength.27,28
In this study, we first synthesized environmentally-friendly CDs from eggplant – a natural biomass precursor, assembled a 3D porous RGO/CD hybrid via hydrothermal treatment, and subsequently deoxygenated the hybrid by hydriodic acid to simultaneously improve its ionic conductivity and introduce iodine dopants in its structure. The synthesized I-doped graphene/CD composite was then applied as a bifunctional electrode material for testing its supercapacitance and ORR electrocatalysis performance.
2. Experimental
2.1. Fabrication of eggplant-CDs
All chemicals were purchased from Sigma Aldrich (Australia) and used without further purification. Milli-Q (MQ) water with 18.2 MΩ cm resistivity was utilized throughout the study. Eggplant obtained from a local supermarket was washed using MQ water and then chopped into little patches, which were added with MQ water into a 200 mL Teflon-lined autoclave and held at 220 °C for 8 h. The resultant product was thoroughly filtered with a 0.45 μm nylon membrane to remove large particles. Finally, the CD solution (6.4 mg mL−1) was collected by another filtration through a 0.22 μm nylon membrane and stored in a refrigerator for further utilization.2.2. Fabrication of I-doped graphene/CD hybrid
GO was prepared via the modified Hummer's method.25 The RGO/CDs were fabricated based on our previous study.14 In a typical procedure, appropriate amount of CD solution was added into 10 mL GO solution 2 mg mL−1 to achieve a final CD/GO mass ratio of 1![[thin space (1/6-em)]](https://www.rsc.org/images/entities/char_2009.gif) :
:![[thin space (1/6-em)]](https://www.rsc.org/images/entities/char_2009.gif) 2, followed by ultra-sonication for 30 min. The resulting mixture was then sealed in a 200 mL Teflon-lined stainless steel autoclave, and kept at 200 °C for 10 h. The solid product was filtered with a nylon membrane, washed with MQ water for several times and then freeze-drying at −40 °C overnight. Subsequently, the composite was placed above 57 wt% HI solution at 100 °C for 10 min, labeled as HI-RGO/CDs. The obtained material was further washed several times with MQ water and dried at 70 °C for 10 h. For comparison, RGO was also reduced with HI solution at 100 °C for 10 min, denoted as HI-RGO.
2, followed by ultra-sonication for 30 min. The resulting mixture was then sealed in a 200 mL Teflon-lined stainless steel autoclave, and kept at 200 °C for 10 h. The solid product was filtered with a nylon membrane, washed with MQ water for several times and then freeze-drying at −40 °C overnight. Subsequently, the composite was placed above 57 wt% HI solution at 100 °C for 10 min, labeled as HI-RGO/CDs. The obtained material was further washed several times with MQ water and dried at 70 °C for 10 h. For comparison, RGO was also reduced with HI solution at 100 °C for 10 min, denoted as HI-RGO.
2.3. Material characterization
The surface morphology was investigated by a scanning (SEM, Ultra-Plus, Zeiss) and a transmission (TEM, JEM-1400F, JEOL) electronic microscopes. High resolution TEM measurements were carried out on a transmission electron microscope (JEM-2200FS, JEOL) at 200 kV. The elemental compositions of the materials were analyzed by energy-dispersive X-ray spectroscopy (EDX) incorporated with SEM and X-ray photoelectron spectroscopy (XPS, Thermo Scientific K-Alpha, UK) adopting 12 kV Al Kα (1486.6 eV) radiation. The crystal structures of the samples were investigated by X-ray diffractometry (XRD, PANalytical X'Pert powder) with 45 kV and 40 mA Cu Kα radiation (λ = 1.5406 Å). The N2 adsorption–desorption isotherms was examined by Quanta Chrome, Autosorb-1 at 77 K. Their surface areas were estimated by the conventional Brunauer–Emmet–Teller (BET) technique while their pore volume and pore size distribution were determined by the density functional theory (DFT). The Fourier transform infrared (FTIR) spectra were obtained using a Thermo Scientific Nicolet 6700 spectrometer. Raman microscope (InVia, Renishaw) was used to record Raman spectra with a 532 nm laser. A UV-Vis Spectrophotometer (Cary 60, Agilent Technologies) and a photoluminescence (PL) spectrofluorometer (Horiba FluoroMax-4, USA) were used to investigate the optical properties of the materials.2.4. Electrochemical measurements
The supercapacitor behavior was performed on a CHI760E potentiostat (CHI Instrument) employing a three-electrode cell in 1 M H2SO4 and 1 M KOH electrolytes with active materials loaded on glassy carbon electrode (GC, 5 mm in diameter), Pt plate and Ag/AgCl as the working electrode, counter electrode and reference electrode, respectively. The ink was obtained by ultra-sonicating 5 wt% Nafion and active materials in isopropanol (IPA) to prepare 5 mg mL−1 slurry. Afterwards, 20 μL suspension was drop-casted on GC electrode, followed by drying in air.Cyclic voltammetry (CV) and galvanostatic charge discharge (GCD) plots were conducted in a potential window between 0 and 1 V (vs. Ag/AgCl) in 1 M H2SO4 or −1 and 0 V (vs. Ag/AgCl) in 1 M KOH. An AC voltage with 5 mV perturbation amplitude in 106 to 0.01 Hz was applied to record the electrochemical impedance spectroscopy (EIS). The specific capacitance of the materials was estimated by:
| Csp = Celectrode/m | (1) |
C electrode was estimated as follows:
 | (2) |
| Celectrode = i/(dV/dt) | (3) |
ORR measurements were conducted on CHI760E adopting a three-electrode cell in 0.1 M KOH solution with electrocatalyst-loaded GC rotating disk electrode (RDE, 5 mm in diameter or surface area of 0.19625 cm2), Pt wire and Ag/AgCl served as the working electrode, counter electrode and reference electrode, respectively. The slurry was prepared by ultra-sonically dispersing 5 wt% Nafion and catalysts and in IPA to prepare 1 mg mL−1 ink suspension. Afterwards, 20 μL resultant ink was spread on RDE electrode, followed by drying in air.
The potential range for CV was −1.0 to 0.2 V (vs. Ag/AgCl) at 10 mV s−1 scan rate. Linear sweep voltammetry (LSV) curves were recorded in O2-saturated 0.1 M KOH in the potential window between 0.1 and −1.0 V (vs. Ag/AgCl) at different rotation speeds with a scan rate of 10 mV s−1. All polarization LSV curves were 95% iR-compensated. For comparison, the benchmark 20 wt% Pt/C was employed to prepare a reference electrode at the same mass loading.
3. Results and discussion
3.1. Morphology and composition
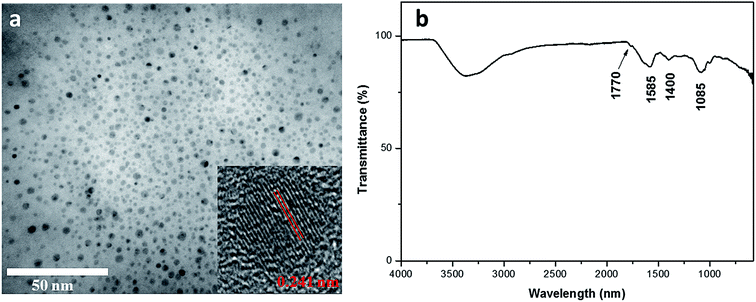
Eggplant has an interconnected 3D microstructure and contains abundant C moiety that enables excellent carbonization (Fig. S1, ESI†). Eggplant – a natural source, has high hydrocarbon content and constituent parts of cellulose and protein.29 The CDs were obtained through one-pot hydrothermal treatment of the eggplant precursor. Under hydrothermal treatment, these polymers and molecules undergo dehydration and further carbonization to form CDs.30 TEM image reveals that the eggplant-derived CDs appear as spherical particles with their diameters distributed between 2 and 5 nm (Fig. 1a). The HRTEM result reveals that the synthesized CDs possess crystalline structures with well-resolved lattice spacing of 0.241 nm, which is close to the (100) facet of graphitic carbon18 (Fig. 1a). Fig. 1b depicts the FTIR spectrum of the CDs, presenting several surface functional groups. For instance, an absorption peak at 2990–3680 cm−1, clear modes at 1770 cm−1 and 1085 cm−1 are attributed to O–H, C![[double bond, length as m-dash]](https://www.rsc.org/images/entities/char_e001.gif) O and C–O stretching vibration, respectively.10 The peak at 1400 cm−1 is assigned to C–H deformation of methyl/methylene groups, whereas the band at 1585 cm−1 results from C
O and C–O stretching vibration, respectively.10 The peak at 1400 cm−1 is assigned to C–H deformation of methyl/methylene groups, whereas the band at 1585 cm−1 results from C![[double bond, length as m-dash]](https://www.rsc.org/images/entities/char_e001.gif) C stretching.17 The existence of these oxygen functional groups renders hydrophilicity to the CDs. The FTIR analysis matches well with the EDX data which reveal high C and O weightage with some impurities (Fig. S2, ESI†).
C stretching.17 The existence of these oxygen functional groups renders hydrophilicity to the CDs. The FTIR analysis matches well with the EDX data which reveal high C and O weightage with some impurities (Fig. S2, ESI†).
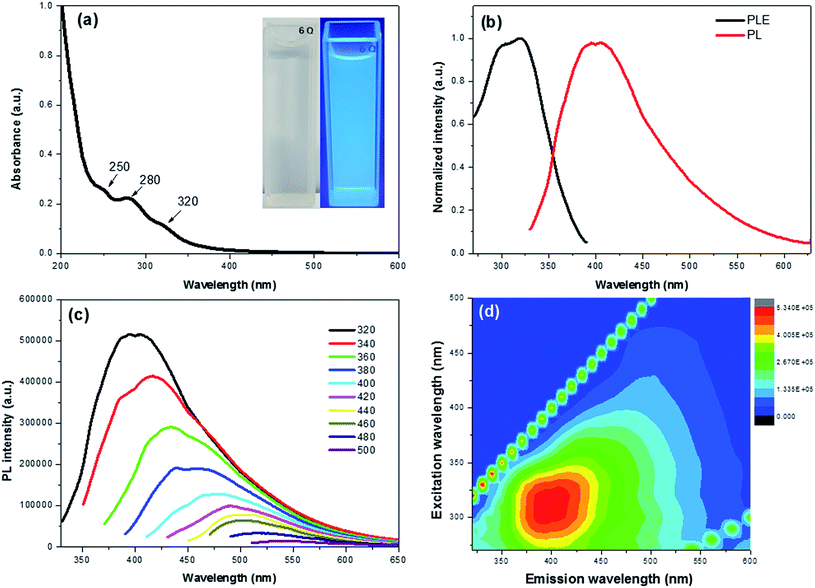
The optical properties of the CDs were investigated by means of UV-vis and PL spectroscopy. The absorption spectrum shows three clear peaks at 250, 280 and 320 nm with a tail extension into the visible range (Fig. 2a). The absorption bands at 250 and 280 nm are attributed to π–π* transition of the C![[double bond, length as m-dash]](https://www.rsc.org/images/entities/char_e001.gif) C bond of the sp2 carbon domains,17 whereas the peak at 320 nm is ascribed to the n–π* transition of C
C bond of the sp2 carbon domains,17 whereas the peak at 320 nm is ascribed to the n–π* transition of C![[double bond, length as m-dash]](https://www.rsc.org/images/entities/char_e001.gif) O groups.31 The as-prepared CDs presented a light yellow solution under natural light, while emitting a bright blue emission under 365 nm laser (Fig. 2a inset). This provided a visual confirmation of the fluorescence properties of the CDs.
O groups.31 The as-prepared CDs presented a light yellow solution under natural light, while emitting a bright blue emission under 365 nm laser (Fig. 2a inset). This provided a visual confirmation of the fluorescence properties of the CDs.
Fig. 2b exhibits the PL excitation (PLE) and PL spectra of the CDs with an intense blue emission and PLE peak maxima at ∼400 nm and 320 nm, respectively. The maximum PLE peak at 320 nm matches well with the UV-vis results, indicating that the electron transition of triplet carbene from the σ and π orbitals (highest occupied molecular orbitals or HOMO) to the lowest unoccupied molecular orbitals (LUMO) of C![[double bond, length as m-dash]](https://www.rsc.org/images/entities/char_e001.gif) O groups.32,33 In addition, the CDs exhibited an excitation dependent down-conversion PL emission (Fig. 2c) whose strongest emission peak was red-shifted from 400 to 543 nm with a gradually decreasing intensity as the excitation wavelength was increased from 320 to 500 nm. The PL efficiency was attributed to the surface passivation derived from oxygen functional groups, which effectively trap the excitons and hinder the non-radiative recombination.17,34 This effect is also seen in the contour maps of the CDs (Fig. 2d).
O groups.32,33 In addition, the CDs exhibited an excitation dependent down-conversion PL emission (Fig. 2c) whose strongest emission peak was red-shifted from 400 to 543 nm with a gradually decreasing intensity as the excitation wavelength was increased from 320 to 500 nm. The PL efficiency was attributed to the surface passivation derived from oxygen functional groups, which effectively trap the excitons and hinder the non-radiative recombination.17,34 This effect is also seen in the contour maps of the CDs (Fig. 2d).
To synthesize RGO/CDs, the solution containing CDs was added to GO in aqueous media, followed by ultra-sonication to achieve a uniform dispersion. During this process, –OH groups on the surface of CDs reacted with –COOH on GO, along with the formation of hydrogen bonds between oxygen functional groups, producing strong interactions between GO and CD. Moreover, the dehydration and condensation process during the hydrothermal treatment resulted in the formation of 3D structured RGO/CDs.20 Hydriodic acid was used to simultaneously reduce the RGO/CD composite and introduce iodine dopants into the structure. The reduction mechanism of oxygen functional groups by HI vapor is proposed as follows:24,35
 | (4) |
 | (5) |
 | (6) |
Iodine incorporation into the sp2 carbon framework alters the electron donor property. Due to the differences in size and electronegativity between I (2.66) and C (2.55), the charge redistribution among carbon within I-doped carbon occurs via a charge-transfer process. As a result, the adjacent carbon atoms become positively charged.27 In addition, the band gap between the highest-occupied molecular orbital (HOMO) and the lowest-unoccupied molecular orbital (LUMO) is reduced because the HOMO energy level is lifted to a higher value, which leads to the modification of the electronic properties of the carbon network.36
The morphology of the materials was determined by SEM and their elemental composition was examined by EDS. Fig. 3a shows that RGO layers are densely packed whereas the RGO/CDs composite possesses a highly porous network with several μm-size pores (Fig. 3b), which may be ascribed to the effective prevention of the π–π stacking of graphene nanosheets. The CD incorporation into graphene network increases oxygen concentration and decreases carbon content (see Table 1 and Fig. S3 and S4, ESI†). The rich oxygen containing functional groups impart the hydrophilicity to RGO and provide large number of active redox sites from numerous edge/surface defects on the surface/interface of RGO/CDs.18,22 After treatment with HI acid vapor, HI-RGO/CDs still maintained a unique 3D structure, yet the pore sizes were reduced compared to RGO/CDs as a consequence of the removal of oxygen containing groups. A uniform distribution of iodine element was observed in HI-RGO/CDs (Fig. S5, ESI†). Fig. 3e indicates that CDs are uniformly decorated on graphene nanosheets, confirming a prominent interaction of RGO and CDs. In addition, the interlayer spacing of CDs in HI-RGO/CDs was found to be 0.209 nm (Fig. 3e), which is lower than that of the as-prepared CDs, indicating that the CDs were efficiently reduced by the HI vapor treatment and the HI vapor was effective for the recovery of the π-conjugated framework of the CDs.24 The HI vapor treatment poses a rise in iodine proportion and a decline in both carbon and oxygen contents (Table 1). The iodine doping is not only beneficial for the electronic conductivity of RGO/CD hybrid but also provides higher pseudocapacitance as well as polarizes the adjacent carbon atoms for O2 adsorption, favoring the ORR by weakening the O–O bonding strength.24,27,28,37,38
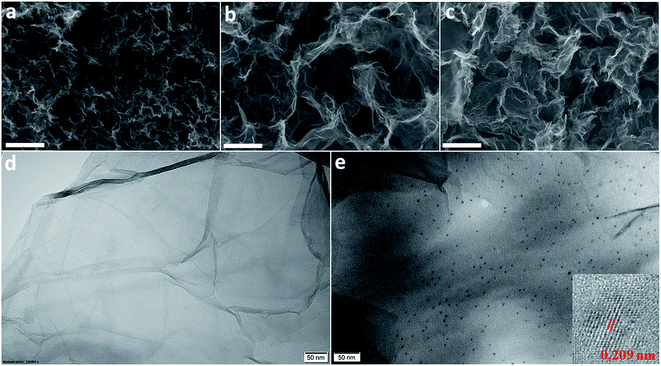 | ||
| Fig. 3 SEM images of (a) RGO, (b) RGO/CDs and (c) HI-RGO/CDs. The scale bar is 2 μm; TEM images of (d) RGO and (e) HI-RGO/CDs. The inset in (e) shows the HRTEM image of CDs in HI-RGO/CDs. | ||
| Samples | C (wt%) | O (wt%) | I (wt%) | I D/IG | Specific surface area (m2 g−1) | Pore volume (cm3 g−1) |
|---|---|---|---|---|---|---|
| RGO | 89.4 | 10.6 | — | 0.94 | 191 | 0.96 |
| RGO/CDs | 84.7 | 15.3 | — | 1.00 | 400 | 2.84 |
| HI-RGO/CDs | 82.7 | 12.6 | 4.7 | 1.11 | 250 | 0.75 |
The porosity of the materials was investigated by N2 physisorption isotherms and the results are illustrated in Fig. 4 and listed in Table 1. The CD combination has a remarkable influence on the structure of RGO network with its specific surface area increasing from 191 to 400 m2 g−1 and pore volume rising from 0.96 to 2.84 cm3 g−1. Nevertheless, after HI acid treatment, HI-RGO/CDs display a decrease in these values to 250 m2 g−1 and 0.75 cm3 g−1. These results are in accordance with the SEM micrographs shown in Fig. 3. The physisorption isotherms in Fig. 4a show type IV isotherms with a hysteresis loop indicating that these porous samples are mainly composed of mesopores. The corresponding pore-size-distribution plots (Fig. 4b) exhibit that both RGO/CDs and RGO consist of micro/mesopore radii between 0.8 and 18 nm while HI-RGO/CDs has micro/mesopore radii narrowing down between 1.1 and 5.8 nm. Such micro/mesoporous structure is conducive to rapid ion penetration and fast electron transfer, enhancing the electrochemical characteristics.
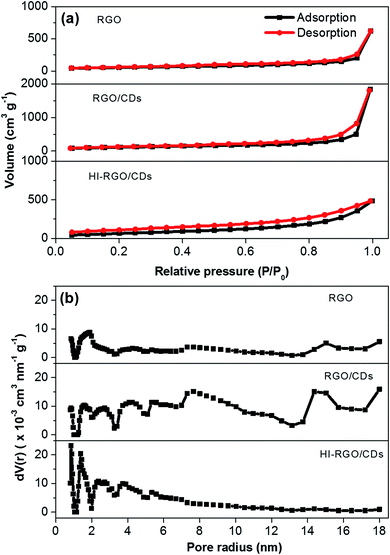 | ||
| Fig. 4 (a) Nitrogen adsorption–desorption isotherms, and (b) pore size distributions of three investigated samples. | ||
XRD analysis was used to characterize the graphitic structure of the materials. A typical broad peak at 2θ = 9.99° was observed for GO, corresponding to the (002) diffraction39 (Fig. 5a). However, upon successful hydrothermal process, the (002) peak showed a dramatic shift to higher position at 2θ = 24.30° in RGO with an interlayer spacing of 3.66 Å, which is much lower than that of GO (8.86 Å), demonstrating an effective reduction of GO via the hydrothermal process. In addition, it further shifted to higher position at 25.14° in RGO/CDs with the d spacing of 3.54 Å, close to that of graphite (3.34 Å), demonstrating the benefits of CD decoration for the restoration of π-conjugated graphitic framework of RGO.14,19 Notably, after exposure to HI acid vapor, no obvious change was observed in the (002) peak and interlayer spacing of HI-RGO/CDs, which implies that the restacking/aggregation of RGO sheets in RGO/CDs was effectively inhibited during the reduction procedure by HI acid treatment.40
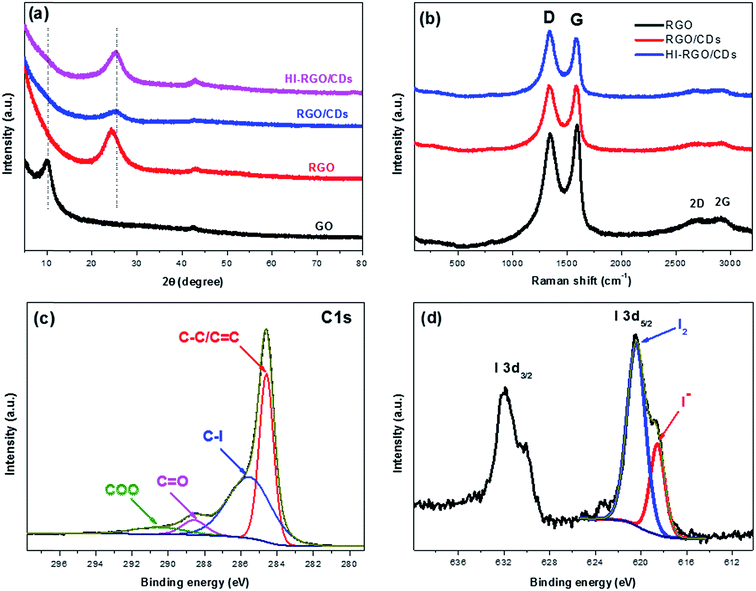 | ||
| Fig. 5 (a) XRD patterns and (b) Raman spectra of three investigated samples. High resolution XPS C 1s (c) and I 3d (b) spectra HI-RGO/CDs. | ||
Fig. 5b shows the Raman spectra of the materials with a D band at ∼1340 and a G band at ∼1587 cm−1, respectively. The D to G intensity ratio (ID/IG) reflects the structural defects/disorders of the carbon-based samples.41,42 The ID/IG increased from 0.94 in RGO to a peak of 1.11 in HI-RGO/CDs, which could be attributed to larger number of surface/edge disorders from O/I heteroatoms.24,26,37,40 The Raman spectrum of RGO shows two broad peaks at ∼2690 and 2910 cm−1, corresponding to the 2D and 2G bands, respectively. The intensities of these bands decreased significantly for the RGO/CDs, indicating that RGO consists of a substantial amount of graphite-like multilayer graphene sheets because of aggregation41 compared with RGO/CD composite. Insignificant variance in the intensities of 2D and 2G peaks was observed after HI acid treatment. These results authenticated that CD decoration not only hinders graphene restacking/aggregation, enlarging surface area, but also generates more surface/edge defects. Notably, no peak of either I3− (117 cm−1) or I5− (165 cm−1) polyiodide is detected in the Raman spectrum of HI-RGO/CDs.25 Besides, the intensities of C–O (1561 cm−1) and C–O–C (1198 cm−1) stretching peaks in the FTIR spectrum become more pronounced in the RGO/CD composite due to the oxygen functional groups of CDs, yet weaken after HI vapor treatment (Fig. S6, ESI†),24,26 demonstrating an efficient reduction of O-containing groups on RGO/CD by hydriodic acid. A similar phenomenon was observed in HI-RGO (Fig. S7 and S8, ESI†). Interestingly, there is no detectable peak of hydroxyl groups in these samples, revealing an effective reduction of GO into RGO by hydrothermal treatment.
The surface elemental composition of HI-RGO/CDs was further analyzed via XPS. The high resolution C1s spectrum (Fig. 5c) can be fitted into four components arising from C![[double bond, length as m-dash]](https://www.rsc.org/images/entities/char_e001.gif) C/C–C (284.6 eV, 41.6%), C–I (285.5 eV, 46.0%), C
C/C–C (284.6 eV, 41.6%), C–I (285.5 eV, 46.0%), C![[double bond, length as m-dash]](https://www.rsc.org/images/entities/char_e001.gif) O (288.6 eV, 6.1%) and O–C
O (288.6 eV, 6.1%) and O–C![[double bond, length as m-dash]](https://www.rsc.org/images/entities/char_e001.gif) O (290.5 eV, 6.3%).25 The existence of C–I bond indicates that iodine atoms are doped into the carbon framework. Besides, the C/O atomic ratio of HI-RC33-10 is 5.6, implying an efficient reduction of GO by hydrothermal process and restoration of π-conjugated graphitic carbon due to the exposure to HI vapor. Fig. 5d depicts the chemical states of I 3d5/2 spectra, which have been deconvoluted into two peaks at 620.4 and 618.6 eV, corresponding to neutral iodine (I2, 71.4%) and iodide anion (I−, 28.6%),37 respectively, which indicates that a large proportion of aromatic iodides was further donated their electrons to recover the π conjugated graphene network and form I2.25 Therefore, the XRD, Raman, FTIR and XPS results attest that RGO was effectively reduced to graphene and I-doped graphene/CD composite was successfully fabricated.
O (290.5 eV, 6.3%).25 The existence of C–I bond indicates that iodine atoms are doped into the carbon framework. Besides, the C/O atomic ratio of HI-RC33-10 is 5.6, implying an efficient reduction of GO by hydrothermal process and restoration of π-conjugated graphitic carbon due to the exposure to HI vapor. Fig. 5d depicts the chemical states of I 3d5/2 spectra, which have been deconvoluted into two peaks at 620.4 and 618.6 eV, corresponding to neutral iodine (I2, 71.4%) and iodide anion (I−, 28.6%),37 respectively, which indicates that a large proportion of aromatic iodides was further donated their electrons to recover the π conjugated graphene network and form I2.25 Therefore, the XRD, Raman, FTIR and XPS results attest that RGO was effectively reduced to graphene and I-doped graphene/CD composite was successfully fabricated.
3.2. Electrochemical analyses
The electrochemical behavior of the samples was first examined by means of CV, GCD and EIS techniques in 1 M H2SO4 medium adopting a 3-electrode system, and the results are plotted in Fig. 6. The CV plots of RGO and RGO/CDs (Fig. 6a and S9, ESI†) exhibit reversible redox humps between 0.1 and 0.6 V, which derive from the pseudo-capacitive contribution from oxygen-containing groups,10,19 yet these peaks are more noticeable in the case of HI-RGO/CDs, which is ascribed to the pseudo-capacitance caused by oxygen containing groups and doped iodine heteroatoms.24,37 In addition, nearly symmetric triangular shapes of their GCD curves without any obvious iR drop indicate a high efficiency supercapacitor behavior (Fig. 6b and S10, ESI†). Their specific capacitances estimated from the corresponding CV and GCD plots are shown in Fig. 6c and d. The HI-RGO/CDs has the highest specific capacitance of 432 F g−1 at the scan rate of 2 mV s−1 compared to those of RGO/CDs (248 F g−1) and RGO (139 F g−1). Notably, with an increase in the scan rate to 1000 mV s−1, RGO/CD and HI-RGO/CD composites retain ∼70% of their capacitances while RGO capacitance retention declines to about 50%, which might come from the higher electrical conductivity and ionic migration due to both oxygen containing groups and iodine dopants.24,37 The enhanced capacitance induced by iodine heteroatoms was further authenticated by the electrochemical performance of HI-RGO (Fig. S11, ESI†), which delivers a maximum specific capacitance of 199 F g−1 at 2 mV s−1 and still maintains 115 F g−1 at 1000 mV s−1, retaining 58% of its initial capacitance. However, the electrochemical performance of HI-RGO is much lower than that of HI-RGO/CDs, demonstrating the significance of the CD-RGO sheet for the improved electrochemical behavior. We also investigated the electrochemical properties of these materials in 1 M KOH electrolyte and a similar tendency in the CV and GCD plots was observed (Fig. S12–S14, ESI†). For the preparation of supercapacitor electrode with high loadings, the ink was obtained by ultra-sonicating 5 wt% Nafion and HI-RGO/CDs in IPA to prepare 15 mg mL−1 slurry. Subsequently, the resulting suspension was dropped on a nickel foam (0.5 cm × 0.5 cm) with the total mass of 2 mg or an areal mass loading of 8 mg cm−2, followed by drying in air. The electrochemical tests were conducted in a potential window between −0.1 and 0.9 V (vs. Ag/AgCl) in 1 M Na2SO4. The electrode still delivers specific capacitances of 434 F g−1 at 2 mV s−1 and 436 F g−1 at 0.2 A g−1, respectively (Fig. S15†). Note that the reduced rate capability is assigned to the restacked graphene at a high loading which triggers low electrochemical performance at high rates.10 The performance of HI-RGO/CD hybrid is comparable to recently reported doped graphene based supercapacitors (Table S1, ESI†).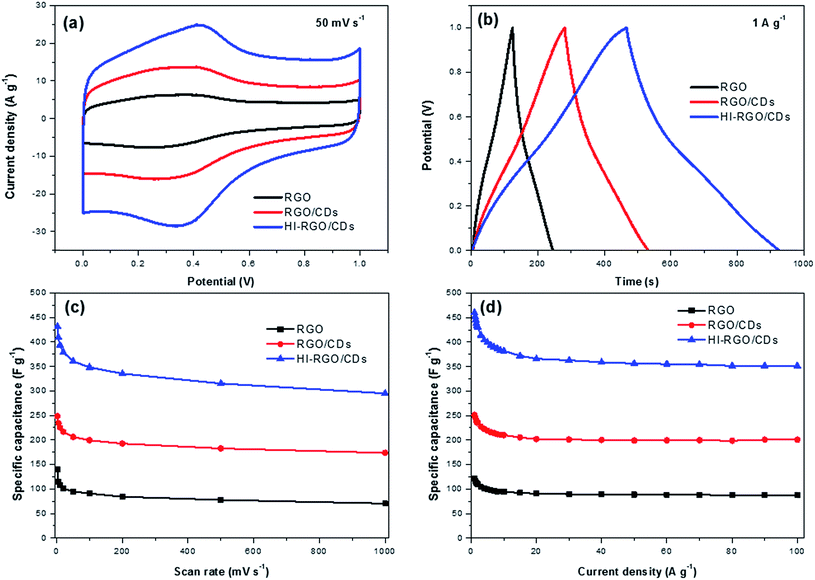 | ||
| Fig. 6 (a) CV curves at 50 mV s−1 in 1 M H2SO4; (b) GCD curves at 1 A g−1 of three samples in 1 M H2SO4; specific capacitances estimated from (c) CV and (d) GCD curves. | ||
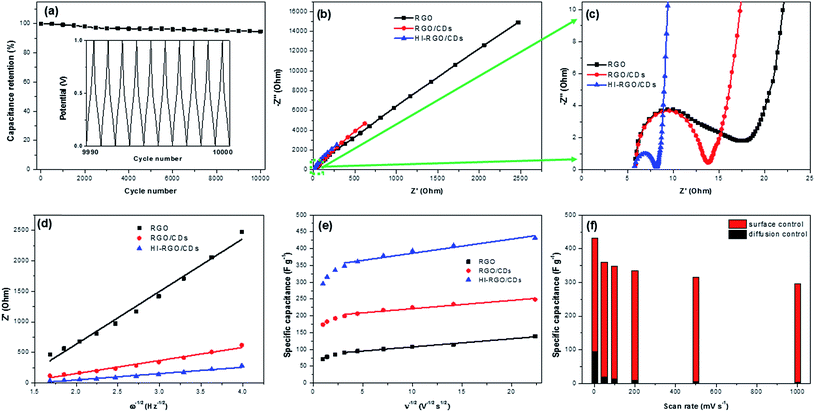
Following that, the HI-RGO/CD hybrid was subjected to galvanostatic charge/discharge cycles at a current density of 10 A g−1 (Fig. 7a). After 10![[thin space (1/6-em)]](https://www.rsc.org/images/entities/char_2009.gif) 000 GCD cycles, the hybrid maintains 94.6% its initial capacitance, demonstrating a superior durability of the HI-RGO/CDs. SEM and EDX were employed to characterize the HI-RGO/CD after 10
000 GCD cycles, the hybrid maintains 94.6% its initial capacitance, demonstrating a superior durability of the HI-RGO/CDs. SEM and EDX were employed to characterize the HI-RGO/CD after 10![[thin space (1/6-em)]](https://www.rsc.org/images/entities/char_2009.gif) 000 GCD cycles. Insignificant changes in the morphology with C, O and I distributing uniformly (Fig. S16, ESI†) indicates excellent preservation in the structure and morphology of the HI-RGO/CD electrode.
000 GCD cycles. Insignificant changes in the morphology with C, O and I distributing uniformly (Fig. S16, ESI†) indicates excellent preservation in the structure and morphology of the HI-RGO/CD electrode.
EIS characteristics was used to elucidate the impact of CD addition and HI acid treatment on the electrochemical performance of the material. The Nyquist plots of three samples are presented in Fig. 7b and c. The real axis intercept at the high frequency region indicates the solution resistance (Rs) while the diameter of the semicircle at middle frequency region yields charge transfer resistance (Rct) at the electrode/electrolyte interface.18,25 Minimal changes were observed in Rs (∼5.8 Ω) and time constant τo (inverse of frequency at 45° in Bode phase plots) (Fig. S17, ESI†) of the three investigated samples. The values were in the range of 0.10–0.26 s, implying their similar internal resistance and wettability.43,44 The Rct values (Table 2) strongly support the aforementioned results. RGO has a higher Rct of 13.8 Ω compared to RGO/CD electrode, which is due to aggregated/stacked graphene layers in RGO, inducing its poor conductivity.9,10,43 Charge transfer resistance of HI-RGO/CD sample is lower than that of RGO/CD, indicating that HI deoxygenation is conducive to the ionic conductivity at the electrolyte/electrode interphase.
| RGO | RGO/CDs | HI-RGO/CDs | |
|---|---|---|---|
| R ct (Ω) | 13.8 | 7.9 | 2.3 |
| σ w (Ω s−1/2) | 861.6 | 213.8 | 103.7 |
| D H+ (×10−18 cm2 s−1) | 1.2 | 20.1 | 85.5 |
The H+ diffusion coefficients (DH+) of the electrodes were calculated by:
| DH+ = 1/2[RT/Sn2F2Cσw]2 | (7) |
The diffusion coefficients were estimated from the slope of the diagram between Re(Z) and ω−1/2 (Fig. 7d), and summarized in Table 2. A continuous increase in the proton diffusion coefficient from 1.2 × 10⁻¹⁸ cm2 s−1 for RGO to the peak of 85.5 × 10⁻¹⁸ cm2 s−1 for HI-RGO/CDs demonstrates that CDs and I-doping are conducive to fast diffusing electrolyte ions to the electrode, which results in excellent capacitance retention for RGO/CD and HI-RGO/CD samples compared to RGO. Similarly, the DH+ value of HI-RGO is 12.6 × 10⁻¹⁸ cm2 s−1, exceeding that of pure RGO (Table S2, ESI†). The diffusion coefficients are in accordance with the aforementioned electrochemical results, revealing that the enhanced electrochemical characteristics of the HI-RGO/CD hybrid are due to the quick ionic diffusion to the surface of the material.
To explore the mechanism of charge storage in the hybrids, their corresponding CV sweep curves were analyzed to quantitatively differentiate the contribution of surface-controlled and pseudo-capacitive reactions (Fig. S9, ESI†) as follows:14,25,46
 | (8) |
 is the capacitive contribution,
  is the pseudo-capacitive contribution and ν is the scan rate.
The surface-controlled contribution and pseudo-capacity are computed from the slopes of the diagrams between the gravimetric capacitance and ν−1/2 (Fig. 7e), and the results are presented in Table S3.† Both surface-controlled and diffusion-controlled contributions increase from RGO to those for RGO/CDs and HI-RGO/CDs. The surface capacitance of HI-RGO/CDs which accounts for 78.1% of the total capacitance at 2 mV s−1 increases to 98.6% at 1000 mV s−1 (Fig. 7f), indicating a surface-dominant process.
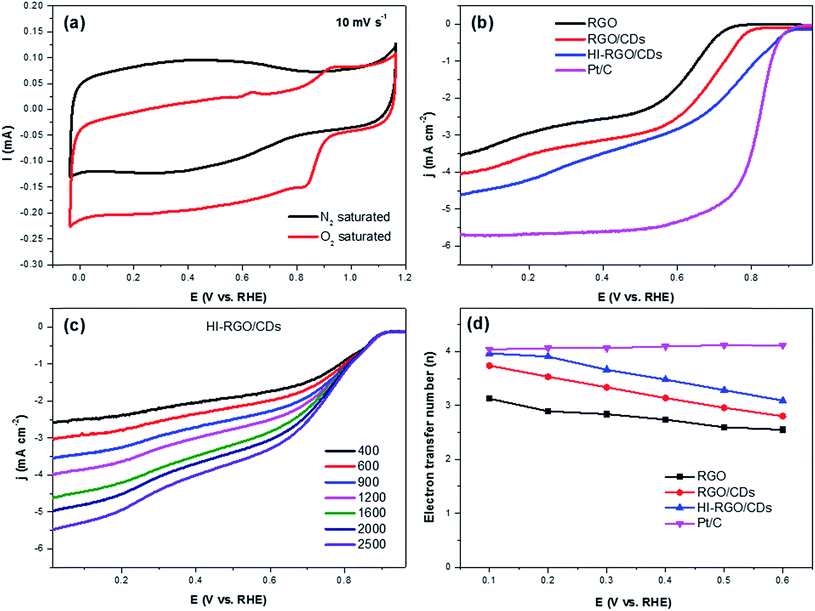
The ORR electrocatalytic activity of the samples was investigated in a 0.1 M KOH electrolyte. The CV curves of HI-RGO/CDs in Fig. 8a show an obvious peak at 0.84 V vs. RHE in the O2-saturated 0.1 M KOH electrolyte whereas no peak is observed in N2-saturated KOH solution, demonstrating its ORR catalytic activity. Next, LSVs curves recorded at an electrode rotation rate of 1600 rpm and a scan rate of 10 mV s−1 in O2-saturated media to evaluate the effect of CD and I doping on ORR activities with the reference Pt/C electrocatalyst (Fig. 8b). The onset potential and the half-wave potentials increase from 0.80 and 0.65 V (RGO) to 0.85 and 0.69 V (RGO/CDs) and 0.93 and 0.77 V (HI-RGO/CDs), respectively. Moreover, the diffusion-limited current density (jL) of HI-RGO/CD hybrid is 4.62 mA cm−2, which is superior to those for RGO (3.53 mA cm−2) and RGO/CDs (4.04 mA cm−2). Thus, the ORR activity of the HI-RGO/CD composite is close to that of the benchmark Pt/C (onset potential and jL of 0.95 V and 5.69 mA cm−2, respectively).
The ORR kinetics of the materials were further investigated via its LSV curves at various rotation rates ranging between 400 and 2500 rpm. Fig. 8c and S18 (ESI†) show that the jL values significantly increase with a rise in rotation frequency because of a reduced diffusion length of O2 diffusion to the catalyst surface.47,48 The electron transferred number per O2 involved in ORR was determined by Koutecky–Levich (K–L) equations:47,48
 | (9) |
| B = 0.2nFC0D02/3ν−1/6 | (10) |
![[thin space (1/6-em)]](https://www.rsc.org/images/entities/char_2009.gif) 485 C mol−1), C0 is the oxygen bulk concentration (1.2 × 10⁻³ mol L−1), D0 is the oxygen diffusion coefficient in 0.1 M KOH electrolyte (1.9 × 10⁻⁵ cm2 s−1), and υ is the electrolyte kinematic viscosity (0.01 cm2 s−1).
485 C mol−1), C0 is the oxygen bulk concentration (1.2 × 10⁻³ mol L−1), D0 is the oxygen diffusion coefficient in 0.1 M KOH electrolyte (1.9 × 10⁻⁵ cm2 s−1), and υ is the electrolyte kinematic viscosity (0.01 cm2 s−1).
After calculating the slopes of the K–L plots of various electrodes at potential of 0.1–0.6 V vs. RHE (Fig. S19, ESI†), we computed the electron transferred number n and the results are plotted in Fig. 8d. The average numbers of electron transfer (n) for RGO and RGO/CDs are calculated to be 2.79 and 3.25, respectively while the n value for HI-RGO/CDs is 3.57, which is close to 4.08 of the commercial Pt/C, suggesting that the HI-RGO/CDs enable a near four-electron pathway. Moreover, the calculated jk value of HI-RGO/CDs is 19.8 mA cm−2 at 0.1 V vs. RHE, larger than those of RGO (12.4 mA cm−2) and RGO/CDs (12.0 mA cm−2). The superior ORR activity of HI-RGO/CDs may be ascribed to the enhanced oxygen adsorption caused by I-doping28 and synergistic effect between 3D RGO network and well-dispersed CDs. The improved electrocatalytic activity due to I doping is further substantiated in HI-RGO (Fig. S20, ESI†), which exhibits an onset potential of 0.83 V, a half-wave potential of 0.68 V, jL and jk values of 3.54 and 10.6 mA cm−2, respectively with an average n of 3.05. However, the ORR activity of HI-RGO is far lower than that of HI-RGO/CDs, indicating the significance of the combination of CDs with RGO for the improved ORR catalytic performance. The ORR activity of the HI-RGO/CDs is comparable to that for the recently reported metal-free carbon based ORR electrocatalysts (Table S4, ESI†).
The rotating ring-disk electrode (RRDE) test was conducted with a Pt ring surrounded by a 5.5 mm diameter glassy carbon electrode. The Pt ring electrode was set at 1.3 V (vs. RHE) to detect the generated H2O2. The number of electron transfer (n) was calculated by:
 | (11) |
The H2O2 yield was calculated as follows:
 | (12) |
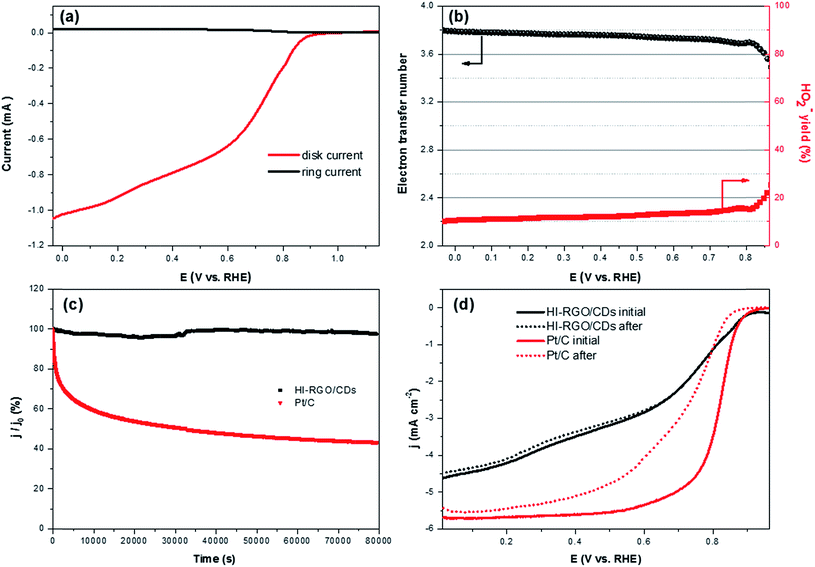
The decent ORR electrocatalytic activity of HI-RGO/CDs catalyst is further highlighted by the RRDE test, which indicated close to four electron transfer number (3.56–3.80) and low H2O2 yield (10.6–20.0%) at 0.0–0.86 V (vs. RHE) potential range (Fig. 9a and b). These results are in agreement with the values obtained from the K–L plots. We further enhanced the ORR stability of catalysts by their crossover tolerance to methanol. Fig. S21 (ESI†) shows that HI-RGO/CDs exhibits an improved crossover tolerance to methanol than the benchmark Pt/C electrode.
The durability of responses from HI-RGO/CDs and the benchmark Pt/C were assessed by chronoamperometric measurements at 0.65 V vs. RHE at 1600 rpm for 22 h in O2-saturated 0.1 KOH. Fig. 9c illustrates that the current density of commercial Pt/C drops to ∼43.4% whereas HI-RGO/CDs demonstrate outstanding stability with current density retention of 97.7%, indicating its superior durability under electrochemical stress (0.65 V vs. RHE). After the ORR durability test, the LSV polarization of HI-RGO/CDs remains almost unchanged while the Pt/C reveals a downshift of 50 and 100 mV in onset potential and the value of E1/2, respectively (Fig. 9d), suggesting the excellent relative durability of HI-RGO/CDs. Furthermore, the HI-RGO/CDs after 22 h treatment was also characterized by SEM and EDX. Minor change is observed in the catalyst morphology with C, O and I distributing uniformly in the hybrid (Fig. S22, ESI†), demonstrating excellent preservation in the structure and morphology of the HI-RGO/CD electrode.
To explore the possible role of CD and I-doping on the ORR catalytic behavior of the materials, we measured the ECSA of the catalysts from their electrical double layer capacitance (Cdl), recorded in the non-faradaic range of −0.1 to 0 V (vs. Ag/AgCl) at various scan rates from 5 to 100 mV s−1 (Fig. S23a–d, ESI†). After normalized by carbon's specific capacitance, the ECSA results are depicted in Fig. S23e,† which agree well with the ORR catalytic activities. The RGO/CD hybrid has an ECSA of 345 cm2 g−1, higher than that of RGO (130 cm2 g−1), which is due to the larger BET surface area of RGO/CDs. Besides, HI acid treatment of RGO/CDs remarkably increases ECSA to 726 cm2 g−1 (HI-RGO/CDs), which may be ascribed to the increased active sites caused by I-doping. Thus, we note that the difference in ORR activity of the materials is related to the alterations in their ECSA.
4. Conclusions
A sustainable and low-cost route to fabricate eggplant-derived CDs was developed by adopting eggplant biomass as a naturally low-cost C precursor. The as-synthesized CDs were decorated on GO to synthesize a RGO/CD composite via a hydrothermal treatment, followed by facile deoxygenation in HI acid vapor. In particular, CDs act as intercalators to reduce graphene restacking/aggregation effectively, resulting in higher surface area and total pore volume. The HI treatment significantly affects both ionic conductivity and active sites for pseudocapacitance generated from O/I functional groups, charge transfer resistance and ion migration, which alter the electrochemical properties of the RGO/CD composite. Our I-doped graphene/CD hybrid exhibited maximum specific capacitances of 432 and 460 F g−1 at 2 mV s−1 and 1 A g−1 with excellent capacitance retention of 68.4 and 76.5%, as the scan rate and current density increased from 2 to 1000 mV s−1 and from 1 to 100 A g−1, respectively. The hybrid also delivered superior cycling stability with 94.6% capacitance retention over 10![[thin space (1/6-em)]](https://www.rsc.org/images/entities/char_2009.gif) 000 cycles at 10 A g−1. In addition, the same material was employed as a catalyst for ORR in 0.1 M KOH electrolyte, which demonstrated an onset potential of 0.93 V vs. RHE and a kinetic limiting current density of 19.8 mA cm−2 at 0.1 V vs. RHE with an average electron transfer number of 3.57. The I-doped graphene/CD composite shows excellent ORR stability with current density retention of 97.7% under the electrochemical stress (0.65 V vs. RHE) in comparison with 43.4% obtained for the benchmark Pt/C under the same conditions. Thus, a low-cost sustainable electrode material was developed, based on agricultural waste material for both supercapacitor and ORR applications.
000 cycles at 10 A g−1. In addition, the same material was employed as a catalyst for ORR in 0.1 M KOH electrolyte, which demonstrated an onset potential of 0.93 V vs. RHE and a kinetic limiting current density of 19.8 mA cm−2 at 0.1 V vs. RHE with an average electron transfer number of 3.57. The I-doped graphene/CD composite shows excellent ORR stability with current density retention of 97.7% under the electrochemical stress (0.65 V vs. RHE) in comparison with 43.4% obtained for the benchmark Pt/C under the same conditions. Thus, a low-cost sustainable electrode material was developed, based on agricultural waste material for both supercapacitor and ORR applications.
Conflicts of interest
There are no conflicts of interest to declare.Acknowledgements
V. C. Hoang is grateful to the University of Sydney for an International Postgraduate Research Scholarship. We also wish to acknowledge the experimental assistance from Dr Shengli Zhai at Nanyang Technological University, Singapore, Dr Xuncai Chen and Mr Long H. Nguyen at The University of Sydney and the ACMM (Australian Centre for Microscopy and Microanalysis) for access to instruments for morphological measurements and Sydney Analytical, the University of Sydney.References
- D. P. Dubal, O. Ayyad, V. Ruiz and P. Gomez-Romero, Chem. Soc. Rev., 2015, 44, 1777–1790 RSC.
- S. Chu and A. Majumdar, Nature, 2012, 488, 294 CrossRef CAS PubMed.
- V. C. Hoang, K. Dave and V. G. Gomes, Nano Energy, 2019, 66, 104093 CrossRef CAS.
- A. S. Aricò, P. Bruce, B. Scrosati, J.-M. Tarascon and W. van Schalkwijk, Nat. Mater., 2005, 4, 366 CrossRef PubMed.
- M. Shao, Q. Chang, J.-P. Dodelet and R. Chenitz, Chem. Rev., 2016, 116, 3594–3657 CrossRef CAS PubMed.
- Y. Zhai, Y. Dou, D. Zhao, P. F. Fulvio, R. T. Mayes and S. Dai, Adv. Mater., 2011, 23, 4828–4850 CrossRef CAS PubMed.
- J. Zhang, Z. Zhao, Z. Xia and L. Dai, Nat. Nanotechnol., 2015, 10, 444 CrossRef CAS PubMed.
- M. Borghei, J. Lehtonen, L. Liu and O. J. Rojas, Adv. Mater., 2018, 30, 1703691 CrossRef PubMed.
- M. F. El-Kady, Y. Shao and R. B. Kaner, Nat. Rev. Mater., 2016, 1, 16033 CrossRef CAS.
- D. Yu, K. Goh, H. Wang, L. Wei, W. Jiang, Q. Zhang, L. Dai and Y. Chen, Nat. Nanotechnol., 2014, 9, 555–562 CrossRef CAS PubMed.
- D. Li, M. B. Müller, S. Gilje, R. B. Kaner and G. G. Wallace, Nat. Nanotechnol., 2008, 3, 101 CrossRef CAS PubMed.
- J. Yan, H. Meng, F. Xie, X. Yuan, W. Yu, W. Lin, W. Ouyang and D. Yuan, J. Power Sources, 2014, 245, 772–778 CrossRef CAS.
- V. Vij, S. Sultan, A. M. Harzandi, A. Meena, J. N. Tiwari, W.-G. Lee, T. Yoon and K. S. Kim, ACS Catal., 2017, 7, 7196–7225 CrossRef CAS.
- V. C. Hoang, L. H. Nguyen and V. G. Gomes, J. Electroanal. Chem., 2019, 832, 87–96 CrossRef CAS.
- W.-W. Liu, Y.-Q. Feng, X.-B. Yan, J.-T. Chen and Q.-J. Xue, Adv. Funct. Mater., 2013, 23, 4111–4122 CrossRef CAS.
- W. Li, Y. Liu, M. Wu, X. Feng, S. A. T. Redfern, Y. Shang, X. Yong, T. Feng, K. Wu, Z. Liu, B. Li, Z. Chen, J. S. Tse, S. Lu and B. Yang, Adv. Mater., 2018, 30, e1800676 CrossRef PubMed.
- A.-M. Alam, B.-Y. Park, Z. K. Ghouri, M. Park and H.-Y. Kim, Green Chem., 2015, 17, 3791–3797 RSC.
- A. K. Samantara, S. Chandra Sahu, A. Ghosh and B. K. Jena, J. Mater. Chem. A, 2015, 3, 16961–16970 RSC.
- X. Zhao, M. Li, H. Dong, Y. Liu, H. Hu, Y. Cai, Y. Liang, Y. Xiao and M. Zheng, ChemSusChem, 2017, 10, 2626–2634 CrossRef CAS PubMed.
- Q. Li, H. Cheng, X. Wu, C.-F. Wang, G. Wu and S. Chen, J. Mater. Chem. A, 2018, 6, 14112–14119 RSC.
- H. Fei, R. Ye, G. Ye, Y. Gong, Z. Peng, X. Fan, E. L. G. Samuel, P. M. Ajayan and J. M. Tour, ACS Nano, 2014, 8, 10837–10843 CrossRef CAS PubMed.
- H. Jin, H. Huang, Y. He, X. Feng, S. Wang, L. Dai and J. Wang, J. Am. Chem. Soc., 2015, 137, 7588–7591 CrossRef CAS PubMed.
- S. Pei and H.-M. Cheng, Carbon, 2012, 50, 3210–3228 CrossRef CAS.
- I. K. Moon, J. Lee, R. S. Ruoff and H. Lee, Nat. Commun., 2010, 1, 73 CrossRef PubMed.
- V. C. Hoang and V. G. Gomes, Materials Today Energy, 2019, 12, 198–207 CrossRef.
- H. Liu, H. Wang and X. Zhang, Adv. Mater., 2015, 27, 249–254 CrossRef CAS PubMed.
- I.-Y. Jeon, H.-J. Choi, M. Choi, J.-M. Seo, S.-M. Jung, M.-J. Kim, S. Zhang, L. Zhang, Z. Xia, L. Dai, N. Park and J.-B. Baek, Sci. Rep., 2013, 3, 1810 CrossRef PubMed.
- Z. Yao, H. Nie, Z. Yang, X. Zhou, Z. Liu and S. Huang, Chem. Commun., 2012, 48, 1027–1029 RSC.
- B. Li, D. Geng, X. S. Lee, X. Ge, J. Chai, Z. Wang, J. Zhang, Z. Liu, T. S. A. Hor and Y. Zong, Chem. Commun., 2015, 51, 8841–8844 RSC.
- S. Zhu, Y. Song, X. Zhao, J. Shao, J. Zhang and B. Yang, Nano Res., 2015, 8, 355–381 CrossRef CAS.
- D. Qu, M. Zheng, J. Li, Z. Xie and Z. Sun, Light: Sci. Appl., 2015, 4, e364 CrossRef CAS.
- P. Dengyu, Z. Jingchun, L. Zhen and W. Minghong, Adv. Mater., 2010, 22, 734–738 CrossRef PubMed.
- L. Fei, J. Min-Ho, H. H. Dong, K. Je-Hyung, C. Yong-Hoon and S. T. Seok, Adv. Mater., 2013, 25, 3657–3662 CrossRef PubMed.
- F. Yuan, S. Li, Z. Fan, X. Meng, L. Fan and S. Yang, Nano Today, 2016, 11, 565–586 CrossRef CAS.
- M. Konieczny and R. G. Harvey, J. Org. Chem., 1979, 44, 4813–4816 CrossRef CAS.
- J. Zhang and L. Dai, ACS Catal., 2015, 5, 7244–7253 CrossRef CAS.
- S. Pei, J. Zhao, J. Du, W. Ren and H.-M. Cheng, Carbon, 2010, 48, 4466–4474 CrossRef CAS.
- G. Lota, K. Fic and E. Frackowiak, Electrochem. Commun., 2011, 13, 38–41 CrossRef CAS.
- Y. Xu, K. Sheng, C. Li and G. Shi, ACS Nano, 2010, 4, 4324–4330 CrossRef CAS PubMed.
- K. Goh, W. Jiang, H. E. Karahan, S. Zhai, L. Wei, D. Yu, A. G. Fane, R. Wang and Y. Chen, Adv. Funct. Mater., 2015, 25, 7348–7359 CrossRef CAS.
- Y. Hernandez, V. Nicolosi, M. Lotya, F. M. Blighe, Z. Sun, S. De, I. T. McGovern, B. Holland, M. Byrne, Y. K. Gun'Ko, J. J. Boland, P. Niraj, G. Duesberg, S. Krishnamurthy, R. Goodhue, J. Hutchison, V. Scardaci, A. C. Ferrari and J. N. Coleman, Nat. Nanotechnol., 2008, 3, 563 CrossRef CAS PubMed.
- V. C. Hoang, M. Hassan and V. G. Gomes, Applied Materials Today, 2018, 12, 342–358 CrossRef.
- X. Yang, C. Cheng, Y. Wang, L. Qiu and D. Li, Science, 2013, 341, 534–537 CrossRef CAS PubMed.
- S. Zhang and N. Pan, Adv. Energy Mater., 2015, 5, 1401401 CrossRef.
- V. C. Hoang, V. Do, I. W. Nah, C. Lee, W. I. Cho and I. H. Oh, Electrochim. Acta, 2016, 210, 1–6 CrossRef CAS.
- L. Jilei, W. Jin, X. Chaohe, J. Hao, L. Chunzhong, Z. Lili, L. Jianyi and S. Z. Xiang, Adv. Sci., 2018, 5, 1700322 CrossRef PubMed.
- R. Li, Z. Wei and X. Gou, ACS Catal., 2015, 5, 4133–4142 CrossRef CAS.
- V. C. Hoang, V. G. Gomes and K. N. Dinh, Electrochim. Acta, 2019, 314, 49–60 CrossRef CAS.
Footnote |
| † Electronic supplementary information (ESI) available. See DOI: 10.1039/c9ta05559b |
| This journal is © The Royal Society of Chemistry 2019 |

