 Open Access Article
A self-template synthesis of porous ZnCo2O4 microspheres for high-performance quasi-solid-state asymmetric supercapacitors†
Yansong Gai,
Yuanyuan Shang,
Liangyu Gong *,
Linghao Su,
Long Hao,
Fengying Dong and
Jianzhong Li
College of Chemistry and Pharmaceutical Sciences, Qingdao Agricultural University, Qingdao 266109, PR China. E-mail: lygong@163.com
First published on 4th January 2017
Abstract
A facile self-template solvothermal method was developed to fabricate a microsphere precursor, which was followed by annealing in air to give ZnCo2O4 microspheres. The ZnCo2O4 microspheres possess irregular diameters from 600 nm to 1.2 μm and a high specific surface area of 34.60 m2 g−1 with an average pore diameter of 6.96 nm. Each ZnCo2O4 microsphere was found to be constructed by many intertwined nanoparticles. When investigated as electrode materials for supercapacitors, the ZnCo2O4 microspheres exhibited a high specific capacitance of 542.5 F g−1 at 1 A g−1, excellent rate capability of 55.3% retention at 10 A g−1, and good cycling stability with 95.5% retention of the maximum capacitance (440 F g−1) after 2000 cycles at 2 A g−1. Additionally, a quasi-solid-state asymmetric supercapacitor fabricated with the as-prepared ZnCo2O4 microspheres was used as the positive electrode and activated carbon as the negative electrode. The asymmetric device exhibited a remarkable cycling stability with 76.68% retention of the maximum capacitance (68.93 F g−1) after 1000 cycles at 0.5 A g−1. Moreover, two asymmetric devices connected in a series can successfully light up a red light-emitting-diode (LED) and last for more than 15 min. Therefore, this fascinating electrochemical performance demonstrates that the ZnCo2O4 microspheres have potential applications in supercapacitors.
Introduction
With rapid social development and improvement in human lifestyle, the demands for renewable and sustainable energy have continued to increase. To fulfill these energy requirements, significant attention has been given to energy storage devices.1,2 Supercapacitors, an alternative to batteries and traditional electrostatic capacitors, are considered as one of the most promising and reliable devices in the field of energy storage due to their fast recharge ability, high power performance, long lifespan, low maintenance cost, and environmental friendliness.3–5 These advantages are crucial for their applications in systems, such as hybrid electric vehicles, high power portable electronics, and backup energy systems, that require a quick release of energy.6 Based on the underlying energy storage mechanism, supercapacitors can be classified into electrical double layer capacitors (EDLCs) and pseudocapacitors.7–9 EDLCs store energy via the accumulation of electrostatic charge at the surface of carbonaceous materials, whereas pseudocapacitors utilize fast and reversible surface or near-surface reactions for charge storage.10–12 Compared to EDLCs, pseudocapacitors can provide substantially higher capacitance and energy density due to their multiple oxidation states.13 Therefore, numerous efforts have been dedicated to develop pseudocapacitance materials, including metal oxides, hydroxides and sulphides, in the past few years.14–19Transition metal oxides are emerging as the most promising electrode materials for pseudocapacitors due to their excellent intrinsic properties, such as high theoretical specific capacitance, low cost, and environmentally friendly nature. Typical transition metal oxides, such as NiO, ZnO, MnO2, Co3O4, Fe2O3, and TiO2 have been extensively studied as pseudocapacitive electrode materials.15,20–24 However, poor intrinsic electrical conductivity, slow ion diffusion rates and poor electrochemical stability of these materials restrict their widespread applications as high-performance supercapacitor electrodes.25 To address this issue and improve the electrochemical performance, mixed transition metal oxides, such as NiCo2O4,26 CuCo2O4,27 NiMoO4,28 CoMoO4,11 and CoMn2O4,29 have drawn increasing attention for new type of pseudocapacitive materials with outstanding performance due to their many unique properties, which originate from the coexistence of two different cations in a single crystal structure. Compared to single metal oxides, mixed transition metal oxides exhibit high theoretical capacitance, good electronic conductivity, and rich redox reactions due to their multiple oxidation states, which are beneficial for a significant enhancement in the electrochemical performance when used as pseudocapacitive materials.12,30,31 ZnCo2O4 is a typical mixed transition metal oxide with cubic spinel structure. The bivalent Zn ions occupy one eighth of the tetrahedral sites in the cubic spinel structure, and the trivalent Co ions occupy one half of the octahedral sites in the face-centered cubic oxygen lattice.2,32 To date, various types of ZnCo2O4 nanostructures, such as nanowires,2 nanoflowers,33 nanorods,34 and microspheres,35,36 have been prepared. Because of their large specific surface area and uniform pore size distribution, mesoporous microspheres are still under the focus of recent research as potential and appealing electrode materials to prepare high-performance supercapacitors. Mesoporous microspheres can largely increase the amount of electroactive sites and provide extra free space to effectively alleviate the structural strain that occurs during the charge–discharge process, which is beneficial for a significant enhancement in the electrochemical performance in terms of high reversible capacity and outstanding cyclability.35,37
Herein, we present a two-step facile strategy involving a hydrothermal method and subsequent thermal annealing treatment to fabricate ZnCo2O4 microspheres. The obtained ZnCo2O4 microspheres exhibit a high specific surface area and good electronic conductivity. When evaluated as electrode materials for supercapacitors, the ZnCo2O4 microspheres show a high specific capacity of 542.5 F g−1 at 1 A g−1, as well as good cycle stability. Furthermore, a quasi-solid-state asymmetric supercapacitor was fabricated with the as-prepared ZnCo2O4 microspheres as the positive electrode and activated carbon as the negative electrode. Two asymmetric devices connected in a series can successfully light up a red light-emitting-diode (LED), which lasts for more than 15 min. These results show that the ZnCo2O4 microspheres have great potential for applications in high-performance energy storage devices.
Experimental
Synthesis of ZnCo2O4 microspheres
All chemical reagents were of analytical purity and were used without further purification. In a typical procedure, 1 mmol of Co(Ac)2·4H2O, 0.5 mmol of Zn(Ac)2·4H2O, and 12 mL of diethylene glycol (DEG) were dissolved in a 60 mL of isopropanol. Then, the solution was transferred to a Teflon-lined stainless steel autoclave and heated at 200 °C for 10 h. After naturally cooling down to room temperature, the resulting precipitates were collected by centrifugation, washed several times with absolute ethanol and dried at 80 °C in an oven. To obtain different interior structures of the ZnCo2O4 microspheres, the precipitates were calcined at 450 °C for 2 h at various ramp rates.Characterization
The crystallographic structures of the samples were examined by X-ray diffraction (XRD, Cu Kα radiation, λ = 1.5406 Å) using a Bruker D8 advanced X-ray Diffractometer. The morphology and intrinsic structure were examined using scanning electron microscopy (SEM, JEOL 7500F) and transmission electron microscope (TEM, JEOL-2010). The nitrogen adsorption/desorption isotherms were characterized at 77 K on a Quantachrome NOVA2200e analyzer. The specific surface area was calculated using the Brunauer–Emmett–Teller (BET) method, whereas the pore size distribution was calculated from the adsorption branch isotherms using the Barrette–Joyner–Halenda (BJH) method.Electrochemical measurements
The working electrode was fabricated by compressing a mixture of active material, conductive material (acetylene black), and binder (polytetrafluoroethylene (PTFE)) in a weight ratio of ZnCo2O4/acetylene black/PTFE of 8![[thin space (1/6-em)]](https://www.rsc.org/images/entities/char_2009.gif) :
:![[thin space (1/6-em)]](https://www.rsc.org/images/entities/char_2009.gif) 1
1![[thin space (1/6-em)]](https://www.rsc.org/images/entities/char_2009.gif) :
:![[thin space (1/6-em)]](https://www.rsc.org/images/entities/char_2009.gif) 1 onto a nickel foam current collector. Electrochemical measurements were conducted using a three-electrode system in 6 mol L−1 KOH at room temperature, where a platinum plate and a saturated calomel electrode (SCE) were used as the counter and reference electrodes, respectively. Cyclic voltammetry (CV) and electrochemical impedance spectroscopy (EIS) measurements were performed using a CHI660D electrochemical workstation (Chenhua, Shanghai, China). Galvanostatic charge–discharge (GCD) tests were evaluated using a Land CT2001A battery program control test system (LAND, Wuhan, China).
1 onto a nickel foam current collector. Electrochemical measurements were conducted using a three-electrode system in 6 mol L−1 KOH at room temperature, where a platinum plate and a saturated calomel electrode (SCE) were used as the counter and reference electrodes, respectively. Cyclic voltammetry (CV) and electrochemical impedance spectroscopy (EIS) measurements were performed using a CHI660D electrochemical workstation (Chenhua, Shanghai, China). Galvanostatic charge–discharge (GCD) tests were evaluated using a Land CT2001A battery program control test system (LAND, Wuhan, China).
Assembly of the ZnCo2O4//ACs quasi-solid-state asymmetrical supercapacitor
A solid-state asymmetric capacitor was assembled using the as-prepared ZnCo2O4 electrode as the positive electrode, active carbon (AC) as the negative electrode with a separator and PVA/KOH gel as a solid electrolyte. The negative electrode was prepared by mixing active carbon and PTFE in a mass ratio of 9![[thin space (1/6-em)]](https://www.rsc.org/images/entities/char_2009.gif) :
:![[thin space (1/6-em)]](https://www.rsc.org/images/entities/char_2009.gif) 1. The PVA/KOH gel electrolyte was prepared by mixing 5.6 g KOH and 6 g PVA in 60 mL of deionized water, which was then heated at 85 °C with stirring until the solution became clear. Two pieces of the electrode and the separator (cellulose PP/PE) were immersed in the gel for 5 min, and then taken out and assembled together. After solidification at room temperature, the asymmetrical capacitor was obtained. The related calculation involved is given in the ESI.†
1. The PVA/KOH gel electrolyte was prepared by mixing 5.6 g KOH and 6 g PVA in 60 mL of deionized water, which was then heated at 85 °C with stirring until the solution became clear. Two pieces of the electrode and the separator (cellulose PP/PE) were immersed in the gel for 5 min, and then taken out and assembled together. After solidification at room temperature, the asymmetrical capacitor was obtained. The related calculation involved is given in the ESI.†
Results and discussion
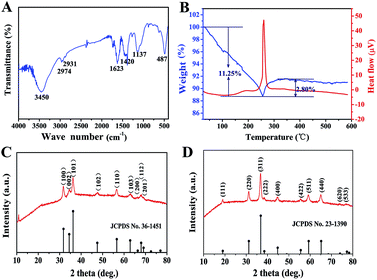
As an important intermediate for porous ZnCo2O4, ZnCo-precursor was characterized by FT-IR spectroscopy and XRD. As shown in Fig. 1A, the IR spectrum of the precursor shows a strong broad peak at 3450 cm−1 due to the stretching vibration of OH. The weak peaks at 2974 and 2931 cm−1 are ascribed to the stretching vibration of the C–H group. The peaks at around 1623 and 1137 cm−1 are attributed to the vibration of C–O and C–O–C groups, respectively, whereas the broad peak at 1420 cm−1 could be ascribed to the interlayer acetate (CH3COO−). In addition, the peak at 487 cm−1 could be attributed to the vibration of the M–O group (M![[thin space (1/6-em)]](https://www.rsc.org/images/entities/char_2009.gif) :
:![[thin space (1/6-em)]](https://www.rsc.org/images/entities/char_2009.gif) Zn or Co).38 Fig. 1C shows the XRD pattern of the ZnCo-precursor, and the diffraction peaks are consistent with the ZnO phase (JPCDS card no. 36-1451). In addition, an obvious diffraction peak at approximately 12° can be observed, which is characteristic of metal glycolates or alkoxide derivatives.39 Combining the FT-IR spectroscopy results, ZnCo-precursor is proposed as a mixture of ZnO and M–O–CH2–CH2–O–CH2–CH2–O–M (M: Co, Zn or H).
Zn or Co).38 Fig. 1C shows the XRD pattern of the ZnCo-precursor, and the diffraction peaks are consistent with the ZnO phase (JPCDS card no. 36-1451). In addition, an obvious diffraction peak at approximately 12° can be observed, which is characteristic of metal glycolates or alkoxide derivatives.39 Combining the FT-IR spectroscopy results, ZnCo-precursor is proposed as a mixture of ZnO and M–O–CH2–CH2–O–CH2–CH2–O–M (M: Co, Zn or H).
 | ||
| Fig. 1 (A) The FT-IR spectrum of the ZnCo-precursor. (B) The TG and DTA curves obtained for the ZnCo-precursor. (C) The XRD pattern of the ZnCo-precursor. (D) The XRD pattern of ZnCo2O4. | ||
To understand the calcination process of the as-prepared ZnCo-precursor, DTA-TG analysis was performed and the result is shown in Fig. 1B. The continuous weight loss of ca. 11.25% at temperature ranging from room temperature to 256 °C may be attributed to the dehydration and decomposition of the organic species in the ZnCo-precursor. Then, the weight exhibited a rebound of ca. 2.80% around 256–350 °C and a highly exothermic peak appeared at 260 °C.38 This phenomenon can be attributed to the combustion of organic species in the ZnCo-precursor. Moreover, the ZnCo-precursor was converted to ZnCo2O4. The slight weight loss occurred around 350–450 °C was attributed to the continuous combustion of the organic residues. There was almost no quality loss after 450 °C; thus, we selected the temperature of 450 °C for the calcination of the ZnCo-precursor to ensure its complete decomposition. The ZnCo2O4 products were studied by XRD analysis to identify its purity and crystallographic structure. As shown in Fig. 2D, all the diffraction peaks after calcination can be unambiguously assigned to cubic ZnCo2O4 (JCPDS card no. 23-1390) and no other phases or impurities were detected, indicating the high purity of the sample. Based on the Scherrer formula (D = 0.89λ/B![[thin space (1/6-em)]](https://www.rsc.org/images/entities/char_2009.gif) cos
cos![[thin space (1/6-em)]](https://www.rsc.org/images/entities/char_2009.gif) θ) and XRD data, an average crystalline size of 14.68 nm was estimated from the (311) peak (the strongest peak).
θ) and XRD data, an average crystalline size of 14.68 nm was estimated from the (311) peak (the strongest peak).
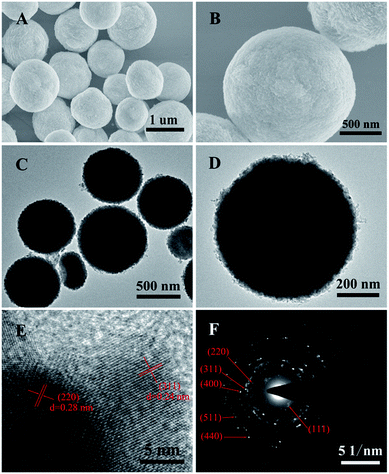 | ||
| Fig. 2 (A and B) SEM images, (C and D) TEM images, (E) HRTEM image and (F) the corresponding SAED pattern of the ZnCo2O4 microspheres. | ||
The morphology and architecture of the ZnCo2O4 products were carefully observed by means of SEM and HRTEM. The typical SEM images of the pure ZnCo2O4 products (Fig. 2A) show that they are composed of monodisperse microspheres with irregular diameters ranging from 600 nm to 1.2 μm. The higher magnification SEM image (Fig. 2B) shows that the surface of the ZnCo2O4 microspheres was very rough and comprised small nanoparticles. The TEM image of the ZnCo2O4 product (Fig. 2C) also shows that it is comprised of monodisperse and completely solid spheres with irregular diameters. The enlarged TEM image (Fig. 2D) clearly shows that there are numerous nanoparticles closely packed on the edges of the microspheres, which is in good agreement with the SEM observations. A further HRTEM image of the ZnCo2O4 microspheres is shown in Fig. 3E. Interplanar spacings of about 0.28 nm and 0.24 nm can be observed, corresponding to the (220) and (311) planes, respectively. The corresponding selected-area electron diffraction (SAED) pattern of the ZnCo2O4 microspheres in Fig. 5F shows well-defined diffraction rings, and the diffraction rings can be readily indexed to the (111), (220), (311), (400), (511), and (440) planes of the ZnCo2O4 phase, which is consistent with the results of abovementioned analysis.
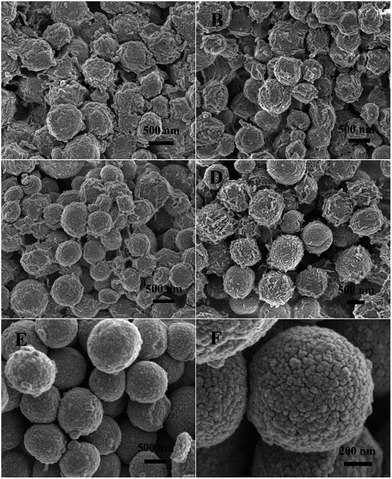 | ||
| Fig. 3 SEM images of the ZnCo-precursor prepared under different grown conditions: (A) 2 h, (B) 4 h, (C) 6 h, (D) 8 h, and (E and F) 10 h. | ||
To better elucidate the reaction mechanism responsible for the formation of the microsphere precursors, a series of time-dependent experiments were carried out. The morphologies of the products after the solvothermal treatment for different time intervals were characterized by SEM. As shown in Fig. 3A, a mass of irregular bulks was formed after 2 h of reaction and they were aggregated together. When the reaction was continued for 4 h, the irregular morphology of the bulk material turned into spheroidal (Fig. 3B). As the reaction time was prolonged to 6 h, they gradually blossom into regular microspheres; however, the microspheres were still aggregated together (Fig. 3C). When the reaction time was further prolonged to 8 h, monodisperse microspheres were obtained and lots of nanorods were closely packed on their surface (Fig. 3D). Finally, the uniform and well-rounded microspheres precursors were obtained when the reaction duration was extended to 10 h (Fig. 3E). A close SEM examination (Fig. 3F) reveals that these microsphere precursors were composed of closely packed nanoparticles, and the neighboring particles connected together to create a rough and porous structure.
Based on the abovementioned experimental observations, a plausible formation mechanism is summarized in Scheme 1. During the initial nucleation and crystal growth stage, a large number of nanoparticles form and tend to gather together to form spheroidal agglomerates driven by the minimization of interfacial energy.39–41 Then, the spheroidal agglomerate serves as a center to adsorb the newly formed nanoparticles. Moreover, the adsorbed nanoparticles with a higher surface energy and a smaller size dissolve and transfer to the spheroidal agglomerates due to the Ostwald ripening process.40 As the Ostwald ripening process continues, the spheroidal agglomerates become robust and well-rounded. Finally, well-defined microsphere precursors are formed. After calcination in air, the precursors are completely converted to ZnCo2O4 and the morphology of the precursors is well preserved. Due to the decomposition of the organic species in the calcination process, the porosity is effectively improved.
The porosity of the ZnCo2O4 microspheres was further investigated using BET measurements. As shown in Fig. 4A, the N2 adsorption–desorption isotherm obtained for ZnCo2O4 exhibits a type-IV isotherm with a H3 hysteresis loop, indicating the presence of a mesoporous structure. The corresponding pore size distribution confirmed by the BJH method is shown in Fig. 4B. The pore size distribution was mainly centered in the range of 2–10 nm with an average pore diameter of 6.96 nm. Moreover, the BET specific surface area and total pore volume of the ZnCo2O4 sample were calculated to be 34.60 m2 g−1 and 0.11 cm3 g−1, respectively. The high specific surface area with suitable mesopore distribution is beneficial for the fast diffusion of the electrolyte and can facilitate ion diffusion at the electrode–electrolyte interface during the electrochemical processes. Therefore, this kind of mesoporous structure is believed to enhance the properties of the supercapacitors.
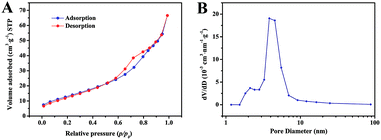 | ||
| Fig. 4 (A) The nitrogen adsorption and desorption isotherm and (B) corresponding BJH pore size distribution of the ZnCo2O4 microspheres. | ||
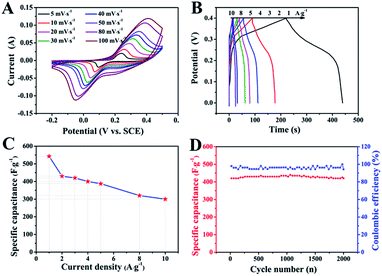
The electrochemical performance of ZnCo2O4 was measured by cyclic voltammetry (CV), galvanostatic charge–discharge (GCD), and electrochemical impedance spectroscopy (EIS) measurements in 6.0 M aqueous KOH electrolyte using a three-electrode electrochemical cell. Fig. 5A shows the CV curves obtained for the ZnCo2O4 electrode in a potential range of −0.2–0.5 V at scan rates ranging from 5 to 100 mV s−1. The shape of all CV curves exhibit a pair of well-defined redox peaks, which mainly originate from the reversible faradaic redox reactions related to M–O/M–O–OH (M refers to Co and Zn ions) associated with OH− anions, confirming the pseudocapacitive characteristics.42,43 Furthermore, the shape of the CV curves can be well maintained when the potential scan rates are varied from 5 to 100 mV s−1, demonstrating the excellent rate capability and improved mass transport of the electrode.44 Note that, the cathodic and anodic peaks shift towards lower and higher potential with increase in the scan rates, respectively, which can be attributed to the internal resistance and polarization effect during the faradaic process.25,45 However, the position of the cathodic or anodic peaks only slightly shift, which suggests the good reversibility and the fast charge/discharge response of the ZnCo2O4 electrode.46
Fig. 5B presents the GCD curves obtained for the ZnCo2O4 electrode with a potential window ranging from 0 to 0.4 V at various current densities ranging from 1 to 10 A g−1. The pseudocapacitive behavior was further confirmed by the non-linear charge/discharge profile. It can be observed that there are voltage plateaus during the charge/discharge measurements, which are consistent with the CV curves. The calculated specific capacitance based on the discharge curves as a function of the current density is plotted in Fig. 5C. The ZnCo2O4 electrode delivers a high pseudocapacitance of 542.5, 430, 420, 400, 387.5, 320, and 300 F g−1 at current densities of 1, 2, 3, 4, 5, 8, and 10 A g−1, respectively. Along with the increase in current density, the corresponding specific capacitances gradually decrease, which can be attributed to the low diffusion of electrolyte ion and the presence of inner active sites that are unable to completely sustain the redox transitions.47 About 55.3% of the capacitance of the ZnCo2O4 electrode was retained when the current density was increased from 1 to 10 A g−1, which demonstrates an outstanding rate capability and superior electrochemical capacitance. In addition, the cycling stability was also evaluated by the repeated charge–discharge measurements at a constant current density of 2 A g−1 for 2000 cycles, as shown in Fig. 5D. Clearly, about 95.5% of the maximum capacitance (440 F g−1) was retained after 2000 continuous charge–discharge cycles, showing an excellent cyclic stability. The coulombic efficiency during the 2000 charge–discharge cycles was more than 98%, which confirmed the electrochemical suitability of the ZnCo2O4 electrode, whose redox reactions are quite feasible. The electrochemical impedance spectroscopy (EIS) measurements (Fig. S1, ESI†) indicate the high electrical conductivity, low internal resistance, and fast charge transportation of the ZnCo2O4 microspheres, which may be helpful for the excellent rate capability.
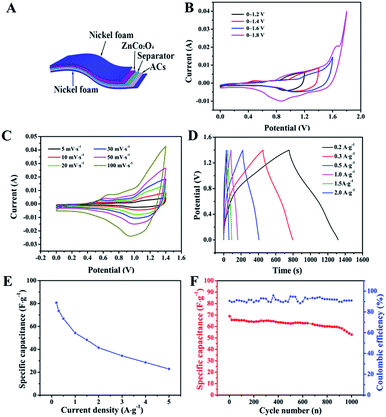
To evaluate the potential applications of our ZnCo2O4 microspheres, we assembled a quasi-solid-state asymmetric supercapacitor device based on the ZnCo2O4 microsphere electrode as the anode, ACs on Ni foam as the cathode, KOH–PVA gel as the solid electrolyte and a piece of cellulose paper as the separator as shown in Fig. 6A. Fig. 6B shows the CV curves obtained for the fabricated ZnCo2O4//AC asymmetric supercapacitor at different voltage windows obtained at a scan rate of 10 mV s−1. The CV curves were stable even at 1.4 V. However, when the potential was higher than 1.4 V, the CV curves exhibited a distortion and a slight hump that can be attributed to some irreversible reactions occurring when the potential window was higher than 1.4 V.48 Therefore, 1.4 V was used as the default voltage value for further investigation. Fig. 6C displays the CV curves of the quasi-solid-state asymmetric supercapacitor at various scan rates from 2 to 100 mV s−1. As the scan rate increased, the closed areas of the CV curves were augmentative, whereas the shapes were well retained, implying the fast charge–discharge performance of the asymmetric device. The GCD curves of the quasi-solid-state asymmetric supercapacitor at a set of current densities from 0.1 A g−1 to 2 A g−1 are illustrated in Fig. 6D. It was observed that all the GCD curves were nearly symmetric, indicating an excellent electrochemical reversibility and good coulombic efficiency. Based on the total masses of the two electrodes, the calculated specific capacitance of the asymmetric device as a function of the current densities was plotted and is shown in Fig. 6E. The specific capacitance of the asymmetric device was 80.71, 66.78, 54.28, 41.42, and 22.86 F g−1 at current densities of 0.2, 0.5, 1.0, 2.0, and 5.0 A g−1, respectively. The cycle performance and coulombic efficiency of the quasi-solid-state asymmetric supercapacitor were carried out at 0.5 A g−1 for 1000 cycles, as shown in Fig. 6F. After 1000 cycles, the specific capacitance of the quasi-solid-state asymmetric supercapacitor was 52.86 F g−1 with about 76.68% of the initial capacitance being retained. Furthermore, the coulombic efficiency was maintained at about 91% during the consecutive cycles.
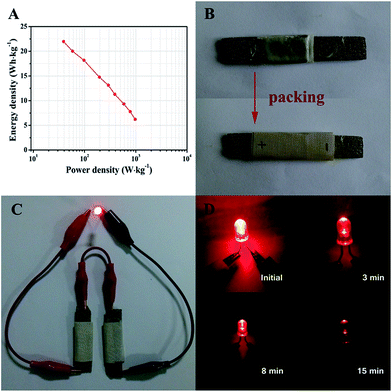
Ragone plots of the ZnCo2O4//AC quasi-solid-state asymmetric supercapacitor device derived from the charge–discharge measurements at different current densities are presented in Fig. 7A. The quasi-solid-state asymmetric supercapacitor can provide a maximum energy density of 21.97 W h kg−1 at a power density of 38.89 W kg−1, which still remains 6.22 W h kg−1 at a high power density of 972.22 W kg−1. Furthermore, the as-fabricated ZnCo2O4//AC quasi-solid-state asymmetric supercapacitor was packed with PTFE tape to form a device, as shown in Fig. 7B. In addition, two solid-state asymmetric supercapacitors connected in a series can light up a 5 mm diameter red (2.0 V, 20 mA) round light-emitting diode (LED), which lasts for more than 15 min (Fig. 7C and D) and indicates the excellent practical application potential of the devices as an energy storage system.
Conclusions
In summary, porous ZnCo2O4 microspheres have been successfully fabricated using a facile hydrothermal method followed by a calcination process. It exhibits excellent electrochemical performance with a high specific capacitance of 542.5 F g−1 at 1 A g−1, a remarkable long-term cycling stability (95.5% of the maximum capacitance is retained after 2000 cycles at 2 A g−1), good reversibility features, and an excellent rate capability. In addition, an all solid-state asymmetric supercapacitor was successfully fabricated with outstanding cycling life, in which the specific capacitance was maintained at about 76.68% of the initial capacitance. The all solid-state asymmetric supercapacitor can light up a red LED that lasts for more than 15 min, endowing our quasi-solid-state asymmetric supercapacitor new opportunities as energy storage devices for various electronic systems. Our results bode well for the practical application of ZnCo2O4 microspheres materials in future high-performance supercapacitors.Acknowledgements
This work was financially supported by the Natural Science Foundation of China (NSFC (21404066 and 51603114)), the Shandong Province Natural Science Foundation (ZR2014DP003 and ZR2016EMQ03), the Outstanding Young Scientists Incentive foundation of Shandong Province (BS2010NJ007), and the Science and Technology Foundation of Qingdao City (Grant No. 16-5-1-43-jch).Notes and references
- Z. Gao, W. Yang, J. Wang, N. Song and X. Li, Nano Energy, 2015, 13, 306–317 CrossRef CAS.
- B. Guan, D. Guo, L. Hu, G. Zhang, T. Fu, W. Ren, J. Li and Q. Li, J. Mater. Chem. A, 2014, 2, 16116–16123 CAS.
- D. P. Dubal, O. Ayyad, V. Ruiz and P. Gomez-Romero, Chem. Soc. Rev., 2015, 44, 1777–1790 RSC.
- C. Zheng, C. Cao, R. Chang, J. Hou and H. Zhai, Phys. Chem. Chem. Phys., 2016, 18, 6268–6274 RSC.
- R. R. Salunkhe, J. Tang, Y. Kamachi, T. Nakato, J. H. Kim and Y. Yamauchi, ACS Nano, 2015, 9, 6288–6296 CrossRef CAS PubMed.
- H. Chen, J. Jiang, Y. Zhao, L. Zhang, D. Guo and D. Xia, J. Mater. Chem. A, 2015, 3, 428–437 CAS.
- R. R. Salunkhe, Y. H. Lee, K. H. Chang, J. M. Li, P. Simon, J. Tang, N. L. Torad, C. C. Hu and Y. Yamauchi, Chemistry, 2014, 20, 13838–13852 CrossRef CAS PubMed.
- J. Tang and Y. Yamauchi, Nat. Chem., 2016, 8, 638–639 CrossRef CAS PubMed.
- J. Tang, R. R. Salunkhe, J. Liu, N. L. Torad, M. Imura, S. Furukawa and Y. Yamauchi, J. Am. Chem. Soc., 2015, 137, 1572–1580 CrossRef CAS PubMed.
- X. Zheng, Y. Ye, Q. Yang, B. Geng and X. Zhang, Dalton Trans., 2016, 45, 572–578 RSC.
- L. An, W. Li, Y. Cao, K. Xu, R. Zou, T. Ji, L. Yu and J. Hu, Dalton Trans., 2015, 44, 21131–21140 RSC.
- D. Cheng, Y. Yang, J. Xie, C. Fang, G. Zhang and J. Xiong, J. Mater. Chem. A, 2015, 3, 14348–14357 CAS.
- S. Gao, F. Liao, S. Ma, L. Zhu and M. Shao, J. Mater. Chem. A, 2015, 3, 16520–16527 CAS.
- S. Hou, G. Zhang, W. Zeng, J. Zhu, F. Gong, F. Li and H. Duan, ACS Appl. Mater. Interfaces, 2014, 6, 13564–13570 CAS.
- B. Zhu, S. Tang, S. Vongehr, H. Xie and X. Meng, ACS Appl. Mater. Interfaces, 2016, 8, 4762–4770 CAS.
- L. Huang, D. Chen, Y. Ding, Z. L. Wang, Z. Zeng and M. Liu, ACS Appl. Mater. Interfaces, 2013, 5, 11159–11162 CAS.
- M. Li, S. Xu, Y. Zhu, P. Yang, L. Wang and P. K. Chu, J. Alloys Compd., 2014, 589, 364–371 CrossRef CAS.
- S. Peng, L. Li, H. Tan, R. Cai, W. Shi, C. Li, S. G. Mhaisalkar, M. Srinivasan, S. Ramakrishna and Q. Yan, Adv. Funct. Mater., 2014, 24, 2155–2162 CrossRef CAS.
- J.-C. Xing, Y.-L. Zhu, Q.-W. Zhou, X.-D. Zheng and Q.-J. Jiao, Electrochim. Acta, 2014, 136, 550–556 CrossRef CAS.
- X. Ren, C. Guo, L. Xu, T. Li, L. Hou and Y. Wei, ACS Appl. Mater. Interfaces, 2015, 7, 19930–19940 CAS.
- P. Yang, X. Xiao, Y. Li, Y. Ding, P. Qiang, X. Tan, W. Mai, Z. Lin, W. Wu, T. Li, H. Jin, P. Liu, J. Zhou, C. P. Wong and Z. LinWang, ACS Nano, 2013, 7, 2617–2626 CrossRef CAS PubMed.
- Z. Chen, C. X. Kronawitter and B. E. Koel, Phys. Chem. Chem. Phys., 2015, 17, 29387–29393 RSC.
- S. Yang, X. Song, P. Zhang and L. Gao, ACS Appl. Mater. Interfaces, 2015, 7, 75–79 CAS.
- X. Lu, G. Wang, T. Zhai, M. Yu, J. Gan, Y. Tong and Y. Li, Nano Lett., 2012, 12, 1690–1696 CrossRef CAS PubMed.
- H. Niu, X. Yang, H. Jiang, D. Zhou, X. Li, T. Zhang, J. Liu, Q. Wang and F. Qu, J. Mater. Chem. A, 2015, 3, 24082–24094 CAS.
- L. Shen, L. Yu, X. Y. Yu, X. Zhang and X. W. Lou, Angew. Chem., 2015, 54, 1868–1872 CrossRef CAS PubMed.
- M. Kuang, X. Y. Liu, F. Dong and Y. X. Zhang, J. Mater. Chem. A, 2015, 3, 21528–21536 CAS.
- S. Peng, L. Li, H. B. Wu, S. Madhavi and X. W. D. Lou, Adv. Energy Mater., 2015, 5, 1401172 CrossRef.
- G. Gao, S. Lu, Y. Xiang, B. Dong, W. Yan and S. Ding, Dalton Trans., 2015, 44, 18737–18742 RSC.
- H. Chen, J. Jiang, L. Zhang, T. Qi, D. Xia and H. Wan, J. Power Sources, 2014, 248, 28–36 CrossRef CAS.
- S. Chen, M. Xue, Y. Li, Y. Pan, L. Zhu and S. Qiu, J. Mater. Chem. A, 2015, 3, 20145–20152 CAS.
- C. Wu, J. Cai, Q. Zhang, X. Zhou, Y. Zhu, L. Li, P. Shen and K. Zhang, Electrochim. Acta, 2015, 169, 202–209 CrossRef CAS.
- W. Bai, H. Tong, Z. Gao, S. Yue, S. Xing, S. Dong, L. Shen, J. He, X. Zhang and Y. Liang, J. Mater. Chem. A, 2015, 3, 21891–21898 CAS.
- B. Liu, B. Liu, Q. Wang, X. Wang, Q. Xiang, D. Chen and G. Shen, ACS Appl. Mater. Interfaces, 2013, 5, 10011–10017 CAS.
- H. Chen, Q. Zhang, J. Wang, Q. Wang, X. Zhou, X. Li, Y. Yang and K. Zhang, Nano Energy, 2014, 10, 245–258 CrossRef CAS.
- L. Huang, G. H. Waller, Y. Ding, D. Chen, D. Ding, P. Xi, Z. L. Wang and M. Liu, Nano Energy, 2015, 11, 64–70 CrossRef CAS.
- M. S. Park, J. Kim, K. J. Kim, J. W. Lee, J. H. Kim and Y. Yamauchi, Phys. Chem. Chem. Phys., 2015, 17, 30963–30977 RSC.
- Y. Wang, J. Ke, Y. Zhang and Y. Huang, J. Mater. Chem. A, 2015, 3, 24303–24308 CAS.
- L. Hu, H. Zhong, X. Zheng, Y. Huang, P. Zhang and Q. Chen, Sci. Rep., 2012, 2, 986 Search PubMed.
- S. Peng, Y. Hu, L. Li, X. Han, F. Cheng, M. Srinivasan, Q. Yan, S. Ramakrishna and J. Chen, Nano Energy, 2015, 13, 718–726 CrossRef CAS.
- L. Liu, H. Zhang, J. Yang, Y. Mu and Y. Wang, J. Mater. Chem. A, 2015, 3, 22393–22403 CAS.
- G. Q. Zhang, H. B. Wu, H. E. Hoster, M. B. Chan-Park and X. W. Lou, Energy Environ. Sci., 2012, 5, 9453 CAS.
- W. Yang, Z. Gao, J. Ma, X. Zhang, J. Wang and J. Liu, J. Mater. Chem. A, 2014, 2, 1448–1457 CAS.
- J. Wang, X. Zhang, Q. Wei, H. Lv, Y. Tian, Z. Tong, X. Liu, J. Hao, H. Qu, J. Zhao, Y. Li and L. Mai, Nano Energy, 2016, 19, 222–233 CrossRef CAS.
- S. Gu, Z. Lou, X. Ma and G. Shen, ChemElectroChem, 2015, 2, 1042–1047 CrossRef CAS.
- Y. Zhu, Z. Wu, M. Jing, X. Yang, W. Song and X. Ji, J. Power Sources, 2015, 273, 584–590 CrossRef CAS.
- H. Chen, J. Jiang, L. Zhang, H. Wan, T. Qi and D. Xia, Nanoscale, 2013, 5, 8879–8883 RSC.
- X. Wang, C. Yan, A. Sumboja and P. S. Lee, Nano Energy, 2014, 3, 119–126 CrossRef CAS.
Footnote |
| † Electronic supplementary information (ESI) available. See DOI: 10.1039/c6ra25950b |
| This journal is © The Royal Society of Chemistry 2017 |


