 Open Access Article
Creative Commons Attribution 3.0 Unported Licence
Enhancing graphene capacitance by nitrogen: effects of doping configuration and concentration
Cheng
Zhan
a,
Yu
Zhang
b,
Peter T.
Cummings
b and
De-en
Jiang
*a
aDepartment of Chemistry, University of California, Riverside, CA 92521, USA. E-mail: de-en.jiang@ucr.edu; Tel: +1-951-827-4430
bDepartment of Chemical and Biomolecular Engineering, Vanderbilt University, Nashville, TN 37235, USA
First published on 8th January 2016
Abstract
Recent experiments have shown that nitrogen doping enhances capacitance in carbon electrode supercapacitors. However, a detailed study of the effect of N-doping on capacitance is still lacking. In this paper, we study the doping concentration and the configuration effect on the electric double-layer (EDL) capacitance, quantum capacitance, and total capacitance. It is found that pyridinic and graphitic nitrogens can increase the total capacitance by increasing quantum capacitance, but pyrrolic configuration limits the total capacitance due to its much lower quantum capacitance than the other two configurations. We also find that, unlike the graphitic and pyridinic nitrogens, the pyrrolic configuration's quantum capacitance does not depend on the nitrogen concentration, which may explain why some capacitance versus voltage measurements of N-doped graphene exhibit a V-shaped curve similar to that of undoped graphene. Our investigation provides a deeper understanding of the capacitance enhancement of the N-doping effect in carbon electrodes and suggests a potentially effective way to optimize the capacitance by controlling the type of N-doping.
1. Introduction
Electric double-layer capacitors (EDLCs), also called supercapacitors, store electric energy physically at the electrode–electrolyte interface by the formation of the electric double layer under a bias voltage.1 The specific capacitance of an EDLC can be much higher than that of a conventional dielectric capacitor.2 In recent years, carbon nanomaterials such as carbide-derived carbons and graphene have become popular as supercapacitor electrode materials due to their good conductivity and high specific surface area.2–9 Graphene, unlike a traditional metal electrode, has a different capacitive performance due to its quantum capacitance,10–12 which is caused by its limited density of states (DOS) near the Fermi level.In graphene supercapacitors, total capacitance Ctotal reflects the overall effect of quantum capacitance CQ and the electric double-layer (EDL) capacitance CEDL and can be estimated by
 | (1) |
A consequence of the theoretical relationship of quantum, EDL, and total capacitances in eqn (1) is that Ctotal < min(CQ, CEDL), suggesting that in cases where the quantum capacitance is less than the EDL capacitance, the total capacitance may be increased by increasing quantum capacitance. To alter the DOS and thus to change the quantum capacitance, the most common and widely used way is doping. Nitrogen-doped graphene has been studied for many years and shows a higher capacitance than pristine graphene and porous carbon.16–24 Ruoff et al. attributed this capacitance enhancement to the increase in quantum capacitance,16 but Choi et al. explained the capacitance increase by the higher binding energy between the pyridinic group and the cation.18 So this topic is still controversial due to the complex structure of N-doped graphene and the experimental difficulty of the accurate measurement of the quantum capacitance.
In this report, we aim to elucidate the role of N-doping in the graphene capacitance. To simplify the complex structure, we separately study the three most common configurations in N-doped graphene: graphitic, pyridinic, and pyrrolic. In N-doped carbons, these three configurations can be distinguished by X-ray photoelectron spectroscopy (XPS) of N 1s binding energy,25 as experimentally observed.26 Herein we focus on a single-layer graphene sheet to elucidate the influence of N-doping on quantum capacitance and EDL capacitance.
2. Computational methods
Quantum capacitance is calculated by the electronic density functional theory (DFT) using implicit solvation model through the JDFTx code.27,28 N-doped graphene is modeled by a two-dimensional sheet under periodic boundary conditions; the lateral supercell is built up using repeating unit cells of graphene with a lattice parameter of 2.46 Å, close to the experimental value of 2.461 Å in pristine graphene. The thickness of the vacuum slab is 20 Å above the graphene sheet along the z direction and filled with an implicit electrolyte (that is, a dielectric continuum). The generalized gradient approximation in the form of Perdew–Burke–Ernzerhof functional is applied to describe the exchange–correlation effect.29 Ultra-soft pseudopotential is used to describe the interaction between nuclei and valence electrons.30 The optimization of the ionic position is accomplished by the BFGS algorithm at the fixed lattice constant with a cutoff energy of 20 hartree for the planewave bases, a 6 × 6 × 1 k-point mesh to sample the Brillouin zone, and 10−6 hartree tolerance in total energy for convergence. For accurate calculation of the density of states D(E) near the Fermi level, a cutoff energy of 40 hartree and a 48 × 48 × 1 k-point mesh are used. From D(E), we can readily calculate the quantum capacitance from | (2) |
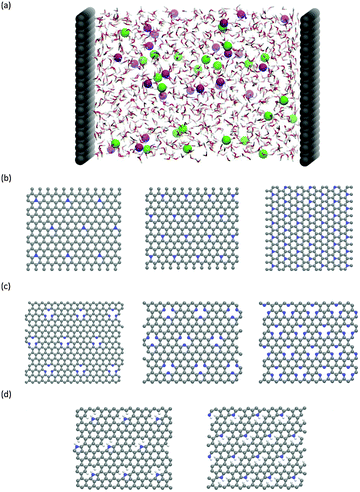
Classical molecular dynamics (CMD) simulations were performed to obtain the EDL capacitance based on the same nitrogen-doped configurations as those used in the calculation of the quantum capacitance. As illustrated in Fig. 1a, the simulated channel system consists of a slab of 1.0 M NaCl aqueous solution enclosed between two electrodes. The separation between the two electrodes was set to 5.0 nm to ensure the bulk-like behavior of the electrolyte in the channel center. The SPC/E model was used for the water molecules;31 the Lennard-Jones (LJ) parameters for Na+ and Cl− were taken from the work of Smith et al.32 All atoms in the electrode were described by a polymer consistent force field (PCFF)33–34 and were fixed in space during the simulation. The electrode–electrolyte interaction included the Coulombic contribution (accounted for the electrostatic interaction between atomic charges) and the van der Waals (vdW) contribution (accounted for from the LJ potentials). The LJ parameters for the vdW interaction between an electrode atom (type i with LJ parameters σii and εii) and an electrolyte atom (type j with LJ parameters σjj and εjj) were obtained by using Lorentz–Berthelot rules:  and εij = (εiiεjj)1/2.
The CMD simulations were performed in the NVT ensemble using the MD package GROMACS.35 Since the system has a slab geometry, the slab-PME method36 was used here to compute the electrostatic interaction. The dimension vertical to the electrode was set to be 5 times the electrode separation to guarantee that the accuracy of the electrostatic force calculation is comparable to that of the two-dimensional Ewald method.37 Each simulation was initiated at 800 K for 2 ns, followed by 9 ns of equilibration at 298 K, with temperature controlled by using a Berendsen thermostat. Another production run of 15 ns was performed for analysis. The time step of 2 fs was applied and the atomic positions were saved every 4 ps. Previous reports38–39 showed that the 2 fs time step is sufficient enough to yield stable dynamics for the aqueous systems. Herein, we indeed found that the 2 fs time step afforded stable dynamics and stable electrostatic potential profiles in the water/graphene system. In addition, to ensure statistical accuracy, each simulation was repeated 3 times with different initial configurations (electrode configurations are shown in Fig. 1b–d).
Different electrical potentials were created by varying the surface charge densities of the electrode. The excess charges were evenly distributed to each atom. The final partial charge of each atom is composed of the excess charge and the partial charge from the force field. The MD calculation setup is similar to a previous work.40
We establish the total capacitance as a function of applied voltage (φa) by combining CQ and CEDL as described in the literature.14 First, we calculated the charging curves (Q vs. φ) for both quantum and EDL capacitances separately: quantum capacitance as a function of φQC = (E − EFermi)/e and EDL capacitance as a function of φEDL = φ − φPZC. Then, we used the interfacial charge Q to connect the two capacitances by obtaining the corresponding potential drops φEDL and φQC from EDL and quantum capacitances, respectively, at the same surface charge. So the total applied potential drop φa = φEDL + φQC and the total capacitance is therefore Ctot = Q/φa. By varying Q, the charging curve for the total capacitance is obtained.41
3. Results and discussion
We first examine the quantum capacitance, then the EDL capacitance, and finally the total capacitance of N-doped graphene electrodes.3.1 Quantum capacitance of different N-doping configurations at low concentration
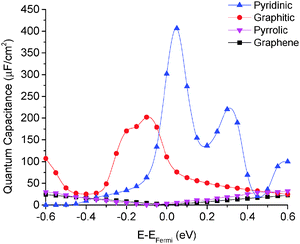
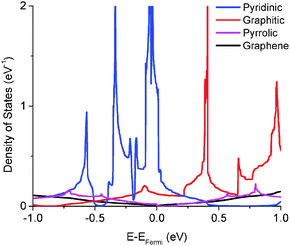
We calculated the quantum capacitance of the N-doped graphene with different doping mole concentrations. The three most common configurations are chosen: graphitic, pyridinic and pyrrolic,26,42–44 as shown in Fig. 1b–d, respectively. The quantum capacitance and density of states (DOS) of these three N-doping configurations are plotted in Fig. 2 and 3, respectively. One can see that graphitic and pyridinic N-doping configurations can greatly increase quantum capacitance, but pyrrolic N shows a “V”-shaped curve similar to pristine graphene.The quantum capacitance shown in Fig. 2 can be explained by the n-doping and p-doping mechanisms in graphene sheets.45 In the pyrrolic N-doping configuration, the N atom can donate an extra electron in the Pz orbital due to the formation of the N–H bond but the associated C vacancy results in the loss of one electron in the delocalized π bond. Thus, the total number of electron does not change compared to pristine graphene. This explains why the pyrrolic N-doping configuration shows a “V”-shaped quantum capacitance similar to pristine graphene; the DOS plots of pristine graphene and pyrrolic-N-doped graphene are also similar (Fig. 3). Graphitic N-doping can be regarded as an electron donator, which contributes one more electron to the delocalized π bond than the C atom. Thus, the “Dirac Point” moves toward a higher energy position and the DOS near the Fermi level increases (Fig. 3), so the quantum capacitance increases. In pyridinic N-doping, the number of electron on the Pz orbital of nitrogen does not change, but it causes a C vacancy and the system loses one electron compared to pristine graphene. Thus, the system is like a p-doping semiconductor, which shifts the “Dirac Point” down; the DOS near the Fermi level increases greatly (Fig. 3) and the quantum capacitance increases consequently.
3.2 Quantum capacitance of graphitic N-doped graphene at different doping levels
We computed the quantum capacitance of graphitic N-doping configuration with different doping concentrations and the results are plotted in Fig. 4. One can see that quantum capacitance exhibits considerable fluctuation, which is different from a smooth curve observed in a previous report.46 This may be due to our much denser k-point sampling in the Brillouin zone. We found that high doping concentration can increase quantum capacitance and change the peak position, due to the corresponding change in the total DOS with concentration. As mentioned above, graphitic N-doping can be treated as the n-doping type semiconductor, which will cause the “Dirac Point” move to the position below the Fermi level. Thus, as the concentration goes down, quantum capacitance decreases and the “Dirac Point” tends to move back to the Fermi level.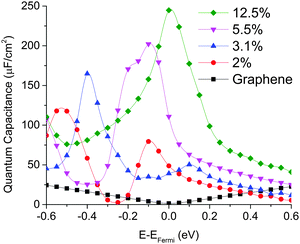 | ||
| Fig. 4 Quantum capacitance of graphitic N-doped single layer graphene with different doping concentrations in comparison with that of pristine graphene. | ||
3.3 Quantum capacitance of pyridinic N-doped graphene at different doping levels
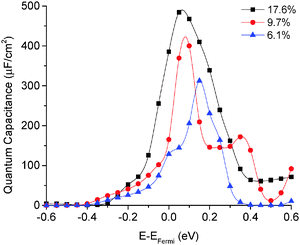
The quantum capacitance of pyridinic N-doped graphene with different doping concentrations is plotted in Fig. 5. In the pyridinic N-doping configuration, the quantum capacitance enhancement is much stronger than the graphitic N-doping under a comparable doping concentration. The quantum capacitance maximum can reach 400 μF cm−2 in the pyridinic N-doping configuration with the doping concentration of 9.7%, but the quantum capacitance maximum is only ∼250 μF cm−2 with 12.5% graphitic N-doping. However, the quantum capacitance fluctuation in the pyridinic configuration is much stronger. Unlike graphitic N-doping, the quantum capacitance of the pyridinic N-doping configuration will be very close to zero when the potential is below more negative than −0.4 eV. This character in the pyridinic configuration does not depend on the doping concentration and will severely limit the total capacitance when the applied voltage is significantly negative. This extremely low quantum capacitance can be explained by the existence of a small gap at the “Dirac Point” caused by the p-type doping mechanism. One can see this gap in the DOS plot (Fig. 3) at 0.5–1.0 eV, corresponding to a negative electrode potential of about −0.5 to −1.0 V.3.4 The quantum capacitance of pyrrolic N-doped graphene at different doping levels
The quantum capacitance of pyrrolic N-doping graphene with different doping concentrations is plotted in Fig. 6. Unlike the graphitic and pyridinic N-doping configurations, the pyrrolic N-doping configuration exhibits a “V”-shaped quantum capacitance similar to that of pristine graphene when the doping concentration is low. As discussed previously,45 the pyrrolic N-doping configuration has the same amount of electrons as pristine graphene and can be regarded as neither n-type nor p-type doped graphene due to the formation of the N–H bond and vacancy. For a graphene or quasi-graphene type of 2D material, the total DOS always shows a “V” shape and the “Dirac Point” will be near the Fermi level. At low doping concentration, the correlation of pyrrolic N-doped graphene and the vacancy between each unit cell can be treated as a small perturbation. Thus, the total DOS and quantum capacitance are very close to those of pristine graphene. However, things are different when doping concentration is quite large. In this situation (when the doping concentration is 5.9%), quantum capacitance approaches zero near the Fermi level due to a gap in the total DOS as shown in Fig. 7.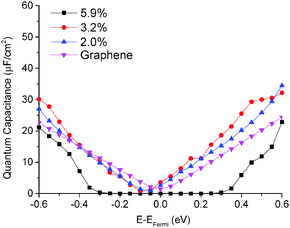 | ||
| Fig. 6 Quantum capacitance of pyrrolic N-doped graphene with different doping concentrations in comparison with that of pristine graphene. | ||
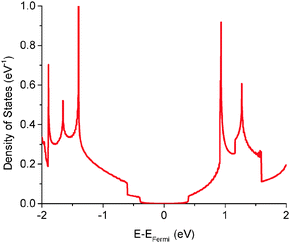 | ||
| Fig. 7 Total electronic density of states of pyrrolic N-doped graphene with the doping concentration of 5.9%. | ||
3.5 The EDL capacitance of N-doped graphene in the 1 M NaCl aqueous electrolyte
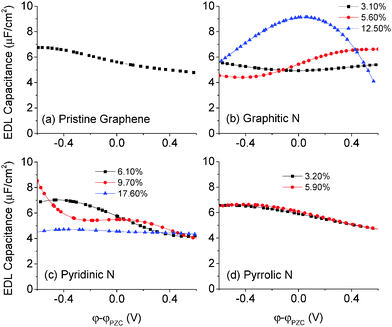
In general, the EDL capacitance of carbon electrodes is ∼20 μF cm−2 in an aqueous electrolyte8 and ∼8 μF cm−2 in an ionic liquid.47–49 The voltage window is about PZC ± 0.6 V in an aqueous electrolyte and about PZC ± 1.5 V in an ionic liquid. Since the quantum capacitance that we explored lie mainly and is more reliable in PZC ± 0.6 V, we focus on the capacitance of doped graphene electrodes in an aqueous electrolyte.The differential capacitance of N-doped graphene calculated by MD simulation in the 1 M NaCl aqueous electrolyte is plotted in Fig. 8. Comparing with pristine graphene, one can see that the EDL capacitance is almost the same for the pyrrolic configuration and perturbed to a small degree in the case of graphitic and pyridinic configurations. At high levels of doping, the differential capacitance is likely affected by the partial charge of dopants, causing the change in the EDL capacitance curves as shown in Fig. 8b and c. In most experimental studies, the total nitrogen content is lower than 10%;42 in this case, Fig. 8 shows that the EDL capacitance does not change much in comparison with that of pristine graphene. This conclusion was also found previously for N-doped graphene in an ionic liquid electrolyte.46
From the EDL capacitance shown in Fig. 8, we can conclude that the capacitance enhancement caused by the N-doping effect is not due to the EDL capacitance. From eqn (1), we know that the total capacitance can be estimated from knowledge of both the quantum and EDL capacitances. Consequently, the quantum capacitance may be the key factor in explaining the capacitance enhancement of the N-doping effect. Specifically, the inequality Ctotal < min(CQ, CEDL) suggests that in those N-doped systems in which CQ < CEDL, the quantum capacitance will be the predominant determinant of the total capacitance. For systems in which CQ > CEDL, the EDL capacitance will be the predominant determinant of the total capacitance.
3.6 Total integral and differential capacitance of N-doped graphene in the 1 M NaCl electrolyte
Now that we have computed both quantum and EDL capacitances separately, we can combine them to obtain the total capacitance. To compare with experiment more clearly, we used the charging curve based on CQ and CEDL to calculate the integral capacitance from −0.6 V to 0.6 V (Table 1). One can see that, compared to pristine single-layer graphene, the integral capacitance increases by about 63% in graphitic and 82% in pyridinic N-doping, but only by 4% in pyrrolic N-doped graphene. The capacitance enhancement in our prediction is in good agreement with Fu et al.'s experimental work22 that showed capacitance enhancement of about 50% for graphitic- and pyridinic-dominated configurations. Choi et al. applied nitrogen plasma to treat the graphene sample that may have caused more defects, and they found higher increases (over two times).18| n-Type | Integral capacitance (μF cm−2) |
|---|---|
| Pristine graphene | 2.93 |
| Graphitic | 4.79 |
| Pyridinic | 5.34 |
| Pyrrolic | 3.05 |
We can obtain further insights from the total differential capacitance plotted in Fig. 9. Graphitic and pyridinic N-doped graphenes both have high and similar integral capacitance, but very different differential capacitance. Graphitic N-doped graphene exhibits a more stable and flat differential capacitance in the voltage window. Pyridinic N-doped graphene exhibits a larger differential capacitance than graphitic N-doped graphene at a negative surface potential, but the differential capacitance goes down as the electrode potential goes up. In addition, the calculated total differential capacitance curves of graphitic and pyridinic are very close to the EDL capacitance obtained from by MD simulation. This is because for both graphitic and pyridinic nitrogens, quantum capacitances are much larger than EDL capacitances and the total charging dictated by the EDL charging. Unlike graphitic and pyridinic N-doped graphenes, pyrrolic N-doped graphene shows a “V”-shaped differential capacitance similar to that of pristine graphene and is in good agreement with the experiment.16
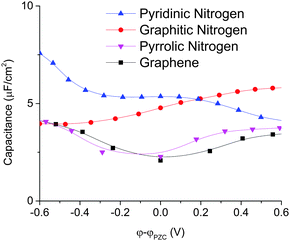 | ||
| Fig. 9 Total differential capacitance of different types of N-doped graphene for the 1 M NaCl aqueous electrolyte. | ||
3.7 Relevance to real N-doped carbon electrodes
In real carbon or nitrogen-doped carbon materials, the electrode structure is very complicated. Experimentalists always measure BET surface area and pore size distribution to obtain some porosity information in carbon materials. For N-doped graphene, the commonly used way to identify different nitrogen types and their relative concentrations is XPS measurement of N 1s binding energy (B.E.). Our calculation has shown that different types of N-doping configuration have different quantum capacitances and differential capacitances. In the real situation, experimentally obtained nitrogen doped graphene is a mixture of different N-doping configurations. Thus, the integrated capacitance should depend on the relative proportion of each configuration, which can be well controlled by the synthesis method42–43 and characterized by XPS. It has been shown both experimentally and theoretically that pyridinic and pyrrolic nitrogens have stronger thermal stability than graphitic nitrogen in high temperature.18,22–23,50 Combining the thermal stability and our capacitance study, one can arrive at important implications for capacitance enhancement in N-doped graphene systems. The most important implication is that one should increase the concentrations of pyridinic and graphitic nitrogens and decrease that of pyrrolic type to increase capacitance. Since graphitic nitrogen is much less stable than the other two types, one should focus on the pyridinic type if high-temperature treatment is needed in synthesis.Our calculated quantum capacitance (Fig. 6) and differential capacitance (Fig. 9) of pyrrolic N-doped graphene both show a “V”-shaped capacitance vs. a voltage curve, which is very similar to that of pristine graphene. This calculation shows very good agreement with the experimental measurement of Ruoff et al. in the aqueous electrolyte;16 their XPS analysis showed that most nitrogen atoms are in the pyrrolic configuration. The large capacitance enhancement observed by Choi18 and Liu17,19 is probably caused by graphitic and pyridinic N-doping configurations.
4. Summary and conclusions
We have calculated the quantum, electric double-layer (EDL), and total capacitances of N-doped graphenes of different N types and concentrations to investigate their effects on capacitances. The EDL capacitance was calculated by classical MD simulation and quantum capacitance by Kohn–Sham DFT. Graphitic and pyridinic configurations greatly increase quantum capacitance, which is proportional to the doping concentration. Pyrrolic configuration shows a “V”-shaped quantum capacitance similar to that of pristine graphene, hence no enhancement. Classical MD simulations of the doped graphene electrodes in the 1 M NaCl aqueous electrolyte showed that N-doping has relatively little effect on the EDL capacitance for the doping concentrations examined. The total capacitance, by combining quantum capacitance and EDL capacitance, exhibits good agreement with experimental results. When the pyrrolic configuration is dominant, the measured differential capacitance shows a “V”-shaped curve similar to pristine graphene. When the graphitic or pyridinic configuration is dominant, a large capacitance enhancement is observed. In conclusion, graphitic and pyridinic nitrogens can greatly increase the total capacitance by increasing quantum capacitance and the pyrrolic configuration will limit the increase in the total capacitance. Given the much higher stability of pyridinic and pyrrolic nitrogens than graphitic nitrogen, one should dope more pyridinic nitrogen and avoid the pyrrolic type.Acknowledgements
This research was sponsored by the Fluid Interface Reactions, Structures, and Transport (FIRST) Center, an Energy Frontier Research Center funded by the U.S. Department of Energy (DOE), Office of Science, Office of Basic Energy Sciences. Y. Z. gratefully acknowledges Guang Feng for help with the MD simulations. This research used resources of the National Energy Research Scientific Computing Center, a DOE Office of Science User Facility supported by the Office of Science of the U.S. Department of Energy under Contract No. DE-AC02-05CH11231.References
- L. L. Zhang and X. S. Zhao, Chem. Soc. Rev., 2009, 38, 2520 RSC.
- Y. Wang, Z. Q. Shi, Y. Huang, Y. F. Ma, C. Y. Wang, M. M. Chen and Y. S. Chen, J. Phys. Chem. C, 2009, 113, 13103 CAS.
- J. Chmiola, G. Yushin, Y. Gogotsi, C. Portet, P. Simon and P. L. Taberna, Science, 2006, 313, 1760 CrossRef CAS PubMed.
- A. B. Fuertes, F. Pico and J. M. Rojo, J. Power Sources, 2004, 133, 329 CrossRef CAS.
- C. Vix-Guterl, E. Frackowiak, K. Jurewicz, M. Friebe, J. Parmentier and F. Beguin, Carbon, 2005, 43, 1293 CrossRef CAS.
- M. D. Stoller, S. J. Park, Y. W. Zhu, J. H. An and R. S. Ruoff, Nano Lett., 2008, 8, 3498 CrossRef CAS PubMed.
- D. W. Wang, F. Li, Z. S. Wu, W. C. Ren and H. M. Cheng, Electrochem. Commun., 2009, 11, 1729 CrossRef CAS.
- M. D. Stoller, C. W. Magnuson, Y. W. Zhu, S. Murali, J. W. Suk, R. Piner and R. S. Ruoff, Energy Environ. Sci., 2011, 4, 4685 CAS.
- V. Alzari, V. Sanna, S. Biccai, T. Caruso, A. Politano, N. Scaramuzza, M. Sechi, D. Nuvoli, R. Sanna and A. Mariani, Composites, Part B, 2014, 60, 29 CrossRef CAS.
- T. M. Kott, B. H. Hu, S. H. Brown and B. E. Kane, Phys. Rev. B: Condens. Matter Mater. Phys., 2014, 89, 041107 CrossRef.
- P. Brooksby, A. Farquhar, H. Dykstra, M. Waterland and A. Downard, J. Phys. Chem. C, 2015, 119, 25778 CAS.
- X. N. Shan, S. Chen, H. Wang, Z. X. Chen, Y. Guan, Y. X. Wang, S. P. Wang, H. Y. Chen and N. J. Tao, Adv. Mater., 2015, 27, 6213 CrossRef CAS PubMed.
- E. Paek, A. J. Pak and G. S. Hwang, J. Chem. Phys., 2015, 142, 024701 CrossRef PubMed.
- E. Paek, A. J. Pak and G. S. Hwang, J. Electrochem. Soc., 2013, 160, A1 CrossRef CAS.
- J. Vatamanu, X. Ni, F. Liu and D. Bedrov, Nanotechnology, 2015, 26, 464001 CrossRef PubMed.
- L. L. Zhang, X. Zhao, H. X. Ji, M. D. Stoller, L. F. Lai, S. Murali, S. Mcdonnell, B. Cleveger, R. M. Wallace and R. S. Ruoff, Energy Environ. Sci., 2012, 5, 9618 CAS.
- C. H. Zhang, L. Fu, N. Liu, M. H. Liu, Y. Y. Wang and Z. F. Liu, Adv. Mater., 2011, 23, 1020 CrossRef CAS PubMed.
- H. M. Jeong, J. W. Lee, W. H. Shin, Y. J. Choi, H. J. Shin, J. K. Kang and J. W. Choi, Nano Lett., 2011, 11, 2472 CrossRef CAS PubMed.
- H. L. Cao, X. F. Zhou, Z. H. Qin and Z. P. Liu, Carbon, 2013, 56, 218 CrossRef CAS.
- K. Wang, L. W. Li, T. Z. Zhang and Z. F. Liu, Energy, 2014, 70, 612 CrossRef CAS.
- Z. H. Wen, X. C. Wang, S. Mao, Z. Bo, H. Kim, S. M. Cui, G. H. Lu, X. L. Feng and J. H. Chen, Adv. Mater., 2012, 24, 5610 CrossRef CAS PubMed.
- B. J. Jiang, C. G. Tian, L. Wang, L. Sun, C. Chen, X. Z. Nong, Y. J. Qiao and H. G. Fu, Appl. Surf. Sci., 2012, 258, 3438 CrossRef CAS.
- L. Sun, L. Wang, C. G. Tian, T. X. Tan, Y. Xie, K. Y. Shi, M. T. Li and H. G. Fu, RSC Adv., 2012, 2, 4498 RSC.
- Y. Q. Zou, I. A. Kinloch and R. A. W. Dryfe, J. Mater. Chem. A, 2014, 2, 19495 CAS.
- W. J. Gammon, O. Kraft, A. C. Reilly and B. C. Holloway, Carbon, 2003, 41, 1917 CrossRef CAS.
- L. Y. Zhao, R. He, K. T. Rim, T. Schiros, K. S. Kim, H. Zhou, C. Gutierrez, S. P. Chockalingam, C. J. Arguello, L. Palova, D. Nordlund, M. S. Hybertsen, D. R. Reichman, T. F. Heinz, P. Kim, A. Pinczuk, G. W. Flynn and A. N. Pasupathy, Science, 2011, 333, 999 CrossRef CAS PubMed.
- S. A. Petrosyan, A. A. Rigos and T. A. Arias, J. Phys. Chem. B, 2005, 109, 15436 CrossRef CAS PubMed.
- K. Letchworth-Weaver and T. A. Arias, Phys. Rev. B: Condens. Matter Mater. Phys., 2012, 86, 075140 CrossRef.
- J. P. Perdew, K. Burke and M. Ernzerhof, Phys. Rev. Lett., 1996, 77, 3865 CrossRef CAS PubMed.
- K. F. Garrity, J. W. Bennett, K. M. Rabe and D. Vanderbilt, Comput. Mater. Sci., 2014, 81, 446 CrossRef CAS.
- H. J. C. Berendsen, J. R. Grigera and T. P. Straatsma, J. Phys. Chem., 1987, 91, 6269 CrossRef CAS.
- D. E. Smith and L. X. Dang, Chem. Phys. Lett., 1994, 230, 209 CrossRef CAS.
- H. Sun, S. J. Mumby, J. R. Maple and A. T. Hagler, J. Am. Chem. Soc., 1994, 116, 2978 CrossRef CAS.
- H. Sun, Macromolecules, 1993, 26, 5924 CrossRef CAS.
- B. Hess, C. Kutzner, D. van der Spoel and E. Lindahl, J. Chem. Theory Comput., 2008, 4, 435 CrossRef CAS PubMed.
- I. C. Yeh and M. L. Berkowitz, J. Chem. Phys., 1999, 111, 3155 CrossRef CAS.
- T. Darden, D. York and L. Pedersen, J. Chem. Phys., 1993, 98, 10089 CrossRef CAS.
- A. A. Chialvo, L. Vlcek and P. T. Cummings, J. Phys. Chem. C, 2013, 117, 23875 CAS.
- A. A. Chialvo, L. Vlcek and P. T. Cummings, J. Phys. Chem. C, 2014, 118, 19701 CAS.
- G. Feng, R. Qiao, J. S. Huang, B. G. Sumpter and V. Meunier, J. Phys. Chem. C, 2010, 114, 18012 CAS.
- C. Zhan, J. Neal, J. Wu and D. E. Jiang, J. Phys. Chem. C, 2015, 119, 22297 CAS.
- H. B. Wang, T. Maiyalagan and X. Wang, ACS Catal., 2012, 2, 781 CrossRef CAS.
- Y. H. Lu, Y. Huang, M. J. Zhang and Y. S. Chen, J. Nanosci. Nanotechnol., 2014, 14, 1134 CrossRef CAS PubMed.
- R. Lv, Q. Li, A. R. Botello-Mendez, T. Hayashi, B. Wang, A. Berkdemir, Q. Z. Hao, A. L. Elias, R. Cruz-Silva, H. R. Gutierrez, Y. A. Kim, H. Muramatsu, J. Zhu, M. Endo, H. Terrones, J. C. Charlier, M. H. Pan and M. Terrones, Sci. Rep., 2012, 2, 586 Search PubMed.
- B. Wang, L. Tsetseris and S. T. Pantelides, J. Mater. Chem. A, 2013, 1, 14927 CAS.
- E. Paek, A. J. Pak, K. E. Kweon and G. S. Hwang, J. Phys. Chem. C, 2013, 117, 5610 CAS.
- J. Vatamanu, L. L. Cao, O. Borodin, D. Bedrov and G. D. Smith, J. Phys. Chem. Lett., 2011, 2, 2267 CrossRef CAS.
- J. Vatamanu, O. Borodin and G. D. Smith, J. Phys. Chem. B, 2011, 115, 3073 CrossRef CAS PubMed.
- J. Vatamanu, O. Borodin and G. D. Smith, J. Am. Chem. Soc., 2010, 132, 14825 CrossRef CAS PubMed.
- Z. Q. Tian, S. Dai and D. E. Jiang, Chem. Mater., 2015, 27, 5775 CrossRef CAS.
| This journal is © the Owner Societies 2016 |

