 Open Access Article
Scattering resonances in the rotational excitation of HDO by Ne and normal-H2: theory and experiment†
Ricardo Manuel
García-Vázquez
 a,
Astrid
Bergeat
 *a,
Otoniel
Denis-Alpizar
 b,
Alexandre
Faure
 c,
Thierry
Stoecklin
 a and
Sébastien B.
Morales
 a
a
aUniv. Bordeaux, CNRS, ISM, 33400 Talence, France. E-mail: astrid.bergeat@u-bordeaux.fr
bGrupo de Investigación en Física Aplicada, Instituto de Ciencias Aplicadas, Facultad de Ingeniería, Universidad Autónoma de Chile, 7500912 Santiago, Chile
cUniv. Grenoble Alpes, CNRS, IPAG, 38000 Grenoble, France
First published on 1st February 2024
Abstract
The rotational excitation of a singly deuterated water molecule (HDO) by a heavy atom (Ne) and a light diatomic molecule (H2) is investigated theoretically and experimentally in the near-threshold regime. Crossed-molecular-beam measurements with a variable crossing angle are compared to close-coupling calculations based on high-accuracy potential energy surfaces. The two lowest rotational transitions, 000 → 101 and 000 → 111, are probed in detail and a good agreement between theory and experiment is observed for both transitions in the case of HDO + Ne, where scattering resonances are however blurred out experimentally. In the case of HDO + H2, the predicted theoretical overlapping resonances are faithfully reproduced by experiment for the 000 → 111 transition, while the calculated strong signal for the 000 → 101 transition is not detected. Future work is needed to reconcile this discrepancy.
1 Introduction
Water ranks as the third most abundant neutral molecule in the interstellar medium, behind H2 and CO. Consequently, H2O and its isotopologues, D2O and HDO, have been observed in different environments and play a key role in the oxygen and deuterium chemistry of star- and planet-forming regions.1–3 Due to the water sublimation temperature, water is mainly frozen as ice in cold clouds and becomes abundant in the gas phase at higher temperatures, which defines the snowline.4 Similarly, water can be produced in the gaseous phase or on the surface of interstellar dust grains in the coldest regions.1 Deuterated water (HDO), on the other hand, is formed mainly on dust grains in cold clouds prior to core collapse.1,5–7 As a result, the HDO/H2O ratio varies significantly depending on the environment, rendering it a potent tracer of water chemistry and history.1,2,5,8 Recently, HDO was detected in a young proto-planetary disk, V883, in the molecular clouds of Orion, using the Atacama Large Millimeter/Submillimeter Array (ALMA).6 The HDO emission lines were observed at 225.89672 and 241.561550 GHz, which correspond to the 312 → 221 and 211 → 212 rotational transitions, respectively.Accurate comprehension of how energy is exchanged between the kinetic energy of the gas and H2O or HDO molecules is a key parameter for modelling astrophysical observations. It is essential to determine the effective cross-sections of inelastic collisions with the main interstellar neutral species, such as H2 and He. They can be calculated theoretically over a wide range of collision energies. However, the most demanding test is the comparison of these calculations with experiments at the threshold of water's internal energy transitions. We conducted studies on inelastic collisions of HDO with H2 within this framework, while those on the other isotopologues of water were already published.9–11 As the inelastic cross sections of HDO with helium will experimentally be too small,12 we opted to simulate the study of isotopologues of water with atom, using neon.
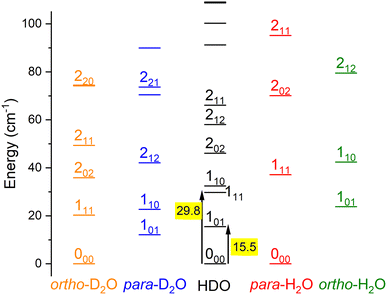
Water is an asymmetric top molecule, and its rotational levels are conventionally labelled jka,kc where j is the rotational angular momentum quantum number (see Fig. 1). The pseudo-quantum numbers ka and kc are formally the projections of the rotational angular momentum vector along the principal inertia axes a and c, respectively. Considering the nuclear spins of H (I = ½) and D (I = 1), the water molecules H2O and D2O have two nuclear spin modifications, labelled ortho and para. The sum ka + kc for H2O(D2O) is even(odd) for para and odd(even) for ortho levels. It should be noted that the para and ortho levels do not interconvert in inelastic collisions. For HDO, this ortho/para modification does not apply and all HDO levels are collisionally connected. The HDO rotational constants for the ground vibrational state were taken as A = 23.41395 cm−1, B = 9.10340 cm−1, and C = 6.40628 cm−1.13 The H2 molecule also has two fermionic nuclei and the para and ortho rotational levels correspond to the even and odd values of its angular momentum jH2, respectively. Normal-H2 is a mixture of ortho- and para-H2, considering there is a Boltzmann distribution of the rotational levels in the ortho or para forms at the surrounding temperature, but a spin temperature is maintained at room temperature, as the ortho-to-para conversion is extremely slow. The ortho-to-para ratio in normal-H2 is thus 3![[thin space (1/6-em)]](https://www.rsc.org/images/entities/char_2009.gif) :
:![[thin space (1/6-em)]](https://www.rsc.org/images/entities/char_2009.gif) 1.
1.
Previous theoretical studies of the HDO–H2 interactions are extensive.11,14 Faure et al.14 published the first rotational rate constants in the range 5–300 K. The calculations were recently improved11 and radiative transfer calculations based on the new rate constants have shown that the HDO line at 225.9 GHz (312 → 221) observed by ALMA towards the V883 Ori proto-planetary disk6 is a weak maser.11 It should be noticed that all the above studies rely on the full nine-dimensional potential energy surface (PES) computed by Valiron et al.33 for the H2O–H2 system and adapted for all water isotopes.15 Theoretical calculations using this PES were compared to the only previous experimental study16 on the rotational inelastic collisions between HDO and normal-H2 or para-H2. The differential cross sections (DCSs) were observed by Sarma et al.16 at collision energies of 580 cm−1 and 440 cm−1. A good agreement was found between experiment and theory for the 000 to 111, 212, 221 and 220 transitions. To the best of our knowledge, there are no previous theoretical calculations or experiments on the HDO–Ne system.
The paper is organised as follows. Section 1 outlines the experimental setup and the procedure used. In Section 2, we describe the theoretical calculations for the HDO–Ne system and summarise those for the HDO–H2 system previously published.11 Details on the PES for the HDO–Ne system are given in Section 3. The theoretical integral cross-sections (ICSs), as well as DCSs for different rotational transitions of HDO (000 and 101) scattered by Ne, are presented in section 3. In this section, a comparison of experimental and calculated integral cross-sections (ICSs) for the 000 to 101 or 111 transitions at the thresholds for HDO scattered by Ne and normal-H2 is also shown.
2 Experiments
2.1 Experimental set-up
Inelastic collisions down to low collision energies can be studied under single-collision conditions with the crossed-molecular-beam experiment in Bordeaux.17 The angle between the two molecular beams generated in two different chambers is variable. This allows the collision energy between the molecules to vary:18 the lowest value is for the lowest angle when the reactant beams have almost the same velocity. The molecules are then probed by a time-of-flight mass spectrometer (TOF-MS) following resonance-enhanced multiphoton ionization (REMPI).The HOD beam was formed by expanding water vapour seeded in neon as a carrier gas through an Even–Lavie valve at 320 K from a high-pressure reservoir (11 bar), which contained a mixture with equal amounts of H2O and D2O maintained at a temperature of 45 °C. The carrier gas is neon to ensure better cooling of the water molecules.9 Supersonic expansion by a second Even–Lavie pulsed valve at 300 K produced a pure Ne molecular beam. However, the two beams do not have exactly the same velocities due to the different valve temperatures and geometry of the two chambers: hence, the supersonic expansion efficiencies differ slightly.18 The H2 molecular beam was also generated in the second chamber, with the valve cryo-cooled at a setpoint of 50 K, allowing decreasing the beam velocity and rotationally cooling down the H2. As there is no ortho-to-para conversion, the normal-H2 beam remains a mixture of para- and ortho-H2 with the room temperature ratio, i.e., 1![[thin space (1/6-em)]](https://www.rsc.org/images/entities/char_2009.gif) :
:![[thin space (1/6-em)]](https://www.rsc.org/images/entities/char_2009.gif) 3. The normal-H2 beam is thus composed of 25% H2 (jH2 = 0) and 75% H2 (jH2 = 1).9 The beam properties were inferred from measurements at the crossing point and 393.3 mm downstream, as explained previously,19,20 and are reported in Table 1.
3. The normal-H2 beam is thus composed of 25% H2 (jH2 = 0) and 75% H2 (jH2 = 1).9 The beam properties were inferred from measurements at the crossing point and 393.3 mm downstream, as explained previously,19,20 and are reported in Table 1.
| Beam | Velocitya | Velocity spreada HWHM | Pulse durationb HWHM | Angular spreadc HWHM |
|---|---|---|---|---|
| a Beam velocity peak values and half width at half maximum (HWHM) of the velocity spread deduced from temporal profiles at the crossing point and 393.3 mm downstream. b Pulse duration (HWHM) at the crossing point. c Angular divergence (HWHM). | ||||
| HOD in Ne at 320 K | 828 ± 10 m s−1 | 16 m s−1 | 26 μs | 0.9° |
| Ne at 300 K | 801 ± 9 m s−1 | 26 m s−1 | 15 μs | 1.2° |
| n-H2 at 50 K | 1174 ± 13 m s−1 | 34 m s−1 | 7 μs | 1.4° |
The HOD rotational populations in the supersonic beam were measured using (2 + 1) REMPI at ca. 248 nm, via the C1B1 Rydberg state.21 Laser pulse energies of 2–5.5 mJ per pulse at a repetition rate of 10 Hz were generated by doubling the output of a dye laser operating with Coumarin 500 dye in ethanol, pumped by the third harmonic (355 nm) of a Nd:YAG laser. The laser beam was directed perpendicular to the collision plane and a wavemeter was used to monitor the wavelength. The output of the frequency-doubled dye laser was monitored with a photodiode to select data acquired with a laser pulse energy at ±20% of the mean.
2.2 Excitation functions: acquisition and data treatment
A typical REMPI spectrum of the HDO beam is presented in Fig. 2. A simulation of the experimental spectrum performed with pGopher22 software and the spectroscopic data of Yang et al.21 leads to the conclusion that HOD is mainly in the ground electronic, vibrational and rotational state (98.8%) and only 1.2% of the molecules are in the first excited rotational state, 101, which corresponds to a rotational temperature of 5 K. In some experiments, a slightly higher ratio of excited HDO was found (<5%).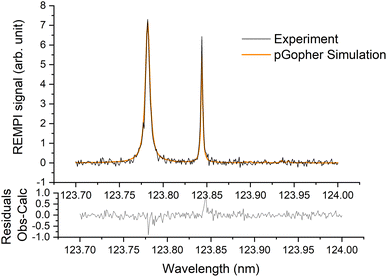 | ||
| Fig. 2 Experimental (in black) and simulated (in orange) (2 + 1) REMPI spectra of the C1B1, v′ = 0 ← X1A1, v = 0 transition of HDO in the supersonic beam. See Yang et al.21 for more details. | ||
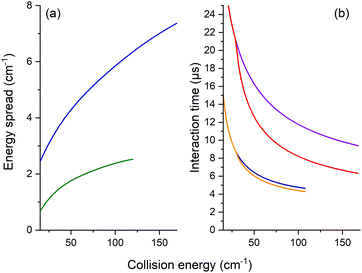
The REMPI signal of HOD (111 or 101) is then acquired as a function of the angle, θ, between the two beams. To minimize background contributions from any rotationally excited molecules in the water beam or the main chamber, the H2 or Ne beam was triggered at 5 Hz, with signals averaged in alternating pulse mode and recorded as two intensities: signal and background. The experimental ICSs in arbitrary units, σ, were then obtained from the subtraction of these averaged REMPI signal intensities over 5000 to 10![[thin space (1/6-em)]](https://www.rsc.org/images/entities/char_2009.gif) 000 data. To take into account the density-to-flux transformation under our work conditions,20 the values were divided by the relative velocity of the water and H2 or Ne beams and the mean interaction time between the two beam pulses, considering a forward angular distribution of scattered water molecules as demonstrated later by the theory for the HOD + Ne system. This conversion is described in detail in ref. 17 and 20. In Fig. 3, the mean interaction time corrections are presented versus the collision energy. We note that the angular distribution (forward or isotropic) was found to have an almost negligible impact in the case of HOD + normal-H2, contrary to the HDO + Ne system.
000 data. To take into account the density-to-flux transformation under our work conditions,20 the values were divided by the relative velocity of the water and H2 or Ne beams and the mean interaction time between the two beam pulses, considering a forward angular distribution of scattered water molecules as demonstrated later by the theory for the HOD + Ne system. This conversion is described in detail in ref. 17 and 20. In Fig. 3, the mean interaction time corrections are presented versus the collision energy. We note that the angular distribution (forward or isotropic) was found to have an almost negligible impact in the case of HOD + normal-H2, contrary to the HDO + Ne system.
Moreover, for comparison with the experiment, the theoretical values were convoluted with the experimental collision-energy spread presented in Fig. 3. The poor collision-energy spread for the HDO + Ne system is due to the reduced mass, which is 9.746 a.m.u. in this case compared to 1.822 a.m.u. for the HDO + H2 system. The convolution with the experimental collision-energy spread was computed from the interpolated calculated cross-sections. A short sensibility test was carried out, by changing each experimental parameter used to calculate the density-to-flux transformation and the experimental collision-energy spread. The energy resolution depends mainly on the beam velocity spreads and the pulse duration of the Ne or H2 beam. The product of the relative velocity and the interaction time was essentially sensitive to the beam angular spreads, the beam velocities and the pulse duration of the Ne or H2 beam. The influences of the other experimental characteristics remain within the statistic experimental error bars. Also reported on the experimental ICSs are the energy uncertainties due to the uncertainties in the beam velocities and the beam angle. These collision-energy uncertainties will just shift the excitation functions on the collision-energy scale.
3 Theoretical calculations
3.1 HOD + Ne potential energy surface
The coordinates employed for describing the potential energy surface (PES) of the HOD–Ne complex are shown in Fig. 4. R connects the centre of mass of the HOD molecule with Ne, θ is the angle between the z-axis and R, and φ is the azimuthal angle. The interatomic distances and bending angle of the HOD molecule are set to the vibrationally averaged values in the ground state (rOH = 0.9727 Å, rOD = 0.9684 Å and γ = 104.34°).15 The ab initio calculations were performed at the explicitly correlated coupled-cluster level of theory, including single, double and perturbative triple excitations (CCSD(T)-F12),23 together with the cc-pVTZ-F12 and cc-pVQZ-F12 basis sets.24 The energies at the completed basis set (CBS) limit were determined using the two-point extrapolation formula:25where X = 4 and Y = 3 are the cardinality of the basis set. All the ab initio energies were computed with the MOLPRO package.26
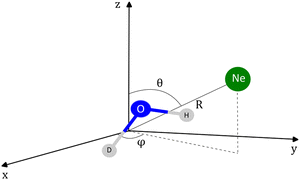 | ||
| Fig. 4 Coordinates employed in the description of the HOD + Ne system. The origin of the coordinate system corresponds to the center of mass of the HDO molecule. | ||
A grid of 6175 energies at the CBS limit was computed for the system. The grid includes 25 R values from 1.5 Å to 10.0 Å, with θ and φ varying from 0° to 180° in steps of 10° and 15°, respectively. It should be noted that for certain angular configurations, ab initio calculations could not produce energies for a few low R values due to the proximity of Ne and the atoms within the triatomic molecule. Consequently, local extrapolation was utilized.
The grid of energies was fitted to an analytical function, like the one used for H2S + He27 and H2O/D2O + Ne,28 with the angular part expressed as the product of normalized associated Legendre functions ![[P with combining macron]](https://www.rsc.org/images/entities/i_char_0050_0304.gif) lm(cos
lm(cos![[thin space (1/6-em)]](https://www.rsc.org/images/entities/char_2009.gif) θ) and cosine functions:
θ) and cosine functions:
The vlm(R) coefficients were computed from a least-squares procedure and fitted using the reproducing kernel Hilbert space (RKHS) method,29 using:
with R< and R> defining the lower and larger values, respectively, between R and Rk. The αklm coefficients were computed by solving the linear equation system q(Rk,Rk′)αlm = vlm(Rk), where k and k′ label different radial configurations of the grid. The van der Waals ∼R−6 long-range behaviour is ensured using the q2,5(R,Rk) kernel.
3.2 HOD + Ne dynamical calculations
The Newmat code30 was used to carry out the dynamical calculations of the HOD + Ne system. As in our previous work on H2O/D2O + Ne,28 the rotational eigenfunctions and eigenenergies were determined by diagonalizing the rigid rotor Hamiltonian of an asymmetric top molecule:| Hrot = Axjx2 + Ayjy2 + Azjz2 |
In the usual symmetrised basis set:
The basis set includes 7 values of HDO rotational angular momentum (0 ≤ j ≤ 6), which leads to energies up to 872.77 cm−1. We carried out scattering calculations within the collision-energy range of [15.5, 315.5] cm−1, utilizing 0.1 cm−1 steps for energies below 115.5 cm−1 and 1 cm−1 steps above. The log derivative method32 was used to propagate the radial wave functions for 3.0 ≤ R ≤ 20a0 (a0 is the Bohr radius). The relative convergence of the cross sections as a function of the total angular momentum J was imposed to be better than 10−3, leading to a maximum value of J = 66 for the maximum energy value investigated. The reduced mass of the HDO–Ne system is 9.747![[thin space (1/6-em)]](https://www.rsc.org/images/entities/char_2009.gif) 406 a.m.u.
406 a.m.u.
3.3 HDO + H2 dynamical calculations
Scattering quantum close-coupling calculations of the rotational inelastic cross sections were previously published by Faure et al.11 to provide rate constants over a large kinetic temperature range (5–300 K). For this study, the same V08 PES of Valiron et al.33 was used, but more refined scattering calculations were performed. The calculations were conducted at the quantum close-coupling level with the MOLSCAT program.34 The rigid-rotor PES for HDO–H2 was derived from the full-dimensional (9D) PES of H2O–H2 determined at the CCSD(T) level of theory and further refined with higher-accuracy explicitly correlated CCSD(T)-R12 calculations.33 To provide precise descriptions of the rotational thresholds and resonances, calculations were conducted up to total energies of 220 cm−1 with a grid increment of 0.25 cm−1. Cross sections for normal-H2 were obtained through calculations for the ground para-(jH2 = 0) and ortho-(jH2 = 1) states of H2 and an ortho-to-para ratio of 3 was employed. The highest HDO rotational angular momentum in the basis set was jHDO = 5, while two rotational levels of H2 were included for the para-(jH2 = 0, 2) and ortho-(jH2 = 1, 3) symmetries of H2. In the calculations of Faure et al.,11 total energies of up to 2000 cm−1 (with a less-fine energy grid) were considered, but the level jH2 = 3 of ortho-H2 was neglected. The inclusion of this level was found to be important for a very detailed description of resonances in this work. The maximum value of the total angular momentum J used in the calculations was J = 37 at the highest collisional energy. The value of the H2 rotational constant was B0 = 59.322 cm−1. Finally, the reduced mass of the system HDO–H2 was calculated to be 1.82252 a.m.u.4 Results and discussion
4.1 HDO + Ne PES
The accuracy of the fitting procedures was assessed by measuring the root-mean-square deviation (RMSD). The RMSD for negative energies was determined to be 8.5 10−4 cm−1. Subsequently, the RMSD values obtained for energy intervals of [0, 1000] cm−1 and [1000, 10![[thin space (1/6-em)]](https://www.rsc.org/images/entities/char_2009.gif) 000] cm−1 were 7.7 10−2 cm−1 and 25.6 cm−1 correspondingly.
000] cm−1 were 7.7 10−2 cm−1 and 25.6 cm−1 correspondingly.
The global minimum of the system is located in a deuterium-bonded configuration that is linear (−65.15 cm−1, at R = 3.17 Å, θ = 73°, φ = 0°). From a comparison with the minima found for H2O and D2O systems in our previous work28 (see Table 2), we notice that these three stationary points are very close in geometrical configuration and well depth. Nevertheless, it should be noted that despite the similarities observed among the three minima in the PES, the most significant changes in the dynamics are determined by other features such as the shape of the barriers and the anisotropy.
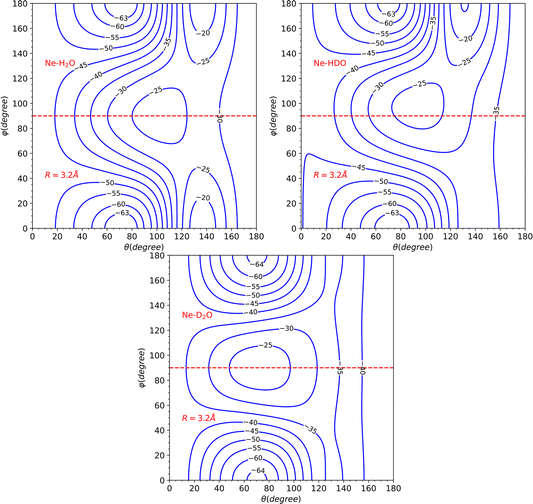
The topological variations amongst the systems can be more effectively visualized through Fig. 5. This displays a contour plot of the three systems, with R = 3.2 Å. To aid discussion of PES changes resulting from the H/D interchange, a red dashed line at φ = 90° has been included. From the plot of HDO, which corresponds to the top-right plot of Fig. 5, it can be observed that the contour lines behave similarly to those of H2O, for the interval of 90°≤ φ ≤ 180°, which corresponds to the Ne atom approaching the H atom. The latter half of the interval for 0° ≤ φ ≤ 90°, however, displays more variations compared to the D2O system, implying that the system's dynamics will bear more similarities to that of H2O.
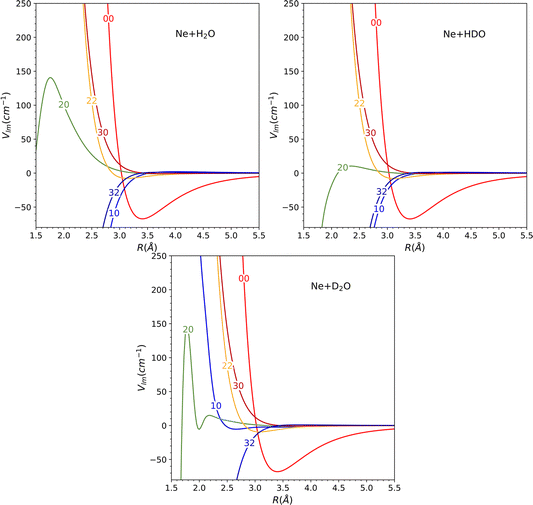
This hypothesis receives further support by comparing the vlm(R) coefficients (refer to Fig. 6). For the H2O and HDO system, the l = 2, m = 0 partial wave exhibits the only marked difference, while for D2O, the l = 1, m = 0 partial wave differs significantly, being repulsive instead of attractive as seen for the water and singly-deuterated water systems. We should note that only even m partial waves are presented, since they are the only ones observed in the H2O and D2O systems. This is due to the fact that the molecule exhibits C2v symmetry in these two cases. However, the inclusion of the odd m coefficients in the HDO PES expansion, which were not depicted in the plot to facilitate comparison, is likely to result in significant variations in the dynamics.
4.2 HDO + Ne inelastic collisions
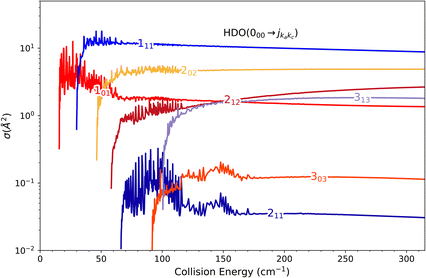
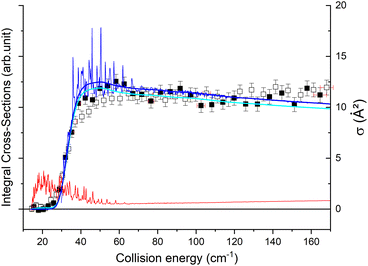
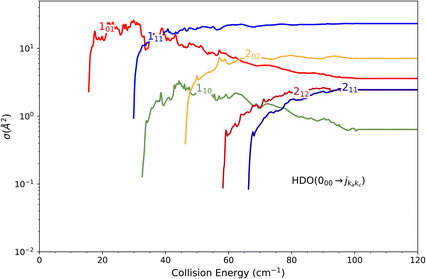
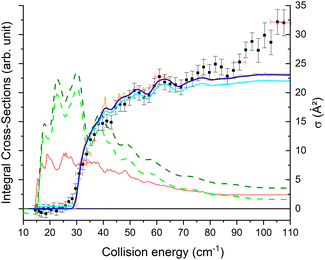
The theoretical calculations focus on exciting the fundamental rotational level 000 and the related transitions for exciting and relaxing from the first excited rotational state, 101. This is due to the experimental probing of only the first two excited rotational levels, 101 and 111.To compare the theoretical data with the experimental results shown in Fig. 8, we applied the experimental collision-energy spread to the theoretical cross-sections. Moreover, the experimental ICSs were scaled by one factor so that the area in the [30–165] cm−1 range is the same as for the theoretical ICS calculated. It should be noted that in the HDO beam, more than 95% of the population was in the ground rotational state. Therefore, when the 111 level was probed, the main contribution originated from the 111 ← 000 transition. The experiment successfully reproduced the transition threshold at 29.75 cm−1, but the calculated resonance features were blurred out in the experimental ICSs due to the energy spread. To verify the reproducibility, two sets of experimental data were recorded at different periods of the year: the disparity in values was, however, mainly due to fluctuations in the laser power (as well as humidity in the laboratory). This might also explain why the experimental values exceed the theoretical cross-sections above 120 cm−1 (as the experimental acquisition was always carried out from the highest beam angle to the lowest angle).
where τ = ka − kc,′
![[R with combining circumflex]](https://www.rsc.org/images/entities/i_char_0052_0302.gif) = (θ,φ) and
= (θ,φ) and  , while (j′,τ′) and (j,τ) define the final and initial level of the HDO molecule. f(j′τ′ ← jτ|
![[R with combining circumflex]](https://www.rsc.org/images/entities/i_char_0052_0302.gif) ) is the scattering amplitude, which, in the case of the collision between a rigid asymmetric top and an atom, is defined as:
) is the scattering amplitude, which, in the case of the collision between a rigid asymmetric top and an atom, is defined as:where
 are the transition matrix elements at a given collision energy and
  is a spherical harmonic function.
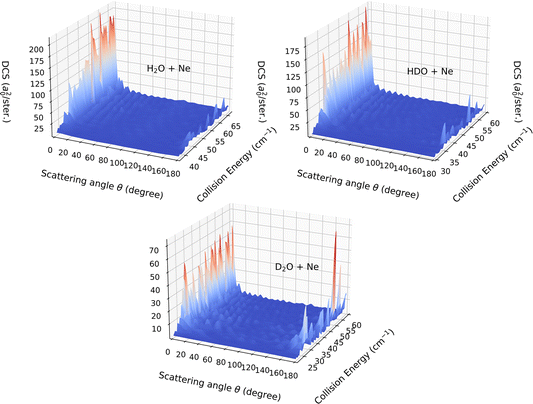
In the present paragraph dedicated to the DCS associated with the 111 ← 000 transition, we extend the comparison between the HDO, H2O and D2O systems. The collision-energy ranges used to calculate the DCS were [37.5, 67.0] cm−1, [30.0, 60.0] cm−1 and [21.0, 60.0] cm−1 for H2O, HDO and D2O, respectively. The choice of the energy interval allows a near-threshold study for each system.
Fig. 9 displays the computed DCSs. For the entire energy interval under consideration, the DCSs are observed to be strongly forward peaked for collisions with deuterated water (HDO) and H2O, while significant back-scattering contributions are noted for collisions with D2O. The uniqueness of the latter system stems from the v10(R) potential term, which is the only relevant vlm(R) term for this transition. As seen in Fig. 6, it is entirely attractive and primarily contributes to the forward-scattering direction for both H2O and HDO. For D2O, however, this interaction is predominantly repulsive, with a minor potential well of around 5 cm−1 depth, the repulsion being a significant contributor to the backward-scattering phenomenon.
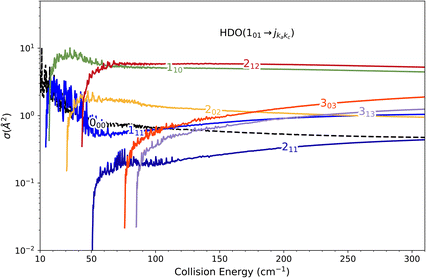
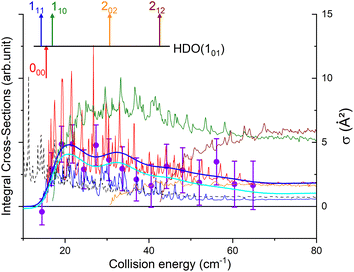
Direct comparison with the experiment is not possible as the HDO beam may contain water in its first excited rotational state 101. To obtain the effective ICSs, it is thus necessary to combine the state-to-state calculated cross-sections. The HDO (101) formation is due to the 101 ← 000 transition, weighted by 1 or 0.95, depending on the ground HDO rotational level population. When there is 5% rotationally excited HDO in the water beam, HDO (101) also disappears due to the transitions from this 101 level to the fundamental level or all the excited levels up to 212. The sum of these cross-sections is therefore subtracted with a weight of 0.05 from the HDO (101) production cross-section. The effective ICSs are then convolved with the experimental energy dispersion. The two computed excitation functions shown in Fig. 11 thus correspond, respectively, to the two extreme scenarios: the presence of 0% or 5% HDO in state 101 in the water beam. Although the statistical uncertainties at 95% confidence remain high, due to the low HDO (101) intensity detected, the two undulations due to resonances predicted by theory can be seen. To verify the ratio of effective cross-sections between the 101 to the 111 states, a study at 44 cm−1 was carried out. Some of the experimental data used are presented in the ESI file.† REMPI intensities were acquired from both levels 101 and 111 while maintaining perfectly identical experimental conditions, with the exception of MCP amplification and the wavelength of the ionizing laser (its power having varied very little between the 2 wavelengths). The ratio of 101 to 111 population variations due to HDO + Ne collisions is roughly 0.2, with a relative uncertainty of 50%. This was deduced from pGopher simulations with the spectroscopic data from Yang et al.21 The ratio of the effective theoretical cross-sections convolved with the experimental energy dispersion at this collision energy is found to be in the range of 0.196 to 0.248 (depending on the population in state 101 in the beam).
4.3 HDO + H2 inelastic collisions
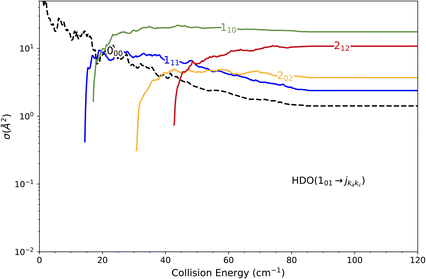
The state-to-state cross sections for the experimental energy range are displayed in Fig. 12. The HDO + normal-H2 cross sections are similar in magnitude to those of the HDO + Ne system, except for the 101 ← 000 transition, which is approximately 5 times stronger at the peak when averaged over resonances. Moreover, for the HDO + normal-H2 system, sharp resonances are not observed, in contrast to the HDO + Ne system. These differences can be rationalized by the fact that the well for HDO–Ne is 65 cm−1 deep, whereas for HDO–H2 it is 237 cm−1. In the normal-H2 system, it is also relevant to consider the angular momentum (and quadrupole) of H2(jH2 = 1). Consequently, more scattering resonances may be found when H2 is the collider, and their overlap broadens the excitation function in the HDO + normal-H2 system. In the case of HDS + H2,35 the 101 ← 000 transition has an effective maximum cross-section whose magnitude is close to that of the 111 ← 000 transition, as observed here for HDO + H2.Experimentally, a weak signal from the 101 rotational level is clearly visible when probing the water beam, indicating the presence of HDO in its first excited rotational state, mainly on the border of the water gas pulse (see the ESI file).† Nonetheless, no increase is detectable when colliding with normal-H2. This leads us to the conclusion that the cross-section for the 101 ← 000 transition should be lower than about 7 Å2 (our limit for the HDO + Ne system), which is a factor of 2–3 lower than the theoretical value. In Fig. 13, a simulation of the excitation function has been carried out, taking into account the experimental dispersion of the energy and the population and depopulation of the 101 rotational state (theoretical state-to-state cross-sections are reported in Fig. 14), as carried out for the HDO + Ne system. The simulation also considered two scenarios: initial 101 state populations of 0% and 5% in the beam. The maximum in the cross-section for the 101 ← 000 transition is still of the same order of magnitude as the 111 ← 000 cross-sections, in disagreement with our lack of experimental signal. In contrast, the agreement between theory and experiment is excellent when probing the 111 state (Fig. 13). The transition threshold is replicated accurately and the ICS oscillations caused by overlapping resonances are in perfect concordance up to about 80 cm−1. For comparison, the experimental data have been normalised with a single rescaling value corresponding to the cross-section at 51.6 cm−1. It also indicates that the water beam contains less than 5% HDO in the first excited 101 state: there is no signal below 25 cm−1 collision energy. The excellent agreement between theory and experiment for the 111 ← 000 ICSs makes the disagreement for the 101 ← 000 even more puzzling. Moreover, for collision energies above 80 cm−1, it can be noticed that the experimental 111 ← 000 cross-section is significantly larger than the theoretical prediction. In this collision-energy regime, a large resonance is, however, not expected. More experimental acquisitions are needed to reduce the error bars. In conclusion, in both cases, additional work is clearly necessary to reconcile these discrepancies.
5 Conclusions
Scattering resonances in the rotational excitation of HDO by Ne and normal-H2 were studied through a joint theoretical and experimental approach. For the 111 ← 000 transition of HDO + Ne collisions, a good agreement was found for the overall shape of the cross-sections and the near-threshold rise, but the large experimental collision-energy spread due to the reduced mass of the system did not allow us to see the calculated resonances. In the case of the 101 ← 000 transition, even if the experimental signal was in the noise, the small undulations due to resonances were nicely reproduced by the calculations. Moreover, this system afforded the supplementary opportunity to theoretically compare the collisions of Ne with the three water isotopes, H2O, D2O, and HDO. We discovered that HDO and H2O produce very similar outcomes, whereas D2O differs from the other two. From this perspective, we demonstrated that straightforward reasoning, hinging on the symmetry of the potential terms vlm(R), facilitated the comprehension of the scattering outcomes. In the case of HDO + normal-H2, an excellent agreement was found for the 111 ← 000 cross-section between the theoretical and experimental results. However, for the 101 ← 000 cross-section, theory predicted an effective maximum cross-section whose magnitude is close to that of the 111 ← 000 transition, although no signal was experimentally detected. Thus, additional work is clearly necessary to reconcile this discrepancy.Author contributions
All the authors have participated in the investigation, validation and writing. RMGV, AB, ODA, AF and TS carried out the formal analysis of the theoretical and experimental data. AB, ODA, AF and TS acquired the funding.Conflicts of interest
There are no conflicts to declare.Acknowledgements
This research was supported by the French Agence Nationale de la Recherche (ANR-Waterstars), grant number ANR-20-CE31-0011, and by the ECOS-SUD Project C22E02. We are grateful to students Maeva Louis and Karlis Dzenis for their contributions to some experimental data acquisition. Computer time for the study of the HOD + Ne collision was provided by the Mésocentre de Calcul Intensif Aquitaine computing facilities of the Université de Bordeaux and Université de Pau et des Pays de l'Adour. The H2O + H2 computations were performed using the GRICAD infrastructure (https://gricad.univ-grenoble-alpes.fr), which is supported by Grenoble research communities.References
- E. F. van Dishoeck, et al. , Astron. Astrophys., 2021, 648, A24, DOI:10.1051/0004-6361/202039084.
- J. L. Neill, S. Wang, E. A. Bergin, N. R. Crockett, C. Favre, R. Plume and G. J. Melnick, Astrophys. J., 2013, 770, 142, DOI:10.1088/0004-637X/770/2/142.
- K. Furuya, E. F. van Dishoeck and Y. Aikawa, Astron. Astrophys., 2016, 586, A127, DOI:10.1051/0004-6361/201527579.
- I. Kamp, et al. , Faraday Discuss., 2023, 245, 112, 10.1039/d3fd00013c.
- A. Andreu, A. Coutens, F. Cruz-Sáenz de Miera, N. Houry, J. K. Jørgensen, A. Kóspál and D. Harsono, Astron. Astrophys., 2023, 677, L17, DOI:10.1051/0004-6361/202347484.
- J. J. Tobin, M. L. R. van't Hoff, M. Leemker, E. F. van Dishoeck, T. Paneque-Carreño, K. Furuya, D. Harsono, M. V. Persson, L. I. Cleeves, P. D. Sheehan and L. Cieza, Nature, 2023, 615, 227, DOI:10.1038/s41586-022-05676-z.
- M. Sewiło, et al. , Astrophys. J., 2022, 933, 64, DOI:10.3847/1538-4357/ac6de1.
- L. Yang, F. J. Ciesla and C. M. O. 'D. Alexander, Icarus, 2013, 226, 256, DOI:10.1016/j.icarus.2013.05.027.
- (a) A. Bergeat, A. Faure, L. Wiesenfeld, C. Miossec, S. B. Morales and C. Naulin, Molecules, 2022, 27, 7535, DOI:10.3390/molecules27217535; (b) A. Bergeat, S. B. Morales, C. Naulin, A. Faure and L. Wiesenfeld, Phys. Rev. Lett., 2020, 125, 143402, DOI:10.1103/PhysRevLett.125.143402.
- A. Bergeat, A. Faure, S. B. Morales, A. Moudens and C. Naulin, J. Phys. Chem. A, 2020, 124, 259, DOI:10.1021/acs.jpca.9b04753.
- A. Faure, M. Żółtowski, L. Wiesenfeld, F. Lique and A. Bergeat, Mon. Not. R. Astron. Soc., 2024, 527, 3087, DOI:10.1093/mnras/stad3037.
- S. Green, Astrophys. J., Suppl. Ser., 1989, 70, 813, DOI:10.1086/191358.
- H. M. Pickett, R. L. Poynter, E. A. Cohen, M. L. Delitsky, J. C. Pearson and H. S. P. Müller, J. Quant. Spectrosc. Radiat. Transf., 1998, 60, 883, DOI:10.1016/S0022-4073(98)00091-0.
- A. Faure, L. Wiesenfeld, Y. Scribano and C. Ceccarelli, Mon. Not. R. Astron. Soc., 2012, 420, 699, DOI:10.1111/j.1365-2966.2011.20081.x.
- L. Wiesenfeld, Y. Scribano and A. Faure, Phys. Chem. Chem. Phys., 2011, 13, 8230, 10.1039/c0cp02591g.
- G. Sarma, C.-H. Yang, A. Kumar Saha, D. H. Parker and L. Wiesenfeld, J. Chem. Phys., 2013, 138, 024314, DOI:10.1063/1.4772600.
- (a) S. Chefdeville, T. Stoecklin, A. Bergeat, K. M. Hickson, C. Naulin and M. Costes, Phys. Rev. Lett., 2012, 109, 023201, DOI:10.1103/PhysRevLett.109.023201; (b) S. Chefdeville, T. Stoecklin, C. Naulin, P. Jankowski, K. Szalewicz, A. Faure, M. Costes and A. Bergeat, Astrophys. J. Lett., 2015, 799, L9, DOI:10.1088/2041-8205/799/1/L9.
- M. Lara, F. Dayou, J.-M. Launay, A. Bergeat, K. M. Hickson, C. Naulin and M. Costes, Phys. Chem. Chem. Phys., 2011, 13, 8127, 10.1039/C0CP02705G.
- A. Bergeat, S. B. Morales, C. Naulin, J. Kłos and F. Lique, Front. Chem., 2019, 7, 164, DOI:10.3389/fchem.2019.00164.
- C. Naulin and A. Bergeat, Cold Chemistry: Molecular Scattering and Reactivity Near Absolute Zero, ed. O. Dulieu and A. Osterwalder, The Royal Society of Chemistry, 2017, ch. 3, p. 92, 10.1039/9781782626800.
- C.-H. Yang, G. Sarma, J. J. ter Meulen, D. H. Parker and C. M. Western, Phys. Chem. Chem. Phys., 2010, 12, 13983, 10.1039/c0cp00946f.
- C. M. Western, J. Quant. Spectrosc. Radiat. Transf., 2017, 186, 221, DOI:10.1016/j.jqsrt.2016.04.010.
- G. Knizia, T. B. Adler and H.-J. Werner, J. Chem. Phys., 2009, 130, 054104, DOI:10.1063/1.3054300.
- K. A. Peterson, T. B. Adler and H. J. Werner, J. Chem. Phys., 2008, 128, 084102, DOI:10.1063/1.2831537.
- A. Halkier, W. Klopper, T. Helgaker, P. Jorgensen and P. R. Taylor, J. Chem. Phys., 1999, 111, 9157, DOI:10.1063/1.479830.
- H.-J. Werner, P. J. Knowles, G. Knizia, F. R. Manby and M. Schütz, Wiley Interdiscip. Rev. Comput. Mol. Sci., 2012, 2, 242, DOI:10.1002/wcms.82.
- O. Denis-Alpizar and T. Stoecklin, Astron. Astrophys., 2020, 638, A31, DOI:10.1051/0004-6361/202037821.
- R. M. García-Vázquez, O. Denis-Alpizar and T. Stoecklin, J. Phys. Chem. A, 2023, 127, 4838, DOI:10.1021/acs.jpca.3c02086.
- T. S. Ho and H. Rabitz, J. Chem. Phys., 1996, 104, 2584, DOI:10.1063/1.470984.
- T. Stoecklin, O. Denis-Alpizar, A. Clergerie, P. Halvick, A. Faure and Y. Scribano, J. Phys. Chem. A, 2019, 123, 5704, DOI:10.1021/acs.jpca.9b04052.
- B. A. Voronin, J. Tennyson, R. N. Tolchenov, A. A. Lugovskoy and S. N. Yurchenko, Mon. Not. R. Astron. Soc., 2010, 402, 492, DOI:10.1111/j.1365-2966.2009.15904.x.
- D. E. Manolopoulos, J. Chem. Phys., 1986, 85, 6425, DOI:10.1063/1.451472.
- P. Valiron, M. Wernli, A. Faure, L. Wiesenfeld, C. Rist, S. Kedžuch and J. Noga, J. Chem. Phys., 2008, 129, 134306, DOI:10.1063/1.2988314.
- J. M. Hutson and S. Green, Astrophysics Source Code Library, 2012, record ascl: 1206.004 Search PubMed.
- P. J. Dagdigian, Mon. Not. R. Astron. Soc., 2022, 511, 3440, DOI:10.1093/mnras/stac216.
Footnote |
| † Electronic supplementary information (ESI) available. See DOI: https://doi.org/10.1039/d3fd00168g |
| This journal is © The Royal Society of Chemistry 2024 |

