 Open Access Article
Creative Commons Attribution 3.0 Unported Licence
Models of orientational disorder in hybrid organic–inorganic piezoelectric materials
Kasper
Tolborg
 *a and
Aron
Walsh
 *ab
*ab
aDepartment of Materials, Imperial College London, Exhibition Road, London SW7 2AZ, UK. E-mail: k.tolborg@imperial.ac.uk; a.walsh@imperial.ac.uk
bDepartment of Physics, Ewha Womans University, Seoul 03760, Korea
First published on 6th June 2023
Abstract
Hybrid organic–inorganic materials show potential as flexible and Pb-free piezoelectric materials, but ferroelectric-to-paraelectric phase transitions are responsible for a loss of properties at increased temperatures. Here, we develop a model Hamiltonian from first-principles calculations for the archetypical hybrid organic–inorganic piezoelectric TMCMCdCl3 (TMCM = trimethylchloromethyl ammonium, Me3NCH2Cl+) to model the order–disorder phase transition. We show that the configurational entropy from molecular orientational disorder is alone unable the quantitatively reproduce the phase transition temperature, but inclusion of vibrational entropy leads to good quantitative agreement with experiments. This highlights the importance of vibrational contributions for the phase stability of soft and flexible materials. We furthermore show that defective structures and intergrowths are readily formed at ambient temperature which is suggested to be responsible for the exceptional piezoelectric response of these materials, which cannot be explained from the conventional small-displacement limit.
1 Introduction
Piezoelectric materials allow for the interconversion between mechanical and electrical energy and find applications in diverse areas including as sensors, actuators, and high precision motors. Current state-of-the art piezoelectric materials are based on inorganic ceramics such as lead zirconate titanate (PbZr1−xTixO3, PZT) with large piezoelectric responses.1–3 However, these materials are brittle, require high processing temperatures, and may contain toxic and environmentally hazardous lead, which impose challenges for flexible and bio-compatible technologies.In the last decade, hybrid organic–inorganic materials have shown promising applications as, e.g., photovoltaics4,5 and light emitting diodes,6 and more recently, high performance hybrid organic–inorganic ferroelectric and piezoelectric materials have been reported.7–12 These materials are flexible, solution-processable, and can be made from non-toxic and environmentally friendly chemistries.
Hybrid organic–inorganic materials are commonly based on an inorganic framework structure hosting organic dipolar cations—often in perovskite or perovskite-inspired structures—and they commonly feature several temperature induced phase transitions with increasing degrees of orientational disorder of the organic cations at increasing temperature.13 Elevated temperature may lead to either stabilisation of desired phases such as phases with high dielectric constants for increased screening of charge-carriers in photovoltaics,14,15 or to detrimental disordered paraelectric phases, in which the ferro- and piezoelectric performance is lost.9,13 Thus, it is of great importance to understand the influence of molecular orientational disorder and other entropic contributions in hybrid organic–inorganic materials on their stability, phase transitions and physical properties.16,17
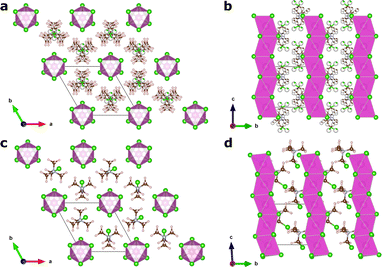
In this article, we focus on the hybrid ferroelectric material, TMCMCdCl3 (TMCM = trimethylchloromethyl ammonium, Me3NCH2Cl+) with piezoelectric performance comparable to BaTiO3 in its pure form,9 and to PZT for its solid-solution with the fluorine analogue of the molecular cation (TMFM = trimethylfluoromethyl ammonium).11 TMCMCdCl3 crystallises in the non-centrosymmetric monoclinic space group Cc at low temperature with ordered molecular cations, and transitions to a disordered paraelectric phase in the centrosymmetric hexagonal space group P63/mmc above 400 K (Fig. 1).9,11
Besides the interest in its phase transitions, the mechanism behind the high piezoelectric performance cannot be described within the conventional small-displacement limit, and is thus still poorly understood. Originally, it was suggested that ferroelastic switching was responsible,9 but it has been argued that this is not possible when the piezoelectric response is measured with the Berlincourt method.18 Instead, it was suggested that phase switching between the ground state and a metastable phase is involved.18,19
Through the last decade, several studies have proposed effective model Hamiltonians to study the order–disorder transitions in hybrid organic–inorganic materials, mainly those with cubic perovskite topology. These have been based on classical dipole–dipole interactions and strain models,20–22 Potts- and Ising-like models,23,24 or pair interactions.25 However, none of these have been developed solely from first principles and then applied to model a ferroelectric-to-paraelectric phase transition.
Here, we report the construction of a model Hamiltonian based on molecular pair interactions fitted to first principles calculated energies. Applying the model Hamiltonian, we perform Monte Carlo simulations to gain insight into the order–disorder phase transition as well as nanoscale effects and defective phases that are likely to be involved in the piezoelectric performance. Particularly, we show the importance of including contributions from vibrational entropy to model phase transition temperatures in quantitative agreement with experiment. Finally, we show that the easy development of disorder in the ab-plane results in formation of isolated and extended defects, which are likely to be responsible for the exceptional piezoelectric response.
2 Computational methods
2.1 Model construction
A model Hamiltonian for the orientational disorder of TMCM cations was build using a model inspired by the pair mode concept introduced by Li et al.25 Using the hexagonal setting of the high temperature phase, the structure of TMCMCdCl3 consists of one-dimensional face-sharing CdCl6-octahedra along the c-direction with TMCM molecules located around the 2c Wyckoff positions. Assuming that the molecular mirror plane is retained in the solid state and coincides with the mirror plane of the local![[6 with combining macron]](https://www.rsc.org/images/entities/char_0036_0304.gif) m2 symmetry of the Wyckoff site, there are six different molecular orientations per site.
m2 symmetry of the Wyckoff site, there are six different molecular orientations per site.
The low temperature phase is of monoclinic Cc symmetry, with its primitive cell coinciding with that of the high temperature phase. The conventional C-centered monoclinic unit cell can be constructed from the three primitive basis vectors aC = aP, bC = aP + 2bP and cC = cP, followed by a monoclinic distortion. Here, we use the primitive representation of the cell throughout.
In order to construct our model Hamiltonian, we include symmetry unique pair interactions corresponding to three different symmetry unique intermolecular vectors, (i) the interactions with the nearest neighbour at the other 2c site in the cell, i.e. with an intermolecular vector of  (and symmetry equivalent directions), (ii) the nearest neighbour along the c-directions at an intermolecular vector of [0,0,1] (and symmetry equivalent directions), and (iii) the next-nearest neighbour in the ab-plane with an intermolecular vector of [1,0,0] (and symmetry equivalent directions). This gives rise to 13, 6 and 12 symmetry unique interactions along the first, second and third intermolecular separations. All three types of interactions are needed in order to distinguish the experimentally observed ground state from specific defective states that we will consider below.
The final energy expression for any supercell size can be written as
 | (1) |
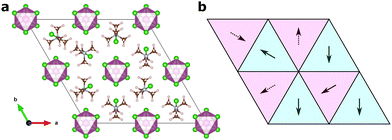
Fig. 2 shows an illustration of how one of the training structures is represented as molecular vectors of the different sites. We represent the molecular cations as vectors with directions along the [1![[1 with combining macron]](https://www.rsc.org/images/entities/char_0031_0304.gif) 3] -direction and its symmetry equivalents for the first 2c Wyckoff site, and the [
3] -direction and its symmetry equivalents for the first 2c Wyckoff site, and the [![[1 with combining macron]](https://www.rsc.org/images/entities/char_0031_0304.gif) 13] -direction at its equivalents for the second one. This gives directions in agreement with experiment9 and previous computations.18 Here, we will represent the dipoles as unit vectors in the given directions throughout.
13] -direction at its equivalents for the second one. This gives directions in agreement with experiment9 and previous computations.18 Here, we will represent the dipoles as unit vectors in the given directions throughout.
2.2 Density functional theory calculations
60 supercells of varying sizes are constructed based on random orientations (within the six allowed ones for each site) of TMCM molecules in the framework hexagonal structure. Of the 60 supercells, 20 2 × 2 × 2, 10 1 × 1 × 2, 10 2 × 2 × 1, 10 3 × 3 × 1, 6 1 × 1 × 3, and 4 1 × 1 × 1 cells are constructed, where the 4 1 × 1 × 1 cells are chosen as the 4 symmetry unique ones possible within that cell size, and the rest are chosen randomly.All supercells—including cell parameters—are relaxed with DFT to a convergence threshold of 0.01 eV Å−1. The Vienna ab initio simulation (VASP) package with the projector augmented wave approximation is used for all simulations.26,27 The PBEsol functional is used,28 the plane wave cutoff is set to 700 eV, and a 2 × 2 × 2 Γ-centered k-point grid is used for the base cell, and scaled accordingly for larger supercells.
The pair interaction parameters, Ji, are fitted to the energies extracted from the DFT calculations using linear least-squares.
2.3 Phonon calculations
As we will see below, fitting our model Hamiltonian based only on internal energies from DFT leads to inaccurate predictions of the phase transition temperature in TMCMCdCl3. To get a better description of the energy as a function of temperature, we include the vibrational free energy calculated from harmonic phonon dispersions.The phonon calculations are performed with PHONOPY29 and forces are calculated with VASP. The structures are relaxed to a slightly stricter convergence criterion of 0.005 eV Å−1, and 2 × 2 × 2 supercells (of the primitive base cell) are used for all phonon calculations. Vibrational free energies given as
 | (2) |
Due to the computational cost of calculating phonon dispersions for supercells, we opt to calculate them only for a subset of the structures. We then construct a surrogate model based only on the internal energy, E0, and equilibrium volume, V0 relative to the ground state structure, to reproduce the relative free energy as
| ΔF = αΔE0 + βΔV0 | (3) |
2.4 Monte Carlo simulations
Monte Carlo (MC) simulations were performed with the Metropolis algorithm30 using the model Hamiltonians described above, i.e. both the one based only on internal energies calculated with DFT, and the one based on free energies. In the second case, the temperature of the Monte Carlo simulation was matched with the free energy from phonon calculations. A simulation box of 8 × 8 × 8 unit cells (with two molecules per unit cell) was used for all simulations, and 2 × 10⁶ MC steps were performed with the first 1 × 10⁵ steps discarded as equilibration. Each simulation was repeated 10 times to improve the statistical sampling. In all cases, the simulations were started from the ground state distribution of molecular orientations, as random (and high-temperature initialised) starting configurations always led to trapping in metastable states.3 Results & discussions
3.1 Model quality
Fig. 3 shows the agreement between energies from the models based on the pair mode concept and the energies calculated from DFT. For the internal energies from DFT an RMSE of 4.76 meV f.u.−1 is obtained. Correcting the DFT energies for vibrational entropy results in a lower spread in energies and a smaller RMSE of only 3.79 meV f.u.−1 at 300 K. The models coarse grain over ionic relaxations etc., and considering the simplicity and short range nature of the model, the agreement is good. Note however, that for both athermal and thermal energies, the ground state energy (lowest energy point in Fig. 3) is predicted to be larger using the model Hamiltonian than what is obtained with DFT. We may attribute this to lack of long-range terms in the model Hamiltonian, which tend to stabilise specific local environments, but less so long range interactions. This includes strain contributions, which are likely to be underestimated by the model.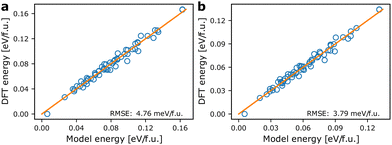 | ||
| Fig. 3 Comparison of model energies based on eqn (1) and DFT energies. (a) Model energies and internal energies from DFT, (b) model energies and temperature dependent energies corrected using eqn (3) at 300 K. The orange lines are of unity slope and indicate perfect agreement between model and calculated energies. | ||
3.2 Vibrational contributions
As we shall see below, simulations based on internal energies from DFT tend to overestimate the stability of the ground state structure. However, besides configurational entropy that we will model below with our MC model, vibrational entropy will also contribute to the energetics at elevated temperatures. Combining configurational and vibrational entropic contributions has also previously been shown to be important for accurate predictions of alloy stability.31In Fig. 4a, the phonon dispersion and density-of-states of the ground state structure is shown. The vibrational degrees of freedom give rise to vibrational entropy, or more conveniently expressed as vibrational free energy as in eqn (2). Fig. 4b shows the relative free energy between the ground state and a set of metastable structures that are used in the model construction. It is evident that all metastable structures are stabilised compared to the ground state at increasing temperatures, with one metastable state even becoming the thermodynamic ground state above ∼900 K. This shows that vibrational entropy contributes significantly to phase transitions in hybrid organic–inorganic materials as it has been suggested in previous reports.32–34
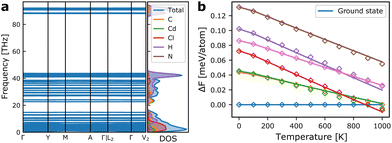 | ||
| Fig. 4 (a) Phonon dispersion and vibrational density of states for the ground state monoclinic structure of TMCMCdCl3. (b) Vibrational free energies of a set of metastable structures relative to that of the ground state. The solid lines indicate the calculated free energies from the phonon dispersions, and diamonds show the value from the correction model based only on the internal energy and the equilibrium volume of the metastable phases given in eqn (3). | ||
Fitting the model for the relative free energy given in eqn (3) at each temperature in 100 K intervals, gives rise to predicted energies shown in Fig. 4b. As it is computationally expensive to calculate the vibrational free energies for all training structures, we instead use this surrogate model to estimate the relative free energy for all other structures, which in turn is used to fit a new model Hamiltonian at each temperature, with the model quality indicated in Fig. 3b for 300 K.
3.3 Polarisation & local correlations
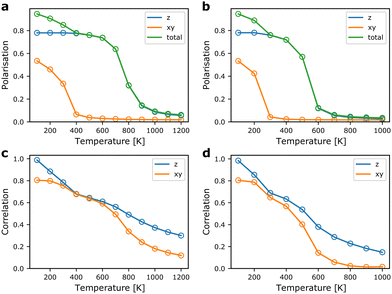
From the MC simulations, we can extract expectation values of relevant structural parameters as a function of temperature. Of main interest for probing the ferroelectric-to-paraelectric phase transition in TMCMCdCl3 is the total polarisation of the simulation cell. In Fig. 5, the polarisation as a function of temperature is shown for model Hamiltonians based on DFT internal energies and free energies including vibrational contributions. The polarisation is calculated from the molecular orientations using the (normalised) [1![[1 with combining macron]](https://www.rsc.org/images/entities/char_0031_0304.gif) 3] and [
3] and [![[1 with combining macron]](https://www.rsc.org/images/entities/char_0031_0304.gif) 13] family of directions as stated above for the orientation of the dipole of two different sites, and averaged over the number of molecules.
13] family of directions as stated above for the orientation of the dipole of two different sites, and averaged over the number of molecules.
First, we note that the transition to a paraelectric phase, characterised by zero polarisation, is observed to occur in the 600–900 K range when neglecting effects of vibrational entropy, whereas it is predicted to occur in the range of 400–600 K based on free energies. The results including vibrational contributions are in good agreement with experiment, where the transition is observed close to 400 K.9 Thus, the interplay between vibrational and configurational entropy is of great importance for the relative phase stability in hybrid organic–inorganic materials. The gradual transition observed here compared to the sharper transition in experiment is most likely a result of finite size effects of the simulation cell.35
The ferroelectric-to-paraelectric phase transition is observed when considering the z-component of the polarisation, whereas the polarisation in the xy-plane gradually disappears below room temperature. This is in disagreement with experiment, where only one phase transition is observed in which all components of the polarisation are lost simultaneously.9,11 We suggest that this is a result of neglecting long-range interactions in the xy-plane. Thus, in our model, it is possible to form local regions where the favourable relative local orientations are retained, but at relatively little energetic cost, defect-centers and grain boundaries can be formed. Put in another way, the strain energy arising from lattice mismatch of different domains is only included indirectly as an energetic penalty of a local relative orientation, but not from its overall effect on the strain field. The failure to capture the effect of strain and other long-range interactions is a well-known deficiency of local model Hamiltonians such as the cluster expansion technique often employed for alloys and solid solutions.36
Interestingly, the observed behaviour of the model around room temperature is reminiscent of the experimentally observed room temperature phases of the related TMCMCdBr3,37 and the TMCM1−xTMFMxCdCl3 solid-solution at concentrations, x, between 0.3 and 0.5,11 as well as the intermediate temperature phase in the TMCMCdBrCl2 solid solution.38 In all three cases, a structure with P63mc symmetry is observed, which corresponds to disorder between the three sites with the same z-polarisation. This suggests a strong competition between a fully ordered Cc-phase stabilised by long-range strain contributions, and an entropically stabilised—but still ferroelectric—P63mc-phase. For TMCMCdBrCl2 the Cc-phase is observed at lower temperature. Whether the two first mentioned systems also condense to the fully ordered Cc-phase at lower temperature is unknown.
The local correlations shown in Fig. 5 are defined as the average value of the dot-product between nearest neighbours in the xy-plane (the first interaction described in Section 2.1), and along the z-direction (the second interaction in Section 2.1). We note that local correlations are retained well above the paraelectric transition. Interestingly, the correlations between neighbours in the xy-plane remain strong after the overall polarisation in the plane is lost. This supports our claim that, locally, the structure remains close to the ground state structure, but the long-range order disappears due to neglecting strain contributions.
Furthermore, it is evident that strong correlations exist along the z-direction, i.e. even when the overall polarisation is zero, each molecule in a chain along the z-direction will prefer to have similar z-components of their polarisation. It would be of interest to probe the local order in the high temperature phase using diffuse X-ray (or neutron) scattering to further understand the merits of the model Hamiltonian beyond prediction of the phase transition temperature.39
3.4 Intergrowths, defects and enhanced piezoelectric response
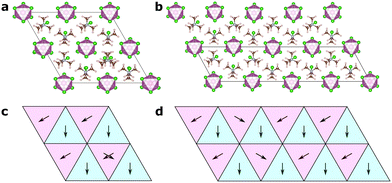
The large piezoelectric response of TMCMCdCl3 cannot be explained by intrinsic effects as calculated from DFT.9,18 Furthermore, it has been shown experimentally that the piezoelectric response is improved at the morphotrobic phase boundary between the P63mc and Cc phases for its solid solutions.11As mentioned above, there has been a discussion in the literature about the origin of the large piezoelectric response, which is beyond the standard displacive regime. Both effects of ferroelasticity9 and metastable phases have been suggested.18 Based on the easy accessibility of xy-disorder observed in our MC model, we instead suggest that the origin may be related to defects and intergrowths of differently ordered domains in an ordered Cc-symmetry matrix.
In Fig. 6, we show two different models, one of an isolated defect corresponding to a different molecular orientation, and one of an intergrowth of a “plane” of differently ordered molecules. In both cases, the local orientations remain favourable, i.e. nearest neighbour interactions (in the xy-plane for the isolated defect, and in all directions for the intergrowth) remain the same as in the ground state structures, and should thus be expected to be of low formation energy.
For the isolated orientational defect, a defect formation energy of 41 (50) meV is found when unit cell relaxation is included (excluded). This corresponds to a relative thermal population at room temperature of 20 (14) % when considering Boltzmann statistics.
For the intergrowth model, the formation energy is 26 (39) meV with (without) unit cell relaxation. As this is an extended defect, it is not directly comparable to the thermal energy, but by normalising it by the area of the intergrowth plane, we can compare it to other calculated stacking fault energies. For our case we get 43 (62) meV nm−2, which, for comparison, is slightly lower than the formation energy of hexagonal stacking faults in cubic metal halide perovskites,40 which are experimentally observed to be present.41
In the real solids, a complex mixture of defects and intergrowths will be present, and thus we shall not make an attempt to calculate the piezoelectric coefficient arising from these. However, it is very likely that applied stress can lead to reorientations of defects, movement of intergrowths etc., which will lead to a change in polarisation and therefore a piezoelectric response beyond the small-displacement limit. Furthermore, these defects are of significantly lower energy than the metastable phase suggested by Ghosh et al.,18 and therefore more likely to be involved in the piezoelectric mechanism.
4 Conclusions
To conclude, we have build a model Hamiltonian for the orientational disorder in the hybrid organic–inorganic ferroelectric material TMCMCdCl3 fitted to energies calculated from first principles both with and without inclusion of vibrational contributions. We show that the ferroelectric-to-paraelectric phase transition temperature can be quantitatively reproduced when vibrational entropic contributions are included, highlighting the importance of the interplay between vibrational and configurational degrees of freedom for soft and flexible crystalline materials.While the temperature dependence of the z-axis polarisation is in great agreement with experiment, the xy-plane polarisation is not reproduced as well with the current model. Instead, it resembles phases observed in the related TMCMCdBr3, and the TMCM1−xTMFMxCdCl3 and TMCMCdBrCl2 solid solutions. This shows that a close competition between strain stabilised long-range order and entropic stabilisation is present in this structural family.
Based on the observation of this competition, we calculate the formation energy of isolated and extended defects corresponding to different molecular orientations, and we show that these are readily formed. This suggests that reorientation of molecular defects and movement of intergrowth planes are involved in the exceptional piezoelectric response.
To experimentally validate the presence of large concentrations of both isolated and extended defects, accurate X-ray diffraction experiments—possibly modelled with the maximum entropy method42—should be able reveal significant disorder on the molecular sites even in the low temperature phase,43,44 and diffuse scattering experiment may reveal local correlations among these orientations.39 Furthermore, high resolution microscopy techniques such as transmission electron microscopy could lead to direct visualisation of (extended) defects, possibly through mapping of the associated strain fields.45,46
Data availability
The data that supports the findings of this study is openly available at https://doi.org/10.5281/zenodo.7669567.Conflicts of interest
There are no conflicts to declare.Acknowledgements
K. T. is funded by the Independent Research Fund Denmark through the International Postdoctoral grant (0164-00015B). Via our membership of the UK's HEC Materials Chemistry Consortium, which is funded by EPSRC (EP/R029431 and EP/X035859), this work used the ARCHER2 UK National Supercomputing Service (https://www.archer2.ac.uk).References
- B. Jaffe, R. Roth and S. Marzullo, J. Appl. Phys., 1954, 25, 809–810 CrossRef CAS.
- D. Damjanovic, Rep. Prog. Phys., 1998, 61, 1267 CrossRef CAS.
- F. Li, D. Lin, Z. Chen, Z. Cheng, J. Wang, C. Li, Z. Xu, Q. Huang, X. Liao and L.-Q. Chen, et al. , Nat. Mater., 2018, 17, 349–354 CrossRef CAS PubMed.
- A. Kojima, K. Teshima, Y. Shirai and T. Miyasaka, J. Am. Chem. Soc., 2009, 131, 6050–6051 CrossRef CAS PubMed.
- J. M. Frost, K. T. Butler, F. Brivio, C. H. Hendon, M. Van Schilfgaarde and A. Walsh, Nano Lett., 2014, 14, 2584–2590 CrossRef CAS PubMed.
- H. Cho, S.-H. Jeong, M.-H. Park, Y.-H. Kim, C. Wolf, C.-L. Lee, J. H. Heo, A. Sadhanala, N. Myoung and S. Yoo, et al. , Science, 2015, 350, 1222–1225 CrossRef CAS PubMed.
- P. Jain, V. Ramachandran, R. J. Clark, H. D. Zhou, B. H. Toby, N. S. Dalal, H. W. Kroto and A. K. Cheetham, J. Am. Chem. Soc., 2009, 131, 13625–13627 CrossRef CAS PubMed.
- W. Zhang and R.-G. Xiong, Chem. Rev., 2012, 112, 1163–1195 CrossRef CAS PubMed.
- Y.-M. You, W.-Q. Liao, D. Zhao, H.-Y. Ye, Y. Zhang, Q. Zhou, X. Niu, J. Wang, P.-F. Li and D.-W. Fu, et al. , Science, 2017, 357, 306–309 CrossRef CAS PubMed.
- H.-Y. Ye, Y.-Y. Tang, P.-F. Li, W.-Q. Liao, J.-X. Gao, X.-N. Hua, H. Cai, P.-P. Shi, Y.-M. You and R.-G. Xiong, Science, 2018, 361, 151–155 CrossRef CAS PubMed.
- W.-Q. Liao, D. Zhao, Y.-Y. Tang, Y. Zhang, P.-F. Li, P.-P. Shi, X.-G. Chen, Y.-M. You and R.-G. Xiong, Science, 2019, 363, 1206–1210 CrossRef CAS PubMed.
- Y. Hu, L. You, B. Xu, T. Li, S. A. Morris, Y. Li, Y. Zhang, X. Wang, P. S. Lee and H. J. Fan, et al. , Nat. Mater., 2021, 20, 612–617 CrossRef CAS PubMed.
- W. Li, Z. Wang, F. Deschler, S. Gao, R. H. Friend and A. K. Cheetham, Nat. Rev. Mater., 2017, 2, 1–18 Search PubMed.
- I. Anusca, S. Balciunas, P. Gemeiner, Š. Svirskas, M. Sanlialp, G. Lackner, C. Fettkenhauer, J. Belovickis, V. Samulionis and M. Ivanov, et al. , Adv. Energy Mater., 2017, 7, 1700600 CrossRef.
- J. N. Wilson, J. M. Frost, S. K. Wallace and A. Walsh, APL Mater., 2019, 7, 010901 CrossRef.
- K. T. Butler, A. Walsh, A. K. Cheetham and G. Kieslich, Chem. Sci., 2016, 7, 6316–6324 RSC.
- K. Tolborg, J. Klarbring, A. M. Ganose and A. Walsh, Digital Discovery, 2022, 1, 586–595 RSC.
- P. Ghosh, S. Lisenkov and I. Ponomareva, Phys. Rev. Lett., 2020, 125, 207601 CrossRef CAS PubMed.
- P. Ghosh, J. Doherty, S. Lisenkov and I. Ponomareva, J. Phys. Chem. C, 2021, 125, 16296–16303 CrossRef CAS.
- J. M. Frost, K. T. Butler and A. Walsh, APL Mater., 2014, 2, 081506 CrossRef.
- A. Leguy, J. M. Frost, A. P. McMahon, V. G. Sakai, W. Kockelmann, C. Law, X. Li, F. Foglia, A. Walsh and B. C. O’regan, et al. , Nat. Commun., 2015, 6, 7124 CrossRef PubMed.
- D. J. Allen, N. C. Bristowe, A. L. Goodwin and H. H.-M. Yeung, J. Mater. Chem. C, 2021, 9, 2706–2711 RSC.
- M. Šimėnas, S. Balčiūnas, M. Maçzka, J. Banys and E. E. Tornau, Phys. Chem. Chem. Phys., 2016, 18, 18528–18535 RSC.
- M. Šimėnas, A. Ibenskas, A. Stroppa, A. Gagor, M. Maczka, J. Banys and E. E. Tornau, J. Phys. Chem. C, 2019, 123, 19912–19919 CrossRef.
- J. Li, J. Järvi and P. Rinke, Phys. Rev. B, 2018, 98, 045201 CrossRef CAS.
- G. Kresse and J. Furthmüller, Comput. Mater. Sci., 1996, 6, 15–50 CrossRef CAS.
- G. Kresse and D. Joubert, Phys. Rev. B: Condens. Matter Mater. Phys., 1999, 59, 1758 CrossRef CAS.
- J. P. Perdew, A. Ruzsinszky, G. I. Csonka, O. A. Vydrov, G. E. Scuseria, L. A. Constantin, X. Zhou and K. Burke, Phys. Rev. Lett., 2008, 100, 136406 CrossRef PubMed.
- A. Togo and I. Tanaka, Scr. Mater., 2015, 108, 1–5 CrossRef CAS.
- N. Metropolis, A. W. Rosenbluth, M. N. Rosenbluth, A. H. Teller and E. Teller, J. Chem. Phys., 1953, 21, 1087–1092 CrossRef CAS.
- A. Van De Walle, Calphad, 2009, 33, 266–278 Search PubMed.
- K. T. Butler, K. Svane, G. Kieslich, A. K. Cheetham and A. Walsh, Phys. Rev. B, 2016, 94, 180103 CrossRef.
- W. Wei, W. Li, K. T. Butler, G. Feng, C. J. Howard, M. A. Carpenter, P. Lu, A. Walsh and A. K. Cheetham, Angew. Chem., 2018, 130, 9070–9074 CrossRef.
- K. Li, Z.-G. Li, J. Xu, Y. Qin, W. Li, A. Stroppa, K. T. Butler, C. J. Howard, M. T. Dove and A. K. Cheetham, et al. , J. Am. Chem. Soc., 2022, 144, 816–823 CrossRef CAS PubMed.
- K. Binder, Ferroelectrics, 1987, 73, 43–67 CrossRef.
- D. B. Laks, L. Ferreira, S. Froyen and A. Zunger, Phys. Rev. B: Condens. Matter Mater. Phys., 1992, 46, 12587 CrossRef PubMed.
- W.-Q. Liao, Y.-Y. Tang, P.-F. Li, Y.-M. You and R.-G. Xiong, J. Am. Chem. Soc., 2018, 140, 3975–3980 CrossRef CAS PubMed.
- X.-G. Chen, Y.-Y. Tang, H.-P. Lv, X.-J. Song, H. Peng, H. Yu, W.-Q. Liao, Y.-M. You and R.-G. Xiong, J. Am. Chem. Soc., 2023, 145, 1936–1944 CrossRef CAS PubMed.
- D. A. Keen and A. L. Goodwin, Nature, 2015, 521, 303–309 CrossRef CAS PubMed.
- J.-S. Park, Z. Li, J. N. Wilson, W.-J. Yin and A. Walsh, ACS Energy Lett., 2020, 5, 2231–2233 CrossRef CAS.
- S. Macpherson, T. A. Doherty, A. J. Winchester, S. Kosar, D. N. Johnstone, Y.-H. Chiang, K. Galkowski, M. Anaya, K. Frohna and A. N. Iqbal, et al. , Nature, 2022, 607, 294–300 CrossRef CAS PubMed.
- M. Sakata and M. Sato, Acta Crystallogr., Sect. A: Found. Crystallogr., 1990, 46, 263–270 CrossRef.
- G. J. Snyder, M. Christensen, E. Nishibori, T. Caillat and B. B. Iversen, Nat. Mater., 2004, 3, 458–463 CrossRef CAS PubMed.
- J. Zhang, N. Roth, K. Tolborg, S. Takahashi, L. Song, M. Bondesgaard, E. Nishibori and B. B. Iversen, Nat. Commun., 2021, 12, 6709 CrossRef CAS PubMed.
- M. U. Rothmann, J. S. Kim, J. Borchert, K. B. Lohmann, C. M. O’Leary, A. A. Sheader, L. Clark, H. J. Snaith, M. B. Johnston and P. D. Nellist, et al. , Science, 2020, 370, eabb5940 CrossRef CAS PubMed.
- S. D. Stranks, Matter, 2021, 4, 3852–3866 CrossRef CAS.
| This journal is © The Royal Society of Chemistry 2023 |

