Fluorination of naphthalimide–cyanostilbene derivatives to achieve dual-state emission luminogens with strong fluorescence in highly polar environments for bioimaging†
Qiusi
Shi‡
a,
Yingyong
Ni‡
a,
Longmei
Yang
a,
Lin
Kong
 a,
Peiyang
Gu
 b,
Chengyuan
Wang
 *a,
Qichun
Zhang
 *c,
Hongping
Zhou
 a and
Jiaxiang
Yang
 *a
*a
aSchool of Chemistry and Chemical Engineering, Anhui Province Key Laboratory of Chemistry for Inorganic/Organic Hybrid Functionalized Materials, Key Laboratory of Structure and Functional Regulation of Hybrid Materials of Ministry of Education, Anhui University, 111 Jiulong Road, Hefei, 230601, China. E-mail: chengyuan.wang@ahu.edu.cn; jxyang@ahu.edu.cn
bJiangsu Key Laboratory of Advanced Catalytic Materials & Technology, School of Petrochemical Engineering, Changzhou University, Changzhou, 213164, China
cDepartment of Materials Science and Engineering, Department of Chemistry & Center of Super-Diamond and Advanced Films (COSDAF), City University of Hong Kong, Kowloon, Hong Kong SAR, China. E-mail: qiczhang@cityu.edu.hk
First published on 4th July 2023
Abstract
Organic luminogens (OLs) that emit strong fluorescence in both solution and the aggregated state, referred to as dual-state emission luminogens (DSEgens), are highly desirable because of their capability to achieve multiple functions within onefold materials. The fluorescence of OLs, including DSEgens, with intramolecular charge transfer characteristics, often decreases in solution as the solvent polarity increases, namely the positive solvatokinetic effect, resulting in inferior environmental stability. In this work, fluorination to naphthalimide (NI)–cyanostilbene (CS) derivatives was adopted to construct novel DSEgens (NICSF-X, X = B, P, M, and T, respectively). Steady-state and transient spectroscopies were utilized to study their photophysical properties, evidencing their DSE properties with fluorescence quantum yields (φ) ∼0.2–0.4 in solution and ∼0.5–0.9 as solids. In particular, strong fluorescence emission in highly polar solvents i.e., φ up to ∼0.4–0.5 in ethanol, was sustained for NICSF-Xs, possibly assisted by hydrogen bonding (H-bonding) formation. Theoretical calculations and single-crystal structure analysis rationalized the intense photoluminescence (PL) emission of NICSF-Xs in the solid state. In addition, NICSF-Xs showed two-photon absorption (2PA) behaviors in dual states and were successfully applied for HepG2 cell imaging with one-photon and 2PA excitation, with lipid droplet targeting. Our study suggests that functionalization of molecules by fluorination to introduce H-bonding is a promising strategy to enhance the environmental stability of fluorescence in solution and realize strong PL emission in highly polar solvents, which could be favorable for bioimaging.
Introduction
Organic luminogens (OLs) have attracted a lot of research interest over the past decades owing to their excellent fluorescent properties and easy accessibility, which have been widely applied in chemical sensors, organic optoelectronics, bioimaging, theranostics, etc.1–6 Fluorescence of conventional OLs is usually quenched in the solid state, via the aggregation-caused-quenching (ACQ) or the trap-controlled quenching (TCQ) phenomenon, even though their emission can be efficient in dilute solution.7 Evolving from the ACQ or TCQ materials, OLs capable of showing fluorescence in the solid state rather than in dilute solution, which are termed as the aggregation-induced-emission (AIE) materials by Tang et al., have been intensively investigated.8–10 Very recently, OLs that can achieve strong fluorescence in both the dilute solution and the aggregated state, known as dual-state emission (DSE) materials (DSEgens), have emerged as a hot topic in the OL research field.11–13 One of the advanced features of DSEgens is to realize multiple functions by a onefold material as they can be used in both states, overcoming the limitations in application scope of sole emission OLs.14–20 Hence, DSEgens are highly desirable and have great potential in practical applications as multi-functional materials.Both the energy and the intensity of the fluorescence of OLs in solution are highly dependent on the environment. In general, the fluorescence of OLs with intramolecular charge transfer (ICT) characteristics, which is a widely used strategy to construct efficient DSEgens, red shifts in high-polarity solvents (positive solvatochromic effects). The reason has been well understood as in the excited state, OLs usually have a larger dipole moment, and a highly polar solvent can reorient or relax around the excited fluorophore molecules more effectively, and thus the energy of the excited state is lowered. In the meantime, the intensity of fluorescence often recedes as the polarity of solvents increases, referred to as the positive solvatokinetic effect, because the non-radiative decay channel becomes more competitive when the energy of the excited state is lower.21,22 This effect is unfavourable if the OLs are used for bioimaging application, since living organisms and cells normally exist in an aqueous environment.
In addition to the strong fluorescence of OLs in highly polar environments, long wavelength excitation light, especially in the near-infrared region (NIR), is preferred for biological application as well, since the low energy light can efficiently reduce the photodamage and improve the spatial resolution.23,24 For this purpose, OLs with two-photon absorption (2PA) properties are particularly advantageous. 2PA OLs can absorb two low-energy photons simultaneously to reach a high-energy excited state, which emits high-energy photoluminescence (PL) when relaxing back to the ground state.25 However, the drawback of the abovementioned positive solvatokinetic effect is more obvious for 2PA OLs, because the 2PA PL is even weaker than the normal one-photon absorption (1PA) excited PL. OLs that show strong PL, especially 2PA PL in high-polarity environments, are beneficial in biological applications, while difficult to design and develop.26
In our previous study, we utilized naphthalimide (NI) and cyanostilbene (CS) to construct a series of donor–acceptor (D–A) molecules, which are excellent DSEgens with 2PA properties in dual states. However, these materials all showed the positive solvatokinetic effect, similar to most of the OLs.27 The linear shaped molecular backbone might lead to easier change of molecular configuration in the excited state in high-polarity solvents, resulting in weakness of PL in a highly polar environment. On the basis of the previous study, in this work, we designed novel D–A OLs with a NI–CS skeleton, in which F atoms were introduced at the specific position of the CS unit, in order to assist molecules to form hydrogen bonding (H-bonding) with the surrounding solvent, and reduce the nonradiative decay process of the excited state. The novel designed fluorinated OLs showed dual-state emission and 2PA behaviour, and strong PL in high-polarity solvents, even in protic solvents, which were successfully used for cell-imaging with specific lipid droplet (LD) targeting.
Results and discussion
Synthetic procedures of the target molecules
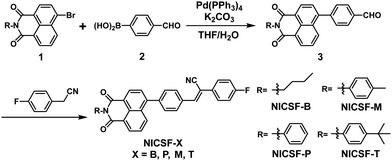
Scheme 1 shows the synthetic route of the target molecules. Naphthalimide–bromide units attached with various substituents (1) were synthesized first following a literature reported procedure.28 Starting from 1 and 4-formylphenylboronic acid (2), different intermediates (3) were prepared through a Suzuki coupling reaction, which reacted with 4-fluorophenylacetonitrile by the Knoevenagel reaction to get the target molecules NICSF-Xs, X = B, P, M, T, respectively. The detailed synthetic procedure and characterization of the target compounds are provided in the ESI.†Steady-state photophysical properties
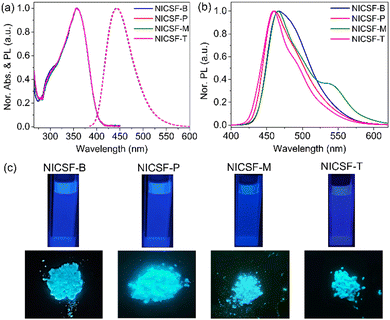
Fig. 1(a) shows the UV-vis absorption and PL spectra of NICSF-Xs in THF. In the UV-vis absorption spectra, there is one main band located in the range of 300–400 nm with the maxima (λmax,abs) of 357 nm. Similarly, in the PL spectra, one band can be observed with the λmax,PL of 445 nm. As all the measurements were performed in diluted solution with 10−5 mol L−1 concentration, there should be only subtle aggregation effect in this condition. The similarities of the absorption spectra and PL spectra indicate that NICSF-Xs have similar excitation/relaxation process to isolated molecules.In the aggregated state, NICSF-Xs show a broad emission in the range of 420–570 nm (Fig. 1b). λmax,PL of NICSF-B is 468 nm, while that of NICSF-P is ∼8 nm blue-shifted (λmax,PL = 460 nm). λmax,PL of NICSF-M is similar to that of NICSF-B, with a small peak with λmax,PL of 537 nm is observed, which might not result from the vibronic progression of the main emission peak, as its intensity is abnormally more pronounced. NICSF-T has a similar λmax,PL with that of NICSF-P, but the band is narrower, indicating that its molecular conformation is relatively more rigid in the solid state during relaxation from the excited state.
Interestingly, NICSF-Xs show moderate quantum yields (relative values with 9,10-diphenylanthracene as the reference, R–φ) of PL in solution in the range of ∼0.2–0.4, and very strong PL in the aggregated state with φ in the range of ∼0.4–0.9, among which in particular the φ for NICSF-B and NICSF-T is up to ∼0.9 (Table 1). Thus, these materials can be classified as efficient DSEgens, which can be more directly visualized by the photos of the molecules in the two states irradiated under UV light (Fig. 1c).
Solvatochromic and solvatokinetic effects
The solvatochromic effects of NICSF-Xs in various solvents were investigated in dilute solutions. The polarity of the solvents are discussed with ET(30), which is a widely used empirical polarity parameter introduced by Reichardt.29 In Fig. 2, as the ET(30) values of the solvents increase, the maximum emission peaks of the PL spectra of NICSF-Xs gradually red shift, indicating the positive solvatochromic effects. In addition, for the UV-vis absorption and the PL spectra of NICSF-Xs in different solvents, the corresponding Stokes shifts and the orientation polarizabilities of the solvents can be linearly fitted by the Lippert–Mataga equation (Fig. S1, ESI†).30 These suggest that the excitation and relaxation of the molecules in diluted solutions are ICT processes.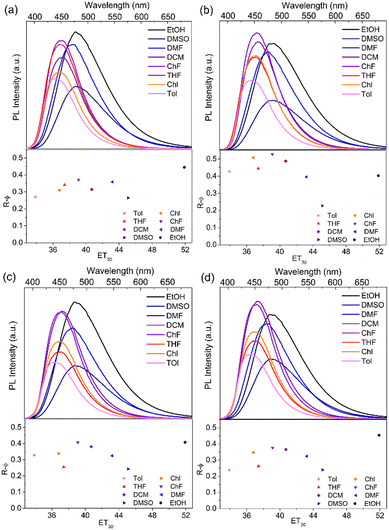 | ||
| Fig. 2 Solvatochromic effects (top) and relative quantum yields (bottom) of NISCF-Xs in various solvents. | ||
Interestingly, as the ET(30) values of the solvents increase, the intensities of the PL emission of NICSF-Xs increase firstly, then decrease gradually. To quantitatively reflect the changing trends of PL intensities, the R–φ of NICSF-Xs in these solvents were measured (bottom figures in Fig. 2 and Table 2). In toluene (Tol), which has the lowest ET(30) value, NICSF-Xs show low R–φs (0.27 for NICSF-B, 0.43 for NICSF-P, 0.33 for NICSF-M, and 0.24 for NICSF-T, respectively). In general, the R–φs increase from Tol, chlorobenzene (Chl), THF to chloroform (ChF), in which the R–φs are 0.37 for NICSF-B, 0.53 for NICSF-P, 0.41 for NICSF-M, and 0.38 for NICSF-T, respectively. Then, the R–φs decrease as the ET(30) values increase, but even in highly polar solvents, i.e. DMSO, the R–φs are still in the moderate range, which are comparable with those in Tol (0.26 for NICSF-B, 0.24 for NICSF-M, and 0.24 for NICSF-T), except for NICSF-P (0.23), respectively. Thus, NICSF-Xs first show a negative solvatokinetic effect, and then show a positive solvatokinetic effect. Furthermore, it is worth noting that NICSF-Xs have particularly high R–φs in the protic solvent ethanol (EtOH, 0.44 for NICSF-B, 0.40 for NICSF-P, 0.41 for NICSF-M, and 0.45 for NICSF-T). These are in sharp contrast with most D–A structured fluorophores with ICT characteristics.31–33
| Molecules | Relative quantum yields (R–φ) | |||||||
|---|---|---|---|---|---|---|---|---|
| Tol | Chl | THF | ChF | DCM | DMF | DMSO | EtOH | |
| NICSF-B | 0.27 | 0.31 | 0.34 | 0.37 | 0.31 | 0.36 | 0.26 | 0.44 |
| NICSF-P | 0.43 | 0.51 | 0.44 | 0.53 | 0.49 | 0.40 | 0.23 | 0.40 |
| NICSF-M | 0.33 | 0.34 | 0.25 | 0.41 | 0.38 | 0.32 | 0.24 | 0.41 |
| NICSF-T | 0.24 | 0.35 | 0.26 | 0.38 | 0.37 | 0.32 | 0.24 | 0.45 |
The unusual solvatokinetic effect of NICSF-Xs might be related to the polarity and H-bonding-induced inversion of different excitation states.34,35 In low-polarity solvents, the n–π* transition could dominate upon excitation/relaxation. As the polarity and the H-bonding power of solvents increase, since π–π* transition can be more easily influenced by the environment, it becomes dominating and shifts to lower energy. Therefore, φ in high-polarity solvents is higher, because the radiative decay in the π–π* state is normally more efficient than the n–π* state.36 The decrease of PL intensity from dichloromethane (DCM) to DMSO may be because as the polarity of solvents further increase the narrower energy gaps between the ground state and the excited state lead to easier non-radiative deactivation. Since the fluorophores with the same molecular backbone as NICSF-Xs but without F substitution at the CS moiety (NICS-Xs) show only positive solvatokinetic effects,27 the introduction of F atom at the CS moiety is important to induce this unusual solvatokinetic effect. In addition, this strategy has certain generality, as even the substituents in the NI unit change from butyl group to different phenyl groups, the molecules all show this special solvatokinetic effect. Thus, introduction of H-bonding by fluorination could be a promising strategy to develop OLs with strong PL emission in highly polar environments.
Photoluminescence decay
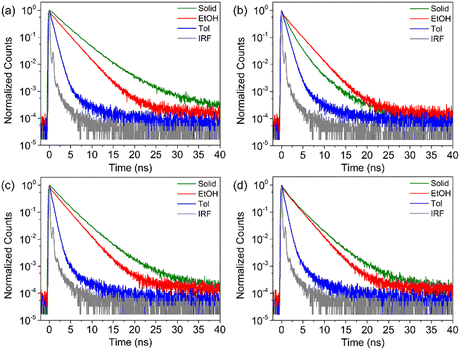
To understand the dynamics of the excited state deactivation process, The PL decay of NICSF-Xs in solvents with different polarities and the aggregated state was investigated using the time-correlated single photon counting (TCSPC) technique. As shown in Fig. 3, in Tol, the PL decay of NICSF-Xs can be described by one exponential decay function, whose time constants are similar (τTol,NICSF-B = 0.69 ns, τTol,NICSF-P = 0.77 ns, τTol,NICSF-M = 0.77 ns, and τTol,NICSF-T = 0.56 ns, respectively). Since NICSF-Xs have relatively higher φ in high-polarity solvents, especially in EtOH, the PL deactivation of NICSF-Xs in EtOH were studied as well. Even though the TCSPC plots of NICSF-Xs in EtOH can still be fitted by one exponential decay function, the lifetimes sharply increase (τEtOH,NICSF-B = 2.31 ns, τEtOH,NICSF-P = 2.23 ns, τEtOH,NICSF-M = 2.19 ns, and τEtOH,NICSF-T = 2.17 ns, respectively). A similar and fast PL decay in Tol rationally reflects the deactivation of the excited state of NICSF-Xs as isolated molecules, and the largely increased time constants in EtOH indicate that H-bond formation can significantly affect the deactivation process of the excited state.In the aggregated state, the PL decay can still be basically fitted by a monoexponential function. All lifetimes have certain increase, in which τagg,NICSF-B = 3.11 ns, τagg,NICSF-P = 1.35 ns, τagg,NICSF-M = 2.67 ns, and τagg,NICSF-T = 2.23 ns, respectively. The only slightly increased, or even decreased (NICSF-P) lifetime of PL in the aggregated state compared with those in solution suggests that NICSF-Xs in the aggregated state shall barely form excimers, which usually have longer lifetime.
The radiative decay rate kr and the non-radiative decay rate knr of NICSF-Xs in solution and the aggregated state were calculated based on the following equation:
| φ = τkr = kr/(kr + knr) |
The kr,Tol of NICSF-Xs is ∼0.39–0.56 ns−1, and knr,Tol is ∼0.74–1.35 ns−1. The relatively larger knr,Tol in Tol indicate that the non-radiative process is more likely to occur. On the other hand, kr,EtOH of NICSF-Xs in EtOH is ∼0.18–0.21 ns−1, and knr,EtOH is ∼0.24–0.28 ns−1. The radiative and nonradiative decay rates both are much smaller than those in Tol, while they are basically comparable with each other. This explains that under a H-bond formation environment both the radiative and nonradiative decay are affected, but the restriction to the latter is more pronounced. In the aggregated state, the kr,agg of NICSF-Xs are ∼0.17–0.54 ns−1, but the nonradiative decay rates are ∼0.02–0.21 ns−1, implying that in the aggregated state the nonradiative decay process is suppressed and radiative decay process dominates. The molecules in dilute solutions can be basically regarded as isolated molecules, and thus, the fast PL decay in Tol and EtOH essentially describes the electronic deactivation of the isolated molecules.
To rationalize how the aggregation influences the PL relaxation of NICSF-Xs in the solid state, radiative rate constant (RRC) analysis is performed.37 The RRC ratio (Xr), defined as the ratio between kr,agg and kr,Tol, (use the low-polarity solvent data to eliminate the H-bonding effect) is calculated to be 0.74 for NICSF-B, 0.96 for NICSF-P, 0.40 for NICSF-M, and 1.02 for NICSF-B. A Xr < 1 normally implies H-aggregate formation, while 1 < Xr < 1.5 indicates that molecules are quasi-isolated (Q-type) in the solid state.38,39 Hence, the H-aggregation effect is supposed to contribute to the PL properties of NICSF-B and NICSF-M in the solid state, while the solid-state PL of NICSF-P and NICSF-T should be only minorly affected by the aggregation effect. Table 3 summarizes the τ, kr, knr, and Xr values of NICSF-Xs in solution and in the aggregated state.
| Molecules | Solution | Aggregated state | X r | |||||||
|---|---|---|---|---|---|---|---|---|---|---|
| τ Tol (ns) | k r,Tol (ns−1) | k nr,Tol (ns−1) | τ EtOH (ns) | k r,EtOH (ns−1) | k nr,EtOH (ns−1) | τ agg (ns) | k r,agg (ns−1) | k nr,agg (ns−1) | ||
| NICSF-B | 0.69 | 0.39 | 1.05 | 2.31 | 0.19 | 0.24 | 3.11 | 0.29 | 0.04 | 0.74 |
| NICSF-P | 0.77 | 0.56 | 0.74 | 2.23 | 0.18 | 0.27 | 1.35 | 0.54 | 0.20 | 0.96 |
| NICSF-M | 0.77 | 0.43 | 0.88 | 2.19 | 0.19 | 0.28 | 2.67 | 0.17 | 0.21 | 0.40 |
| NICSF-T | 0.56 | 0.43 | 1.35 | 2.17 | 0.21 | 0.25 | 2.23 | 0.43 | 0.02 | 1.00 |
Theoretical calculations
To further understand the photophysical properties of NICSF-Xs as isolated molecules, the frontier molecular orbital energy levels of NICSF-Xs were calculated at the B3LYP/6-311G** level in the gas phase by density function theory (DFT). As shown in Fig. 4, the HOMO coefficients of NICSF-Xs are mainly located at the CS moiety, while the LUMOs are distributed at the NI unit. Thus, these molecules exciting from HOMOs to LUMOs have obvious ICT characteristics. The HOMO energy levels are in the range of −6.38 to −6.40 eV, and the LUMOs are −2.86 to −2.89 eV, resulting in bandgaps of 3.50–3.52 eV accordingly. Table 4 summarizes the molecular energy levels and bandgaps of NICSF-Xs.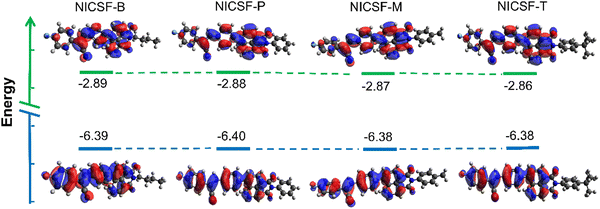 | ||
| Fig. 4 Frontier molecular orbitals of NICSF-Xs in the gas phase derived from DFT calculations at the B3LYP/6-311G** level. | ||
| Molecules | NICSF-B | NICSF-P | NICSF-M | NICSF-T |
|---|---|---|---|---|
| HOMO (eV) | −6.39 | −6.40 | −6.38 | −6.38 |
| LUMO (eV) | −2.89 | −2.88 | −2.87 | −2.86 |
| Bandgap (eV) | 3.50 | 3.52 | 3.51 | 3.52 |
The rather close HOMO and LUMO energy levels and bandgaps indicate that changing the substituents at the NI units do not affect the electric structures of the molecules as monomers. This is consistent with their similar photophysical properties in dilute solutions. Compared with the NICS-Xs, which have various alkoxyl groups at the CS moieties but no fluorination, NICSF-Xs have LUMOs ∼0.1 eV lower, while HOMOs ∼0.4 eV lower. Fluorination at the CS moiety stabilizes both the LUMOs and HOMOs, but the stabilization effect is more pronounced in the HOMOs. As a result, the bandgaps are ∼0.3 eV larger, and their UV-vis absorption and fluorescence spectra are both blue-shifted.27
Single crystal structure analysis
To better understand how the aggregation of molecules affect the solid-state fluorescence properties, the single-crystal structures of NICSF-Xs, obtained via slow evaporation of their solution in DCM/EtOH mixed solvents, have been analysed by single-crystal X-ray diffraction (CCDC 2257053–2257056†). It should be pointed out in the first place that because NICSF-Xs are asymmetric molecules, the different orientations of the alkyl chain, or the phenyl substituents in the NI unit yield two types of isomers, respectively (Fig. 5).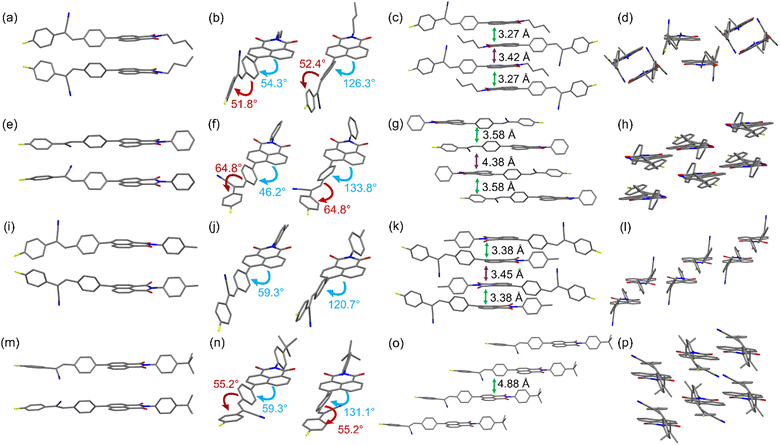 | ||
| Fig. 5 Molecular conformation and packing structures derived from single-crystal structure analysis of NICSF-B (a−d), NICSF-P (e−h), NICSF-M (i−l), and NICSF-T (m−p). | ||
As shown in Fig. 5(a–d), NICSF-B exhibits a twisted molecular conformation. The torsion angles between the NI unit and the CS moiety, and within the CS moiety, are very similar, i.e. ∼54° and 52°, respectively (Fig. 5b). The two isomers form dimer-like structures in the solid state, in which molecules have a large offset along the long molecular axis. The NI units in the dimer are closely packed with distance of 3.27 Å, while between the dimers the distance is slightly larger (3.42 Å). Along the short molecular axis the neighboring molecules are turned around, possibly with donor···acceptor intermolecular interaction.
NICSF-P shows a twisted molecular conformation as well Fig. 5(e–g). As the isomeric structures are induced by the different orientation of the phenyl group, the torsion between NI and CS is mitigated (∼46°). However, the torsion within the CS moiety is enlarged (64.8°). The isomers form a dimer-like packing structure with a molecular distance of 3.58 Å (determined from the NI plane of the dimer), in which the molecules are turned around with a small offset. Along the short molecular axis the neighboring molecules have relatively large offset.
Although the molecular conformation of NICSF-M is twisted, the torsion occurs only between the NI and CS (∼59°), and the CS moiety is rather planar (Fig. 5(i–l)). The isomers form dimers with a large offset along the long molecular axis, and the distance of the stacked NI units is 3.38 Å. Along the short molecular axis the neighboring molecules are largely offset, and the CS moieties are π-stacked with each other.
Similar to NICSF-B and NICSF-P, NICSF-T shows a twisted molecular conformation (Fig. 5(m–p)). The torsion angle between NI and CS is ∼59°, and within the CS is ∼55°. The molecules form a column-like packing with each other, and the isomers are alternatively distributed in different columns with the distance of 4.88 Å. The large molecular distance could result from the large steric effect of the t-butyl group.
As indicated by the RRC analysis, H-aggregation contributes to the photophysical properties of NICSF-B and NICSF-M in the solid state. However, their emission is relatively red-shifted compared with that of NICSF-P and NICSF-T. This can be rationalized by their less twisted molecular conformation, in which torsions within the CS moiety is less significant. The relatively more planar molecular conformation could help to the ICT process, thus make the PL red-shift.
Two-photon absorption properties
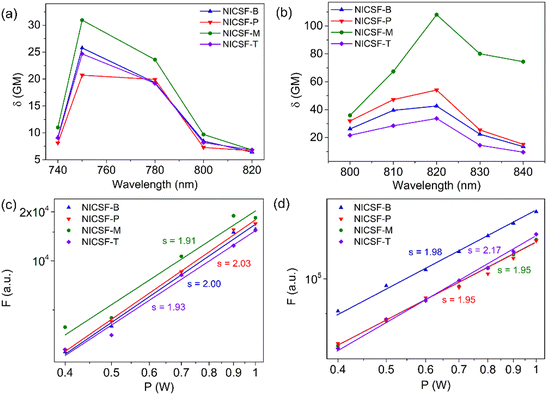
The 2PA properties of NICSF-Xs in solution and the aggregated state were studied by using a femtosecond pulsed laser (pulse duration 140 fs, repetition rate 80 MHz) as the excitation source. The solution measurements were carried out in DMSO solution with a concentration of 5 × 10⁻⁴ M, and the 2PA cross sections (δsol) was determined by the two-photon excited fluorescence (2PEF) method with fluorescein as the reference.25 As shown in Fig. 6, when excited by low-energy lights with the wavelength in the range of 740–820 nm (the first near-infrared region, NIR-I), NICSF-Xs all emitted fluorescence with different intensities, indicating typical 2PA behaviours. The maximum 2PA δsol values are 26 Goeppert–Mayer (GM, 1 GM = 10−50 cm4 s photon−1) for NICSF-B, 21 GM for NICSF-P, 31 GM for NICSF-M, and 25 GM for NICSF-T, respectively, with the similar maximum excitation wavelength at 750 nm. In addition, the fluorescence intensities with a fixed excitation wavelength were proportional to the square of the excitation laser power intensities, confirming that the fluorescence originated essentially from the 2PA process.Polycrystalline powders of NICSF-Xs were used as samples to investigate their solid-state 2PA properties, and the δagg were also derived from the 2PEF method with perylene as the reference.40 Strong fluorescence was observed as NICSF-Xs were excited with laser wavelength in the range of 800–840 nm, and the maximum excitation wavelength changed to 820 nm, which is largely red-shifted compared those in DMSO solution. The maximum δagg values are 43 GM, 54 GM and 34 GM for NICSF-B, NICSF-P, NICSF-T, respectively, similar to those in DMSO while that of NICSF-M reaches up to 108 GM, ∼3-fold higher than in solution. Furthermore, quadratic dependence of the fluorescence intensities with the excitation laser power intensities could be observed as well, verifying the 2PA behaviours of NICSF-Xs in the solid state. These results suggest that introduction of F at the ending position can maintain the 2PA properties of the molecules in both solution and the aggregated state, which have been reported for only a few examples.41,42
Bioimaging properties
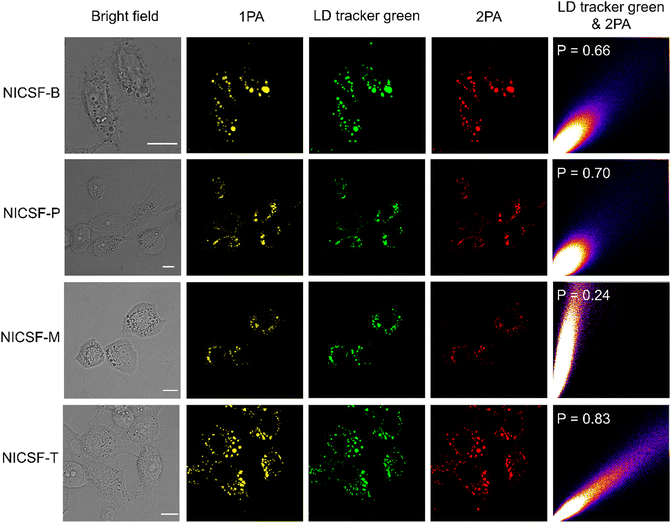
As NICSF-Xs are efficient DSE materials with strong PL emission, especially, fluorescence quenching can be well avoided in highly polar solvents, no matter as isolated molecules or aggregated nanoparticles, their application in bioimaging was explored. In the first, the emission properties of NICSF-Xs against interference, i.e., viscosity, polarity, etc., were studied in vitro in H2O/glycerol and THF/H2O mixed solvents, respectively. It was found that NICSF-Xs have good environmental stability, always showing fluorescence in different conditions with different viscosity and polarity, even though the intensities have certain changes (Fig. S2–S4, ESI†).Next, HepG2 cells were chose as the model cells, and the cytotoxicity of NICSF-Xs to HepG2 cells were investigated by using a standard 3-(4,5-dimethylthiazol-2-yl)-2,5-diphenyltetrazolium bromide (MTT) assay in the first hand, (Fig. S5, ESI†).43,44 After incubation of HepG2 cells with NICSF-Xs in various concentrations for 24 h, the viability of the cells is above 90%, suggesting the excellent biocompatibility and biosafety of the materials. In the following, 10 μM NICSF-Xs solution in DMSO were incubated with HepG2 cells for 0.5 h, and the one- and two-photon excited images were collected using a confocal laser scanning microscope (CLSM). As shown in (Fig. 7), when excited at 405 nm (1PA excitation), the HepG2 cells could be clearly lightened, indicating that the molecules were successfully internalized into the cells. Furthermore, the molecules particularly located at LD, which was confirmed by comparing the fluorescence images with the commercial LD targeting dye LD tracker green through co-location experiments. More interestingly, when excited by 720 nm light (2PA excitation), strong fluorescence could be observed as well. The Pearson coefficients were calculated to be 0.66 for NICSF-B, 0.70 for NICSF-P, 0.24 for NICSF-M, and 0.83 for NICSF-T, respectively, in the 2PA channel. Both the 1PA and 2PA fluorescence of NICSF-Xs in HepG2 cells can be sustained even after 20 minutes irradiation by the corresponding excitation light (Fig. S6 & S7, ESI†), suggesting the good photostability of the materials in live cells. These results illustrate that NICSF-Xs could be used for bioimaging in live cells, among which NICSF-T should be the best candidate for application as the high penetration, low photodamaging, LD targeting cell imaging material.
Conclusions
In conclusion, four fluorinated naphthalimide (NI)–cyanostilbene (CS) derivatives (NICSF-Xs, X = B, P, M, T) with F atoms at the ending ring of the CS moiety were designed and synthesized. NICSF-Xs showed moderate PL emission in solution with φ in the range of ∼0.2–0.4, and strong fluorescence in the aggregated state (φ in the range of ∼0.5–0.9), which can be classified as efficient DSEgens. NICSF-Xs showed unusual solvatokinetic effects in solution with strong PL in highly polar solvents, and particularly high φ is achieved in a protic solvent, possibly resulting from the H-bond formation between NICSF-Xs and solvents. TCSPC plots and single-crystal structure analysis indicate that the solid-state PL properties of NICSF-B and NICSF-P are barely influenced by the aggregation effect, while those of NICSF-M and NICSF-T were affected by H-aggregation. In addition, NICSF-Xs showed 2PA behaviors in both the dilute solution and the aggregated state. Derived from the strong fluorescence of the molecules in high-polarity solvents and the 2PA behaviour, NICSF-Xs were successfully applied for HepG2 cell imaging with LD targeting.Conflicts of interest
There are no conflicts to declare.Acknowledgements
We thank Dr Wei Du from Nanjing Tech University for his assistance in cell-imaging experiments. C. W. acknowledges the financial support from the National Natural Science Foundation of China (22205003) and the Start-up Foundation for Talents of Anhui University (S020318008/025). J. Y. acknowledges the funding support from the National Natural Science Foundation of China (51673001). Q. Z. is grateful for the funding support from the City University of Hong Kong (9380117, 7005620, and 7020040), Hong Kong Institute for Advanced Study, City University of Hong Kong, Hong Kong, P. R. China, and the State Key Laboratory of Supramolecular Structure and Materials, Jilin University (sklssm2023034), P. R. China.References
- T. L. Mako, J. M. Racicot and M. Levine, Chem. Rev., 2019, 119, 322–477 CrossRef CAS PubMed.
- X. Tian, L. C. Murfin, L. Wu, S. E. Lewis and T. D. James, Chem. Sci., 2021, 12, 3406–3426 RSC.
- J. M. Ha, S. H. Hur, A. Pathak, J.-E. Jeong and H. Y. Woo, NPG Asia Mater., 2021, 13, 53 CrossRef CAS.
- K. C. Kenry Chong and B. Liu, Acc. Chem. Res., 2019, 52, 3051–3063 CrossRef PubMed.
- J. Heo, D. P. Murale, H. Y. Yoon, V. Arun, S. Choi, E. Kim, J.-S. Lee and S. Kim, Aggregate, 2022, 3, e159 CrossRef CAS.
- S. Xu and Q. Zhang, Mater. Today Energy, 2021, 20, 100635 CrossRef CAS.
- J. Gierschner, J. Shi, B. Milián-Medina, D. Roca-Sanjuán, S. Varghese and S. Park, Adv. Opt. Mater., 2021, 9, 2002251 CrossRef CAS.
- J. Luo, Z. Xie, J. W. Y. Lam, L. Cheng, H. Chen, C. Qiu, H. S. Kwok, X. Zhan, Y. Liu, D. Zhu and B. Z. Tang, Chem. Commun., 2001, 1740–1741 RSC.
- E. E. Jelley, Nature, 1936, 138, 1009–1010 CrossRef CAS.
- J. Mei, N. L. C. Leung, R. T. K. Kwok, J. W. Y. Lam and B. Z. Tang, Chem. Rev., 2015, 115, 11718–11940 CrossRef CAS PubMed.
- J. L. Belmonte-Vázquez, Y. A. Amador-Sánchez, L. A. Rodríguez-Cortés and B. Rodríguez-Molina, Chem. Mater., 2021, 33, 7160–7184 CrossRef.
- Q. Qiu, P. Xu, Y. Zhu, J. Yu, M. Wei, W. Xi, H. Feng, J. Chen and Z. Qian, Chem. – Eur. J., 2019, 25, 15983–15987 CrossRef CAS PubMed.
- L. A. Rodríguez-Cortés, F. J. Hernández, M. Rodríguez, R. A. Toscano, A. Jiménez-Sánchez, R. Crespo-Otero and B. Rodríguez-Molina, Matter, 2023, 6, 1140–1159 CrossRef.
- T. Y. Weng, K. Zhang, B. Wu, X. Y. Chen, Q. Zou, T. Zeng and L. L. Zhu, Chem. – Eur. J., 2019, 25, 15281–15287 CrossRef CAS PubMed.
- Z. L. Xie, T. T. Su, E. Ubba, H. J. Deng, Z. Mao, T. Yu, T. Zheng, Y. Zhang, S. W. Liu and Z. G. Chi, J. Mater. Chem. C, 2019, 7, 3300–3305 RSC.
- Y. B. Zhou, Y. T. Chen, C. Duan, L. T. Zeng, M. C. Liu, Y. B. Zhou, W. X. Gao, X. B. Huang and H. Y. Wu, Chem. – Asian J., 2019, 14, 2242–2250 CrossRef CAS PubMed.
- K. Nishino, H. Yamamoto, K. Tanaka and Y. Chujo, Org. Lett., 2016, 18, 4064–4067 CrossRef CAS PubMed.
- K. Ogasawara, K. Nakamura and N. Kobayashi, J. Mater. Chem. C, 2016, 4, 4805–4813 RSC.
- L. Zhang, L. Ding, S. Zhou, F. Zhang and P. Gu, Dyes Pigm., 2023, 210, 110991 CrossRef CAS.
- D. Wang, X. Wang, S. Zhou, P. Gu, X. Zhu, C. Wang and Q. Zhang, Coord. Chem. Rev., 2023, 482, 215074 CrossRef CAS.
- O. F. Mohammed, O.-H. Kwon, C. M. Othon and A. H. Zewail, Angew. Chem., Int. Ed., 2009, 48, 6251–6256 CrossRef CAS PubMed.
- A. Marini, A. Muñoz-Losa, A. Biancardi and B. Mennucci, J. Phys. Chem. B, 2010, 114, 17128–17135 CrossRef CAS PubMed.
- D. R. Larson, W. R. Zipfel, R. M. Williams, S. W. Clark, M. P. Bruchez, F. W. Wise and W. W. Webb, Science, 2003, 300, 1434–1436 CrossRef CAS PubMed.
- K. Kailass, O. Sadovski, W. R. Zipfel and A. A. Beharry, J. Med. Chem., 2022, 65, 8855–8868 CrossRef CAS PubMed.
- G. S. He, L.-S. Tan, Q. Zheng and P. N. Prasad, Chem. Rev., 2008, 108, 1245–1330 CrossRef CAS PubMed.
- H.-W. Liang, T. Jia, Z.-Z. Wang, J.-Q. Wang, D.-Y. Hou, L. Wang, X. Gao, H.-L. Sun and H. Wang, Mater. Chem. Front., 2022, 6, 512–518 RSC.
- Y. Ni, L. Yang, L. Kong, C. Wang, Q. Zhang and J. Yang, Mater. Chem. Front., 2022, 6, 3522–3530 RSC.
- N. Meher and P. K. Iyer, Nanoscale, 2019, 11, 13233–13242 RSC.
- C. Reichardt, Justus Liebigs Ann. Chem., 1971, 752, 64–67 CrossRef CAS.
- N. Mataga, Y. Kaifu and M. Koizumi, Bull. Chem. Soc. Jpn., 1956, 29, 465–470 CrossRef CAS.
- Z. R. Grabowski, K. Rotkiewicz and W. Rettig, Chem. Rev., 2003, 103, 3899–4032 CrossRef PubMed.
- P. Wang and S. Wu, J. Lumin., 1994, 62, 33–39 CrossRef CAS.
- R. Gahlaut, N. Tewari, J. P. Bridhkoti, N. K. Joshi, H. C. Joshi and S. Pant, J. Mol. Liq., 2011, 163, 141–146 CrossRef CAS.
- S. L. Madej, S. Okajima and E. C. Lim, J. Chem. Phys., 1976, 65, 1219–1220 CrossRef CAS.
- W. Siebrand and M. Z. Zgierski, J. Chem. Phys., 1980, 72, 1641–1646 CrossRef CAS.
- A. L. Serrano, T. Troxler, M. J. Tucker and F. Gai, Chem. Phys. Lett., 2010, 487, 303–306 CrossRef CAS PubMed.
- J. Shi, L. E. Aguilar Suarez, S.-J. Yoon, S. Varghese, C. Serpa, S. Y. Park, L. Lüer, D. Roca-Sanjuán, B. Milián-Medina and J. Gierschner, J. Phys. Chem. C, 2017, 121, 23166–23183 CrossRef CAS.
- S. Varghese, S.-J. Yoon, E. M. Calzado, S. Casado, P. G. Boj, M. A. Díaz-García, R. Resel, R. Fischer, B. Milián-Medina, R. Wannemacher, S. Y. Park and J. Gierschner, Adv. Mater., 2012, 24, 6473–6478 CrossRef CAS PubMed.
- S. Varghese, S. K. Park, S. Casado, R. C. Fischer, R. Resel, B. Milián-Medina, R. Wannemacher, S. Y. Park and J. Gierschner, J. Phys. Chem. Lett., 2013, 4, 1597–1602 CrossRef CAS PubMed.
- H. S. Quah, W. Chen, M. K. Schreyer, H. Yang, M. W. Wong, W. Ji and J. J. Vittal, Nat. Commun., 2015, 6, 7954 CrossRef CAS PubMed.
- P.-Y. Gu, C.-J. Lu, Z.-J. Hu, N.-J. Li, T.-T. Zhao, Q.-F. Xu, Q.-H. Xu, J.-D. Zhang and J.-M. Lu, J. Mater. Chem. C, 2013, 1, 2599–2606 RSC.
- X. Long, J. Wu, S. Yang, Z. Deng, Y. Zheng, W. Zhang, X.-F. Jiang, F. Lu, M.-D. Li and L. Xu, J. Mater. Chem. C, 2021, 9, 11679–11689 RSC.
- W.-L. Zhou, Y. Chen, Q. Yu, H. Zhang, Z.-X. Liu, X.-Y. Dai, J.-J. Li and Y. Liu, Nat. Commun., 2020, 11, 4655 CrossRef CAS PubMed.
- F. Xia, J. Wu, X. Wu, Q. Hu, J. Dai and X. Lou, Acc. Chem. Res., 2019, 52, 3064–3074 CrossRef CAS PubMed.
Footnotes |
| † Electronic supplementary information (ESI) available. CCDC 2257053–2257056. For ESI and crystallographic data in CIF or other electronic format see DOI: https://doi.org/10.1039/d3tb01034a |
| ‡ These authors contributed equally to this work. |
| This journal is © The Royal Society of Chemistry 2023 |


