Local microenvironment tuning induces switching between electrochemical CO2 reduction pathways†
Surani Bin
Dolmanan‡
a,
Annette
Böhme‡
bc,
Ziting
Fan‡
 def,
Alex J.
King
 gh,
Aidan Q.
Fenwick
bi,
Albertus Denny
Handoko
 a,
Wan Ru
Leow
 j,
Adam Z.
Weber
 gh,
Xinbin
Ma
 de,
Edwin
Khoo
 k,
Harry A.
Atwater
 *bc and
Yanwei
Lum
 *af
*af
aInstitute of Materials Research and Engineering, Agency for Science, Technology and Research (A*STAR), Innovis, Singapore. E-mail: lumyw@nus.edu.sg
bLiquid Sunlight Alliance, California Institute of Technology, Pasadena, California, USA. E-mail: haa@caltech.edu
cDepartment of Applied Physics and Material Science, California Institute of Technology, Pasadena, California, USA
dJoint School of National University of Singapore and Tianjin University, International Campus of Tianjin University, Binhai New City, Fuzhou, China
eKey Laboratory for Green Chemical Technology of Ministry of Education, Collaborative Innovation Center of Chemical Science and Engineering, School of Chemical Engineering and Technology, Tianjin University, Tianjin, China
fDepartment of Chemical and Biomolecular Engineering, National University of Singapore, Singapore, Singapore
gDepartment of Chemical and Biomolecular Engineering, University of California Berkeley, Berkeley, California, USA
hLiquid Sunlight Alliance, Lawrence Berkeley National Laboratory, Berkeley, California 94720, USA
iDepartment of Chemistry and Chemical Engineering, California Institute of Technology, Pasadena, California, USA
jInstitute of Sustainability for Chemicals, Energy and Environment (ISCE2), Agency for Science, Technology and Research (A*STAR), Jurong Island, Singapore
kInstitute for Infocomm Research, Agency for Science, Technology, and Research (A*STAR), Connexis, Singapore
First published on 30th May 2023
Abstract
Gas diffusion layers (GDL) have become a critical component in electrochemical CO2 reduction (CO2R) systems because they can enable high current densities needed for industrially relevant productivity. Besides this function, it is often assumed that the choice of catalyst and electrolyte play much more important roles than the GDL in influencing the observed product selectivity. Here, we show that tuning of the GDL pore size can be used to control the local microenvironment of the catalyst and hence, effect significant changes in catalytic outcomes. This concept is demonstrated using sputtered Ag films on hydrophobic PTFE substrates with 6 different pore sizes. Although Ag is known to be a predominantly CO generating catalyst, we find that smaller pore sizes favor the generation of formate up to a faradaic efficiency of 43%. Combined experimental and simulation results show that this is due to the influence of the pore size on CO2 mass transport, which alters the local pH at the electrode, resulting in reaction pathway switching between CO and formate. Our results highlight the importance of the local microenvironment as an experimental knob that can be rationally tuned for controlling product selectivity: a key consideration in the design of CO2R systems.
Introduction
Renewable electricity powered electrochemical CO2 reduction (CO2R) is a promising strategy for the conversion of carbon dioxide emissions into value-added chemicals and fuels.1–11 For this technology to become economically competitive, recent technoeconomic analysis12,13 emphasizes the importance of achieving higher current densities, energy efficiency and faradaic efficiency (FE). As a result, a significant amount of research in this field has been devoted to discovering and designing new catalyst systems for facilitating CO2R with improved performance.14–21 The electrolyte is known to be a key factor as well. For example, it was discovered that larger alkali metal cations (Cs+) are more beneficial towards promoting CO2R as compared to when smaller cations (Li+) are employed.22–25Furthermore, the reactor system has also been shown to be important. In the majority of early reports in the field, CO2R was conducted in H-type cells where CO2 is introduced into the system via continuous bubbling into the electrolyte.26,27 However, the low solubility of CO2 (33 mM) typically results in limiting current densities of only several tens of mA cm−2 due to significant mass transport limitations. To raise current densities towards industrially relevant productivity, catalyst particles are deposited onto gas diffusion layers (GDL), allowing CO2 mass transport limitations to be overcome28–34 and enabling current densities of >100 mA cm−2. This is due to the hydrophobic and porous nature of the GDL, resulting in the creation of thin layers of electrolyte over the catalyst particles. These thin layers of electrolyte have significantly lower CO2 transport diffusion lengths, thus facilitating rapid supply of reactants to the catalyst surface. Beyond this role, it is often assumed that the choice of catalyst material and electrolyte play more dominant roles compared to the GDL in controlling the observed product selectivity.
Although the mass transport of CO2 through the GDL should in principle be rapid, it is known that its effective diffusion coefficient is related to the porosity and average pore radius of the porous medium through the Bruggeman relationship.35 We therefore reasoned that tuning these parameters could be used to influence the mass transport of CO2, which directly impacts the catalyst microenvironment (local pH and CO2 reactant supply). This is because CO2 molecules can directly react with and hence neutralize electrochemically generated OH− to form bicarbonate and carbonate anions.27,36 The altered microenvironment could in turn result in a significant change in catalytic outcomes: an additional experimental knob to control CO2R selectivity beyond catalyst design and choice of electrolyte.
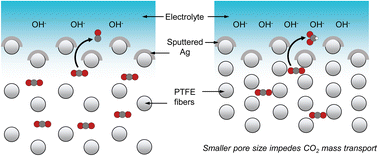
In this work, we demonstrate this concept using sputtered Ag films onto hydrophobic PTFE substrates with 6 different pore sizes as the GDL37,38 (Scheme 1). Even though Ag is well known to predominantly produce CO,39–43 we find that smaller PTFE pore sizes favor formate production up to a FE of 43%. Combined experimental and simulation results show that a decrease in GDL pore size slows down CO2 mass transport, leading to a higher local pH and hence reaction pathway switching from CO to formate. This pH trend was confirmed using a confocal microscopy setup44,45 equipped with a custom-built electrochemical cell and a pH sensitive fluorescent dye in the electrolyte. Our results highlight the importance of the properties of the GDL, which can significantly impact the catalyst local microenvironment and should be an important consideration for the design of CO2R systems.
Results and discussion
To lend support to our hypothesis, we first turned to multiphysics simulations35 (see methods section in ESI†) to understand the impact of the GDL porosity on the local pH of the electrode during CO2R. In our simulations, we varied the porosity values from 0.4 to 0.8 and obtained the steady-state results through a series of applied current densities. Fig. 1 shows the simulation results, and we observed a qualitative trend of lower pH and higher CO2 concentration as the porosity of the diffusion medium increases. This is consistent with the notion that a lower porosity can indeed impede CO2 mass transport, hence resulting in changes in the reaction microenvironment of the catalyst.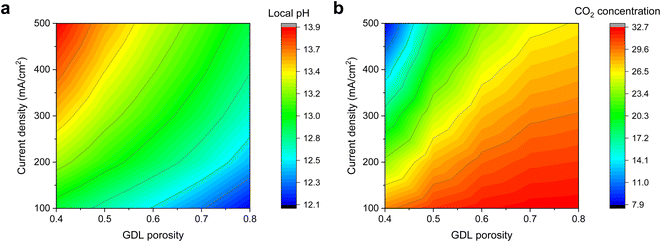 | ||
| Fig. 1 Multiphysics simulation results of varying GDL porosity on the (a) local pH and (b) CO2 concentration at various cathodic current densities of 100, 200, 300, 400 and 500 mA cm−2. A lower porosity is observed to result in a higher local pH and lower CO2 concentration. Detailed results can be found in the ESI (Fig. S1–S6†). | ||
Encouraged by these results, we began by sputtering 325 nm thick Ag films onto hydrophobic PTFE37,38 substrates with different pore sizes of 0.02, 0.1, 0.22, 0.45, 1.0 and 3.0 μm for use as gas diffusion electrodes (Fig. S7†). Each electrode will hence be termed as Ag/PTFE(X), where X is the pore size. Top-down scanning electron microscopy (SEM) images show the structure of these electrodes, with a web-like morphology of interconnected PTFE fibers coated conformally with Ag (Fig. 2). These SEM images reveal the 3D network of macro-scale pores that are inherently formed between the fibers, serving as pathways for reactant and product transport (Fig. S8–S10†). As would be expected, the PTFE substrates with larger pore sizes appear visibly more open and less dense.
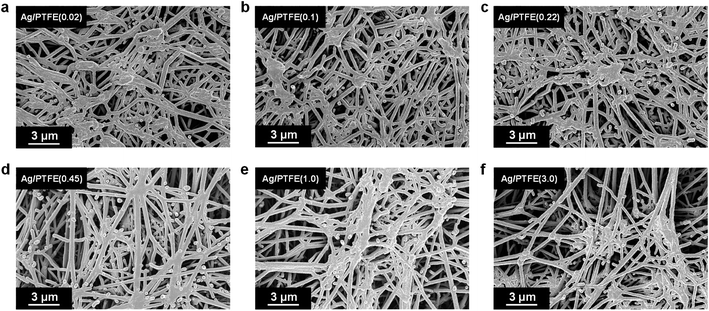 | ||
| Fig. 2 SEM images of hydrophobic PTFE substrates of various pore sizes coated with 325 nm of Ag using sputter deposition. The pore sizes are: (a) 0.02 μm, (b) 0.1 μm, (c) 0.22 μm, (d) 0.45 μm, (e) 1.0 μm and (f) 3.0 μm. Digital photographs (Fig. S7†) and more SEM images (Fig. S8–S10†) of the samples can be found in the ESI.† | ||
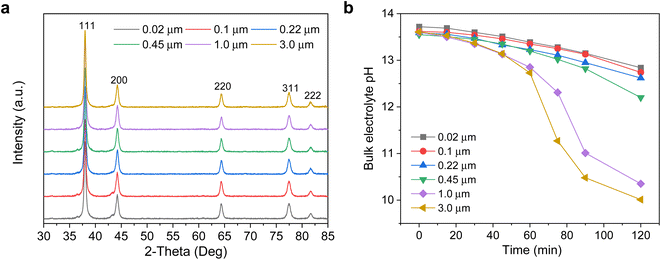
X-ray diffraction (XRD) characterization of the electrodes was performed (Fig. 3a), with Ag (111) observed as the dominant crystal facet and with no obvious differences between each of the Ag/PTFE with various GDL pore sizes. We also carried out cyclic voltammetry in a potential range where only non-faradaic processes occur to determine the double layer capacitance of each Ag/PTFE electrode (see methods section in ESI†). This gives an indication of the electrochemically active surface area (ECSA) since this value is directly proportional to the double layer capacitance.46 The results (Fig. S11 and S12†) show that despite pore size differences, the double layer capacitance and hence ECSA remains approximately within the same order of magnitude.
We then designed experiments to obtain a qualitative measure of the CO2 mass transport for the different pore size Ag/PTFE electrodes. Each electrode was assembled into a gas diffusion flow cell system (Fig. S13†), with a similar design to what was previously reported in the literature.30,37 15 ml of 1 M KOH was used as the electrolyte, which was continuously recirculated between the cathode chamber and an external centrifuge tube reservoir using a peristaltic pump. CO2 was flowed at a rate of 20 sccm, through a gas chamber in contact with the backside of Ag/PTFE. Without applying any current, we monitored the bulk pH of the electrolyte over a 120 min period by placing a pH probe into the external centrifuge tube reservoir. The results in Fig. 3b show that the bulk pH decreases significantly with time, as a result of the CO2 gas continuously diffusing from the backside of the Ag/PTFE and reacting with hydroxide in the electrolyte to form carbonate.36 We also observe that the bulk pH decreases more rapidly with increasing PTFE pore size. Importantly, this allows us to experimentally confirm that larger pore sizes do indeed facilitate faster CO2 mass transport.
Next, we sought to assess the influence of PTFE pore size on the product selectivity of the Ag/PTFE catalysts. Using the same flow cell system, we evaluated each Ag/PTFE under cathodic current densities of 100, 200 and 300 mA cm−2 in 1 M KHCO3 electrolyte and the FE data are shown in Fig. 4a–c. Based on the results, we observe that the formate FE appears to increase with decreasing pore size, from 24% for Ag/PTFE(3.0) up to a value of 43% for Ag/PTFE(0.02) at 200 mA cm−2. For better visualization, the formate FE is also presented as a contour plot (Fig. 4d), where the general trend of higher formate FE with smaller pore sizes is observed to hold true for all tested current densities. Also, the hydrogen FE tends to increase with larger pore size. These combined effects result in the CO FE initially increasing with pore size and then decreasing again, with a peak value of around 80% at 100 mA cm−2 for Ag/PTFE(1.0).
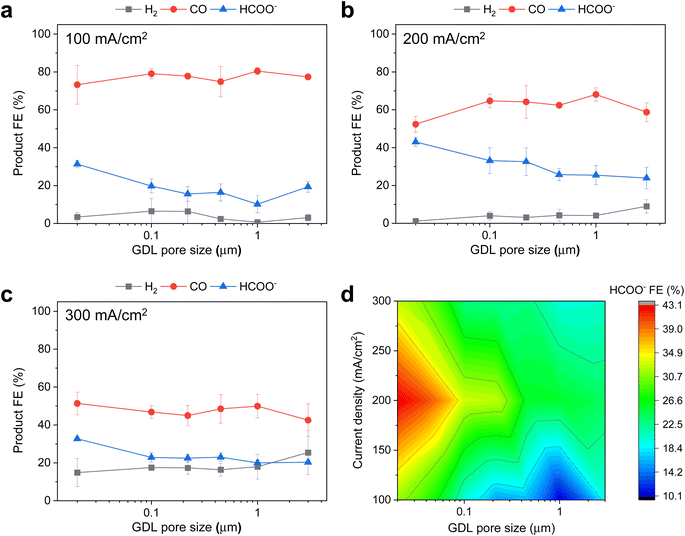 | ||
| Fig. 4 Electrochemical CO2 reduction FE results with 1 M KHCO3 as the electrolyte. (a), (b) and (c) show the product FE data for Ag/PTFE as a function of GDL pore size under cathodic current densities of 100, 200 and 300 mA cm−2 respectively. (d) Is the corresponding color contour map of the HCOO− FE data for Ag/PTFE as a function of current density and GDL pore size. More data available in the ESI (Fig. S16†). | ||
Based on the bulk pH monitoring and simulation results, we hypothesized that this could be due to reduced CO2 mass transport at the smaller pore sizes, resulting in a higher local pH and, thus, switching selectivity towards formate. This selectivity switching was previously observed by Seifitokaldani et al., where CO2R was performed with Ag catalysts in KOH electrolyte47 with concentrations ranging from 0.1 M to 11 M. It was found that formate was produced with almost 60% FE in 11 M KOH, compared to only about 4% in 0.1 M KOH. Using DFT simulations, they concluded that this was due to the activation energy barrier for formate becoming lower than that compared to CO, in the absence of hydronium ions.
Hence, we employed a suite of experiments to further understand these initial observations and verify our working hypothesis. Firstly, we tested the Ag/PTFE catalysts in 2 M KHCO3, which has a stronger pH buffering ability as compared to 1 M KHCO3.48 In this case, we did not observe any significant differences in the formate FE as a function of GDL pore size (Fig. S14a and b†) at cathodic current densities of 100 and 200 mA cm−2. This suggests that the stronger buffer results in a similar local pH value for each of these cases, leading to a similar formate FE of around 14%. However, at the higher current density of 300 mA cm−2, the trend of higher formate FE with smaller pore size appears again (Fig. S14c†), with a FE of 19% for Ag/PTFE(3.0) as compared to a FE of 29% for Ag/PTFE(0.02). This results from the expected higher local pH rise with a larger current density and is therefore consistent with the notion that pH effects are indeed influencing the observed FE to formate.
To further investigate the effect of buffering, similar CO2R experiments were carried out with additional buffer conditions of 0.5 M and 1.5 M KHCO3 at 300 mA cm−2 for each pore size condition. The results for Ag/PTFE(0.22) are represented in Fig. 5a, where a trend of higher formate FE with lower buffer concentration is observed. This is because lower buffer concentrations result in a higher local pH,48 which then promotes the conversion of CO2 to formate. Formate FE for all Ag/PTFE samples under the different buffer conditions are shown as a colour contour map (Fig. 5b), where the trend of higher formate FE with a lower buffer concentration is observed to hold true for all GDL pore sizes.
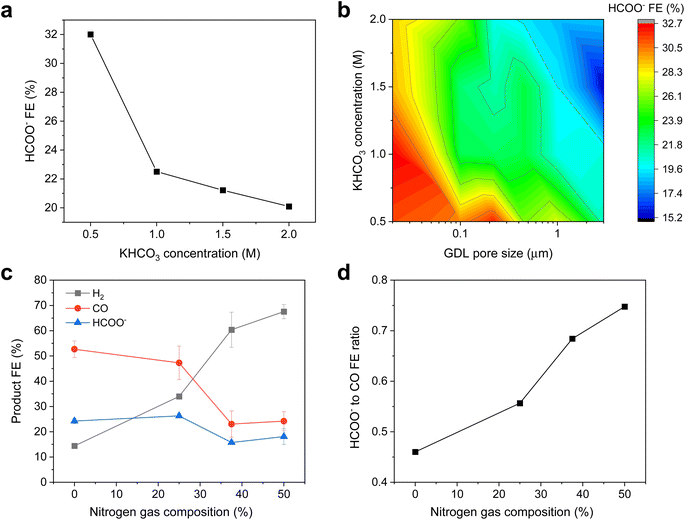 | ||
| Fig. 5 (a) HCOO− FE data for Ag/PTFE(0.22) as a function of KHCO3 concentration. (b) Color contour map of the HCOO− FE data for Ag/PTFE as a function of KHCO3 concentration and GDL pore size. More data for (a) and (b) are available in the ESI (Fig. S15–S17†). (c) Product FE data for the case where the CO2 feed stream was diluted with various amounts of N2. Ag/PTFE(0.45) was used as the cathode and 1 M KHCO3 was used as the electrolyte at an applied cathodic current density of 300 mA cm−2. (d) Graph showing the formate to CO ratio as a function of N2 gas dilution, based on the data shown in (c). | ||
We also carried out CO2R electrolysis experiments where the CO2 feed was diluted with N2. For a lower CO2 partial pressure, we expect the local pH to be higher due to fewer available CO2 to react with electrochemically formed OH−. For these experiments, Ag/PTFE(0.45) was used as the electrode and a constant current density of 300 mA cm−2 was applied. From the results (Fig. 5b and c), we observe that lower CO2 partial pressures do indeed result in a higher formate to CO ratio, consistent with our working hypothesis.
Furthermore, we also conducted in situ measurements using confocal microscopy with a pH sensitive fluorescent dye to provide experimental verification of the local pH trends as a function of GDL pore size and applied current density. Fluorescent confocal laser scanning microscopy enables imaging of the local pH in three spatial dimensions with a resolution of one micrometer under operating conditions.44,45 Such experiments were carried out using a custom-built electrochemical cell (Fig. 6a and S18†), consisting of a gas chamber for CO2 flow and an electrolyte chamber that is stacked above it. The electrolyte chamber is open at the top, which allows for a water immersion objective to be dipped into the electrolyte, in close proximity to the electrode surface.
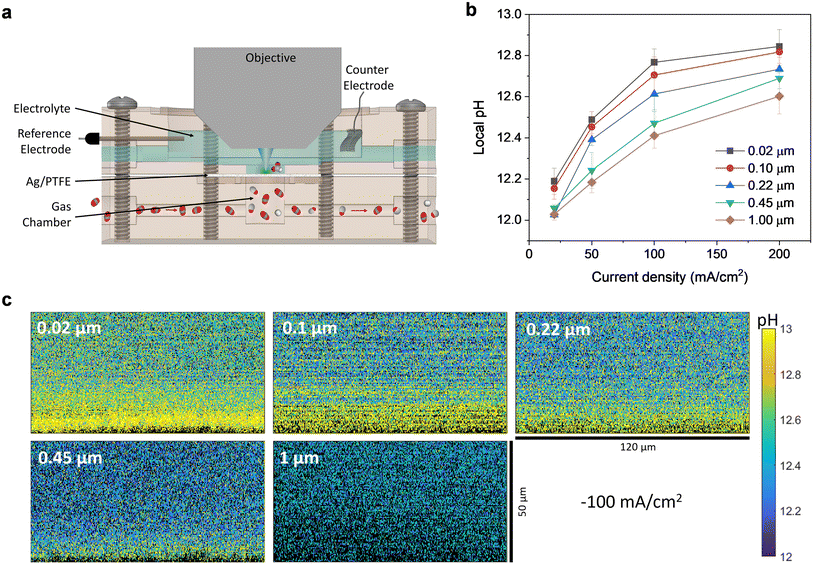 | ||
| Fig. 6 (a) Cross section of the custom-built electrochemical cell with water immersion objective for local pH measurements with APTS. (b) Local pH value averaged from zero to forty micrometers above the electrode surface as a function of current density for different Ag/PTFE GDLs. (c) Representative pH maps as a cross section through the plane perpendicular to the electrode surface for different Ag/PTFE samples at 100 mA cm−2. pH maps for other current densities can be found in Fig. S19.† | ||
We studied the local pH in the vicinity of the Ag/PTFE electrodes with the ratiometric fluorescent dye 8-aminopyrene-1,3,6-trisulfonic acid trisodium salt (APTS), which is dissolved in the electrolyte. APTS is a direct sensor of the local hydroxide activity and can be used to deduce the local pH (sensitive to values between 11.2 and 14). A more detailed analysis of the sensing mechanism of APTS can be found elsewhere.45 Measurements for all cases were performed using 1 M KHCO3 electrolyte with 200 μM APTS, which was constantly circulated through the electrochemical cell (more details in the ESI†).
The pH was mapped for a series of current densities between 20 mA cm−2 and 200 mA cm−2, in the plane perpendicular to the electrode surface, starting from a few micrometers below the electrode surface. The dimensions of each pH map are 120 μm in the x direction and 50 μm in the z direction (Fig. 6c and S19†). From the maps, a pH gradient can be clearly observed for all cases, with the pH being higher at points closer to the electrode surface. We averaged the pH in the area between the electrode surface and 40 micrometers above the electrode surface and plotted this as a function of current density (Fig. 6b). As expected, the pH increases as the current density increases since OH− is created as a by-product of CO2 reduction and hydrogen evolution.
Most importantly, for all current densities investigated, there is the clear trend that the local pH decreases with increasing pore size of the GDL. This is consistent with our preceding experimental and simulation results, that a larger GDL pore size can indeed better facilitate CO2 mass transport. This leads to more excess CO2 molecules that are available at the electrode surface to react with electrochemically generated OH−, leading to a lower pH value. These results are therefore strong experimental evidence for our hypothesis that tuning the GDL pore size can indeed directly impact the local pH. This then results in selectivity switching, leading to the observed increased selectivity towards conversion of CO2 to formate.
Finally, we sought to understand if this local microenvironment effect could also affect other catalysts for electrochemical CO2 reduction. Previous literature reports have indicated that an increased local pH can induce a higher selectivity towards multicarbon (C2+) products with Cu based catalysts. Hence to explore this effect, we prepared a series of samples by sputtering 325 nm of Cu onto PTFE substrates of different pore sizes (Fig. S20†). These catalysts were then tested at a constant cathodic current density of 200 mA cm−2 in 1 M KHCO3 electrolyte. The results (Fig. S21†) show that a smaller pore size does indeed lead to an increase in the FE towards C2+ products, as a consequence of the induced higher local pH.
However, the C2+ FE was observed to drop once the pore size becomes too small. This is because the local CO2 availability is expected to diminish at the smallest pore sizes, and these conditions are less favorable towards the formation of C2+ products. Our findings are consistent with the work by Strasser and co-workers, where they observed different “selectivity zones” within their Cu nanoparticle catalyst coatings on a gas diffusion layer.49 Zones closer to the gas diffusion layer experience higher local pH and increased CO2 availability, which enhances the C2+ selectivity. On the other hand, zones further away from the gas diffusion layer experience CO2 depletion, which reduces C2+ product formation. These observations are supported by another report in the literature,50 which showed that a lowered CO2 partial pressure suppresses the C2+ FE.
Conclusions
In this work, we investigated how the pore size of the gas diffusion layer can be tuned to impact the catalyst local microenvironment and hence, the selectivity for electrochemical CO2 reduction. We first performed multiphysics modelling of the reaction system, which showed that smaller GDL porosity can slow down CO2 mass transport, resulting in a higher local pH at the electrode. Encouraged by these results, we studied this experimentally using sputtered Ag films on hydrophobic PTFE substrates with 6 different pore sizes. Although Ag is known to be a predominantly CO generating catalyst, we find that smaller pore sizes favor the generation of formate up to a faradaic efficiency of 43%. This is due to the higher local pH, which induces reaction pathway switching towards formate at the expense of CO. These observations are also supported by further investigations with different buffer concentrations and partial pressure experiments. A confocal microscopy setup was further used to map out the electrode local pH using a pH sensitive fluorescent dye. Through this, we experimentally verified that a smaller (larger) pore size does indeed result in a higher (lower) local pH. Overall, our results show how the GDL pore size can be used to impact the catalyst microenvironment and hence serve as an experimental knob that can be rationally controlled to influence product selectivity. These findings will inform and aid the future design of more selective and efficient CO2R systems.Author contributions
Y. L. and H. A. A. supervised the project. Y. L. conceived the idea and designed the experiments. S. B. D. carried out all the experimental work. A. B. performed and analyzed the confocal microscopy experiments. Z. F. and A. J. K. performed the multiphysics simulations. A. Z. W. and E. K. supervised the multiphysics simulations. A. Q. F., A. D. H., W. R. L. and X. M. contributed to data analysis and manuscript editing. Y. L., A. B. and S. B. D. co-wrote the manuscript. All authors discussed the results and assisted during the manuscript preparation.Conflicts of interest
The authors declare no competing interests.Acknowledgements
Y. L. acknowledges support and funding from the A*STAR (Agency for Science, Technology and Research) under its LCERFI program (Award No. U2102d2002) and A*STAR Career Development Award (Project No. 202D800037). A. B., H. A. A., A. Z. W., and A. J. K. would like to acknowledge support from the Liquid Sunlight Alliance, which is supported by the U.S. Department of Energy, Office of Science, Office of Basic Energy Sciences, Fuels from Sunlight Hub under Award Number DE-SC0021266. A. J. K. acknowledges funding from the National Science Foundation Graduate Research Fellowship under Grant No. DGE 2146752. Z. F. and X. M. acknowledges funding from National Natural Science Foundation of China (22178265, U21B2096 and 21938008). W. R. L. would like to acknowledge the A*STAR Career Development Award (Grant number: C210112053) and Young Individual Research Grant (Grant number: A2084c0180).References
- R. I. Masel,
et al., An industrial perspective on catalysts for low-temperature CO2 electrolysis, Nat. Nanotechnol., 2021, 16, 118–128 CrossRef CAS
.
- O. S. Bushuyev,
et al., What Should We Make with CO2 and How Can We Make It?, Joule, 2018, 2, 825–832 CrossRef CAS
.
- P. de Luna,
et al., What would it take for renewably powered electrosynthesis to displace petrochemical processes?, Science, 2019, 364, eaav3506 CrossRef CAS
.
- L. Fan,
et al., Strategies in catalysts and electrolyzer design for electrochemical CO2 reduction toward C2+ products, Sci. Adv., 2020, 6, eaay3111 CrossRef CAS PubMed
.
- S. Nitopi,
et al., Progress and Perspectives of Electrochemical CO2 Reduction on Copper in Aqueous Electrolyte, Chem. Rev., 2019, 119, 7610–7672 CrossRef CAS PubMed
.
- D. Gao, R. M. Arán-Ais, H. S. Jeon and B. Roldan Cuenya, Rational catalyst and electrolyte design for CO2 electroreduction towards multicarbon products, Nat. Catal., 2019, 2, 198–210 CrossRef CAS
.
- S. Chu, Y. Cui and N. Liu, The path towards sustainable energy, Nat. Mater., 2016, 16, 16–22 CrossRef PubMed
.
- Y. Y. Birdja,
et al., Advances and challenges in understanding the electrocatalytic conversion of carbon dioxide to fuels, Nat. Energy, 2019, 4, 732–745 CrossRef CAS
.
- S. Gao,
et al., Atomically Dispersed Metal-Based Catalysts for Zn–CO2 Batteries, Small Struct., 2022, 3, 2200086 CrossRef CAS
.
- T. Wei,
et al., Oxygen Vacancy-Rich Amorphous Copper Oxide Enables Highly Selective Electroreduction of Carbon Dioxide to Ethylene, Acta Phys.-Chim. Sin., 2022, 202207026 Search PubMed
.
- R. Zhao,
et al., Recent Progress in Electrocatalytic Methanation of CO2 at Ambient Conditions, Adv. Funct. Mater., 2021, 31, 2009449 CrossRef CAS
.
- M. Jouny, W. Luc and F. Jiao, General Techno-Economic Analysis of CO2 Electrolysis Systems, Ind. Eng. Chem. Res., 2018, 57, 2165–2177 CrossRef CAS
.
- H. Shin, K. U. Hansen and F. Jiao, Techno-economic assessment of low-temperature carbon dioxide electrolysis, Nat. Sustain., 2021, 4, 911–919 CrossRef
.
- I. E. L. Stephens,
et al., 2022 roadmap on low temperature electrochemical CO2 reduction, J. Phys.: Energy, 2022, 4, 042003 Search PubMed
.
- J. Qiao, Y. Liu, F. Hong and J. Zhang, A review of catalysts for the electroreduction of carbon dioxide to produce low-carbon fuels, Chem. Soc. Rev., 2014, 43, 631–675 RSC
.
- R. Kortlever, J. Shen, K. J. P. Schouten, F. Calle-Vallejo and M. T. M. Koper, Catalysts and Reaction Pathways for the Electrochemical Reduction of Carbon Dioxide, J. Phys. Chem. Lett., 2015, 6, 4073–4082 CrossRef CAS PubMed
.
- Z. Zhao, J. Zhang, M. Lei and Y. Lum, Reviewing the impact of halides on electrochemical CO2 reduction, Nano Res. Energy, 2023, 2, e9120044 CrossRef
.
- S. Mou,
et al., Cu2Sb decorated Cu nanowire arrays for selective electrocatalytic CO2 to CO conversion, Nano Res., 2021, 14, 2831–2836 CrossRef CAS
.
- L. Ji,
et al., Highly Selective Electrochemical Reduction of CO2 to Alcohols on an FeP Nanoarray, Angew. Chem., Int. Ed., 2020, 59, 758–762 CrossRef CAS PubMed
.
- T. Ahmad,
et al., Electrochemical CO2 reduction to C2+ products using Cu-based electrocatalysts: A review, Nano Res. Energy, 2022, 1, e9120021 CrossRef
.
- A. Goyal, C. J. Bondue, M. Graf and M. T. M. Koper, Effect of pore diameter and length on electrochemical CO2 reduction reaction at nanoporous gold catalysts, Chem. Sci., 2022, 13, 3288–3298 RSC
.
- M. R. Singh, Y. Kwon, Y. Lum, J. W. Ager and A. T. Bell, Hydrolysis of Electrolyte Cations Enhances the Electrochemical Reduction of CO2 over Ag and Cu, J. Am. Chem. Soc., 2016, 138, 13006–13012 CrossRef CAS PubMed
.
- S. Ringe,
et al., Understanding cation effects in electrochemical CO2 reduction, Energy Environ. Sci., 2019, 12, 3001–3014 RSC
.
- J. Resasco,
et al., Promoter Effects of Alkali Metal Cations on the Electrochemical Reduction of Carbon Dioxide, J. Am. Chem. Soc., 2017, 139, 11277–11287 CrossRef CAS PubMed
.
- J. C. Bui,
et al., Engineering Catalyst–Electrolyte Microenvironments to Optimize the Activity and Selectivity for the Electrochemical Reduction of CO2 on Cu and Ag, Acc. Chem. Res., 2022, 55, 484–494 CrossRef CAS PubMed
.
- K. P. Kuhl, E. R. Cave, D. N. Abram and T. F. Jaramillo, New insights into the electrochemical reduction of carbon dioxide on metallic copper surfaces, Energy Environ. Sci., 2012, 5, 7050–7059 RSC
.
-
Y. Hori, Electrochemical CO2 Reduction on Metal Electrodes, in Modern Aspects of Electrochemistry, ed. C. G. Vayenas, R. E. White and M. E. Gamboa-Aldeco, Springer, New York, 2008, vol. 42, pp. 89–189 Search PubMed
.
- D. Higgins, C. Hahn, C. Xiang, T. F. Jaramillo and A. Z. Weber, Gas-Diffusion Electrodes for Carbon Dioxide Reduction: A New Paradigm, ACS Energy Lett., 2019, 4, 317–324 CrossRef CAS
.
- N. T. Nesbitt,
et al., Liquid–Solid Boundaries Dominate Activity of CO2 Reduction on Gas-Diffusion Electrodes, ACS Catal., 2020, 10, 14093–14106 CrossRef CAS
.
- K. Liu, W. A. Smith and T. Burdyny, Introductory Guide to Assembling and Operating Gas Diffusion Electrodes for Electrochemical CO2 Reduction, ACS Energy Lett., 2019, 4, 639–643 CrossRef CAS PubMed
.
- A. Q. Fenwick,
et al., Probing the Catalytically Active Region in a Nanoporous Gold Gas Diffusion Electrode for Highly Selective Carbon Dioxide Reduction, ACS Energy Lett., 2022, 7, 871–879 CrossRef CAS
.
- Z. Xing, L. Hu, D. S. Ripatti, X. Hu and X. Feng, Enhancing carbon dioxide gas-diffusion electrolysis by creating a hydrophobic catalyst microenvironment, Nat. Commun., 2021, 12, 136 CrossRef CAS PubMed
.
- K. U. Hansen and F. Jiao, Hydrophobicity of CO2 gas diffusion electrodes, Joule, 2021, 5, 754–757 CrossRef
.
- F. Huq,
et al., Influence of the PTFE Membrane Thickness on the CO2 Electroreduction Performance of Sputtered Cu-PTFE Gas Diffusion Electrodes, ChemElectroChem, 2022, 9, e202101279 CrossRef CAS
.
- L. C. Weng, A. T. Bell and A. Z. Weber, Modeling gas-diffusion electrodes for CO2 reduction, Phys. Chem. Chem. Phys., 2018, 20, 16973–16984 RSC
.
- J. A. Rabinowitz and M. W. Kanan, The future of low-temperature carbon dioxide electrolysis depends on solving one basic problem, Nat. Commun., 2020, 11, 5231 CrossRef CAS
.
- C. T. Dinh,
et al., CO2 electroreduction to ethylene via hydroxide-mediated copper catalysis at an abrupt interface, Science, 2018, 360, 783–787 CrossRef CAS PubMed
.
- F. P. García de Arquer,
et al., CO2 electrolysis to multicarbon products at activities greater than 1 A cm−2, Science, 2020, 367, 661–666 CrossRef PubMed
.
- T. Hatsukade, K. P. Kuhl, E. R. Cave, D. N. Abram and T. F. Jaramillo, Insights into the electrocatalytic reduction of CO2 on metallic silver surfaces, Phys. Chem. Chem. Phys., 2014, 16, 13814–13819 RSC
.
- K. P. Kuhl,
et al., Electrocatalytic conversion of carbon dioxide to methane and methanol on transition metal surfaces, J. Am. Chem. Soc., 2014, 136, 14107–14113 CrossRef CAS PubMed
.
- H. Mistry,
et al., Enhanced Carbon Dioxide Electroreduction to Carbon Monoxide over Defect-Rich Plasma-Activated Silver Catalysts, Angew. Chem., Int. Ed., 2017, 56, 11394–11398 CrossRef CAS PubMed
.
- M. Ma, B. J. Trześniewski, J. Xie and W. A. Smith, Selective and Efficient Reduction of Carbon Dioxide to Carbon Monoxide on Oxide-Derived Nanostructured Silver Electrocatalysts, Angew. Chem., Int. Ed., 2016, 55, 9748–9752 CrossRef CAS PubMed
.
- M. R. Singh, J. D. Goodpaster, A. Z. Weber, M. Head-Gordon and A. T. Bell, Mechanistic insights into electrochemical reduction of CO2 over Ag using density functional theory and transport models, Proc. Natl. Acad. Sci. U. S. A., 2017, 114, E8812–E8821 CrossRef CAS PubMed
.
- A. J. Welch,
et al., Operando Local pH Measurement within Gas Diffusion Electrodes Performing Electrochemical Carbon Dioxide Reduction, J. Phys. Chem. C, 2021, 125, 20896–20904 CrossRef CAS
.
- A. Böhme,
et al., Direct observation of the local microenvironment in inhomogeneous CO2 reduction gas diffusion electrodes via versatile pOH imaging, Energy Environ. Sci., 2023, 16, 1783–1795 RSC
.
- E. L. Clark,
et al., Standards and Protocols for Data Acquisition and Reporting for Studies of the Electrochemical Reduction of Carbon Dioxide, ACS Catal., 2018, 8, 6560–6570 CrossRef CAS
.
- A. Seifitokaldani,
et al., Hydronium-Induced Switching between CO2 Electroreduction Pathways, J. Am. Chem. Soc., 2018, 140, 3833–3837 CrossRef CAS PubMed
.
- N. Gupta, M. Gattrell and B. MacDougall, Calculation for the cathode surface concentrations in the electrochemical reduction of CO2 in KHCO3 solutions, J. Appl. Electrochem., 2006, 36, 161–172 CrossRef CAS
.
- T. Möller,
et al., The product selectivity zones in gas diffusion electrodes during the electrocatalytic reduction of CO2, Energy Environ. Sci., 2021, 14, 5995–6006 RSC
.
- Y. Lum, B. Yue, P. Lobaccaro, A. T. Bell and J. W. Ager, Optimizing C-C Coupling on Oxide-Derived Copper Catalysts for Electrochemical CO2 Reduction, J. Phys. Chem. C, 2017, 121, 14191–14203 CrossRef CAS
.
Footnotes |
| † Electronic supplementary information (ESI) available. See DOI: https://doi.org/10.1039/d3ta02558f |
| ‡ These authors contributed equally to this work. |
| This journal is © The Royal Society of Chemistry 2023 |


