
 Open Access Article
 This Open Access Article is licensed under a
 Creative Commons Attribution 3.0 Unported Licence
Ionic conductivity, viscosity, and self-diffusion coefficients of novel imidazole salts for lithium-ion battery electrolytes†
Anna
Szczęsna-Chrzan‡
a,
Monika
Vogler‡
 bc,
Peng
Yan‡
d,
Grażyna Zofia
Żukowska
a,
Christian
Wölke
d,
Agnieszka
Ostrowska
a,
Sara
Szymańska
a,
Marek
Marcinek
a,
Martin
Winter
d,
Isidora
Cekic-Laskovic
*d,
Władysław
Wieczorek
*a and
Helge S.
Stein
*bc
bc,
Peng
Yan‡
d,
Grażyna Zofia
Żukowska
a,
Christian
Wölke
d,
Agnieszka
Ostrowska
a,
Sara
Szymańska
a,
Marek
Marcinek
a,
Martin
Winter
d,
Isidora
Cekic-Laskovic
*d,
Władysław
Wieczorek
*a and
Helge S.
Stein
*bc
aFaculty of Chemistry Warsaw University of Technology, Noakowskiego 3, Warsaw 00-664, Poland. E-mail: wladyslaw.wieczorek@pw.edu.pl
bApplied Electrochemistry, Helmholtz Institute Ulm, Helmholtzstr. 11, 89081 Ulm, Germany. E-mail: helge.stein@kit.edu
cKarlsruhe Institute of Technology, Institute of Physical Chemistry, Fritz-Haber-Weg 2, 76131 Karlsruhe, Germany
dHelmholtz Institute Münster (IEK-12), Forschungszentrum Jülich GmbH, Corrensstraße 46, 48149 Münster, Germany. E-mail: i.cekic-laskovic@fz-juelich.de
First published on 30th May 2023
Abstract
Lithium-ion battery performance and longevity depend critically on the conducting salt utilized in the electrolyte. With new avenues for multifunctional integration and optimization of functional properties, conducting salts beyond lithium hexafluorophosphate (LiPF6) need to be studied. Herein we elucidate on viscosity, ionicity, anion self-diffusion and ionic conductivity through variation of the length of the perfluoroalkyl side chain present in the anions of the used lithium imidazole salts. Specifically, we study LiPF6 in comparison with lithium 4,5-dicyano-2-(trifluoromethyl)imidazolide (LiTDI), lithium 4,5-dicyano-2-(pentafluoroethyl)imidazolide (LiPDI), and lithium 4,5-dicyano-2-(n-heptafluoropropyl)imidazolide (LiHDI). We find that the ion mobility of LiPF6 depends the least on viscosity and its ionicity is the highest among the electrolytes investigated here. LiTDI shows the strongest correlation between ion mobility and viscosity and the lowest ionicity. LiPDI and LiHDI range between these two regarding their ionicity and the correlation of mobility with viscosity. The previously rarely studied anion self-diffusion coefficients exhibit a strong correlation with viscosity as it was to be expected. Differences between the LiTDI, LiPDI and LiHDI salts are minute.
Introduction
Liquid battery electrolytes fulfill a multitude of functional properties, like high ionic conductivity,1,2 the formation of an effective solid electrolyte interphase (SEI),3 low viscosity at low temperatures, flame inhibition, overcharge protection, dendrite prevention4,5 and others. Tailoring of the conductivity is for instance performed through controlled variation of the formulation like adjustment of the solvent to co-solvent ratio6 and conducting salt concentration. The governing factor for electrolyte conductivity is the chemical nature and the concentration of the conducting salt, following newly discovered and well established theories.7,8 Through modern machine learning applications, it is even possible to predict the optimal electrolyte formulation at various temperatures for commonly used organic carbonate-based solvents and co-solvents such as ethylene carbonate (EC), propylene carbonate (PC), ethyl methyl carbonate (EMC) and the state-of-the art lithium conducting salt lithium hexafluorophosphate (LiPF6).2 The outstanding electrochemical stability and thus resulting longevity of cell chemistries containing LiPF6-based electrolytes have made it a widely studied system.9,10 However, thermally unstable LiPF6 can decompose and lead to the formation of hydrofluoric acid (HF), which can initiate harmful processes that jeopardize the overall performance and safety of a battery.11 Recently there has been an increased interest in studying other, non-phosphorous containing salts, which, among other benefits, are often more stable against hydrolysis.9,10 For example, the presence of lithium 4,5-dicyano-2-(trifluoromethyl)imidazolide (LiTDI) prolongs the lifetime of the cell by stabilizing LiPF6-based electrolytes due to its HF and H2O scavenging ability.9,10 Further, LiTDI improves the SEI stability formed with conventional organic carbonates or film-forming additives like fluoroethylene carbonate (FEC) or vinylene carbonate (VC).9,10 For example, metallic lithium anodes could benefit from different solvation characteristics8 while silicon-graphite anodes could benefit from lower viscosity of highly concentrated salts at low temperatures.12,13 In addition, the LiTDI is reported to capable of preventing the aluminum current collector up to 5.0 V vs. Li/Li+.14,15 Due to the structural similarity between LiTDI, LiPDI, and LiHDI, a similar behavior regarding the attack of the aluminum current collector could be expected. Besides electrochemical performance, the proliferation of batteries on the TWh scale will necessitate millions of tons of material5 such that facile and sustainable synthesis paths are of paramount interest for academia and industry alike.Herein we report on the physiochemical and electrochemical characterization of lithium 4,5-dicyano-2-(trifluoromethyl)imidazolide (LiTDI), lithium 4,5-dicyano-2-(pentafluoroethyl)imidazolide (LiPDI), and lithium 4,5-dicyano-2-(n-heptafluoropropyl)imidazolide (LiHDI). The structures of the conducting salts are shown in Fig. 1. Furthermore, seldomly studied anion self-diffusion coefficients that are e.g. important for ab initio modelling of these novel electrolyte formulations are included in the study.
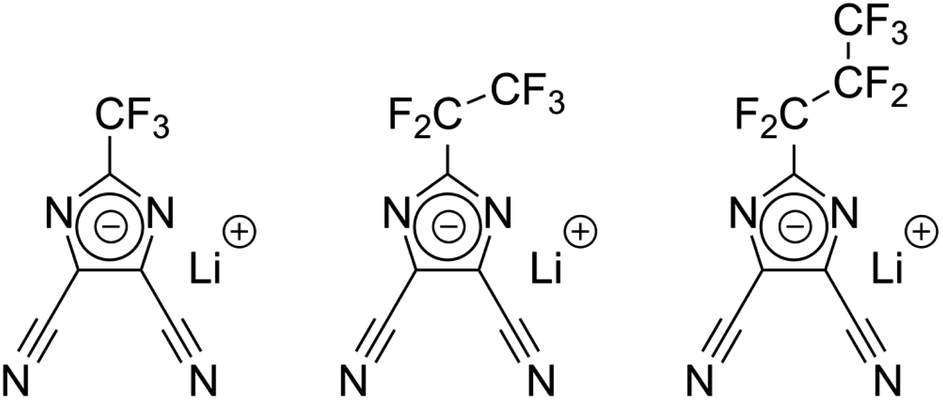 | ||
| Fig. 1 Chemical structures of LiTDI (left), LiPDI (middle) and LiHDI (right). | ||
Methods
Synthesis of imidazole salts
![[thin space (1/6-em)]](https://www.rsc.org/images/entities/char_2009.gif) :1)). Thereafter, the resulting mixture was evaporated under vacuum (approx. 3 h) to remove solvent and the acid produced in the reaction. Solid residue was dissolved in water (700 mL) and the resulting solution was heated to a temperature of 70 °C. Lithium carbonate (247.4 g, 3.35 mol) was dosed stepwise, followed by the addition of decolorizing activated charcoal. The mixture was heated for 2 h at 70 °C. After filtering off the charcoal on filter paper, the water was evaporated under vacuum (approx. 2 h) using a rotary evaporator. The resulting solid was dried on the vacuum line (1 h, 90 °C) and the residue was dissolved in anhydrous acetonitrile. The impurities were filtered off and the solvent was evaporated under vacuum (approx. 1 h). Twofold crystallization from acetonitrile gave colorless crystals, which were dried in the vacuum drier (48 h, 130 °C) to give lithium salt of 4,5-dicyano-2-(trifluoromethyl)imidazolide (320 g, 49% yield).
:1)). After evaporating the solvent and the acid produced in the reaction under vacuum (approx. 2 h), the resulting oily brown residue was dissolved in a mixture of acetonitrile and water (500 mL + 50 mL). Thereafter, lithium carbonate (70.5 g, 0.95 mol) was dosed stepwise, followed by the addition of decolorizing activated charcoal. The mixture was heated for 2 h at 70 °C. After filtering off the charcoal on filter paper, the water was evaporated under vacuum (approx. 2 h) using a rotary evaporator. The residue was dissolved in anhydrous acetonitrile. The impurities were filtered off and the solvent was evaporated under vacuum (approx. 1 h). Multiple crystallization (3–4 times) from acetonitrile gave colorless crystals, which were dried in the vacuum drier (48 hours, 130 °C) to give lithium salt of 4,5-dicyano-2-(pentafluoroethyl)imidazole (94 g, 64% yield).
:1)). Then, the resulting mixture was evaporated under vacuum (approx. 1 h) to remove the solvent and the acid produced in the reaction. The solid residue was dissolved in diethyl ether (250 mL) and the resulting mixture was extracted three times with lithium carbonate (17.5 g, 0.24 mol) suspension in water (450 mL). The water solution of a salt was washed three times with ether (3 × 100 mL). The decolorizing activated charcoal was added to the water solution and the mixture was heated for 1 h at 70 °C. After filtering off the charcoal on filter paper, the water was evaporated under vacuum (approx. 1 h) using a rotary evaporator. Then the residue was dissolved in anhydrous acetonitrile. The impurities were filtered off and the solvent was evaporated under vacuum (approx. 1 h). Multiple crystallization (3–4 times) from acetonitrile gave colorless crystals, which were dried in the vacuum drier (48 h, 130 °C) to give lithium salt of 4,5-dicyano-2-(n-heptafluoropropyl)imidazolide (13.4 g, 23% yield).
:1)). Thereafter, the resulting mixture was evaporated under vacuum (approx. 3 h) to remove solvent and the acid produced in the reaction. Solid residue was dissolved in water (700 mL) and the resulting solution was heated to a temperature of 70 °C. Lithium carbonate (247.4 g, 3.35 mol) was dosed stepwise, followed by the addition of decolorizing activated charcoal. The mixture was heated for 2 h at 70 °C. After filtering off the charcoal on filter paper, the water was evaporated under vacuum (approx. 2 h) using a rotary evaporator. The resulting solid was dried on the vacuum line (1 h, 90 °C) and the residue was dissolved in anhydrous acetonitrile. The impurities were filtered off and the solvent was evaporated under vacuum (approx. 1 h). Twofold crystallization from acetonitrile gave colorless crystals, which were dried in the vacuum drier (48 h, 130 °C) to give lithium salt of 4,5-dicyano-2-(trifluoromethyl)imidazolide (320 g, 49% yield).
:1)). After evaporating the solvent and the acid produced in the reaction under vacuum (approx. 2 h), the resulting oily brown residue was dissolved in a mixture of acetonitrile and water (500 mL + 50 mL). Thereafter, lithium carbonate (70.5 g, 0.95 mol) was dosed stepwise, followed by the addition of decolorizing activated charcoal. The mixture was heated for 2 h at 70 °C. After filtering off the charcoal on filter paper, the water was evaporated under vacuum (approx. 2 h) using a rotary evaporator. The residue was dissolved in anhydrous acetonitrile. The impurities were filtered off and the solvent was evaporated under vacuum (approx. 1 h). Multiple crystallization (3–4 times) from acetonitrile gave colorless crystals, which were dried in the vacuum drier (48 hours, 130 °C) to give lithium salt of 4,5-dicyano-2-(pentafluoroethyl)imidazole (94 g, 64% yield).
:1)). Then, the resulting mixture was evaporated under vacuum (approx. 1 h) to remove the solvent and the acid produced in the reaction. The solid residue was dissolved in diethyl ether (250 mL) and the resulting mixture was extracted three times with lithium carbonate (17.5 g, 0.24 mol) suspension in water (450 mL). The water solution of a salt was washed three times with ether (3 × 100 mL). The decolorizing activated charcoal was added to the water solution and the mixture was heated for 1 h at 70 °C. After filtering off the charcoal on filter paper, the water was evaporated under vacuum (approx. 1 h) using a rotary evaporator. Then the residue was dissolved in anhydrous acetonitrile. The impurities were filtered off and the solvent was evaporated under vacuum (approx. 1 h). Multiple crystallization (3–4 times) from acetonitrile gave colorless crystals, which were dried in the vacuum drier (48 h, 130 °C) to give lithium salt of 4,5-dicyano-2-(n-heptafluoropropyl)imidazolide (13.4 g, 23% yield).
NMR structure verification by means of 13C NMR and 19F NMR spectroscopy in CD3CN for LiTDI, LiPDI, and LiHDI is in agreement with literature.16
IR and Raman spectroscopy
Raman spectra were recorded on a Nicolet Almega Raman dispersive spectrometer. A diode laser with excitation line 532 nm was used. The exposure time was set to 10 s and integrated such that each spectrum is the sum of two independent scans. The spectral resolution for all experiments was around 2 cm−1.FTIR spectra were collected on a Nicolet Avatar 370 spectrometer with a wavenumber resolution of 2 cm−1. Spectra were recorded for samples in form of a thin film sandwiched between two NaCl plates (high salt concentration) or placed in a cuvette with a 0.1 mm spacer.
Electrolyte formulations
The electrolytes used in this work were formulated starting from commercially available ethylene carbonate (EC), ethyl methyl carbonate (EMC), lithium hexafluorophosphate (LiPF6) and commercial, pre-mixed 1 M LiPF6 in EC:EMC (3:7 by weight). All these components were ordered from E-Lyte Innovations GmbH in battery grade quality and used as received. The Hückel-type salts, LiTDI, LiPDI, and LiHDI, were synthesized and characterized at the Warsaw University of Technology (WUT) as described in the Synthesis of imidazole salts section. The Helmholtz Institute Münster (FZJ) and Karlsruhe Institute of Technology (KIT) received the materials from WUT.
The nominal concentrations of the Hückel-type salts in the formulated electrolytes were chosen to be 0.05 M, 0.6 M and 1.0 M for the electrolytes, while 1.0 M LiPF6 concentration was used as a reference electrolyte. For all electrolytes, EC:EMC (3:7 by weight) was used as the solvent mixture.
Electrolytes used for the measurements were formulated in an oxygen and water free inert gas-filled glovebox. The formulation was based on the mixing of the former prepared solvents mixture and gravimetrically dosed salts to obtain the concentrations mentioned above. In this work, the samples are designated based on their nominal compositions. An overview of the electrolytes used in this study, the formulation methods and the measurements is compiled in Table SI-1.†
Conductivity measurements
All experiments were carried out under an inert atmosphere inside a glovebox (MBraun, H2O and O2 < 1 ppm). Conductivity cells were filled with the various electrolyte formulations as previously described.6 Cell constants were determined by using a 0.01 M solution of KCl in H2O at 20 °C (VWR, known conductivity of 1.276 mS cm−1) and averaging over five measurements. Disposable 2 mL Eppendorf Safe-Lock Tubes were used as sample containers and filled with 750 μL of electrolyte each. Impedance measurements were conducted on a Metrohm Autolab/M204 potentiostat/galvanostat with 12 channels and an 8-channel multiplexer for a total of 96 channels in the frequency range of 50–20000 Hz using in-house developed electrodes.17 The conductivity cells were placed in a temperature chamber (Memmert TTC256, 0.1 °C temperature setting accuracy) and each temperature was held for 2 h prior to measurement for equilibration. The ionic conductivity of the considered electrolytes was measured in the temperature range from −30 °C to 60 °C in 10 °C steps. Impedance spectra were fitted using a model specified with set parameters for resistors Rs and Rp, as well as for the constant phase element (CPE) with the Metrohm Nova software. Fitting was carried out after each additional measuring point by using the fitting model Rs(CPE − Rp). Electrolyte conductivity values were obtained from the quotient of the cell constant and the determined electrolyte resistance.
Viscosity and density measurements
For the viscosity and density measurements, a manually filled viscometer (Anton Paar SVM 3001, Austria) was used. Measurements were performed at the following temperatures: −20 °C, 0 °C, 20 °C, 30 °C, 40 °C and 60 °C. Acetone was used to clean the instrument between the measurements to avoid contamination of the samples.PGSE-NMR measurements
In preparation of the NMR measurements, each electrolyte was filled in a standard NMR tube inside a nitrogen filled glovebox. The tubes were closed using standard NMR caps and sealed with Parafilm. The formulated electrolytes were removed from the nitrogen-filled glovebox and transferred to the NMR device, which was operated in the regular laboratory environment. Care was taken to keep the time span between filling the electrolytes into the NMR tubes and starting the measurement as short as possible to avoid reactions with the glass, air, and/or humidity. The NMR instrument used in this study is an Oxford Instruments X-Pulse benchtop NMR comprising a 1.4 T (60 MHz) permanent magnet operating at 40 °C. The device was equipped with a probe head capable of detecting 1H and 19F nuclei. In this study, 19F NMR spectra were recorded to determine the self-diffusion coefficients of the anions. A J-PGSE pulse sequence developed at Oxford Instruments GmbH was used to perform J-compensated pulsed field gradient spin echo (PGSE) measurements. Since the focus of this study was not on structure elucidation, the chemical shift of the individual signals was not primarily relevant. Therefore, the addition of a reference was omitted and the soft-lock procedure provided by the device was used to record spectra. The assignment of the signal groups to the respective nuclei was performed based on the multiplet structures observed in the spectra. In the case of overlapping signals, these signals were excluded from the integration and the evaluation of the self-diffusion coefficients. The maximum gradient, Gmax, obtained from calibration with water was 0.315 T m−1 with a standard deviation of 2.9 10−5 T m−1 determined by three measurements. The duration of the gradient pulses, δ, was set to 4 ms, the diffusion time, Δ, is set to 25 ms and a relaxation delay of 30 s was used. The gradient strength was varied from 0% to 100% in 10% steps. The spectra were zero filled, phased, baseline corrected and apodized prior to integration. For the analysis, the Stejskal–Tanner equation18 as given in eqn (3.1) was used. The term 2/π was required due to the sinusoidal shape of the pulses.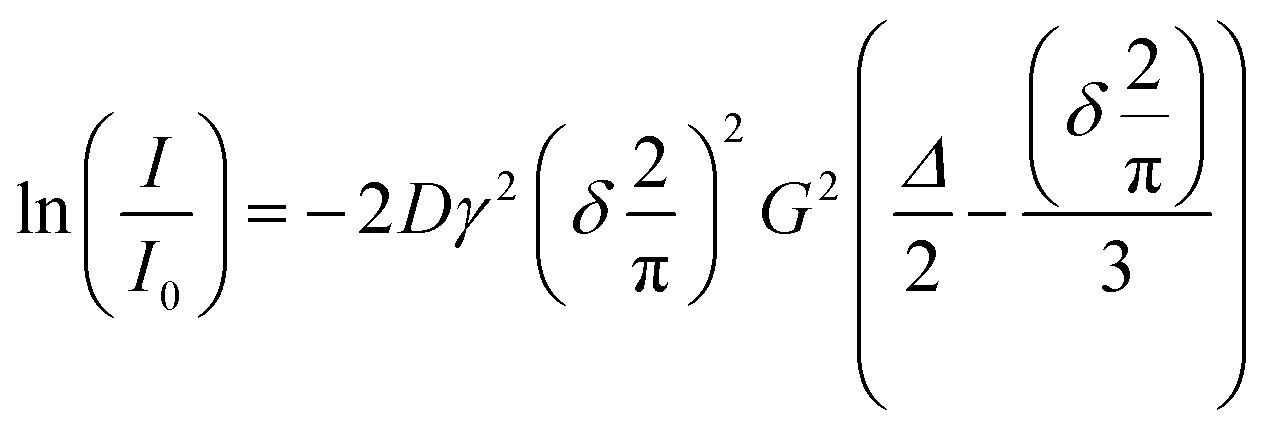 | (3.1) |
Based on theory, the maximum intensity of the signals, I0, should be obtained from spectra recorded at zero gradient. However, in this study, the values for the smallest non-zero gradient, yielded higher values than no gradient in most cases (cf. Fig. SI-1†). Therefore, a linear fit of the Stejskal–Tanner plot with zero intercept yielded a bad fit for most of the data and did not result in a meaningful trend. This behavior persisted even for gradients below the lowest applied in this study. Therefore, the intensity obtained for the smallest gradient set in this study, i.e. 10% of Gmax, was used to reference the Stejskal–Tanner equation and the value at zero gradient was excluded from the evaluation. This resulted in R2 values between 0.88 and 0.99.
The errors of the self-diffusion coefficients were determined from the errors of the integrals combined with those of the input quantities. Integration errors were estimated by integrating three regions without signals and the width corresponding to the integral of interest in each spectrum and averaging their values. This error was assigned to the respective integral of interest. Based on this integration error and the standard deviation of Gmax, an error propagation yielded the maximum absolute error for the self-diffusion coefficients.
Results and discussion
Raman and IR spectroscopy
The conducting Hückel-type salts used in this study, LiTDI, LiPDI, and LiHDI, differing only in the length of their perfluorinated alkyl chains, are found to be characterized by very similar coordinating properties. The most widely used and best described conducting salt from this family is LiTDI. Coordination modes of the TDI− anion were found on the basis of extensive studies on LiTDI solvates19–22 and the corresponding characteristic bands in the Raman spectra further served in the analysis of the conducting salt dissociation in liquid and solid electrolytes.For the present work, we used data obtained from solvates with various solvents, which served as models for free ions, ionic pairs and dimers. The solvates of 12-crown-4 ether (12C4) with lithium salts usually have a structure with cations fully isolated from anions, corresponding to spectroscopically free anions (SSIP). Solutions with triglyme (G3) and 15-crown-5 ether (15C5) may serve as models for ionic pairs (CIP) and solutions with diglyme (G2) for dimers and chains. Acetonitrile (AN) can serve as another model system for dimers. Fig. 2 shows the coordination modes of the ions observed in the model solutions, obtained on the basis of structural studies on LiTDI solvates.
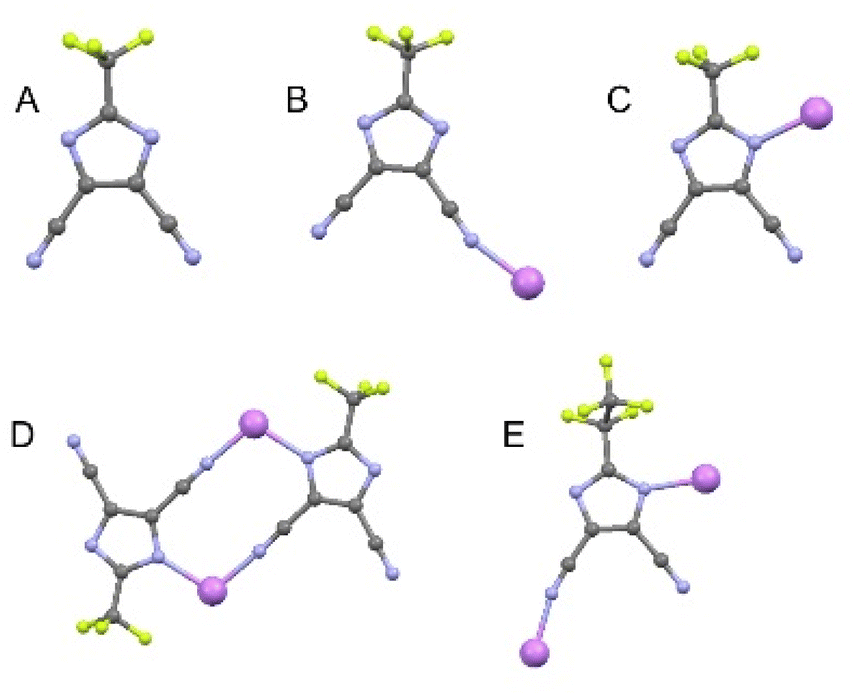 | ||
| Fig. 2 Coordination modes of the TDI−, PDI− and HDI− anions found in adducts with aprotic solvents: (A) “free” anions (SSIP); (B) contact ion pairs (CIP I); (C) contact ion pairs (CIP II), (D) dimer, (E) chain. Molecules: pink – Li, blue – N, yellow – F, gray – C. | ||
Table 1 summarizes the position of the characteristic bands for the solvates in the Raman spectra. A comparison of the properties of these LiPDI and LiTDI solutions in oligoethers23 and cyclic carbonates24 would suggest that the length of the chain has only a limited effect on the viscosity and thermal properties of the electrolyte. Only at the highest salt/solvent ratio in oligoethers (Li:G3 ratio higher than 5) one may observe that the viscosities of LiPDI based systems were slightly higher.23
| Formula | ν CN [cm−1] | ν CN Im [cm−1] | δ NCN Im [cm−1] | Coordination mode | |
|---|---|---|---|---|---|
| LiTDI | |||||
| [Li+(12C4)2]TDI | 2225 | 1307 | 977 | SSIP | |
| Li(15C5)TDI | 2228; 2239 | 1302 | 979 | CIP I | |
| Li(G3)TDI | 2230 | 1320 | 991 | CIP II | |
| [Li(G2)]2TDI2 | 2250; 2233 | 1313 | 988; 976 | Dimer | |
|
|||||
| LiPDI | |||||
| [Li+(12C4)2]PDI− | 2229 | 1300 | 943 | SSIP | |
| [Li(15C5)]PDI | 2244; 2234 | 1311 | 948 | CIP I | |
| [Li(G2)]2PDI2 | 2257; 2233 | 1308 | 951 | Dimer | |
| [Li(G2)PDI]n | 2255 | 1312 | 948 | Chain | |
| [Li(AN)]2PDI2 | 2256; 2238 | 1309 | 954 | Dimer | |
|
|||||
| LiHDI | |||||
| [Li+(12C4)2]HDI− | 2226; 2216 | 1299 | 993 | SSIP | |
| Li(15C5)HDI | 2228 | 1308 | 1002; 992 | CIP II | |
| [Li(G2)]2HDI2 or [Li(G2)HDI]n | 2254; 2232 | 1310 | 992 | Dimer or chain | |
The increase of the conducting salt concentration is reflected by similar changes in the spectral pattern of the salt, i.e. (i) shift of the maximum of the νCN towards higher wavenumbers, from 2224 cm−1 to 2230 cm−1, and formation of a shoulder at approx. 2245 cm−1; (ii) broadening of the band and formation of the shoulder at higher wavenumber for νCN Im and δNCN Im.
Fig. 3 presents a comparison of νCN spectral range in FTIR spectra of LiHDI-based electrolytes and the exemplary deconvolution of this range. The attribution of the peaks was made on the basis of previous studies23 as follows: 2224 cm−1 for free ions (SSIP), 2230 cm−1 for ionic pairs (CIP), and 2247 cm−1 for aggregates (AGG. e.g. dimers/chains).
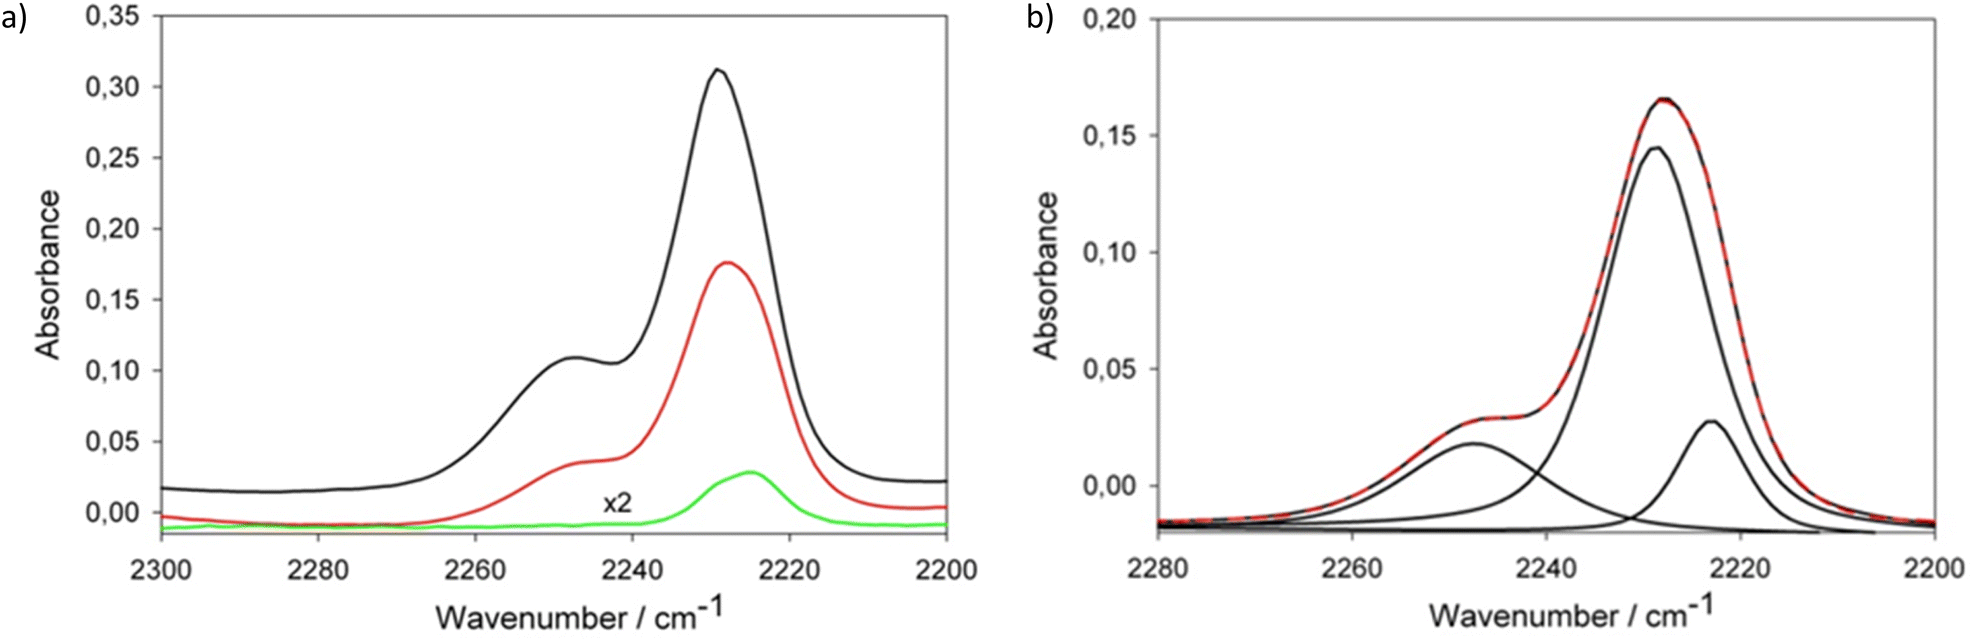 | ||
| Fig. 3 (a) Spectral range of the νCN vibrations in FTIR spectra of electrolytes containing LiHDI in a solvent mixture of EC and DEC with different salt concentration: 1 M (black line), 0.63 M (red line) and 0.1 M (green line) and (b) the exemplary deconvolution of the νCN band for the 0.63 M solution. | ||
Table 2 presents the estimated percentage of ionic species obtained on the basis of the deconvolution of νCN band in FTIR spectra of electrolyte solutions containing LiHDI in a solvent mixture of EC and diethyl carbonate (DEC). The results are very close to that obtained for LiTDI-based electrolytes containing mixtures of organic carbonates25 which supports the conclusion, that HDI− and TDI− anions are characterized by similar donor properties and exhibit similar dissociation mechanisms. Due to the similarity between the dielectric constants of DEC (εr = 2.8 at 25 °C (ref. 26)) and EMC (εr = 2.9 at 25 °C (ref. 26)), it is to be expected, that electrolytes based on LiTDI and LiHDI dissolved in solvent mixtures containing EC and EMC show similar dissociation behavior as such containing EC and DEC in their solvent mixtures.
| LiHDI conc. [M] | Free ions [%] | Ionic pairs [%] | Aggregates [%] |
|---|---|---|---|
| 0.1 | 62.5 | 37.5 | 0 |
| 0.63 | 30.5 | 51.5 | 18.0 |
| 1.0 | 15.5 | 57.5 | 27.0 |
The results from FTIR and Raman analysis, indicate a strong influence of the concentration of the conducting salt on the ionic arrangement, as expected. For LiHDI an increased concentration results in a larger percentage of ionic pairs and aggregates in a solvent mixture containing EC and DEC. Assuming transferability of this behavior to the EC and EMC containing solvent mixture and other Hückel-type salts used herein, this is in agreement with the observed correlation between the anionic self-diffusion coefficients and the viscosity shown in Fig. 8. A higher fraction of paired or aggregated ions is expected to result in decreased ionic self-diffusion coefficient and conductivity as compared to fully dissociated salt. Both observations are evident in the NMR and conductivity measurements. Table 2 shows, that for LiHDI based-electrolytes, the increase in the number of aggregates is stronger than the one of the number of ionic pairs for increasing concentration.
Conductivity and viscosity of the considered electrolytes
To investigate the influence of the dissociation processes on the performance of electrolytes containing the Hückel-type salts, the conductivity was determined. As shown in Fig. 4, our results show a strong dependence of the ionic conductivity on the salt concentration and temperature, as expected.2,7 With increasing temperature, an increase of the conductivity can be observed for all electrolyte formulations. In this work we keep the solvent type and ratio fixed, to only consider the influence of salt concentration and solvation structure on conductivity. For the LiTDI-based electrolyte, the maximum conductivity is observed at an 0.6 M concentration for temperatures up to 20 °C. Above 20 °C, 1 M concentration yields the maximum conductivity. As for LiPDI, which contains a larger anion, the maximum conductivity could also be observed at 0.6 M concentration up to 40 °C. For larger anions as in LiHDI, the conductivity maximum is observed at 0.6 M in the temperature range considered here. The reason why the 0.6 M Hückel-type salt-based electrolyte would have a larger conductivity than the respective 1 M electrolyte formulation could be explained by the formation of ion pairs and aggregates at higher concentration as observed by IR measurement. | ||
| Fig. 4 (a–c) Conductivity vs. viscosity at different temperatures for Hückel-type salt-based electrolytes with different salt concentration (d–f) conductivity vs. viscosity at different temperatures for Hückel-type salt-based electrolytes with the same conducting salt concentration. Solid lines show the conductivity vs. temperature and the dashed-dotted lines represent the viscosity vs. temperature. | ||
Comparing the conductivity of electrolytes based on the different salts at the same salt concentration in Fig. 4d–f, no difference in the conductivity is observed at low salt concentrations of 0.05 M and 0.1 M, but when the salt concentration is increased up to 0.6 M, the LiPDI containing-electrolyte shows the highest ionic conductivity while the electrolyte containing LiTDI has the lowest. When further increasing the salt concentration to 1 M, the LiPDI containing electrolyte retains the highest ionic conductivity but the electrolyte based on LiHDI gives the lowest one.
For all solutions investigated in this study, the ionic conductivity of electrolytes shows a strong correlation to viscosity. For all considered electrolytes, decreasing viscosity caused the increase of the conductivity, which was strongly correlated with the increase of the temperature. The changes of the viscosity and conductivity are similar for all the electrolytes as shown in Fig. 4a–c. However, changes are smaller for lower concentrations of the conducting salt in the electrolyte as can be seen in Fig. 4d–f.
Based on the conductivity and viscosity data, a Walden plot27 was compiled. The graph presented in Fig. 5 shows the molar conductivity with respect to the conducting salt concentration plotted vs. the inverse viscosity including 1 M LiPF6-based electrolyte as a reference. For all formulations, a linear correlation between the molar conductivity and the inverse viscosity is found for increasing temperature. The slopes determined for the formulations presented here are shown in Fig. 6. The slope of 0.80log(S cm2 mol−1) log(P−1) obtained for 1 M LiPF6 is lower than the ones obtained for the Hückel-type salts, which are closer to unity. Since slopes close to unity indicate a strong interrelation of the ion mobility and viscosity,28 this suggests a less viscosity-controlled ion movement in 1 M LiPF6 than in any of the other electrolyte formulations investigated here.
 | ||
| Fig. 5 Walden plot28 for the electrolyte formulations investigated in this study. The formulations having the lowest conducting salt concentration reveal the highest ionicity. For the concentrations higher than 0.05 M, the differences in ionicity are not very pronounced. The data points for 0.6 M LiTDI and 1 M LiTDI are the lowest in this graph. | ||
 | ||
| Fig. 6 Slopes determined from the Walden plot for the considered electrolyte formulations. | ||
The 0.05 M formulations containing Hückel-type salts and the 1 M LiPF6 electrolyte formulation yield values closest to the ideal KCl line. The vertical deviations from the ideal KCl line, Δlog(σm) are used as indicators for the degree of dissociation.27,28 All the 0.05 M formulations range from −0.64log(S cm2 mol−1) to −0.67log(S cm2 mol−1) at 20 °C suggesting the highest relative ionicity. This is not surprising since 0.05 M electrolyte formulations containing Hückel-type salts yield the lowest viscosities reported herein. Based on the slopes of the Walden plot, the ion mobility in these samples appears to be strongly correlated with viscosity. Furthermore, the low concentration favoring dissociation of the salts can be expected to support a degree of dissociation in these electrolyte formulations.
The electrolyte formulations containing Hückeltype-salts in concentrations higher than 0.05 M are located in a narrow band in the Walden plot. No significant differences are observed between LiPDI and LiHDI containing formulations with respect to ionicity. The Δlog(σm) values for LiPDI are −0.80log(S cm2 mol−1) and −0.83log(S cm2 mol−1) for 0.6 M and 1 M concentration, respectively, while those for LiHDI are −0.82log(S cm2 mol−1) for 0.6 M and −0.85log(S cm2 mol−1) for the 1 M solution at 20 °C. The formulations with 0.6 M LiTDI and 1 M LiTDI yield values at the lower end of this band with Δlog(σm) being −0.92log(S cm2 mol−1) at 20 °C for both concentrations indicating the lowest ionicity for these electrolyte formulations. The minor differences between 0.6 M and 1 M concentrations for all Hückel-type conducting salts investigated here might indicate a dissociation limit of the formulations at concentrations close to 1 M. The position in the Walden plot of LiTDI at concentrations of 0.6 M and 1 M might indicate a stronger tendency towards ion pairing or aggregation for the LiTDI salt compared to the other Hückel-type salts. This is in agreement with Niedzicki et al.,29 who reported a lower association constant for LiHDI compared to LiTDI and LiPDI in electrolytes using propylene carbonate (PC) as a solvent. Niedzicki et al.29 suggest the higher volume of the HDI− anion due to the longer perfluoroalkyl side chain as a possible cause for this behavior.
Overall, the electrolyte formulations presented here are located at a significant distance from the ideal KCl line and, therefore, they need to be regarded as only partially dissociated and the presence of ion pairs and aggregates needs to be considered which is in agreement with the IR data discussed in the IR and Raman spectroscopy section for LiHDI. Similar structures were found in LiTDI and LiPDI containing formulations in various ethers and glycols as reported by Jankowski et al.,19 who performed XRD investigations. They report a significant number of ionic aggregates at higher salt concentration, mostly dimers and chains for LiTDI and LiPDI. Unpublished data using the same approach indicates the presence of dimers and chains also for LiHDI in the concentration ranges investigated in our study.
Anion self-diffusion coefficients
Further insights into the dynamics of the electrolyte formulations on a molecular level can be obtained by determining self-diffusion coefficients. In this study, we focus on the anion self-diffusion coefficients. Fig. 7 shows the correlation between the self-diffusion coefficients and the viscosities of the considered electrolyte formulations. Increased viscosity is related to a lower self-diffusion coefficient and higher concentration of the conducting salt. Among the electrolyte formulations of approximately 1 M concentration, the highest self-diffusion coefficient is observed for the PF6− anion. The Hückel-type anions show a lower self-diffusion coefficient and a spread in viscosity values. Minor differences in the self-diffusion coefficients between the electrolytes containing the different Hückel-type salts are observed. This is in agreement with the similar dissociation behavior of the Hückel-type salts as reported in the section IR and Raman spectroscopy. | ||
| Fig. 7 Self-diffusion coefficients of the anions of the conducting salts contained in the electrolytes plotted versus viscosity. The data presented here covers various concentrations of the salts in the solvent mixture EC:EMC 3:7 by weight investigated in this study. The electrolyte containing 1 M LiPF6 is given as a reference. The data is obtained from 19F NMR using a J-PGSE pulse sequence and evaluation using the Stejskal–Tanner eqn (3.1). The magnet of the used benchtop NMR device operates at 40 °C. | ||
Fig. 8 shows the plot of the self-diffusion coefficients obtained as described in the PGSE-NMR measurements section vs. the molality of the conducting salt. The self-diffusion coefficient for all considered conducting salts in this study decrease with higher salt concentration. Furthermore, Fig. 8 shows, that the self-diffusion coefficient of LiPF6 is towards the higher end of the range for all molalities of the conducting salt. The Hückel-type salts yield lower self-diffusion coefficients over the whole range of molalities. For electrolytes containing LiTDI and LiPF6 in a solvent mixture of EC and DMC (1:1 by weight), a higher degree of dissociation of LiPF6 compared to LiTDI is reported.30 Based on the Walden plot presented in Fig. 5, the degrees of dissociation of LiPDI and LiHDI lie in between LiTDI and LiPF6. The solvent mixture containing EC and EMC (3:7 by weight) used in our study should be expected to result in a tendency towards lower degrees of dissociation due to the slightly lower dielectric constant of EMC (εr = 2.9 at 25 °C (ref. 31)) compared to DMC (εr = 3.1 at 25 °C (ref. 31)) and the lower fraction of EC (εr = 95.3 at 25 °C (ref. 31)) in these mixtures.28 Due to the larger size of associated ions, their mobility is expected to be reduced compared to free ions. Therefore, the lower self-diffusion coefficients for the Hückel-type salt anions compared to the PF6− anions found for the considered electrolytes indicate a stronger tendency towards ion association for Hückel-type salt anions than for LiPF6. Differences across Hückel-type salts are minute. The errors of the diffusion coefficients for LiHDI are the largest among the considered formulations, which is most likely due to the splitting of the signals leading to a lower signal-to-noise ratio, which results in higher uncertainties upon integration.
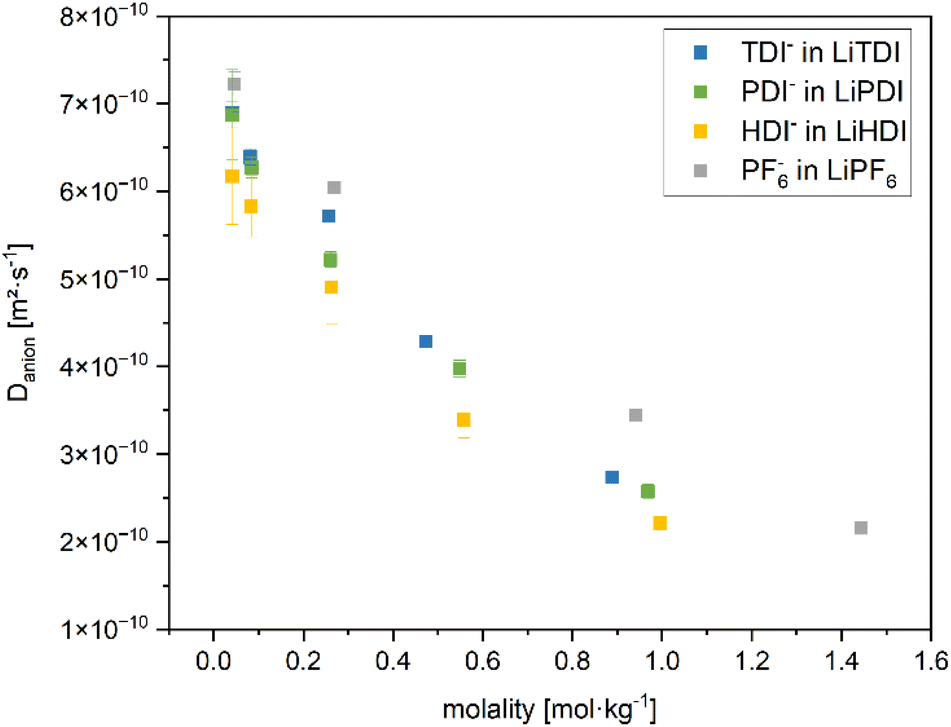 | ||
| Fig. 8 Self-diffusion coefficients of the anions of the conducting salts in the EC:EMC (3:7 by weight) solvent mixture at various molalities determined from 19F NMR spectra using a J-PGSE pulse sequence. The diffusion coefficients are determined by applying the Stejskal–Tanner eqn (3.1) to the measured spectra. The molalities are calculated from the masses of each component and stock solution recorded during the formulation of the electrolytes. The values for the electrolyte containing 1 M LiPF6 are given as a reference. The magnet of the used benchtop NMR device operates at 40 °C. | ||
The decrease in self-diffusion coefficient correlates well with the increase in viscosity upon higher concentration of the electrolyte formulations and the decrease in conductivity for increasing concentration above 0.6 M as shown and discussed in the Conductivity and viscosity of the considered electrolytes section.
Conclusions
Non-conventional electrolytes need to be selected to incorporate multiple fundamental properties. Here we investigate electrolyte systems containing the Hückel-type salts LiTDI, LiPDI and LiHDI in a solvent mixture of EC and EMC (3:7 by weight). FTIR and Raman spectroscopy results reveal the presence of ion pairs, dimers, chains and aggregates. Values regarding the ionic conductivity, viscosity and anion self-diffusion coefficients of the investigated electrolytes are reported. An analysis of a Walden plot generated based on the conductivity and viscosity data provided insights into the ionicity of the considered electrolytes. LiPF6 showed the highest ionicity, while LiTDI was found to have the lowest ionicity among the considered Hückel-type conducting salts.
Author contributions
AS planned, performed and analyzed conductivity measurements; PY planned, conducted and analyzed the viscosity and conductivity measurements; MV planned, conducted and analyzed J-PGSE NMR measurements; GZZ planned and performed NMR, IR and FTIR measurements and analyzed the results; AO and SS synthesized the Hückel-type salts; AS, PY, MV and HSS wrote the initial manuscript; CW, ICL, WW, MW, and HSS revised the manuscript.Conflicts of interest
There are no conflicts to declare.Acknowledgements
This project received funding from the European Union's Horizon 2020 research and innovation programme under grant agreement No. 957189. The authors acknowledge BATTERY 2030PLUS funded by the European Union's Horizon 2020 research and innovation program under Grant Agreement No. 957213. The work of HSS and MV contributes to the research performed at CELEST (Center for Electrochemical Energy Storage Ulm-Karlsruhe) and was funded by the German Research Foundation (DFG) under Project ID 390874152 (POLiS Cluster of Excellence). MV acknowledges the KIT Graduate School Enabling Net Zero – ENZo.Notes and references
- A. Benayad, D. Diddens, A. Heuer, A. N. Krishnamoorthy, M. Maiti, F. L. Cras, M. Legallais, F. Rahmanian, Y. Shin, H. Stein, M. Winter, C. Wölke, P. Yan and I. Cekic-Laskovic, High-Throughput Experimentation and Computational Freeway Lanes for Accelerated Battery Electrolyte and Interface Development Research, Adv. Energy Mater., 2022, 12(17), 1–30, DOI:10.1002/aenm.202102678.
- F. Rahmanian, M. Vogler, C. Wölke, P. Yan, M. Winter, I. Cekic-Laskovic and H. S. Stein, One-Shot Active Learning for Globally Optimal Battery Electrolyte Conductivity, Batteries Supercaps, 2022, 5(10), 1–9, DOI:10.1002/batt.202200228.
- S. J. An, J. Li, C. Daniel, D. Mohanty, S. Nagpure and D. L. Wood, The State of Understanding of the Lithium-Ion-Battery Graphite Solid Electrolyte Interphase (SEI) and Its Relationship to Formation Cycling, Carbon, 2016, 105, 52–76, DOI:10.1016/j.carbon.2016.04.008.
- M. Fichtner, K. Edström, E. Ayerbe, M. Berecibar, A. Bhowmik, I. E. Castelli, S. Clark, R. Dominko, M. Erakca, A. A. Franco, A. Grimaud, B. Horstmann, A. Latz, H. Lorrmann, M. Meeus, R. Narayan, F. Pammer, J. Ruhland, H. Stein, T. Vegge and M. Weil, Rechargeable Batteries of the Future—The State of the Art from a BATTERY 2030+ Perspective, Adv. Energy Mater., 2022, 12(17), 1–25, DOI:10.1002/aenm.202102904.
- J. Amici, P. Asinari, E. Ayerbe, P. Barboux, P. Bayle-Guillemaud, R. J. Behm, M. Berecibar, E. Berg, A. Bhowmik, S. Bodoardo, I. E. Castelli, I. Cekic-Laskovic, R. Christensen, S. Clark, R. Diehm, R. Dominko, M. Fichtner, A. A. Franco, A. Grimaud, N. Guillet, M. Hahlin, S. Hartmann, V. Heiries, K. Hermansson, A. Heuer, S. Jana, L. Jabbour, J. Kallo, A. Latz, H. Lorrmann, O. M. Løvvik, S. Lyonnard, M. Meeus, E. Paillard, S. Perraud, T. Placke, C. Punckt, O. Raccurt, J. Ruhland, E. Sheridan, H. Stein, J.-M. Tarascon, V. Trapp, T. Vegge, M. Weil, W. Wenzel, M. Winter, A. Wolf and K. Edström, A Roadmap for Transforming Research to Invent the Batteries of the Future Designed within the European Large Scale Research Initiative BATTERY 2030+, Adv. Energy Mater., 2022, 12(17), 1–42, DOI:10.1002/aenm.202102785.
- A. Narayanan Krishnamoorthy, C. Wölke, D. Diddens, M. Maiti, Y. Mabrouk, P. Yan, M. Grünebaum, M. Winter, A. Heuer and I. Cekic-Laskovic, Data-Driven Analysis of High-Throughput Experiments on Liquid Battery Electrolyte Formulations: Unraveling the Impact of Composition on Conductivity, Chem.: Methods, 2022, 2(9), 1–8, DOI:10.1002/cmtd.202200008.
- E. Flores, C. Wölke, P. Yan, M. Winter, T. Vegge, I. Cekic-Laskovic and A. Bhowmik, Learning the Laws of Lithium-Ion Transport in Electrolytes Using Symbolic Regression, Digit. Discovery, 2022, 1(4), 440–447, 10.1039/D2DD00027J.
- E. Flores, G. Åvall, S. Jeschke and P. Johansson, Solvation Structure in Dilute to Highly Concentrated Electrolytes for Lithium-Ion and Sodium-Ion Batteries, Electrochim. Acta, 2017, 233, 134–141, DOI:10.1016/j.electacta.2017.03.031.
- F. Lindgren, C. Xu, L. Niedzicki, M. Marcinek, T. Gustafsson, F. Björefors, K. Edström and R. Younesi, SEI Formation and Interfacial Stability of a Si Electrode in a LiTDI-Salt Based Electrolyte with FEC and VC Additives for Li-Ion Batteries, ACS Appl. Mater. Interfaces, 2016, 8(24), 15758–15766, DOI:10.1021/acsami.6b02650.
- C. Xu, S. Renault, M. Ebadi, Z. Wang, E. Björklund, D. Guyomard, D. Brandell, K. Edström and T. Gustafsson, LiTDI: A Highly Efficient Additive for Electrolyte Stabilization in Lithium-Ion Batteries, Chem. Mater., 2017, 29(5), 2254–2263, DOI:10.1021/acs.chemmater.6b05247.
- K. Xu, Nonaqueous Liquid Electrolytes for Lithium-Based Rechargeable Batteries, Chem. Rev., 2004, 104(10), 4303–4418, DOI:10.1021/cr030203g.
- B. Zhang, L. Merker, A. Sanin and H. S. Stein, Robotic Cell Assembly to Accelerate Battery Research, Digit. Discovery, 2022, 1(6), 755–762, 10.1039/D2DD00046F.
- J. Hu, B. Wu, S. Chae, J. Lochala, Y. Bi and J. Xiao, Achieving Highly Reproducible Results in Graphite-Based Li-Ion Full Coin Cells, Joule, 2021, 5(5), 1011–1015, DOI:10.1016/j.joule.2021.03.016.
- L. Niedzicki, S. Grugeon, S. Laruelle, P. Judeinstein, M. Bukowska, J. Prejzner, P. Szczeciñski, W. Wieczorek and M. Armand, New Covalent Salts of the 4+V Class for Li Batteries, J. Power Sources, 2011, 196(20), 8696–8700, DOI:10.1016/j.jpowsour.2011.06.030.
- I. A. Shkrob, K. Z. Pupek, J. A. Gilbert, S. E. Trask and D. P. Abraham, Chemical Stability of Lithium 2-Trifluoromethyl-4,5-Dicyanoimidazolide, an Electrolyte Salt for Li-Ion Cells, J. Phys. Chem. C, 2016, 120(50), 28463–28471, DOI:10.1021/acs.jpcc.6b09837.
- L. Niedzicki, G. Z. Żukowska, M. Bukowska, P. Szczeciński, S. Grugeon, S. Laruelle, M. Armand, S. Panero, B. Scrosati, M. Marcinek and W. Wieczorek, New Type of Imidazole Based Salts Designed Specifically for Lithium Ion Batteries, Electrochim. Acta, 2010, 55(4), 1450–1454, DOI:10.1016/j.electacta.2009.05.008.
- H.-D. Wiemhöfer, M. Grünenbaum and M. Hiller, Mikro-Elektrodenflüssigkeitsmesszelle, WO2014/139494A1, 2014.
- E. O. Stejskal and J. E. Tanner, Spin Diffusion Measurements: Spin Echoes in the Presence of a Time-Dependent Field Gradient, J. Chem. Phys., 1965, 42(1), 288–292, DOI:10.1063/1.1695690.
- P. Jankowski, M. Dranka, G. Z. Żukowska and J. Zachara, Structural Studies of Lithium 4,5-Dicyanoimidazolate–Glyme Solvates. 1. From Isolated Free Ions to Conductive Aggregated Systems, J. Phys. Chem. C, 2015, 119(17), 9108–9116, DOI:10.1021/acs.jpcc.5b01352.
- P. Jankowski, M. Dranka and G. Z. Żukowska, Structural Studies of Lithium 4,5-Dicyanoimidazolate–Glyme Solvates. 2. Ionic Aggregation Modes in Solution and PEO Matrix, J. Phys. Chem. C, 2015, 119(19), 10247–10254, DOI:10.1021/acs.jpcc.5b01826.
- M. Dranka, P. Jankowski and G. Z. Żukowska, Snapshots of the Hydrolysis of Lithium 4,5-Dicyanoimidazolate–Glyme Solvates. Impact of Water Molecules on Aggregation Processes in Lithium-Ion Battery Electrolytes, J. Phys. Chem. C, 2018, 122(6), 3201–3210, DOI:10.1021/acs.jpcc.7b11145.
- M. Dranka, L. Niedzicki, M. Kasprzyk, M. Marcinek, W. Wieczorek and J. Zachara, An Insight into Coordination Ability of Dicyanoimidazolato Anions toward Lithium in Presence of Acetonitrile. Crystal Structures of Novel Lithium Battery Electrolyte Salts, Polyhedron, 2013, 51, 111–116, DOI:10.1016/j.poly.2012.12.022.
- M. Broszkiewicz, A. Zalewska and L. Niedzicki, Comparison of LiTDI and LiPDI Salts and Influence of Their Perfluoroalkyl Side-Chain on Association and Electrochemical Properties in Triglyme, Ionics, 2019, 25(8), 3651–3660, DOI:10.1007/s11581-019-02905-w.
- L. Niedzicki, M. Kasprzyk, K. Kuziak, G. Z. Żukowska, M. Armand, M. Bukowska, M. Marcinek, P. Szczeciński and W. Wieczorek, Modern Generation of Polymer Electrolytes Based on Lithium Conductive Imidazole Salts, J. Power Sources, 2009, 192(2), 612–617, DOI:10.1016/j.jpowsour.2009.03.050.
- L. Niedzicki, E. Karpierz, A. Bitner, M. Kasprzyk, G. Z. Zukowska, M. Marcinek and W. Wieczorek, Optimization of the Lithium-Ion Cell Electrolyte Composition through the Use of the LiTDI Salt, Electrochim. Acta, 2014, 117, 224–229, DOI:10.1016/j.electacta.2013.11.134.
- A. B. McEwen, S. F. McDevitt and V. R. Koch, Nonaqueous Electrolytes for Electrochemical Capacitors: Imidazolium Cations and Inorganic Fluorides with Organic Carbonates, J. Electrochem. Soc., 1997, 144(4), L84, DOI:10.1149/1.1837561.
- W. Xu, E. I. Cooper and C. A. Angell, Ionic Liquids: Ion Mobilities, Glass Temperatures, and Fragilities, J. Phys. Chem. B, 2003, 107(25), 6170–6178, DOI:10.1021/jp0275894.
- D. Farhat, D. Lemordant, J. Jacquemin and F. Ghamouss, Alternative Electrolytes for Li-Ion Batteries Using Glutaronitrile and 2-Methylglutaronitrile with Lithium Bis(Trifluoromethanesulfonyl) Imide, J. Electrochem. Soc., 2019, 166(14), A3487–A3495, DOI:10.1149/2.1261914jes.
- L. Niedzicki, M. Kasprzyk, K. Kuziak, G. Z. Żukowska, M. Marcinek, W. Wieczorek and M. Armand, Liquid Electrolytes Based on New Lithium Conductive Imidazole Salts, J. Power Sources, 2011, 196(3), 1386–1391, DOI:10.1016/j.jpowsour.2010.08.097.
- C. L. Berhaut, D. Lemordant, P. Porion, L. Timperman, G. Schmidt and M. Anouti, Ionic Association Analysis of LiTDI, LiFSI and LiPF6 in EC/DMC for Better Li-Ion Battery Performances, RSC Adv., 2019, 9(8), 4599–4608, 10.1039/C8RA08430K.
- A. B. McEwen, S. F. McDevitt and V. R. Koch, Nonaqueous Electrolytes for Electrochemical Capacitors: Imidazolium Cations and Inorganic Fluorides with Organic Carbonates, J. Electrochem. Soc., 1997, 144(4), L84, DOI:10.1149/1.1837561.
Footnotes |
| † Electronic supplementary information (ESI) available: Further information about the formulation of the electrolytes, exemplary visualization of the deviation from theory in J-PGSE NMR measurements, values of the deviation from the ideal KCl line and slopes of the Walden plot. See DOI: https://doi.org/10.1039/d3ta01217d |
| ‡ AS, MV and PY contributed equally. |
| This journal is © The Royal Society of Chemistry 2023 |