 Open Access Article
CO2 removal and 1.5 °C: what, when, where, and how?
Solene
Chiquier
 ab,
Mathilde
Fajardy
 c and
Niall
Mac Dowell
*ab
aCentre for Environmental Policy, Imperial College London, Exhibition Road, London, SW7 1NA, UK. E-mail: niall@imperial.ac.uk; Tel: +44 (0)20 7594 9298
bCentre for Process Systems Engineering, Imperial College London, Exhibition Road, London, SW7 2AZ, UK
cCambridge Judge Business School, University of Cambridge, Trumpington Street, Cambridge CB2 1AG, UK
First published on 14th June 2022
Abstract
The international community aims to limit global warming to 1.5 °C, but little progress has been made towards a global, cost-efficient, and fair climate mitigation plan to deploy carbon dioxide removal (CDR) at the Paris Agreement's scale. Here, we investigate how different CDR options—afforestation/reforestation (AR), bioenergy with carbon capture and storage (BECCS), and direct air carbon capture and storage (DACCS)—might be deployed to meet the Paris Agreement's CDR objectives. We find that international cooperation in climate mitigation policy is key for deploying the most cost-efficient CDR pathway—comprised of BECCS, mainly (74%), and AR (26%)—, allowing to take the most advantage of regional bio-geophysical resources and socio-economic factors, and time variations, and therefore minimising costs. Importantly, with international cooperation, the spatio-temporal evolution of the CDR pathway differs greatly from the regional allocation of the Paris Agreement's CDR objectives—based on responsibility for climate change, here used as a proxy for their socio-economically fair distribution. With limited, or no international cooperation, we find that the likelihood of delivering these CDR objectives decreases, as deploying CDR pathways becomes significantly more challenging and costly. Key domestic bio-geophysical resources include geological CO2 sinks, of which the absence or the current lack of identification undermines the feasibility of the Paris Agreement's CDR objectives, and land and biomass supply, of which the limited availability makes them more costly—particularly when leading to the deployment of DACCS. Moreover, we show that developing international/inter-regional cooperation policy instruments—such as an international market for negative emissions trading—can deliver, simultaneously, cost-efficient and equitable CDR at the Paris Agreement's scale, by incentivising participating nations to meet their share of the Paris Agreement's CDR objectives, whilst making up for the uneven distribution of CDR potentials across the world. Crucially, we conclude that international cooperation—cooperation policy instruments, but also robust institutions to monitor, verify and accredit their efficiency and equity—is imperative, as soon as possible, to preserve the feasibility and sustainability of future CDR pathways, and ensure that future generations do not bear the burden, increasingly costlier, of climate mitigation inaction.
1 Introduction
1.1 Carbon dioxide removal (CDR) and the Paris agreement
Through the 2015 Paris Agreement, Parties to the UNFCCC agreed to hold global warming to “well below” 2 °C and pursue efforts to limit it to 1.5 °C by reducing global CO2 emissions as soon as possible and reaching net-zero by mid-century.1 Because of the near-linear relationship between cumulative anthropogenic CO2 emissions and temperature increase,2–5 halting global warming to 1.5 °C requires CO2 emissions to stay within a remaining carbon budget of about 420 Gt CO2.6–9If future anthropogenic CO2 emissions are not reduced promptly enough and “overshoot” this remaining carbon budget, then negative CO2 emissions will be required to return to it, i.e. the CO2 emissions level (and the temperature increase target of 1.5 °C) is first exceeded and then return to by deploying carbon dioxide removal (CDR). However, delaying short-term climate mitigation will ultimately result into a more aggressive mid-term transformation of energy systems, higher long-term costs, and stronger transitional economic and societal impacts.10–13 Particularly, the increased reliance on CDR might render the feasibility of the 1.5 °C objectives of the Paris Agreement questionable.14–16
Most Parties have committed to legally-binding net-zero targets by the second half of this century—mostly 2050 but also, for instance, 2060 in China or 2070 in India—since the close of COP26.17,18 However, almost none are on track with their nationally determined contributions (NDCs),19 which themselves, moreover and anyway, still fall short of the Paris Agreement's 1.5 °C ambition.17,20,21 Therefore, large-scale deployment of CDR is critical not only (1) to achieve net-zero by compensating for on-going CO2 emissions, particularly residual ones from hard-to-abate sectors such as transport or agriculture, but also (2) to provide net negative emissions to return from any overshoots of the remaining carbon budget.22
In Integrated Assessment Models (IAMs), most 1.5 °C-consistent scenarios require CO2 emissions to decrease from 2030, reach net zero by 2050, and become net negative afterwards in order to return from overshoots.6,23 “No or limited overshoot” scenarios (categorised as P1, P2 and P3 in the Special Report on Global Warming of 1.5 °C (SR15) published by the IPCC) rely on cumulative CO2 removal of 246–689 GtCO2 by 2100,† and “higher overshoot” scenarios (categorised as P4) on as much as 1186 GtCO2.6,7 Such deployments of CDR are estimated to start immediately (i.e., between 2020–2030) and reach up to 4–24 GtCO2 per year in 2100.6,7 For these reasons, this study focuses on the 1.5 °C-consistent CDR scenarios of the IPCC SR15, rather than on the mid-century net-zero objectives set out by the Parties’ NDCs.
1.2 The techno-economic challenges of CDR
Various CDR options has been suggested—including afforestation/reforestation (AR),24 bioenergy with carbon capture and storage (BECCS),25 direct air capture with carbon capture and storage (DACCS),26,27 ocean fertilisation,28 enhanced weathering (EW) of minerals,29,30 biochar31,32 or soil carbon sequestration32,33—but have scarcely been taken up in IAMs. To that date, they have included mainly AR and BECCS, DACCS as well (yet only recently), and seldom EW,34–38 and that mainly because other CDR options are still highly speculative.39 Particularly, only BECCS40 and DACCS41,42 have been deployed at the demonstration scale, yet nowhere near the scales required to deliver the Paris Agreement's 1.5 °C ambition, and whilst AR is a well-established and mature practice, projects with the aim of removing CO2 from the atmosphere have only recently emerged, mostly in China.43,44The nascent nature of most CDR options has raised heightened concerns about the feasibility and sustainability of the large-scale deployments of CDR in 1.5 °C-consistent scenarios, especially if achieved via such limited portfolios of CDR options (e.g., only BECCS and AR).45–48 Particularly, Fuss et al.45 reduced the CDR potential of BECCS in 2050 from 8 to 0.5–5 GtCO2 per year for sustainability safeguard, and suggested therefore that BECCS alone would be insufficient to deliver the Paris Agreement's most stringent CDR targets, such as in the P4 scenario of the SR15. Despite the increasing focus on CDR in the academic literature, emphasising on CDR potential, cost, and up-scaling, as well as interactions with the sustainable development goals (SDGs), the CDR efficiency and permanence of most CDR options are still uncertain, and remain major challenges to their deployment.45,47,49,50
1.3 International cooperation and CDR policy
With the principle of “common but differentiated responsibilities and respective capabilities” lying at the heart of the Paris Agreement, there has been recently an increasing reflection on the role and value of CDR at the national scale and the need for equity in sharing its global burden.51,52 Different burden-sharing principles,53 based on equity, climate change responsibility, or financial capacity for instance, have been investigated in the context of CDR.51,54Importantly, the amounts of CDR deployed in global and cost-optimal IAMs scenarios fail to reflect the responsibility of each nation for climate change, or any other socio-economically fair establishment of its share of the global CDR burden. As the CDR potentials (as well as feasibilities) of each nation vary due to bio-geophysical and socio-political factors—including the availability of bioenergy resources, geological and/or biogenic CO2 sinks and low-carbon and affordable energy, and the acceptability of the various CDR options—, they don’t necessarily match with national CDR targets, and that, regardless of how the global CDR burden is shared.
As promoted by the Paris Agreement (in the general context of climate mitigation), international cooperation would certainly allow to deploy most-cost efficiently, sustainably, and feasibly CDR in line with the Paris Agreement 1.5 °C ambition. For instance, Fajardy et al.55 emphasised the value of collaboration in delivering CDR at large-scales, via BECCS, in a most cost-effective manner. Bauer et al.56 investigated the trade-off between cost-efficiency and national sovereignty—the nation's ability to maintain governing control of economic resources by limiting international transfer payment, while contributing to climate mitigation actions—in delivering the Paris Agreement, and showed the value of cooperation via an hybrid combination of financial transfers and differentiated carbon prices. Finally, Strefler et al.34 also showed that large international financial transfer and strong international institutions would be required for delivering CDR at the Paris Agreement's 1.5 °C scale, while meeting fairness and sustainability criteria.
Deploying CDR with international cooperation will certainly involve the adoption of international/inter-regional policy instruments, such as markets for internationally transferred mitigation outcomes (ITMOs) (i.e., transfers between domestic ETS) or voluntary emission reductions (VERs) (i.e., international market). Such market-based approaches have been introduced in the Article 6 of the Paris Agreement,1 the rulebook of which was recently completed at COP26. Importantly, these instruments should be combined with a transparent assessment of sustainable development implications, e.g. the SDGs of the Paris Agreement, as advocated by Honegger and Reiner.57 For example, at the EU-scale, Rickels et al.58 considered the integration of BECCS into the EU emissions trading system (ETS) and its potential implications for the EU ETS. It is still unclear, however, how CDR options might be integrated within such international/inter-regional market-based approaches, notably do to many challenges around the permanence, additivity, measurability, and verifiability of their CDR potentials.59,60
1.4 Contribution of this study
This study investigates the spatio-temporal potential, composition, and evolution of a portfolio of CDR options (AR, BECCS and DACCS) by exploring different climate policy options, while delivering CDR targets that are consistent with the Paris Agreement's 1.5 °C objectives in the context of 5 regions (Brazil, China, the EU-28, India and the USA).By doing so, and considering a range of feasibility and sustainability criteria, we aim to keep within reach the Paris Agreement's 1.5 °C objectives by helping policymakers to understand (1) the real-world potential, implications and challenges of the different nascent CDR options, and (2) the benefits of international cooperation policy, at high spatio-temporal resolution. Particularly, we aim to bridge the gap between the IAMs top-down approach and the CDR assessments bottom-up approach. Note that this study doesn’t contribute to define how much CDR should be required to meet the Paris Agreement's 1.5 °C objectives, nor how it should be shared, i.e. allocated regionally. It doesn't either aim to determine policy design for the integration of negative emissions within carbon markets.
Firstly, Section 2 describes the Modelling and Optimisation of Negative Emissions Technologies (MONET) framework used in this study. In Section 3, cost-optimal CDR pathways (i.e., portfolios of CDR options), subject to alternative climate policies are outlined. Section 4 discusses the role and value of international cooperation in climate policy, via an international market for negative emissions trading, and Section 5 emphasises the urgency of shifting towards international cooperation policy, and discusses the impacts of delaying it. Lastly, we present some conclusions in Section 6.
2 Methods
In this study, we use the Modelling and Optimisation of Negative Emissions Technologies (MONET) framework to provide insights on the composition (i.e., what is deployed?) and spatio-temporal evolution (i.e., when and where is it deployed?) of cost-optimal CDR pathways deployed to deliver the Paris Agreement's 1.5 °C objectives. MONET is a spatio-temporally explicit framework, that (1) provides whole-system analyses (e.g., CDR potential, cost, land use) for different CDR options, and (2) determines cost-optimal deployments of a portfolio of such CDR options between 2020–2100, subject to long-term CDR targets, CDR deployment conditions (i.e., build/expansion rates and operating lifetimes), and bio-geophysical constraints (i.e., land and geological CO2 storage availabilities, maximum water stress). All together, these constraints aim to encompass criteria of feasibility and sustainability.The current implementation of MONET describes the deployment of 3 CDR options—AR, BECCS, and DACCS−across 5 regions—Brazil, China, the EU (EU-27 + UK), India and the USA. The spatial resolution is at the state/province scale (national scale for the EU), that is 169 sub-regions, and the temporal resolution (i.e., time-step) is 10 years. Consistently with 1.5 °C scenarios, we assume that the worldwide economy transitions towards net-zero, particularly the electricity and the transport/fuel sectors, as presented previously.61,62 This is illustrated in Fig. 1.
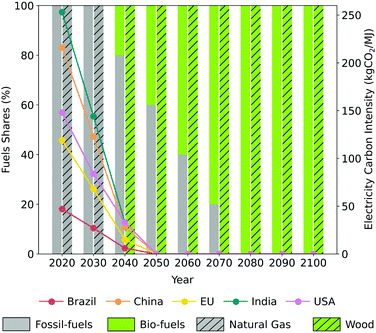 | ||
| Fig. 1 Transition of the worldwide economy towards net-zero. Following a decreasing carbon intensity (as projected by the IPCC P2 scenario),6,7 the electricity system becomes carbon neutral in 2050. Fossil-fuels (i.e., diesel and petrol) are progressively replaced by 100% bio-fuels (i.e., bio-diesel and bio-ethanol) in 2080. Natural gas is switched to 100% wood as early as 2040 for biomass drying for BECCS. | ||
The MONET framework, developed initially for BECCS, has been presented previously.61–63 Appendix A briefly describes the key characteristics of the BECCS archetype, as it has been already implemented in the MONET framework, and further details the key characteristics of AR and DACCS archetypes. Appendix B presents the mathematical formulation of the optimisation model, adapted from previous publications to include AR and DACCS archetypes, and Appendix C describes the recently added (or updated) datasets (i.e., land and geological CO2 storage availabilities) used to constraint the optimisation model.
2.1 Key optimisation constraints
However, because of the complexity and sophistication of IAMs, the spatial resolution of climate mitigation scenarios is necessarily limited, i.e. the world is usually represented with a limited number of regions. Particularly, these regions don't exactly coincide with the ones considered in this study. Moreover, the different levels of CDR deployed in IAMs are the result of global and cost-optimal climate mitigation pathways, and therefore, they don't reflect on the responsibility for climate change of each nation, nor on its capability to address it.
For these reasons, we apply here a responsibility-based burden-sharing principle to allocate regional CDR targets, i.e. to each region considered in the MONET framework.64 In both IPCC scenarios of the SR15 (P3 or P4), global CDR targets are distributed in proportion to each region's cumulative historic GHG emissions.65,66 This is presented in detail in Table 1. Note that we don't intend to be prescriptive in our selection of the burden-sharing principle, but rather provide a proxy for a socio-economically fair regional distribution of 1.5 °C-consistent CDR targets. Recognising that the distribution of the global CDR burden will likely be decided upon via international negotiations rather than via deterministic analytical approaches, we direct interested readers to Pozo et al.54 and references therein for a broader discussion of burden-sharing principles in the context of CDR.
| Nations | Cumulative GHG emissions 1850–2019 (GtCO2)a | Proportion of CDR targets (%) | Cumulative P3 target 2100 (GtCO2) | Cumulative P4 target 2100 (GtCO2) |
|---|---|---|---|---|
| a Cumulative historic GHG emissions excluding Land Use, Land Use Change, and Forestry (LULUCF) between 1850–2019,66 as categorised by the IPCC 2006 Guidelines for National Greenhouse Gas Inventories.67 | ||||
| Brazil | 47 | 1.8 | 7 | 21 |
| China | 357 | 13.7 | 56 | 161 |
| EU-28 | 521 | 19.9 | 81 | 235 |
| India | 128 | 4.1 | 20 | 58 |
| USA | 557 | 21.3 | 87 | 252 |
| Total MONET nations | 1610 | 61.6 | 251 | 727 |
| World | 2612 | 100 | 408 | 1179 |
Particularly, the 5 regions considered in this study are responsible for 61.6% of the cumulative historic GHG emissions.66 Together, they also accounted for 50% of the global population and 68% of the global GDP in 2018.68 Therefore, the case-study presented here can be reasonably considered representative of the international landscape, as well as the insights obtained here can be found valuable for policymakers in climate change mitigation.
We assume a maximum build rate for BECCS plants of 2 GW per year at the sub-region scale, based on the literature surveyed on energy system and climate mitigation strategy modelling.73 Note that if BECCS plants were maximally-deployed (i.e., as much is built as allowed by the build rate constraints), given an average BECCS CO2 capture capacity of 4.2 MtCO2 per year per plant,‡ this would be equivalent to 16.8 MtCO2 per year at the sub-regional scale, and 2.8 GtCO2 per year at the MONET scale.
Because of the relative immaturity of the DAC technology, little build rate estimates can be found for DACCS in the literature. To ensure fair comparison across CDR technologies, a maximum build rate for DAC plants of 16.8 MtCO2 per year at the sub-regional scale is also used, i.e. the same rate as BECCS. If both BECCS and DACCS were maximally-deployed, the maximum CO2 capture capacity would thus be equivalent to 5.7 GtCO2 per year at the MONET scale.
Based on a maximum worldwide deployment rate of 47 Mha per year for AR reported in the IPCC SR15,§ we downscaled this number to 8.5 Mha per year at the MONET scale, then 50 kha per year at sub-regional scale (equal sub-regional rates), using forest areas at both the global and MONET scales.6,74 For context, note that historical rates between 1990–2020 reported by the FAO are usually much lower, with afforestation rates of 2095 kha per year in China, 470 kha per year in the EU, 274 kha per year in India, and 245 kha per year in the USA, and with a deforestation rate of 3076 kha per year in Brazil.75
Recognising that the assumptions made here on maximum deployment rates are relatively optimistic in comparison to historical afforestation/deforestation rates, as well as owing to the highly speculative and non-commercial status of CDR options, we also run a sensitivity analysis on higher deployment rates (see Appendix E).
Recognising the current uncertainty surrounding CO2 storage capacity and availability, especially the strong probability for CO2 storage sites to exist both in Brazil and India, in spite of not being identified yet, we also run a sensitivity analysis on higher CO2 storage availability and capacity, based on both quantitative and qualitative data (see Appendix E).
2.2 Key metrics
We used different metrics in this study to describe the cost-efficiency of the CDR pathways deployed in the different policy scenarios.| CTNC(t) = CTCAR(t) + CTNCBECCS(t) + CTCDACCS(t) ∀ t | (1) |
 | (2) |
 | (3) |
2.3 Alternative policy scenarios
The MONET framework is used here to determine the cost-optimal co-deployment of AR, BECCS and DACCS to deliver the Paris Agreement's 1.5 °C-consistent CDR objectives—here, the IPCC P3 CDR targets6,7—subject to the following alternative policy options:• International cooperation policy scenario: in this scenario (referred as COOPERATION scenario), CDR targets are pursued in an international cooperation paradigm. We assume that an international policy instrument (such as one of the carbon market approaches defined in Articles 6.2 and 6.4 of the Paris Agreement1) has been developed, allowing regions to share the effort to meet 1.5 °C-consistent CDR targets. Therefore, the regions considered in this study can meet the cumulative CDR targets together, based on their shared (as opposed to individual) responsibility for climate change (see Section 2.1.1). They can also trade bio-geophysical resources, particularly biomass, and therefore deploying inter-regional biomass supply chains for BECCS.
• “Current policy” scenario: in this scenario (referred as CURRENT POLICY scenario), CDR targets are pursued in a climate policy paradigm envisaged by the current policy landscape. For context, domestic emissions trading systems (ETS), such as the EU ETS, the UK ETS, or the California (USA) ETS, are currently creating incentives to reduce CO2 emissions via a “cap-and-trade” principle. However, these ETS are not linked, i.e. there are no bilateral or multilateral transfers between them, and negative emissions are not yet integrated within them. In light of this, we assume that the regions considered in this study must meet individual cumulative CDR targets, based on their respective responsibilities for climate change (see Section 2.1.1). Bio-geophysical resources, particularly biomass, can still be traded inter-regionally (i.e., local or imported biomass for BECCS). This scenario is equivalent to an international climate policy landscape in which CDR has been incorporated into domestic ETS, but cannot be transferred from one to another.
• “National isolation policy” scenario: in this scenario (referred as ISOLATION scenario), the 1.5 °C-consistent CDR targets are pursued in a national isolation paradigm. We assume that no international policy instrument framework has been developed to distribute the effort to meet the 1.5 °C-consistent CDR targets (i.e., individual CDR targets), and that there is no inter-regional trading of bio-geophysical resources (i.e., only local biomass supply chains for BECCS).
3 Optimal co-deployment of CDR options
Here, we identify the deployment of cost-optimal CDR pathways under the 3 policy scenarios described in Section 2.3 in order to deliver CDR targets that are consistent with the Paris Agreement's 1.5 °C objectives. As discussed, we use the IPCC P3 CDR targets6,7 for these reference scenarios. The composition of these CDR pathways—AR, BECCS and/or DACCS—and their spatio-temporal evolution—between 2020–2100 and across Brazil, China, the EU, India and the USA—are discussed in this section.3.1 The international cooperation policy paradigm
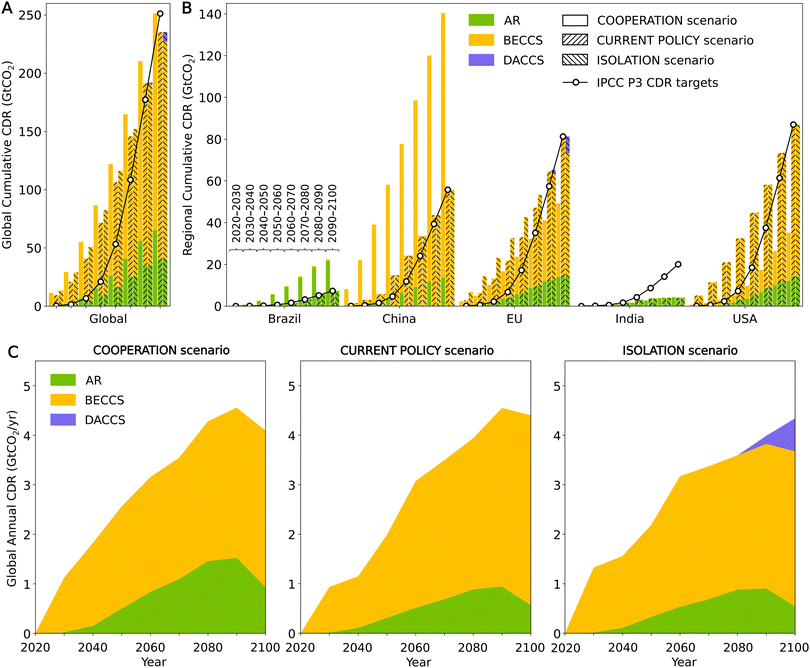
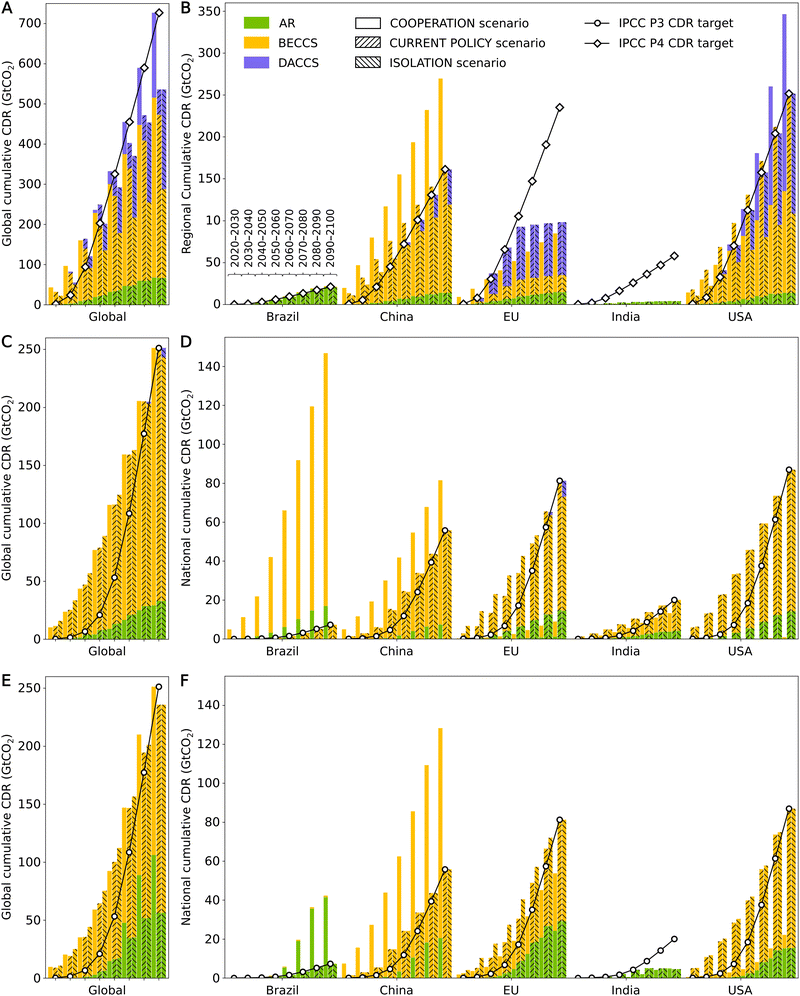
In the COOPERATION scenario, CDR is successfully delivered at the Paris Agreement's 1.5 °C scale by 2100. This is achieved via BECCS mainly, with 186 GtCO2 (74%), and AR, with 65 GtCO2 (26%) (Fig. 2A).Given the anticipated large scale of CO2 removal over the century (i.e., high CDR targets increasing over time), constrained here by maximum deployment rates of the different CDR options, we find that the prompt deployment of the CDR pathway, starting in the 2020s, is required to deliver the Paris Agreement's CDR objectives by 2100. Particularly, the amount of CDR achieved is systematically greater than pre-2100 CDR targets. As illustrated in Fig. 2C, BECCS starts delivering CO2 removal straightaway, and increasingly up to 3.2 GtCO2 per year in 2100. This is equivalent to 154 GW of BECCS capacity. For context, this is 4% of the current electricity capacity of China, the EU and the USA, all together (2200 GW in China in 2020, 1117 GW in the USA in 2020 and 946 GW in the EU-28 in 201990–92).
Importantly, AR is also deployed in the early 2020s, but its CO2 removal is delayed owing to the period of time required for trees to grow (see Appendix A for a description of the AR model used here). Then, because of a combination of CO2 sinks saturation, i.e. trees reach maturity and hit their maximum CDR potential, and optimisation edge effect, i.e. trees planted after 2070 would only play an important role in the 22nd century but not before, AR's CO2 removal peaks at a rate of approximately 1.5 GtCO2 per year in 2090 and falls substantially thereafter.
Note that in the COOPERATION scenario (as well as in any other reference scenario), whilst BECCS plants are rarely maximally-deployed, i.e. as much is built as allowed by the build rate constraints, AR deployment is constrained by its maximum deployment rate, assumed here to be 50 kha per year per sub-region. However, the sensitivity analysis carried out in Appendix E showed that higher AR deployment rates would only increase its CO2 removal moderately, due to the exhaustion of land availability.
Overall, forward planning and strategic deployment of the different CDR options is thus key to deliver the Paris Agreement's 1.5 °C ambition. Whilst all CDR options have specific techno-economic and sustainability characteristics, which influence the rate and scale at which they can be deployed, they can also be distinguished by when they start to capture and remove CO2, and how long they remove and store CO2. CO2 removal efficiency, timing and permanence will certainly have to be carefully and clearly accounted for, when deploying the different CDR options.
We also find that the spatial deployment of the CDR pathway differs from a CDR option to another. As shown in Fig. 2B, there is no silver-bullet to meet the Paris Agreement's CDR objectives, as the optimal portfolio of CDR options within a given region, or even sub-region, varies around the world (see Appendix D.1).
AR can be deployed in most parts of the world, given the combination of available land and appropriate climate—a balance between warm temperature and humidity. Specifically, between 12–21.5 GtCO2 by 2100 are removed via AR in most regions (Brazil, China, the EU and the USA) whereas only 4 GtCO2 by 2100 are removed in India, where, in spite of the availability of land and good climates, they usually do not coincide.
Conversely, because of its complex value chain, we observe that BECCS deployment is more localized than AR deployment, owing to the combination of several bio-geophysical and economic factors: well-characterised CO2 storage capacity; cost-effective biomass supply (i.e., high MAL availability and DEC yields, high agricultural residues availability, and low-cost biomass production); and affordable CO2 transport & storage (T&S) infrastructures. Moreover, regions or sub-regions where electricity prices are anticipated to be high (as assumed here) also prove to be more advantageous for BECCS deployment, as they benefit from higher revenues from electricity generation. Specifically, by 2100, 68% of CDR achieved via BECCS is deployed in China, with a further 19% and 12.5% deployed in the EU and USA, respectively, and 0.5% in Brazil.
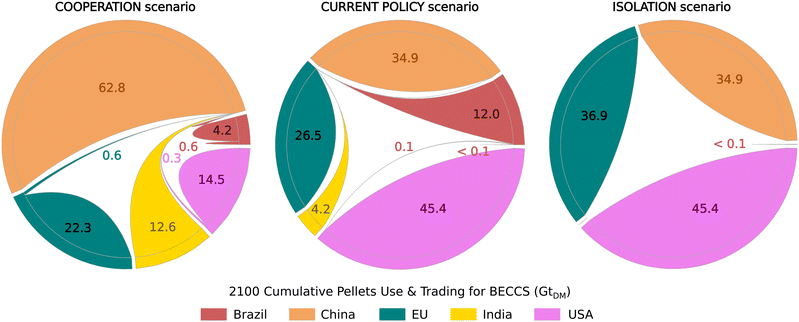
As illustrated in Fig. 3, where possible, local biomass supply chains are prioritised—100 GtDM of pellets (85%) by 2100, of which 63 GtDM are in China alone. Remaining imported biomass supply chains mostly originate in regions with limited or no CO2 storage capacity, such as Brazil and India (as identified here). These regions contribute thus indirectly to the delivering of the Paris Agreement's CDR objectives through the supply of biomass to other regions, similarly to the current and incumbent global biomass trade. Note that DACCS is not deployed in this scenario, owing to its significant higher cost, compared to AR and BECCS. For DACCS to become cost-competitive, current average costs should decrease to below $100 per tCO2, which is equivalent to a cost reduction of around 60–70% for liquid solvent DAC technologies,27 and 90% for solid sorbent technologies92 (see Appendix D.2).
Overall, adapting the spatial deployment of the CDR pathway to each CDR option is thus also key to deliver the Paris Agreement's 1.5 °C ambition.
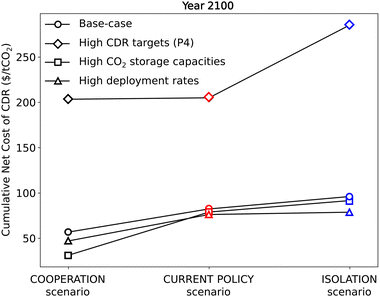
Finally, we find that CO2 removal is achieved at lowest cost in the COOPERATION scenario, with a CNC of $57 per tCO2 by 2100. This is because AR and BECCS can be deployed most cost-efficiently, i.e. without being restricted regionally by individual CDR targets, such as in Brazil and China in the COOPERATION scenario, or conversely without being “over-deployed”, i.e. imposed by individual CDR targets and therefore less cost-efficiently, such as in the EU and the USA in the CURRENT POLICY and ISOLATION scenarios.
3.2 The current policy paradigm
In the CURRENT POLICY scenario, the likelihood of delivering the Paris Agreement is reduced because the extent to which each region can remove domestically CO2 from the atmosphere is limited by its own bio-geophysical sinks for CO2, i.e. geological sites for BECCS and DACCS and land for AR. As in the COOPERATION scenario, the CDR pathway deployed by 2100 is still composed of BECCS mainly, whose contribution increased to 195 GtCO2 (83%), and of AR, whose contribution decreased to 40 GtCO2 (17%), but the 2100 CDR target is missed by 16 GtCO2.As shown in Fig. 2B, most regions successfully reach their individual CDR targets, via exclusively AR in Brazil or BECCS in China, or via both in the EU and the USA for instance. Note that DACCS is also not deployed in this scenario. For it to become cost-competitive with AR and BECCS, current average costs should decrease to below $170 per tCO2 (see Appendix D.2). The EU, and in a much lesser extend the USA as well, rely partly on biomass supply originating in Brazil and India in order to achieve CDR via BECCS (Fig. 3). Specifically, 38% and <1% of the pellet used cumulatively by 2100 in the EU and the USA, respectively, are imported from Brazil mostly, and India. This is because domestic biomass supply becomes critical and almost exhausted, and imported biomass proves then less costly.
However, a few regions, such as India, are much less well endowed with domestic CO2 sinks, yet required to meet individually CDR targets, and therefore do not meet their individual CDR targets by the end of the century. By lack of international cooperation or other alternative CDR solutions, individual CDR targets are missed in India by 16 GtCO2 by 2100. Note that, given the size of India, the existence of CO2 storage sites within its borders is very likely. Such CO2 storage sites would first need to be identified and assessed before deploying geological CDR options, such as BECCS or DACCS, but then, they could increase India's likelihood to reach its individual CDR targets (see Appendix E for a sensitivity analysis on higher CO2 storage availability).
Finally, because of the mismatch between a socio-economically fair regional distribution of the Paris Agreement's CDR objectives, and the regional availability of bio-geophysical sinks for CO2, we find that the CNC of CO2 removal by 2100 increases by 45% relatively to the COOPERATION scenario.
Thus, this scenario highlights that delivering the Paris Agreement's 1.5 °C ambition in a climate mitigation policy paradigm similar to what is envisioned in the current policy landscape is less likely than in an international cooperation policy paradigm, and will certainly increase the Paris Agreement's financial burden.
3.3 The national isolation policy paradigm
In the ISOLATION scenario, the likelihood of the Paris Agreement's CDR objectives is reduced even further than in the CURRENT POLICY scenario. Not only is the 2100 CDR target still missed by 16 GtCO2, but the CNC of CO2 removal by 2100 increases by 69% relatively to the COOPERATION scenario. As shown in Fig. 2A, 80% of CDR is removed from the atmosphere via BECCS, 17% via AR, and also 4% via DACCS.Because BECCS is deployed exclusively using local biomass, domestic biomass supply becomes rapidly exhausted in the EU and the USA. Specifically, 83% and 100% of the available land in the USA and the EU (MAL and harvested wheat areas), respectively, are already allocated to biomass production for BECCS by 2030. This leads therefore to the deployment of DACCS in the EU from 2080 and up to 0.7 GtCO2 per year in 2100.
Besides increasing the Paris Agreement's financial burden, the energy consumed annually to deploy DACCS by 2100 is approximately 265 TW h in the ISOLATION scenario. This is equivalent to 8% of the EU current electricity production (3275 GW h in the EU-28 in 201893).
Thus, this scenario shows that delivering the Paris Agreement's 1.5 °C ambition in an isolation policy paradigm is highly unlikely. It will not only be more expensive than in an international cooperation policy paradigm, but also certainly more energy-intensive, and could thus compromise the sustainability of the CDR pathway deployed.
3.4 The benefits of international cooperation policy
Fig. 2B showed that the socio-economically fair distribution of the IPCC P3 CDR targets at the regional scale, based here on the responsibility for climate change, differs greatly from the deployment of the most cost-optimal CDR pathway achieved with international cooperation.In the COOPERATION scenario, more than half of the CO2 removal by 2100 is delivered in China, in this study the most cost-effective region to achieve CDR. Specifically, 140 GtCO2 (56% of the global CDR achieved by 2100) are removed in China by 2100 in this scenario, via BECCS and AR, whereas China's individual CDR target is only 56 GtCO2 (22% of the global 2100 CDR target). Brazil also provides an additional 15 GtCO2 over and above its individual CDR target by 2100, almost exclusively via AR.
Establishing of a policy instrument that enables international cooperation while fulfilling the Paris Agreement's CDR objectives, via the international trade of negative emissions for instance, is therefore found to substantially reduces the financial burden of the Paris Agreement by 51–69%. Whilst AR's CNC of CDR remains approximately constant in all scenarios (see Appendix D.2 for a detailed overview of the MNC of CDR achieved via all CDR options, in all scenarios)—this CDR solution is used to its full extent in all scenarios—, BECCS becomes significantly more costly in the CURRENT POLICY and ISOLATION scenarios. This is because the most cost-efficient BECCS value chains become more difficult to deploy, owing to the requirement to meet individual CDR targets domestically. In the ISOLATION scenario, the complete lack of international cooperation forces some regions to resort to more costly CDR options such as DACCS, and thus drives the CNC of the CDR pathway deployed the most up.
Thus, international cooperation policy is key in delivering the Paris Agreement's 1.5 °C ambition in the most cost-efficient manner as it allows for the deployment of a CDR pathway in least-cost and most “CDR-efficient” regions while still delivering individual CDR targets.
4 Assessing the value of a negative emissions trading system
Section 3 highlighted that, despite the feasibility of the Paris Agreement's 1.5 °C ambition, CDR pathways reflecting either current policy or national isolation policy paradigms may not only be more challenging and expensive, but also less likely to meet the Paris Agreement's CDR objectives than CDR pathways deployed in an international cooperation policy paradigm.Because CO2 sinks are unevenly distributed across the world, the most cost-optimal CDR pathway, here in the COOPERATION scenario, differs greatly from individual CDR targets. It can therefore be considered unfair, particularly towards regions achieving CDR over and above their individual CDR targets. Conversely, fair CDR pathways aligned with individual CDR targets, here in the CURRENT POLICY and ISOLATION scenarios, must generate negative emissions domestically in each region, regardless of the cost or the availability of CO2 sinks within the region's borders.
As a result, they are less cost-efficient, and therefore more costly. Integrating CDR options within an international negative emissions trading system would address the trade-off between cost-efficiency and equity by allowing regions that are well endowed with bio-geophysical CO2 sinks, and therefore CDR potentials, to trade CDR surplus (i.e., the additional CO2 removal achieved over and above any given CDR target) with other regions for which delivering CDR is more difficult, or more costly.
4.1 Introducing the concept of a negative emissions trading system
Conceptually, a negative emissions trading system would work in a reverse way to any current existing ETS. An inter-regional or international negative emissions target would be set to be met, and increased over a given time-period, following the IPCC P3 cumulative CDR targets for instance. Regions would then be allocated a share of this global negative emissions target, based on responsibility for climate change for instance. In such trading system, “verified”¶ CO2 removal would generate negative emissions credits (NECs) that could be traded between regions as required to meet individual negative emissions targets. “NECs provider” regions could therefore provide CDR surplus and sell NECs to “NECs beneficiary” regions that, themselves, could benefit from CDR surplus—either because they could not meet their individual CDR targets domestically, or because they would find it less expensive—and buy NECs from “NECs provider” regions.The negative emissions price (NEP)—the price at which NECs are traded between regions—could, in theory, be as low as the marginal net cost of generating CDR surplus in “NECs provider” regions. Admittedly optimistic, this approach is used here to demonstrate the potential role and value of a NE trading system. Investigating further cost-sharing approaches in the context of CDR, while fulfilling the Paris Agreement's 1.5 °C ambition, is left for future work. In this study, we assume the existence of such above-mentioned negative emissions trading system, within which all CDR surplus can be traded at a unique NEP, calculated as the averaged marginal net cost of CDR surplus. This is shown in eqn (4):
 | (4) |
4.2 The value of a negative emissions trading system
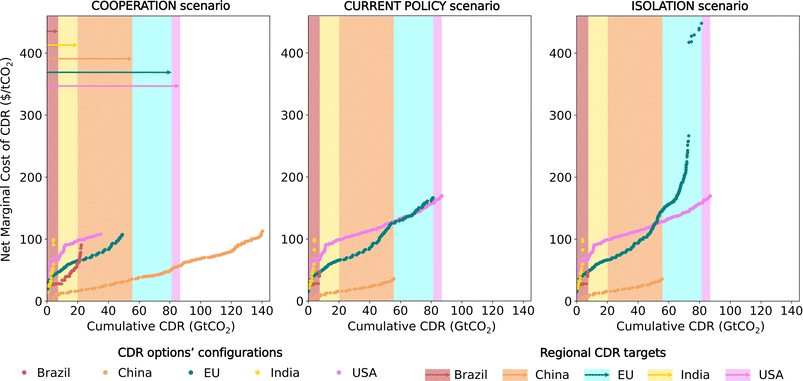
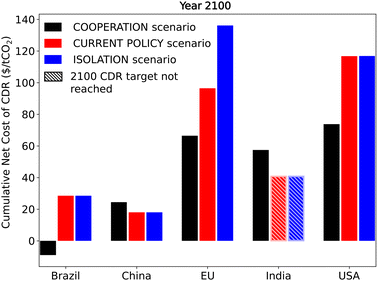
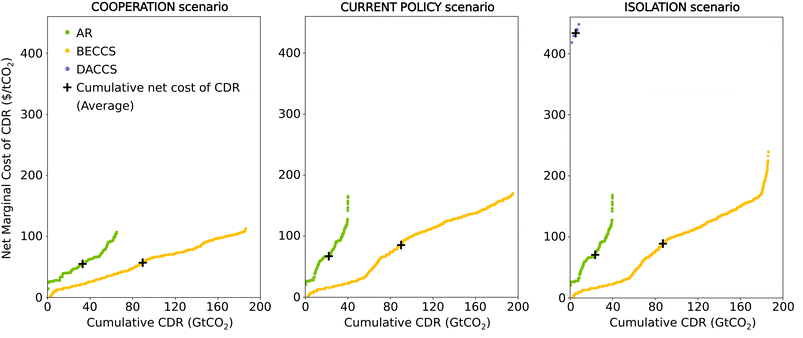
Fig. 4 shows how the marginal net cost of CDR in all regions increases as more CDR is achieved over the century, for all scenarios. China and Brazil provide CDR surplus on behalf of the EU, the USA, and India—85 and 15 GtCO2, respectively—in the COOPERATION scenario. Particularly, in the case of China, this is twice as much as China's individual CDR target by 2100. Assuming that the cheapest CDR options are first deployed to meet individual CDR targets and then the more expensive ones are developed to provide CDR surplus, the MNCs of CDR surplus range between $36–113 per tCO2 in China and $28–90 per tCO2 in Brazil. Using eqn (4), this results in a NEP of $64 per tCO2, paid by the USA, the EU and India to Brazil and China in order to benefit from CDR surplus—52, 32 and 16 GtCO2, respectively—in the COOPERATION scenario.Fig. 5 compares the regional CNCs of CO2 removal by 2100 under the different policy options—in the COOPERATION scenario, including NECs trading, and in the CURRENT POLICY and ISOLATION scenarios. We find that regions benefiting from CDR surplus with international cooperation, yet capable of meeting domestically their individual CDR targets, deliver the Paris Agreements' CDR objectives at least cost in the COOPERATION scenario, owing to NECs trading between regions. Specifically, the CNCs of CDR by 2100 are $66 per tCO2 and $74 per tCO2 in the EU and the USA, respectively, in the COOPERATION scenario (including NECs trading). In the CURRENT POLICY and ISOLATION scenarios, these CNCs increase by 45–105% in the EU and 58% in the USA, respectively. The EU and the USA are thus, here, archetypal “independent NECs beneficiary” regions, as trading NECs result from a cost-optimal national strategy.
However, we observe that regions relying on CDR surplus to meet individual CDR targets deliver the Paris Agreement's CDR objectives at highest cost. This is because CDR objectives are missed with less or no international cooperation, and require therefore additional costs from the purchase of NECs to be delivered with international cooperation. Specifically, the CNC of CDR by 2100 is $57 per tCO2 in India in the COOPERATION scenario (including NECs trading). India is thus an archetypal “dependent NECs beneficiary” region as it relies essentially, here, on NECs trading with “NECs provider” regions, such as Brazil or China, to meet its individual CDR targets.
Nonetheless, we recognise that regions such as India contribute to the delivering of the Paris Agreement in the COOPERATION scenario, particularly by producing and exporting biomass for BECCS's deployment in China (see Fig. 3). This contribution is neglected economically here, but would be expected to be remunerated appropriately in reality, and therefore constitutes an incentive to participate to such international negative emissions trading system.
Finally, we observe that regions providing CDR surplus can deliver the Paris Agreement's CDR objectives at similar cost or benefit from a great cost reduction. For instance, because China contributes mostly to the global CDR surplus provided and based on the assumption made here on a unique NEP, the NEP calculated here is very close to the averaged MNC of all CDR surplus delivered in China (67$ per tCO2 on average). Therefore, China amortizes its additional costs for providing CDR surplus, and its CNC of CDR by 2100 of $24.5 per tCO2 in the COOPERATION scenario (including NECs trading) is similar to the CNCs in the other scenarios. Brazil also provide CDR surplus, but in a lesser extent and less cost-efficiently. Therefore, it benefits from a NEP that is 27% lower than the averaged MNC of all CDR surplus delivered in Brazil ($46 per tCO2 on average), leading therefore to negative net costs, i.e. net revenues, by 2100. The CNC of CDR by 2100 in Brazil of −$9 per tCO2 is 132% lower than in the CURRENT POLICY and ISOLATION scenarios, respectively.
Importantly, acknowledging that the current policy landscape is characterised by international competition, higher NEPs could reduce even more the cost of CDR for “NECs provider” regions, leading to higher negative net revenues, and therefore making the delivering of CDR surplus an economically viable climate mitigation action.
Thus, these results emphasise the value of international cooperation via the deployment of an international policy instrument, such as a negative emissions trading system, and the need for robust institutions to enable monitoring, verification and accreditation of NECs.
5 Does time matter?
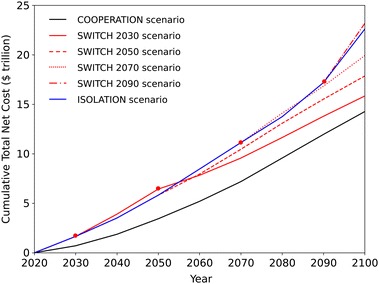
The previous sections established that international cooperation is key in delivering the Paris Agreement's 1.5 °C ambition most cost-efficiently. Because the current international policy landscape on climate change mitigation is closer to an “isolation” policy paradigm than a “cooperation” policy paradigm, we investigate here the implications of developing such international cooperative approach, and we discuss the impacts of delaying its development.Fig. 6 shows how the total cost of CDR deployment at the Paris Agreement's 1.5 °C scale evolves, as the adoption of an international policy is further delayed. The COOPERATION scenario and the ISOLATION scenario, described previously, represent respectively the “earliest” and “latest” scenarios. We find that delaying the adoption of an international cooperation policy always results in a more expensive deployment of CDR options—between 11% and 62% more than the CTNC by 2100 in the COOPERATION scenario, as the delay increases.
Whilst we acknowledge that it is already too late to deploy CDR most cost-efficiently, as suggested in the “earliest” scenario (the COOPERATION scenario) here—it implies the possibility to trade internationally negative emissions as early as in the 2020s—, there is an imperative to develop the necessary geopolitical and economic instruments as soon as possible.
Aspiring to synchronise the establishment and development of such instruments around the world is highly ambitious, but starting from existing ETS at the inter-regional, national, or even regional scales, such as the EU ETS, the UK ETS or the California (USA) ETS, could show the way and set the basics for a future inter-regional, and possibly international instrument for negative emissions trading.
Importantly, the Article 6 of the Paris Agreement established a framework for market-based approaches1 (through Article 6.2 and Article 6.4), within which direct references to negative emissions (i.e., “emission removals”) are made. Negative emissions could thus, for instance, be included directly within domestic ETS and then transferred between domestics ETS, as suggested by Article 6.2, or directly included and traded within an international market, as suggested by Article 6.4. Note that these examples are not intended to be prescriptive, nor exhaustive.
These results highlight thus that, the longer we wait to establish and develop geopolitical and economic instruments for fostering international cooperation in climate change mitigation, particularly in deploying of CDR, the greater the costs will be. Given the decreased likelihood of meeting the Paris Agreement's CDR objectives without international cooperation, as set out here, the greater the associated adaptation costs will be, and thus the overall challenges to be addressed in the near-future.
6 Conclusions
In line with the Paris Agreement, limiting global warming to 1.5 °C will require CDR to be deployed at large-scale between now and the end of the century, as indicated in IAMs scenarios. Beside NDCs, as most UNFCCC Parties have pledged to reach net-zero by mid-century, it is important to understand what CDR pathways might look like, as well as when and where they might be sustainably and affordably deployed. Moreover, as might be anticipated, the climate mitigation policy landscape will significantly impact the spatio-temporal composition and evolution of the CDR pathways deployed. As the Article 6 of the Paris Agreement established a framework for carbon market-based approaches within the context of climate change mitigation, it is all the more crucial to obtain insights on how international policy would impact such deployment.This study has shown that international cooperation in climate change policy is key for deploying the most cost-optimal CDR pathway to deliver the Paris Agreement 1.5 °C ambition. With international cooperation, this CDR pathway is preferably composed of BECCS, mainly (74%) and AR (26%). Given the large scale of CO2 removal over the century, we found that CDR options must be promptly deployed—particularly in the case of AR, owing to the time required for trees to grow. Thus, for sustainability and feasibility safeguards, forward planning and strategic deployment of the different CDR options is crucial to deliver the Paris Agreement's 1.5 °C ambition.
More broadly, the issue of time emerges as a contingent to the discussion on CDR options, such as biochar or EW. Whilst in the case of biochar, the carbon content slowly decays with time—issue of permanence—as a function of a soil conditions and biochar characteristics, there will typically be a delay, in the case of EW, between the time that the minerals are exposed to the atmosphere and when the carbonation reaction is completed—issue of timing. In this case, this delay is a function of soil conditions, such as temperature or pH, or minerals supply chain, such as particle size. These cases are intended to illustrate the importance of prompt action to support the commercial deployment of CDR options, particularly those that enable to prompt removal of CO2 from the atmosphere, such as BECCS and DACCS.
With international cooperation, we found that the spatio-temporal evolution of the CDR pathway, most cost-efficiently deployed, differs greatly from the regional allocation of the Paris Agreement's CDR objectives—based on responsibility for climate change, here used as a proxy for their socio-economically fair distribution. Although this is not the case with less or no international cooperation in climate mitigation policy—the amount of CO2 removal deployed regionally, within each region's borders, must meet their share of the Paris Agreement's CDR objectives—, we found that the resulting CDR pathways are likely to become more challenging and more costly to deploy. This is due to a more difficult access to cost-efficient bio-geophysical CO2 sinks, and therefore the use of more costly alternatives, such as DACCS. Importantly, not only does the likelihood to meet the Paris Agreement's CDR objectives thus decreases, but associated costs also increase by 51–69% relatively to the CDR pathway deployed with international cooperation.
To overcome this challenge—the trade-off between cost-efficiency and equity—, this study has shown that international cooperation could be implemented via an international market for negative emissions trading, in which regions most well-endowed with CDR potentials could generate CDR surplus, i.e. additional CO2 removal, over and above their individual CDR targets, and provide it as a remunerative service to other less well-endowed regions. In such market, CDR surplus would generate NECs, that could be traded between regions, and thus enabling the delivery of the Paris Agreement most cost-efficiently and equitably.
Particularly, we found that such market would allow “dependant NECs beneficiary” regions—regions that could not meet their national CDR targets domestically—to successfully deliver their share of the Paris Agreement's CDR objectives. It would also decrease the financial burden of the Paris Agreement for “independent NECs beneficiary” regions—regions that could meet their national CDR targets domestically—by up to 51–90%. The design of such market—trading mechanisms such as the allocation of NECs between participating regions, or the determination of the price of NECs—is out of the scope of this study, but remains to be investigated further.
Finally, recognising that current policies on climate change mitigation are far from an “international cooperation” paradigm, this study has also argued that the later such market for negative emissions trading would be implemented, the more expensive delivering the Paris Agreement's CDR objectives would be, and subsequently imposing more of the associated financial effort on to future generations. Imminent action towards the establishment and deployment of multi-regional, or possibly international, geopolitical and economic instruments for negative emissions trading, and robust institutions to enable their monitoring, verification and accreditation, will therefore be key in delivering the Paris Agreement's CDR objectives consistent with a global warming of 1.5 °C.
Conflicts of interest
There are no conflicts to declare.Appendix A CDR options in MONET
The MONET framework used in this study has been extended to include AR and DACCS. Their models are described here.A.1 Afforestation/reforestation (AR) model
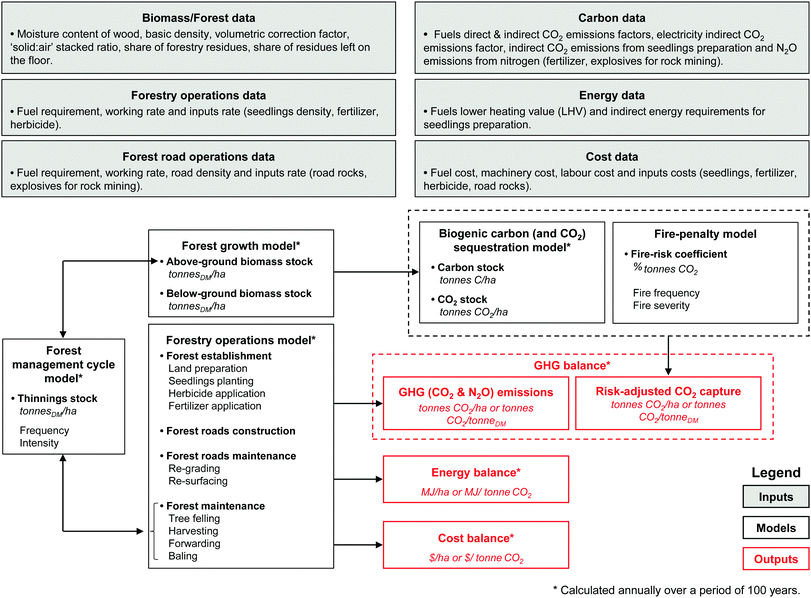
We have developed an explicit spatio-temporal model of AR's whole-system, in which 5 sub-models are integrated: (1) a forest growth model, (2) a forest management cycle model, (3) a biogenic carbon (C) (and CO2) sequestration model and (4) its associated “fire-penalty” model, and (5) a forestry operations model. Specifically, energy, CO2 (and N2O) and cost balances are carried out for each step of the forestry operations model. Spatial resolution of AR's whole-system model is at the climato-ecological level—ecological zones||—within each State/Province in Brazil, China, India and the USA and within each country in the EU (EU-27 & UK). Temporal resolution of AR's whole-system model is double: (1) 10 years (decadal), ranging between 2020–2100, and (2) 1 year (annual), over a default 100 years time-period. The decadal timescale is used for determining the establishment of newly afforested stands, then the annual timescale is used for computing and evaluating AR's whole-system model.
The different interactions between the AR sub-models are outlined in Fig. 7.
Within the forest management cycle model, we assume that forest stands are subject to a non-intensive forest management—with reduced or minimum human intervention. The purpose of this forest management is to maximise and maintain the C (and CO2) sequestration potential of the forest by clearing the forest of old and/or sick trees in order to let younger trees grow, more vigorously and with more space. Although the forest management cycle model consists in determining directly the proportion of above-ground biomass, only, that needs to be thinned for the aforementioned reasons, it also impacts indirectly the proportion of below-ground biomass that remains after.
A.1.2.1 Above-ground biomass (of reference). We define the above-ground biomass stock of reference BAGRef as a sigmoid curve, which is typical in even-aged stands in the absence of forest management (without human intervention), as shown in eqn (5)–(8). Eqn (5)–(8) are written as follows:
 | (5) |
 | (6) |
 | (7) |
 | (8) |
• TRef is the growing period of reference (years),
• BRef is the maximum biomass stock of reference (tDM per ha),
• GRef is the average annual biomass growth of reference (tDM per ha per year),
• x0,Ref is the mid-point of the reference sigmoid curve (years),
• and kRef is the slope coefficient of the reference sigmoid curve (tDM per ha per year).
B AGRef is calculated using the IPCC default values for biomass stock BRef and biomass growth GRef of natural forests,96 as provided/given in (Table 2).
| Ecological zone | Biomass stock (tDM per ha) | Biomass growth (tDM per ha per year) | Growing perioda (years) |
|---|---|---|---|
| a Calculated with the IPCC default values for biomass stock and biomass growth.96 | |||
| Tropical rainforest | 300 | 7.0 | 43 |
| Tropical moist deciduous forest | 180 | 5.0 | 36 |
| Tropical dry forest | 130 | 2.4 | 54 |
| Tropical shrubland | 70 | 1.0 | 70 |
| Tropical mountain systems | 140 | 1.0 | 140 |
| Subtropical humid forest | 220 | 5.0 | 44 |
| Subtropical dry forest | 130 | 2.4 | 54 |
| Subtropical steppe | 70 | 1.0 | 70 |
| Subtropical mountain systems | 140 | 1.0 | 140 |
| Temperate oceanic forest | 180 | 4.4 | 41 |
| Temperate continental forest | 120 | 4.0 | 30 |
| Temperate mountain systems | 100 | 3.0 | 33 |
| Boreal coniferous forest | 50 | 1.0 | 50 |
| Boreal tundra woodland | 15 | 0.4 | 38 |
| Boreal mountain systems | 30 | 1.0 | 30 |
A.1.2.2 Managed above-ground biomass. The managed above-ground biomass stock derives from the above-ground biomass stock of reference, subject to a forest management cycle. Here, we introduce the concept of forest management cycle (FMC) and its associated phases, as developed within the forest management cycle model, and describes how it impacts the forest growth model.
A.1.2.2.1 Forest growth phases. In the context of timber production, a forest growth is usually broken down into 5 phases—the establishment, initial, full-vigour, mature, and old-growth phases. These 5 phases constitute the FMC, in which harvesting (and thinning) operations' characteristics—the frequency and the intensity—are set, and specific to each phase.
Because timber production is evaluated in terms of merchantable biomass volume, forest growth phases are usually determined based on the Mean Annual Increment (MAI)—the average rate of merchantable volume of biomass growth—and its Maximum Mean Annual Increment (MMAI). In the context of (biogenic) CO2 removal, however, both merchantable and non-merchantable biomass stocks are considered, including both above-ground biomass and below-ground biomass stocks, and evaluated in terms of total biomass dry-mass.
The FMC modelled here is developed accordingly to the aforementioned adaptations. We introduce and define the Mean Annual Growth (MAG)—the average rate of dry-mass of above-ground biomass growth—and the Maximum Mean Annual Growth (MMAG), which replace, respectively, the MAI and the MMAI in the determination of the forest growth phases. These forest growth phases are described in Table 3.
| Phase | Description |
|---|---|
| AG: annual growth; MMAG: maximum mean annual growth; and MAG: mean annual growth. | |
| Establishment | Seedlings are planted to create a new stand of trees. In this study, this phase is defined as lasting for the first five years after planting. |
| Initial | Once established, young trees grow from seedlings and their AG increases. This phase is defined here as lasting from age 5 up until (and including) the age of the first thinning, as specified here at 10 years after planting (age 5 + 10 = 15 years). This phase has zero thinning. |
| Full-vigour | During this period, trees grow with the highest rate of AG. This phase is defined as lasting from the age of the first thinning (excluding) until (and including) the time at which the MMAG occurs. Thinning operations occur every 5 years, with an intensity of 10% of the above-ground biomass stock. |
| Mature | During this phase, the rate of AG declines progressively from its maximum value. The phase is defined as lasting from the time at which the MMAG is reached (excluding) up until (and including) the time at which the MAG has dropped to 50% of its maximum value. Thinning operations occur every 10 years with an intensity of 10% of the above-ground biomass stock. |
| Old-growth | During this last phase, the biomass accumulation rate reaches its peak and stabilises—the biomass stock saturates—, and the AG slowly levels off to zero. This phase is defined as lasting indefinitely from the time at which the MAG declines from half of the maximum (excluding). Stands in this phase also shift from an even-aged composition to a diverse structure of ages and sizes. Thinning operations occur every 15 years with an intensity of 10% of the above-ground biomass stock. |
Here, the annual (above-ground) growth (AG) AGAGRef, the MAG MAGAGRef and the MMAG MMAGAGRef are derived from the above-ground biomass stock of reference BAGRef, as shown in eqn (9)–(11) below:
 | (9) |
 | (10) |
 | (11) |
Fig. 8 illustrates a forest AG curve, its associated MAG curve and MMAG point, and its resulting forest growth phases.
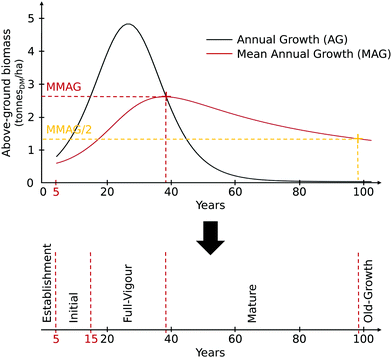 | ||
| Fig. 8 Illustration of a forest annual growth curve (AG), its associated mean annual growth curve (MAG) and maximum mean annual growth point (MMAG), and its resulting forest growth phases. | ||
A.1.2.2.2 Forest management cycle (FMC). In the context of climate mitigation, AR is deployed while prioritising C (and CO2) sequestration potential over timber production. Therefore, the FMC model introduced here is only comprised of thinning operations (no harvesting operations), in order to maximise and maintain the forest C (and CO2) stock. We assume that: (1) the frequency of thinning operations decreases with time—from every 5 years during the full-vigour phase to every 15 years during the old-growth phase—, and (2) the intensity is set as 10% of the above-ground biomass stock at any time.
A schematic of the FMC workflow FMC workflow is described in Fig. 9, where:
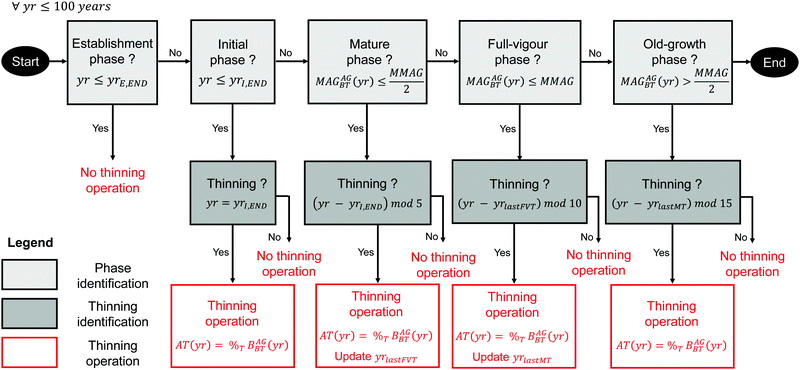 | ||
| Fig. 9 Schematic of the forest management cycle (FMC) workflow used for determining thinning operations' frequency and intensity. | ||
• yrE,END is the last year of the establishment phase (years);
• yrI,END is the last year of the initial phase (years);
• MAGBTha (yr) is the MAG (before thinning) (tDM per ha per year),
• MMAG is the MMAG (tDM per ha per year);
• AT (yr) is the annual thinning stock (tDM per ha per year);
• %T is the thinning share of the above-ground biomass stock (%),%T default value is 10%;
• BAGBT (yr) is the above-ground biomass stock, before thinning (tDM per ha);
• yrlastFVT is the time at which the last thinning during the full-vigour phase occurs (years);
• and yrlastMT is the time at which the last thinning during the mature phase occurs (years), yE,END and yrI,END default values are respectively 5 and 15 years.
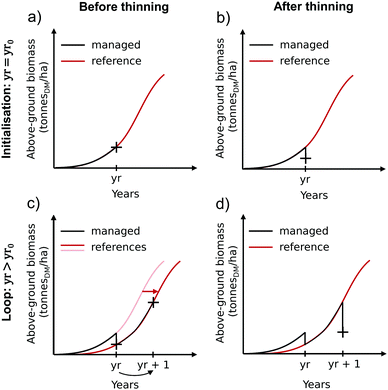
A.1.2.2.3 Managed above-ground biomass. The managed above-ground biomass stock derives from the above-ground biomass stock of reference BAGRef and the annual thinning stock AT. Here, we evaluate the managed above-ground biomass stock in two steps—before thinning BAGBT and after thinning BAGAT, as illustrated in Fig. 10.
 | ||
| Fig. 10 Illustration of the two-step workflow used for evaluating the managed above-ground biomass stock. | ||
Initialisation (yr = yr0): the year of initialisation yr0 is defined as the year of the first thinning. In step (a), BAGBT is equal to BAGRef, as shown in eqn (12) (Fig. 10a):
| BAGBT (yr0) = BAGRef (yr0) | (12) |
Then, in step (b), BAGAT is obtained by subtracting AT to BAGBT, as shown below in eqn (13) and (14) (Fig. 10b):
| BAGAT (yr0) = BAGBT (yr0) − AT (yr0) | (13) |
| AT (yr0) = %T × (BAGBT (yr0)) | (14) |
Loop (∀ yr > yr0): in step (c), the following year, BAGBT (yr0 + 1) has increased by ΔBAG (yr0 + 1), following BAGRef, as shown in eqn (15). ΔBAG (yr0 + 1) is obtained as shown in eqn (16)–(18) (Fig. 10c). Eqn (15)–(18) are written as follows:
| BAGBT (yr0 + 1) = BAGAT (yr0) + ΔBAG (yr0 + 1) | (15) |
| yrRef,1 = BAG−1Ref (BAGBT (yr0)) | (16) |
| yrRef,2 = yrRef,1 + 1 | (17) |
| ΔBAG (yr0 + 1) = BAGRef (yrRef,2) − BAGRef (yrRef,1) | (18) |
Lastly, in step (d) the above-ground biomass stock, after thinning, BAGAT (yr0 + 1) is obtained as previously, in step (b) (Fig. 10d). Steps (c) and (d) are repeated for each yr > yr0. During the years of thinning operations, %T = 10%, %T = 0% otherwise.
A.1.2.3 Below-ground biomass. The below-ground biomass stock can be estimated from the above-ground biomass stock with the use of a “root-to-shoot” ratio. A “root-to-shoot” ratio usually depends on climate, tree species, soil type and declines with stand age and/or productivity. Extreme range values of 0.09–1.16 t rootDM per t shootDM have been reported in the literature, although average range values of 0.20–0.56 t rootDM per t shootDM might be more likely.96
Here, the “root-to-shoot” ratio RRS evolves with the amount of above-ground biomass stock (before thinning) BAGBT. Specifically, RRS is interpolated from the IPCC default values96 provided in Table 4, as shown below in eqn (19).
 | (19) |
| Ecological zone | Above-ground biomass (tDM per ha) | “Root-to-shoot” ratio (−) | |
|---|---|---|---|
| a Used IPCC tropical mountain systems values.96 | |||
| Tropical rainforest | — | 0.37 | |
| Tropical moist deciduous forest | <125 | 0.20 | |
| >125 | 0.24 | ||
| Tropical dry forest | <20 | 0.56 | |
| >20 | 0.28 | ||
| Tropical shrubland | — | 0.40 | |
| Tropical mountain systems | — | 0.27 | |
| Subtropical humid forest | <125 | 0.20 | |
| >125 | 0.24 | ||
| Subtropical dry forest | <20 | 0.56 | |
| >20 | 0.28 | ||
| Subtropical steppe | — | 0.32 | |
| Subtropical mountain systemsa | — | 0.27 | |
| <50 | 0.4 | ||
| Conifers | 50–150 | 0.29 | |
| Temperate oceanic forest, | >150 | 0.20 | |
| Temperate continental forest, | <75 | 0.46 | |
| Temperate mountain systems | Broadleaves | 50–150 | 0.23 |
| >150 | 0.24 | ||
| Boreal coniferous forest, | |||
| Boreal tundra woodland, | <75 | 0.39 | |
| Boreal mountain systems | >75 | 0.24 | |
• RRS (yr) is the “root-to-shoot” ratio (t rootDM per t shootDM),
• and R1 (−) and R2 (−) are the coefficients interpolated from the IPCC** (see Table 5).
| Ecological zone | Forest type | R 1 | R 2 |
|---|---|---|---|
| a Used IPCC “root-to-shoot” value.96 | |||
| Tropical rainforesta | — | 0.37 | — |
| Tropical moist deciduous forest | — | 801 | 0.00029 |
| Tropical dry forest | — | 33 | 0.01113 |
| Tropical shrublanda | — | 0.40 | — |
| Tropical mountain systemsa | — | 0.27 | — |
| Subtropical humid forest | — | 848 | 0.00028 |
| Subtropical dry forest | — | 474 | 0.00126 |
| Subtropical steppe | — | 0.32 | — |
| Subtropical mountain systems | — | 0.27 | — |
| Temperate oceanic forest, | Conifers | 25 | 0.02159 |
| Temperate continental forest, | Broadleaves | 24 | 0.02275 |
| Temperate mountain systems | |||
| Boreal coniferous forest, | |||
| Boreal tundra woodland, | — | 25 | 0.04466 |
| Boreal mountain systems | |||
The below-ground biomass stock BBG derives from the managed above-ground biomass stock (after thinning) BAGAT and the “root-to-shoot” ratio RRS, as shown below in eqn (20):
| BBG = BAGAT (yr) × RRS (yr) ∀ yr | (20) |
A.1.2.4 Total biomass. The total biomass stock BTotal is evaluated as shown below in eqn (21):
| BTotal (yr) = BAGAT (yr) + BBG (yr) ∀ yr | (21) |
A.1.2.1 Biogenic C pools. Growing forests capture CO2 from the atmosphere via photosynthesis. The sequestrated C—the CO2 is sequestrated in the form of C—contained in the above-ground biomass is then partially transferred to the below-ground biomass, dead organic matter and soil. During harvesting or thinning operations, timber and forest residues are extracted from the forest stands, and are considered as “harvested wood products”. All together constitute biogenic C pools.96,97Fig. 11 illustrates the C flow into and out of the AR's whole system, as modelled here, as well as between the 5 aforementioned C pools.
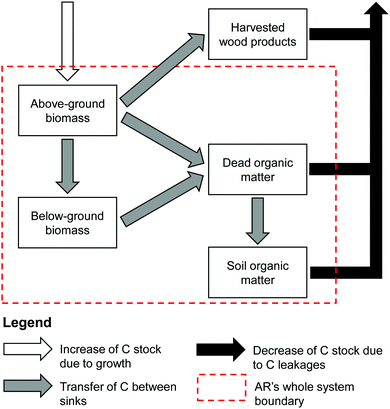 | ||
| Fig. 11 Illustration of the C flow into and out of the AR's whole system, as modelled here, as well as between the 5 main carbon pools: (1) the above-ground biomass, (2) the below-ground biomass, (3) the dead organic matter, (4) the soil organic matter and (5) the harvested wood products pools. Adapted from the 2006 IPCC Guidelines for National Greenhouse Gas Inventories.97 | ||
A.1.2.2 Dead organic matter C pool. Dead organic matter is comprised of litter and dead wood. The dead organic matter C pool is highly variable, site-specific and time-evolving, depending specifically on forest characteristics, forest management and disturbance history, such as fire, hurricanes or pest. For instance, dead organic matter decay rates range from high in warm and moist climates to low in cold and dry climates.97 Litter decay has also been observed to be much faster in deciduous (broadleaves) forests than in evergreen (conifers) forests, owing to humus formation, higher acidity of coniferous litter, and different canopy density resulting in different amount of light and water reaching the forest floor.98
A range value of 15–150 tCO2 per ha, with an average value of 66 tCO2 per ha can be found in the literature.99 Although the C dynamics of the dead organic matter pool are qualitatively well understood, it is currently difficult to obtain complete set of data at the national or regional scales. Therefore, we conservatively simplify the dead organic matter C pool by assuming that all C transferring from biomass to dead organic matter is directly emitted to the atmosphere.
A.1.2.3 Soil C pool. Both organic and inorganic forms of C are found in soil, but the soil organic matter C pool is more largely affected by land-use and management activities, and therefore mostly investigated in the literature. As the dead organic matter C pool, the soil organic matter C pool is highly variable and site-specific. Depending on forest characteristics, management regime and disturbance history, the soil organic matter C pool is also time-evolving, due to differences between C inputs and losses over time.
The organic C content of mineral forest soils has been reported between 20–300 tC per ha in the literature,96,100 but current available data remain largely site- and study-specific, and are therefore still incomplete and highly uncertain at national or regional scales. Although the conversion of non-forested lands to forested lands would be expected to increase the organic C content of newly afforested soils during the first decades, we assume conservatively that the soil organic matter C pool remains constant with AR.
A.1.2.4 Biomass C pool. The above-ground biomass C pool is comprised of all C that is contained in the vegetation above the soil, such as stems, branches, foliage or bark, and the below-ground biomass C pool is comprised of the C contained in the roots. Together, they constitute the biomass C pool, of which the C stock can be estimated from the biomass stock with the use of a carbon content factor Cf. Cf depends on climate, tree specie, such as conifers or broadleaves, and tree characteristics, such as age, size or tree parts. Average values have been reported within the range of 0.43–0.55 tC per tDM.96
Here, the (total) biomass C stock CTotal derives from the total biomass stock BTotal. We use the IPCC default values for carbon content factor Cf96 given in Table 6, as shown below in eqn (22).
| CTotal (yr) = BTotal (yr) × Cf ∀ yr | (22) |
| Climate | Carbon content (tC per tDM) | |
|---|---|---|
| Broadleaves | Conifers | |
| Tropical | 0.47 | 0.47 |
| Subtropical | 0.47 | 0.47 |
| Temperate | 0.48 | 0.51 |
| Boreal | 0.48 | 0.51 |
Then, the total biomass CO2 stock COTotal2 derives from the conversion of C to CO2, based on the ratio of molecular weights (44/12), as shown below in eqn (23):
 | (23) |
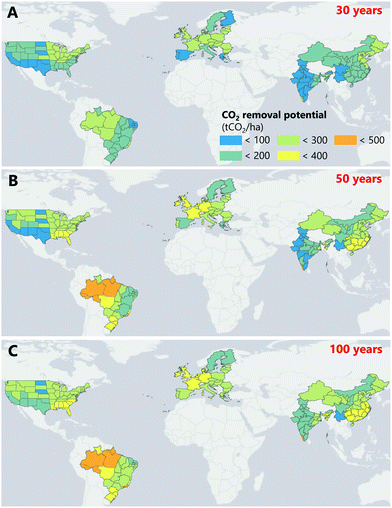
Examples of biomass CO2 stocks show the typical sigmoid pattern of growth in even-aged forest stands and the impact of thinning in Fig. 12. We observe that: (1) not only there is a delay of approximately 10–20 years between the establishment of new forest stands (in the establishment phase) and their effective CO2 sequestration potential (in the full-vigour phase), (2) but these new forest stands also saturates after approximately 40–80 years, which implies that the annual rate of CO2 sequestration is reduced to approximately zero.
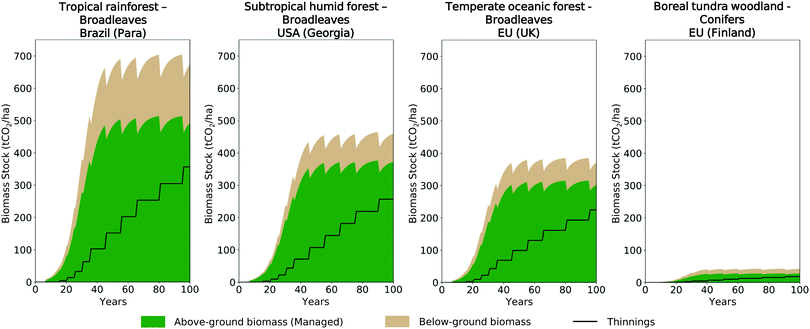 | ||
| Fig. 12 Examples of total (above-ground and below-ground) biomass CO2 stocks and thinnings CO2 stocks for different ecological zones and forest types over a default period of 100 years. | ||
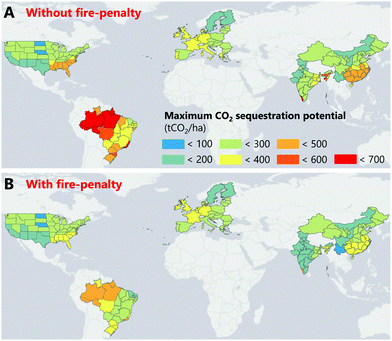
Moreover, because of the higher biomass stock (on a per hectare basis) in warm climates—tropical climates—compared to cold climates—boreal climates—(300 tDM per ha in tropical rainforests compared to 15 tDM per ha in boreal tundra woodlands, as indicated in Table 2), the CO2 sequestration potential of AR is greatest in Brazilian States, such as Para than in Northern EU countries, such as Sweden. By the time forest stands reach maturity (in the old growth-phase), we find that the maximum CO sequestration potential of AR ranges between 40–709 tCO2 per ha.
A.1.2.5 “Harvested wood products” C pool. The duration of the C contained in the “harvested wood products” pool varies with the product itself and its uses.101 As a results, there are currently several different approaches to account for C (and CO2) sequestration in wood products.
Here, all C contained in extracted above-ground biomass (resulting from thinning operations)—both thinnings and forest residues—is included into the “harvested wood products” C pool. Because thinning operations are carried out in the context of climate mitigation rather than timber production, the “harvested wood products” C pool is excluded from the AR's whole-system boundaries. All C contained in this pool can therefore be considered as a “C leakage”. This is equivalent to assume conservatively that all C contained in the “harvested wood products” pool is directly emitted to the atmosphere, as it is the case in the dead organic matter or soil organic matter pools.
Moreover, the below-ground biomass stock, proportional to the above-ground biomass stock, is also affected by thinning operations. Because all C contained in the affected below-ground biomass pool should be transferred to the dead organic matter pool, it is therefore simplified accordingly, and assumed to be directly emitted to the atmosphere.
The thinning C stock CThinning and CO2 stock COThinning2 are estimated with the use of the carbon content factor Cf and the ratio of molecular weights between C and CO2. This is shown in eqn (24) and (25) below:
 | (24) |
 | (25) |
From Fig. 12, we find that CO2 leakages, via the extraction of thinnings and forest residues, are estimated to be 43–70% of the total CO2 sequestrated in forest stands (above-ground and below-ground biomass CO2) over a 100 years time-period. Although such time-period is greater than the averaged human life span, managing intelligently such forest residues supply chain could increase the overall CO2 sequestration potential of AR. Examples include the use of forest residues as a feedstock for BECCS.
A.1.3.1 Permanence of biogenic CO2 sequestration. Forests are vulnerable to natural disturbances, such as drought, hurricanes, forest fires and pests, or to human-induced reversals, such as active deforestation. Consequently, the permanence of biogenic CO2 sequestration is less reliable than the one of geological CO2 sequestration, such as in the cases of BECCS or DACCS.
Because the impact of natural disturbances on forest stands can be catastrophic, both in terms of biodiversity or financial losses—specifically in the context of timber production—, how the risk of natural disturbances should be anticipated and integrated in forest management has been increasingly investigated. However, the focus has been predominantly set on maximising timber productivity and economic value, with or without carbon sequestration benefits, such as carbon price or carbon tax, and scarcely on minimising biomass and resulting CO2 sequestration losses.102–104
A few risk-accounting methods have been introduced, specifically for hurricanes or wildfires,105–108 although most of the literature focuses on wildfires. In spite of the increasing widespread use of remote-sensing—the use of satellites to search for and collect geo-spatial data—, these risk-accounting methods remains site-, region-, or at most, country-specific. For instance, the Landscape Fire and Resource Management Planning Tools (LandFire) Program in the USA has been providing national geo-spatial datasets (partially or completely based on remote-sensing) on vegetation distribution, fire regime and other fuel characteristics.109 The NASA Land Use and Land Cover Program has also been releasing the MODIS Active Fire Products and Burned Area Products, ones of the most complete datasets at the global scale, but insufficient for the evaluation of wildfires' risk.110
Here, we model the risk of wildfires in the form of a penalty coefficient in order to evaluate the impact of such wildfires on AR's CO2 sequestration potential.
A.1.3.1 Wildfire-penalty coefficient. We adapt the risk-accounting methodology developed in Hurteau et al.106 to define a wildfire-penalty coefficient Rfire, characterised by ecological zones, and therefore applicable at the global scale. Rfire is built upon wildfires' severity—the potential biomass loss given a fire occurrence—and periodicity—the probability of a fire event occurring during a specified time period, as shown in eqn (26). As in Hurteau et al.,106 wildfires' severity and periodicity are respectively quantified by the mean fire return interval (mFRI) mFRI—ranging from 0 years (very frequent) to 1000 years (very rare)—and the vegetation departure index (VDep) VDep—ranging from 0% (zero potential biomass loss) to 100% (complete potential biomass loss). Eqn (26) is written as follows:
 | (26) |
• Rfire is the fire-penalty (−),
• mFRI is the mean fire return interval (years),
• VDep is the vegetation departure index (−),
• and P is the permanence (years), which represents the length of time that biogenic carbon must be sequestered to be accounted as permanent here. P default value is 100 years.
mFRI and VDep are 2 geo-spatial datasets initially developed by the LandFire Program, and cover the US territory with a 30 m geographic resolution.109 Here, the mFRI and VDep datasets were aggregated at the ecological scale.†† First, the existing vegetation type (EVT) dataset, also developed by the LANDFIRE project,109 was used to restrict the mFRI and the VDep datasets to forest vegetation types. Then, the global ecological zone (GEZ) dataset, developed by the FAO,94 was used to aggregate the restricted mFRI and VDep datasets with ecological zones and finally extrapolate the aggregated and restricted mFRI and VDep datasets at the global scale. Because all ecological zones are not present on the US territory, values from “Tropical moist deciduous forest” were used for the “Tropical rainforest” ecological zone (closest ecological zone), and default values of 1000 years and 0 were assigned to mFRI and VDep, respectively, in boreal ecological zones (extremely low risk of wildfire in such cold and humid climate). Resulting values for mFRI, VDep and Rfire are provided in Table 7.
| Ecological zone | mFRI (years) | VDep (%) | Wildfire-penalty coefficient (%) |
|---|---|---|---|
| a Used tropical moist deciduous values for mFRI and VDep. b Used default values of 1000 and 0 for mFRI and VDep, respectively. | |||
| Tropical rainforesta | |||
| Tropical moist deciduous forest | |||
| Tropical dry foresta | 46 | 65 | 65 |
| Tropical shrublanda | |||
| Tropical mountain systemsa | |||
| Subtropical humid forest | 50 | 57 | 72 |
| Subtropical dry forest | 24 | 30 | 77 |
| Subtropical steppe | 52 | 47 | 77 |
| Subtropical mountain systems | 40 | 43 | 74 |
| Temperate oceanic forest | 424 | 61 | 100 |
| Temperate continental forest | 165 | 61 | 100 |
| Temperate mountain systems | 158 | 51 | 100 |
| Boreal coniferous forestb | |||
| Boreal tundra woodlandb | 1000 | 0 | 0 |
| Boreal mountain systemsb | |||
A.1.3.2 CO2 sequestration potential. AR's CO2 sequestration potential COSeq2 is evaluated as shown below in eqn (27):
| COSeq2 (yr) = COTotal2 (yr) × (1 − Rfire) ∀ yr | (27) |
The maximal CO2 sequestration potential of AR in Brazil, China, the EU, India and the USA, at the regional scale is illustrated in Fig. 13. We find that AR's CO2 sequestration potential is not affected by wildfires in boreal and temperate climates, whereas it decreases by 23–29% in subtropical climates, and up to 35% in tropical climates.
A.1.4.1 Site establishment. The forest is established by land preparation and planting of new seedlings. For land preparation, mounding is carried out by an excavator,111,112,114 and herbicide and fertiliser are applied using a tractor.111,112 Tree seedlings are prepared in nurseries,115 then planted by hand.111,112,116
A.1.4.2 Forest road construction & maintenance. The access and the maintenance of forests requires forest roads, that are classified according to the frequency of their usage. Specifically, type A roads are the principal routes, used very frequently and type B road are secondary routes, only used during specific activities, such as thinning operations. Here, we assume that forest roads construction (for types A and B roads) involves spreading blasted rock on top of the soil, and then covering with a layer of finer, crushed aggregate.111,112,114 Forest roads maintenance depends on the road type. Type A roads maintenance involves the re-grading of the road every year, or the re-surfacing—the re-application of the top layer of aggregate—before thinning operations, whereas type B roads maintenance only involves the re-grading and rolling of the remaining aggregate layer before thinning operations.111,112,114 Mining and crushing of road rock and aggregate are also included,111,114 as contributing to forest road construction & maintenance's indirect GHG emissions.
A.1.4.3 Annual forestry (thinning) operations. As part of the FMC, a selection of trees is thinned using a cut-to-length logging system. This involves the felling and the extraction of trees from the forest site using a combination of harvesters and forwarders.111,112,117,118 Here, we assume that this selection of thinned forest biomass is composed of 80% thinnings (whole tree thinnings and roundwood) and 20% forest residues, such as branches, foliage or bark.113 Early whole tree thinnings involves tree felling by harvesters, followed by whole tree removal from the site to the roadside by forwarders. Harvesting roundwood requires the use of harvesters that cut and top the trees, leaving branches and other forest residues on the forest floor. The roundwood is then transported to the roadside by forwarders. Lastly, 35% of the residues are left in the forest for ecological reasons113—forest residues are left on the forest floor to maintain the nutrient and soil carbon balance—, and the remainder is collected and extracted by forwarders that compress the forest residues into bundles. All thinned and extracted forest biomass are then stored at the roadside to allow for natural drying from 50% to 30% moisture content.111,113
Dry matter losses are also included at every step of the forestry operations—tree felling, harvesting, forwarding and storage—resulting in a total loss percentage of 11.6%. This value is consistent with the literature.96,113 As a reference, the IPCC defaults values for harvest loss are 10% for broadleaves and 8% for conifers.96
• direct energy (energy density) of the combustion of fuels119 or the consumption of electricity;
• indirect energy (embodied energy) due to the production of these fuels120 and the generation of electricity;121
• and indirect energy (embodied energy) due to the production of materials, such as agrochemicals,122–125 seedlings122,123,125,126 or road rock and aggregate.111,114,119
• direct CO2 emissions from the combustion of fuels,119
• indirect CO2 emissions due to the production of these fuels119 and the generation of electricity;93,119
• indirect CO2 emissions due to the production of materials, such as agrochemicals,122–125 seedlings122,123,125 or road rock and aggregate.111,114,119
• direct N2O emissions127–130 arising from the application of nitrogen-based fertiliser during the forest establishment and from the use of ammonium nitrate-based explosive for road rocks extraction;
• and direct and indirect CO2 emissions arising from land-use change (LUC).
For safeguards of sustainability and biodiversity, we assume that AR's deployment is restricted to lands with reforestation potential (LRP), as identified in Griscom et al.76 (see Appendix C). Although the climato-ecological characteristics of LRP are well detailed, there are little information on the current use of LRP. Specifically, because LRP are characterised by low tree cover (and therefore low biomass density) and current croplands are excluded from LRP, we assume that: (1) the quality of LRP is similar to the one of marginal agricultural lands (MAL), and therefore the direct LUC is equal to 25 kgCO2 per ha; and (2) no human activities are displaced by AR's deployment on LRP, and therefore the indirect LUC is null. The methodology used for the accounting of N2O emissions and LUC (direct & indirect) emissions has been presented previously62,63 and will not be repeated here.
Overall, AR's CO2 balance—AR's CDR potential—CORemoval2 is the difference between AR's CO2 sequestration potential (discounted by a “fire-penalty” coefficient) COSeq2 and AR's CO2 emissions COEmissions2, as shown in eqn (28):
| CORemoval2 (yr) = COSeq2 (yr) − COEmissions2 (yr) ∀ yr | (28) |
Fig. 14 illustrates AR's CDR potential over time-periods of 30, 50 and 100 years in Brazil, China, the EU, India and the USA. AR's CDR potential slowly increases during the first 30 years, reaching up between 200–250 GtCO2 in Central EU, North-East Brazil, North-West USA and North-West China. After only 50 years, AR is deployed up to its maximum CDR potential in most regions of the world, reaching up to 400–430 GtCO2 in North-East Brazil or South-West China. After a 100 years time-period, AR's maximum CDR potential is reached everywhere across the world, greatest in Brazil owing to warm and humid climates, and lowest in Northern EU countries owing to boreal climates, or in India owing to warm, yet dry climates. Moreover, we find that AR's total CO2 emissions are negligible compared to AR's CDR sequestration potential over a 100 years time-period, ranging between 1.2–4.4 tCO2 per ha. Overall, although AR: (1) needs at least 10–20 years before effectively removing CO2 from the atmosphere, and (2) saturates after 40–80 years, AR is found to be significantly efficient at removing CO2 from the atmosphere, as much as 88.8–95.8% over 30 years, and 97.5–99.6% over 100 years.
• the cost of energy, such as fuels131 and electricity;132–136
• the cost of machinery, such as trucks or excavator for land preparation, harvester and forwarder for harvesting operations, or other machinery for road construction and maintenance;137,138
• the cost of labour, such as ground worker, forest worker, road operator, etc.;139
• and the cost of feedstocks and materials, such as agrochemicals,140,141 seedlings142 or road rocks.143
• and the cost of land.
In this study, costs are expressed in 2018 US $, but disaggregated at the national level. When available in another currency or another year, costs of energy, machinery and feedstocks are converted with the use of exchange rate and inflation factors respectively.144,145 When only available for one country (often the USA), costs of energy, machinery and feedstocks are converted with the use of purchasing power parity (PPP),146 and costs of labour are converted proportionally to national hourly compensation costs from the Conference Board, as described previously.55,62
Because AR's deployment is restricted to LRP, of which the climato-ecological characteristics and the current usage can be assimilated to the ones of MAL (low quality of land, unused for crop production), we assume, similarly to MAL, that the cost of LRP is null.
AR's initial investment, due to the establishment of the forest and the construction of forest roads, is levelised with the use of a capital recovery factor (CRF), itself calculated with an interest rate of 8% and a financial lifetime of 30 years.
Fig. 15 illustrates AR's CO2 removal costs over a 100 years time-period in Brazil, China, the EU, India and the USA. Because of different economies across the world and different AR's CDR potentials within these economies, AR's CO2 removal cost varies at the global—between the 5 regions considered in MONET—and national scale—among each of the 5 regions considered in MONET. Overall, CO2 removal via AR is the most expensive in the USA, ranging between $77–395 per tCO2 whereas it is the cheapest in India, ranging between $22–139 per tCO2, and in Brazil, ranging between $44–242 per tCO2. Finally, AR's CO2 removal costs between $52–247 per tCO2 in the EU, and between $59–265 per tCO2 in China.
A.2 Bioenergy and carbon capture and storage (BECCS) model
Combining bioenergy production with CCS can provide net negative emissions as the CO2 captured by photosynthesizing biomass growth is geologically sequestered rather than released to the atmosphere during its conversion into energy. BECCS can involve various biomass feedstocks, such as trees, crops, algae, organic wastes, and biomass conversion pathways, such as power, liquid fuel, hydrogen. Usually, BECCS simply refers to: (1) the integration of growing trees and/or crops that extract CO2 from the atmosphere, (2) their combustion in power plants to produce electricity, and the application of CCS via CO2 capture at the power plant and (3) the transport and injection of CO2 into geological formations. This study focuses on biomass—woody and herbaceous crops, agricultural residues and forest residues—combustion for power.BECCS's CDR potential has been shown to highly depend on biomass supply chain management and LUC,63 and to not always ultimately result into negative emissions. Biomass supply chain—LUC, biomass cultivation, processing and transport to the power plant—requires energy and emits GHG, and must therefore be considered in the evaluation of BECCS's CO2 balance, in order to ensure BECCS's carbon negativity. The power plant technology assumed in this study is a 500 MW dedicated pulverised biomass thermal power plant, combined with post-combustion amine-based carbon capture with a CCS efficiency of 90%. The CO2 capture capacity of the BECCS plant is approximately 4.2 MtCO2 per year.63 The BECCS plant is assumed to be in the vicinity of geological formations, with a distance of 100 km for CO2 transport. Finally, the production of low-carbon electricity by BECCS is assumed to generate revenues that can, in some configurations, be greater than BECCS total cost. These revenues from electricity sales are received at the region-specific wholesale price of electricity. BECCS's whole-system model has been developed and presented in previous work,55,61–63 and will not be repeated here.
A.3 Direct air CO2 capture and storage (DACCS) model
With DACCS, CO2 is directly captured from the atmosphere using a range of sorbents or solvents, and then transported and injected into geological formations. Because of the low atmospheric concentration of CO2 (approximately 412 ppm147), DACCS is very energy intensive—DACCS's total energy requirements, including the separation of CO2 from the air and the compression of CO2, have been reported 4 times greater than conventional CCS's total energy requirements.148 Because of this, and the low maturity of the technology, DACCS's cost is still uncertain and expensive, ranging between $30–1000 per tCO2.45,149Two archetypal DAC plants are currently being developed at the demonstration-scale. The first one, developed by Carbon Engineering Ltd, captures CO2 directly from the air with a potassium hydroxide (KOH) sorbent in the air contactor and stores it as a carbonate (K2CO3).26,27 The sorbent is then regenerated by reacting K2CO3 with a calcium hydroxide (Ca(OH)2) in the pellet reactor. Ca(OH)2 is obtained in the slacker by hydrating calcium oxide (CaO), which itself is produced by calcining calcium carbonate (CaCO3) in a kiln (also called calciner), at 900 °C. The high-temperature heat required by the regeneration process is currently supplied by the combustion of natural gas, of which the CO2 emissions are also captured in a CO2 absorber. The second one, developed by Climeworks, captures CO2 with an amine-functionalised sorbent on a filter.150,151 Once the filter is saturated, it is heated to 100 °C, and the CO2 is released and collected. The low-temperature heat of the regeneration process can be provided by the electricity grid. For both DAC plant archetypes, fans, liquid pumping and CO2 compression also requires power from the electricity grid. Both archetypes—Carbon Engineering (DACCS-CE) and Climeworks (DACCS-CW)—have been implemented in this study.
Similarly to BECCS plants, we assume that DAC plants are built and operating in the vicinity of geological formations that are suitable for CO2 storage, at a distance of 100 km.
In this study, we have developed an explicit spatio-temporal model of DACCS whole-system model, integrating a DAC plant and CO2 T&S. For each step of the model, energy, CO2 and cost balances are carried out. Spatial resolution of DACCS's whole-system model is at the State/Province in Brazil, China, India and the USA and at the country in the EU (EU-27 & UK). Temporal resolution is 10 years (decadal), ranging between 2020–2100.
• direct energy requirements (energy density) from the combustion of natural gas in the case of Carbon Engineering archetype or from the consumption of electricity in both archetypes' cases;27,152
• and indirect energy requirements (embodied energy) from the production of natural gas120 in the case of DACCS-CE archetype, the production of electricity,121 and the T&S of CO2.153
• direct CO2 emissions from the combustion of natural gas119 in the case of DACCS-CE archetype,
• and indirect CO2 emissions from the production of natural gas154,155 in the case of DACCS-CE archetype, the production of electricity,93,119 and the T&S of CO2.156
Fig. 16 shows the impact of the energy sector (specifically the power sector) decarbonisation on the DACCS's CDR efficiency for both DACCS archetypes (DACCS-CE and DACCS-CW). Considering the current—2020—carbon intensity of national (and sub-national) electricity grids, DACCS-CE archetype's efficiency ranges between 44–88%, whereas the one of DACCS-CW archetype ranges between −79 to 92%. Specifically, DACCS-CE archetype not only fails at removing CO2 from the atmosphere in China, in India, and in a few EU countries and US States, but it even emits more CO2 into the atmosphere. However, as the power sector follows a complete decarbonisation by 2050, both archetypes's CDR efficiencies increase, up to 86–88% in DACCS-CE's case and 94% in DACCS-CW's case. The carbon intensity of DACCS's energy plays therefore a significant and determinant role in DACCS's CDR efficiency. Crucially, the decarbonisation of the power sector appears like a necessary prerequisite for the deployment of DACCS.
• the cost of energy such as electricity132–136 and natural gas;132,135,157–159
• the CAPEX and OPEX (including labour, operating and maintenance costs) of the DAC plant,27,152
• the cost of CO2 T&S.160
For DACCS-CE archetype, DACCS's CO2 capture cost has been broken down into energy (natural gas and electricity), CAPEX and OPEX in Keith et al.27 Specifically, after excluding the energy cost, the levelised CAPEX and the OPEX account respectively for 69% and 31%, in all configurations.‡‡ In this study, we conservatively assume that DACCS's CO2 capture cost, including the energy cost, is twice more than suggested around $235 per tCO2, while maintaining the ratio of CAPEX/OPEX as it is. Assuming an interest rate of 8% and a financial lifetime of 30 years, this results into a (non-levelised) CAPEX of $1600 per tCO2 captured, and an OPEX of $65 per tCO2 per year captured. For DACCS-CW archetype, DACCS's CO2 capture cost has been reported around $600 per tCO2.161 Conversely to DACCS-CE archetype, DACCS-CW archetype is a modular process, for which the DAC plant size is smaller (lower CAPEX), and is operated in a two time-steps, which requires more maintenance (higher OPEX). Therefore, we assume that, after excluding the energy (electricity only) cost,§§ the (levelised) CAPEX and the OPEX account both for 50% of the remaining cost of CO2 capture. With an interest rate of 8% and a financial lifetime of 30 years, this results into a (non-levelised) CAPEX of $1815 per tCO2 captured, and an OPEX of $160 per tCO2 per year captured. Finally, the methodology for evaluating the cost of CO2 T&S has already been presented previous and will not be repeated here.
Appendix B equations of the MONET optimisation model
The MONET framework used in this study has been extended to include AR and DACCS. The initial mathematical formulation of the MONET optimisation model, described previously,55,62 has been adapted accordingly. This is described here.B.1 Overview
The MONET framework is a linear optimisation problem (LP), that determines the optimal co-deployment of CDR pathways—AR, BECCS and DACCS—in line with the Paris Agreement's objectives of 1.5 °C, subject to the constraints below:• CDR targets constraints: cumulative CDR targets are specified throughout the whole planning horizon, according to the Paris Agreement's 1.5 °C objectives. This is discussed in Section 2.1.1.
• Expansion of CDR solutions constraints: operation conditions, specific to each CDR pathway, and including lifetime, maximum built rates for BECCS and DACCS and maximum expansion rate for AR, are specified.
• Sustainability & land constraints: region-specific bio-geophysical limits—land and biomass supply availabilities, water stress—are also specified.
• Geological CO2 storage constraints: BECCS and DACCS plants are deployed in the vicinity of geological CO2 storage—a distance of 100 km—with sufficient CO2 storage capacity for the lifetime of the technology. CO2 is assumed to be safely and permanently stored. Maximum CO2 storage capacity for BECCS and DACCS are specified, owing to region-specific limits.
In this study, the MONET framework minimises the total net cost of the co-deployment of CDR pathways—total capital costs (CAPEX) and operating costs (OPEX) minus total revenues—. It assumes perfect foresight over a 2020–2100 planning horizon, with a 10 years time-step.
B.2 Main equations
Here, we describe in details the main equations of the MONET optimisation model, including AR, BECCS and DACCS.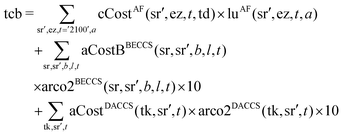 | (29) |
• parameter  is the cumulative cost per hectare of AR in sub-region sr′ and ecological zone ez, in year t, and deployed from year a ($ per ha);
• parameter  is the annual cost balance per tonne of CO2 removed of BECCS with biomass b, cultivated on land type l in sub-region sr, and transported to sub-region sr′ in year t ($ per tCO2 removed);
• parameter  is the annual cost per tonne of CO2 removed of DACCS with technology tk, in sub-region sr′ in year t ($ per tCO2 removed);
• decision variable  is the land use of AR in sub-region sr′ and ecological zone ez, in year t, and deployed from year a (ha);
• decision variable  is the annual CO2 removed via BECCS with biomass b, cultivated on land type l in sub-region sr, and transported to sub-region sr′ in year t (tCO2 removed per year);
• and decision variable  is the annual CO2 removed via DACCS with technology tk, in sub-region sr′ in year t (tCO2 removed per year).
∀ t ≤ 2100,
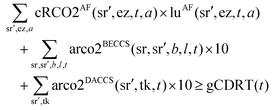 | (30) |
∀ t = 2100,
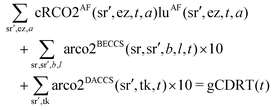 | (31) |
 describes the cumulative CO2 removed via AR, in sub-region sr′ and ecological zone ez, in year t, and deployed from year a (tCO2 removed per ha).
In the CURRENT POLICY and ISOLATION scenarios, national cumulative CO2 removed via AR, BECCS and DACCS must be greater than or equal to the national CDR targets CDRT(c,t) in region c and at time t (tCO2 removed). This is written below:
∀ c,![[thin space (1/6-em)]](https://www.rsc.org/images/entities/char_2009.gif) t ≥ 2100,
t ≥ 2100,
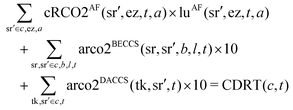 | (32) |
∀ c,![[thin space (1/6-em)]](https://www.rsc.org/images/entities/char_2009.gif) t = 2100,
t = 2100,
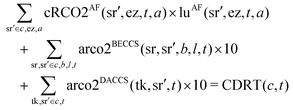 | (33) |
In the scenarios discussed in Section 5, in which CDR targets “switch” from national to global from 2030, 2050, 2070 and 2090, eqn (32) and (33) are used before the “switch”, and eqn (30) and (31) are used after.
∀ sr′,t,
 | (34) |
• parameter CO2Smax(sr′) is the theoretical CO2 storage capacity of geological formations in sub-region sr′;
• parameter aSCO2BECCS(sr,sr′,b,l,t) is the annual CO2 stored per tonne of CO2 removed via BECCS with biomass b, cultivated on land type l in sub-region sr, and transported to sub-region sr′ in year t (tCO2 stored per tCO2 removed per year);
• and parameter aSCO2DACCS(tk,sr′,t) is the annual CO2 stored per tonne of CO2 removed via DACCS with technology tk, in sub-region sr in year t (tCO2 stored per tCO2 removed per year).
∀ sr′,ez,t,
 | (35) |
∀ sr,![[thin space (1/6-em)]](https://www.rsc.org/images/entities/char_2009.gif) t,
t,![[thin space (1/6-em)]](https://www.rsc.org/images/entities/char_2009.gif) b ≠ wheat or forest residues,
b ≠ wheat or forest residues,
 | (36) |
∀ sr,t,b ≠ wheat or forest residues,
 | (37) |
∀ sr′, t, b ≠ wheat,
 | (38) |
• parameter LRPowr3(sr′,ez) is the maximum available LRP (excluding overlaping LRP with MAL), restricted to low OWR (<3), in sub-region sr′ and ecological zone ez;
• parameter MALOWR3 (sr) is the maximum available MAL (excluding overlapping MAL with LRP), restricted to low OWR (<3), in sub-region sr′ and ecological zone ez;
• parameter LRP & MALowr3(sr′,ez) is the maximum available LRP and MAL (overlapping), restricted to low OWR (<3), in sub-region sr′ and ecological zone ez;
• parameter LHW (sr) is the maximum available LHW in sub-region sr;
• and variable luscBECCS(sr,sr′,b,l,t) is the land use of BECCS biomass supply chain with biomass b, cultivated on land type l in sub-region sr, and transported to sub-region sr′ in year t (ha);
 | (39) |
Moreove, eqn (40) ensures that once AR is deployed, it is maintained throughout the whole planning horizon.
 | (40) |
∀ sr′, t:
 | (41) |
 | (42) |
 | (43) |
 | (44) |
 is the number of BECCS plants per tonne of CO2 removed, with biomass b, cultivated on land type l in sub-region sr, and transported to sub-region sr′ in year t (unit per tCO2 removed).
Eqn (45) computes the CO2 removal resulting from all operating BECCS plants:
∀ sr′, t:
 | (45) |
Finally, the deployment of new-built BECCS plants of 500 MW per year capacity CAPBECCS is bounded by a maximal built rate BRBECCS of 2 GW per sub-region, averaged over a 10 years time-period. This is shown below in eqn (46):
 | (46) |
 is the total numbers of DAC plants of technology tk, in sub-region sr and in year t, and
  ,
,  and
and  the number respective of 1G, 2G and 3G DAC plants. This is shown below in eqn (47)–(50):
∀ tk,sr′,t:
 | (47) |
 | (48) |
 | (49) |
 | (50) |
 is the annual CO2 captured via DACCS in sub-region sr, with technology tk, in year t (tCO2 captured per tCO2 removed per year).
Eqn (51) computes the CO2 removal resulting from all operating DAC plants:
∀ tk,sr′,t:
 | (51) |
Finally, the deployment of new-built DAC plants of CO2 capture capacity CAPDACCS is bounded by a maximal built rate BRDACCS of 2 MtCO2 per sub-region, averaged over 10 years time-period. This is shown in eqn (52):
 | (52) |
B.3 Additional equations
The scenarios discussed in Section 5 are solved in the optimisation using results from the ISOLATION scenario—more specifically AR, BECCS and DACCS decisions variables' outputs—as an additional constraint to AR, BECCS and DACCS co-deployments:∀ sr′,ez,t < switch, a:
 | (53) |
∀ sr,sr′,b,l,t < switch:
 | (54) |
∀ tk,sr′,t < switch:
 | (55) |
• parameter  is the land use of AR in sub-region sr′ and ecological zone ez, in year t, and deployed from year a, as projected in the ISOLATION scenario (ha),
• parameter  is the annual CO2 removed via BECCS with biomass b, cultivated on land type l in sub-region sr, and transported to sub-region sr′ in year t, as projected in the ISOLATION scenario (tCO2 removed per year),
• parameter  is the annual CO2 removed via DACCS with technology tk, in sub-region sr′ in year t, as projected in the ISOLATION scenario (tCO2 removed per year),
• switch is the year at which the model ‘switches’ from an ISOLATION to a COOPERATION policy paradigm.
Appendix C datasets of MONET
In this study, AR, BECCS and DACCS deployments are constrained by bio-geophysical limits. Here, we describes in details the methodologies applied to obtain estimates of CO2 storage capacity at the sub-regional level, that limit BECCS and DACCS deployment, and estimates of land with reforestation potential at the sub-regional level, that limit AR deployment. The methodologies used to obtain estimates of MAL at the sub-regional level, and exclude lands with higher OWR, that limit BECCS deployment, have been introduced previously61,62 and will not be repeated here.C.1 CO2 storage
Particularly, CO2 storage capacity can be estimated and classified into theoretical, effective, practical and source-sink matched, as defined by the “Geologic CO2 storage Resource Capacity Pyramid” classification.166 This concept estimates CO2 storage capacity based on physical-geological and engineering/technical limits, legal, regulatory and economic barriers and the presence of matching CO2 sources. CO2 storage capacity can also be classified into geological classes: deep saline aquifers, depleted oil and gas reservoirs, and less frequently unmineable coal seams.166 Deep saline aquifers have been generally acknowledged as containing the vast majority of geological CO2 storage capacity.164 Globally, when conducted, the capacity and reliability of regional storage assessments vary significantly and may lead to regional storage constraints.
| Country | This study | GCCSI162 | ||||||
|---|---|---|---|---|---|---|---|---|
| Low | Medium | High | (GtCO2) | (%) | ||||
| (GtCO2) | Data sources | (GtCO2) | Data sources | (GtCO2) | Data sources | |||
| Brazil | 0.95 | 87 | 0.95 | 87 | 641 | 87, 88 | 2000 | 56–75 |
| China | 54 | 167–177 | 3106 | 81, 82 | 3106 | 81, 82 | 2000 | 75–100 |
| EU | 180 | 83–85 | 180 | 83–85 | 180 | 83–85 | 300 | 75–100 |
| Of which UK | 78 | 86 | 78 | 86 | 78 | 86 | 80 | 75–100 |
| India | 0 | — | 0 | — | 53 | 89 | 50 | 56–75 |
| USA | 2565 | 80 | 8533 | 80 | 21![[thin space (1/6-em)]](https://www.rsc.org/images/entities/char_2009.gif) 865 865 |
80 | 8150 | 75–100 |
Whilst our estimates for India are in accordance with the Global CCS Institute (GCCSI), our Brazilian estimate is 3 times lower. This significant difference is probably due to our conservative choice of the default CO2 storage factor when estimating the CO2 storage of Brazil. A sensitivity analysis on this factor indicates that a less conservative, average value of 3520 Gt of CO2 could be obtained. Nevertheless, due to the high incertitude concerning CO2 storage capacity, we use the conservative value.
| VCO2 = A × ACF × SF | (56) |
• VCO2 is the CO2 storage capacity (MtCO2)
• A is the basin area (km2)
• ACF is the aquifer coverage factor (−)
• and SF is the storage factor (MtCO2 per km2)
Conservatively, it is assumed that a single aquifer is present in each basin, covers approximately half of the basin area, and is well sealed. Resulting default values of the ACF and the SF are respectively 50% and 0.2 MtCO2 per km2.
In this study, the high CO2 storage capacity estimate is equal to both the basins’ aquifers and the oil field CO2 storage capacities, and the medium and low estimates are equal to the oil field CO2 storage capacity only. It is worth mentioning that when using a value of 2 MtCO2 per km2 for the SF (i.e., default value for unconfined aquifers), the CO2 storage capacity of Brazil increases to 6400 Gt CO2, resulting in a less conservative estimate of 3520 Gt of CO2.
Numerous region-, basin-, and formation-scale studies have also been performed. In particular, the Near Zero Emissions from Coal (NZEC) project examined CO2 storage projects on the Sangliao and the Subei Basin.167–169 The CO2 storage capacity of the Songliao basin's aquifer has been evaluated at 593 Mt CO2, and the effective capacities of the Daquig and Jilin Oilfields’ at 71.5 Mt and 692 Mt respectively. Similarly, the Cooperation Action Carbon Capture and Storage China-EU (COACH) project investigated options in the Bohai Basin.170–173 The effective CO2 storage capacity of the Dagang ang the Shengli oilfields have been estimated at 22 and 472 Mt CO2 respectively. The largest capacity has been identified in the aquifers of the Huimin sub-basin within the Jiyang Depression, with an upper bound estimate of 22 Gt, and latest interest on the Guanyao Formation within the Huimin sub-basin has resulted in the estimation of 700 Mt of CO2. Significant uncertainty around these aquifers’ estimates must be acknowledged due to the limited availability of geological data. Several studies have been also investigated the Ordos basin CO2 storage potential. An initial upper estimate of 287 Gt CO2 was suggested for the aquifer CO2 storage capacity by Jiao et al.,174 later re-evaluated around 25 Gt CO2 by Ellet et al.175 In the work of Wang et Carr,176 oil & gas fields CO2 storage capacity were evaluated at 38 Mt and 3.2 Gt respectively. In the recent work of Zhou et al.,177 up to 60 oil fields were considered, resulting in a CO2 storage capacity of 1222 Mt.
Overall, these basin-scale estimates are spatially represented in the software ArcGIS 10.6 by estimating their geological formation's surface areas from corresponding maps, provided by the aforementioned studies. They are then aggregated by Chinese sub-regions and account for the low estimates in our study.
At the EU-scale, the EU GeoCapacity Project and later the CO2 Stop project developed a CO2 storage potential capacity database.83–85 The GeoCapacity project involved 25 countries and evaluated a total CO2 capacity of 95.7 Gt in deep saline aquifers and 20.2 Gt in hydrocarbon fields. The CO2 StoP project involved 27 countries and presented a standardised CO2 storage capacity of 157.8 Gt in deep saline aquifers, and 13.3 Gt in hydrocarbon fields, which are 1.6 times higher and 0.7 times lower than the respective estimates provided by the GeoCapacity project. Overall, the CO2 StoP identified CO2 storage capacity is 1.5 times higher than the one of the GeoCapacity project.
Regarding CO2 storage in aquifers, it would appear that the CO2 storage capacity of France, Germany and Poland in the GeoCapacity project is equivalently allocated to Poland, only, in the CO2 StoP project. Similarly, the reported CO2 storage capacities of Denmark and Norway in the GeoCapacity project are also equivalent to the one of Denmark, only, in the CO2 StoP project. Finally, when subtracting the CO2 capacity of the UK from the total CO2 capacity in the CO2 StoP project, the resulting total CO2 capacity is only equal to 0.7 of the one in the GeoCapacity project. Regarding CO2 storage in oil & gas fields, no similar hypotheses can be drawn.
Overall, value ranges vary significantly between the two projects, both at the country-scale and the global-scale, whether for aquifers, oil & gas fields, or both. Additionally, in the CO2 StoP project, important differences can also be observed between the “user-entered”, the “calculations” and the “standardised calculations”. As a result of this, our study uses the GeoCapacity data, which accounts for the low, medium and high CO2 storage capacity estimates.
![[thin space (1/6-em)]](https://www.rsc.org/images/entities/char_2009.gif) 633) Gt of CO2 storage capacity have been identified in oil & gas fields and aquifers respectively.80 Spatial data was also available. In this study, we aggregate the DOE's NETL spatial dataset into U.S. States in the software ArcGIS 10.6. The P5 (min), mean and P95 (max) estimates accounts respectively for the low, medium and high estimates.
633) Gt of CO2 storage capacity have been identified in oil & gas fields and aquifers respectively.80 Spatial data was also available. In this study, we aggregate the DOE's NETL spatial dataset into U.S. States in the software ArcGIS 10.6. The P5 (min), mean and P95 (max) estimates accounts respectively for the low, medium and high estimates.
C.2 Areas with reforestation opportunities
The type of land on which afforestation tales places, also referred as cover type, is included within the afforestation value chain framework, thereby impacting afforestation GHG and cost balance, through the respective contributions of direct & indirect land use change and land cost.In this study, afforestation deployment is constrained to areas with reforestation (RP) potential, as provided by (Griscom et al.).76 RP lands are defined by non-forests lands in areas ecologically appropriate for forests (i.e., areas with a low tree cover (<25%) but within the boundaries of a native forest cover type). Land categorised as grassland or savanna, cropland, and land within boreal ecological zones are excluded from the scope of the dataset respectively to limit negative impacts on biodiversity, to account for food security, and the albedo effect.
The 740 m geographic resolution spatial dataset has been processed in the software ArcGIS 10.6 (ESRI) to obtain the availability of RP land in each sub-region sr and ecological zone gez. Because of the low tree cover of RP lands, and the little information on their current use, we assume that LUC and iLUC factors, and cost of land are equal to zero.
Appendix D additional results
D.1 Cost-optimal cumulative CO2 removal
Fig. 17 illustrates the cost-optimal CDR pathways in 2100 under the different P3-consistent policy scenarios discussed in Section 2.3. The amount of CO2 removed cumulatively by 2100 is indicated at the sub-regional scale, and pied charts showing the contribution of each CDR option (i.e., AR, BECCS, and DACCS) are at the regional scale. Cumulative imported biomass (pellet) for BECCS by 2100 are also indicated via arrows at the regional scale.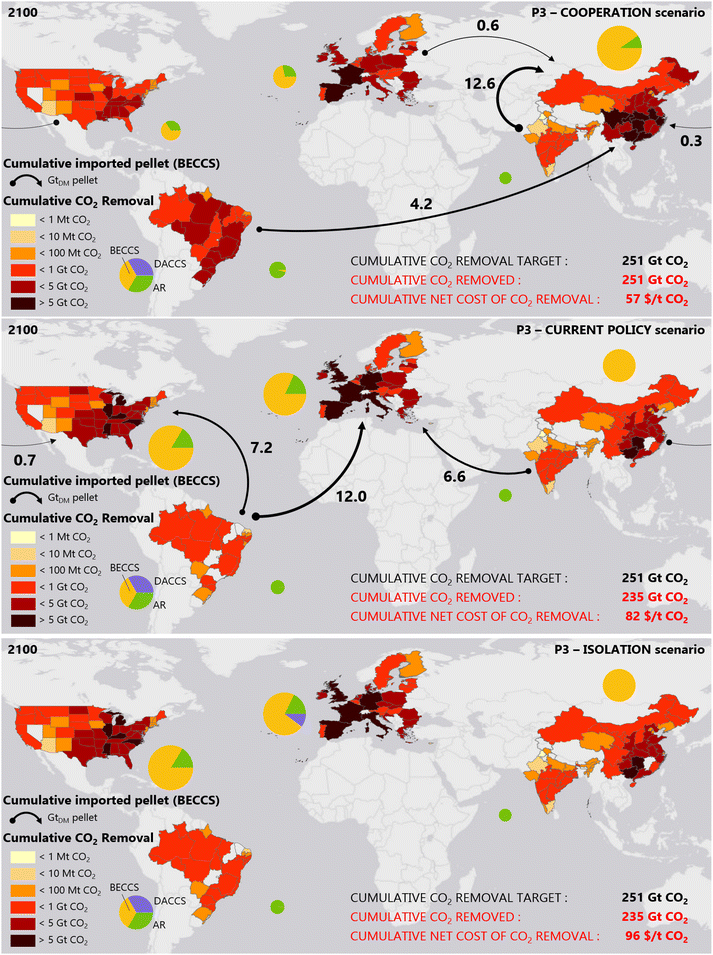 | ||
| Fig. 17 Maps of cost-optimal CDR pathways deployed by 2100, under alternative P3-consistent policy scenarios: COOPERATION, CURRENT POLICY and ISOLATION scenarios. | ||
D.2 Cost supply curves
Fig. 18 shows the cost-efficiency of each CDR option deployed – how the cost of CDR increases as more CO2 is removed from the atmosphere – in all P3-consistent policy scenarios.E sensitivity analysis
The scenarios discussed in Section 3 are dependant on the level of CDR targets that must be met, globally and nationally. They also rely on the availability of CO2 storage, and the maximum deployment rates for AR, BECCS and DACCS.Here, we investigate and discuss the influence of varying CDR targets, CO2 storage availability and maximum deployment rates on the cost-optimal composition of CDR pathways.
E.1 Increasing CDR targets
IAMs have shown that a diversity of climate mitigation pathways were consistent with the Paris Agreement's 1.5 °C objective, differing in socio-economic drivers, demand for energy and/or land, and cumulative GHG emissions, and therefore in temperature overshoots and resulting CDR achieved. The IPCC classifies these climate mitigation pathways into four illustrative scenarios, based on their levels of CDR achieved by the end of the century. Specifically, the IPCC P3 scenario aims at being representative of a middle-of-the-road climate mitigation pathway, in which BECCS—used as a proxy for CDR solutions—is deployed up to 407 cumulative GtCO2 by 2100. In this study, the IPCC P3 scenario was used to set out base-case CDR targets between 2020–2100. Results in Section 3 showed that delivering the Paris Agreement' CDR objectives at the IPCC P3 scale is feasible, yet challenging—less feasibly and more expensively—without international cooperation policy in climate mitigation. Therefore, we perform/run a sensitivity analysis on higher CDR targets by using the IPCC P4 scenario, representative of a fossil-fuel intensive and high energy demand pathway, and characterised by the aggressive deployment of BECCS—1176 cumulative GtCO2 by 2100. As a reference, the IPCC P3 and P4 annual levels of CDR in 2100 are equivalent to 12.2 and 35.1 times the current level of CO2 emissions—33.5 GtCO2 in (2018).As shown in Fig. 19A, higher (P4) CDR targets results into the deployment of DACCS in all scenarios, making up between 12–46% of the CO2 cumulatively removed from the atmosphere globally by 2100. The Paris Agreement's CDR objectives are successfully delivered at the P4 scale in the COOPERATION scenario, but the gap by which they are missed in the CURRENT POLICY and ISOLATION scenarios increases to 191 GtCO2 in 2100, equivalent to 26% of the 2100 global P4 target.
In the COOPERATION scenario, DACCS is deployed in the USA only, up to 201 GtCO2 in 2100 (Fig. 19B), and contributes to overtaking the USA's 2100 national CDR target by 38%. This is achieved with the DACCS-CE archetypal configuration only, as it is cheaper than the DACCS-CW archetypal one, and increases the (global) cumulative cost of CDR by 3.5 times to $203 per tCO2 by 2100. With higher CDR targets, DACCS needs therefore to be added to the cost-optimal CDR pathway to deliver the Paris Agreement at scale, whilst taking best advantage of international cooperation policy, which results inevitably into higher CDR costs.
In the CURRENT POLICY scenario, because of the absence of international cooperation in climate mitigation, we find that DACCS is deployed in the EU as early as 2030. However, this is insufficient to reach the EU's national CDR targets as the EU's CO2 storage sites are exhausted by 2070. Although less CO2 is removed by the end of the century than in the previous scenario, both DACCS-CE and DACCS-Cw archetypal configurations are deployed, as the DACCS-Cw archetypal configuration is more efficient to remove CO2 from the atmosphere, once the electricity system has fully transitioned to net-zero. However, the DACCS-Cw archetypal configuration is also more expensive than the DACCS-CE one. Therefore the cumulative cost of CDR also increases to $205 per tCO2 by 2100, which is lower than in the previous scenario.
The cumulative cost of CDR is the highest in the ISOLATION scenario—$285 per tCO2 by 2100—as international biomass trading is not allowed, and therefore leads to a higher contribution of DACCS to the CDR pathway than in the CURRENT POLICY scenario. This is observed in the USA and in China, where DACCS displaces BECCS using imported biomass from Brazil and India.
The above emphasises the importance of developing a geopolitical framework for negative emissions trading in order to guarantee the international ability of delivering the Paris Agreement's objectives, even in the pessimistic P4 scenario of the IPCC. However, as more CO2 will need to be removed from the atmosphere, the financial burden of the Paris Agreement will increase significantly, due to the inevitable deployment of DACCS.
E.2 Increasing CO2 storage availabilities & capacities
This study highlighted that CDR solutions involving CO2 storage play a key role in delivering the Paris Agreement at scale, with BECCS and DACCS contributing between 74–84% to the total CO2 removal by 2100, in all scenarios discussed in Section 3. More specifically, results in Section E.1 showed the importance of well distributed CO2 storage sites with high capacity. Specifically, nations can be categorised as follows: No or very limited CO2 storage potential—<1 GtCO2—such as Brazil and India; limited CO2 storage potential—≥1 GtCO2 and <1000 GtCO2—such as the EU; and unlimited CO2 storage potential—≥1000 GtCO2—such as China and the USA. Here, we investigate the effect of a globally better distributed and higher CO2 storage capacity on the cost-optimal deployment of CDR solutions. The description of the CO2 storage assessment methodology and the resulting regional CO2 storage estimates are provided in Appendix B.Fig. 19C shows that better distributed and higher CO2 storage capacities across the world allow for the successful delivering of the Paris Agreement, under any alternative policy options. This is because, in the CURRENT POLICY and ISOLATION scenarios, India's national CDR target can be met via BECCS, owing to the availability of CO2 storage site. This also results into a slight decrease of the cumulative net cost of CDR by 4–5% to $79 per tCO2 and $92 per tCO2, respectively. Specifically, the cumulative cost of CDR is the lowest in the COOPERATION scenario—$31 per tCO2—owing to the availability of CO2 storage sites in Brazil, and thus the ability to deploy the least-cost BECCS configurations across the world, and where 58% of the total CO2 removal by 2100 is therefore achieved. This is equivalent to 20 times Brazil's 2100 national CDR target.
This highlights the importance of well-distributed and high CO2 storage capacity at the national level, as this would unlock the delivering of the Paris Agreement under any alternative policy options, and decrease its financial burden, specifically with an international cooperation policy.
E.3 Increasing deployment rates
The cost-optimal composition of a CDR pathway that is consistent with the Paris Agreement is subject to a set of constraints. Specifically, the rate at which each CDR solution can be deployed in this study is determined by maximum expansion rates—an afforestation rate for AR, and built rates for new BECCS and DACCS plants. There are, however, no historic records for nascent CDR technologies such as BECCS and DACCS, or for AR for the purpose of CDR, which makes maximum expansion limits, now and in the future, highly uncertain. This study showed that, AR deployment was partially limited by such expansion constraints, at the rates specified as in Section 2.1.2. Here, we perform a sensitivity analysis on higher deployment rates for all CDR options, in the scenarios discussed in Section 3. Specifically, AR's maximum regional land expansion rate is multiplied by a factor 10, from 50 kha per year to 500 kha per year, BECCS's maximum regional built rate is increased from 2 GW per year to 5 GW per year—equivalent to a CO2 capture rate of 42 MtCO2 per year in each region—and DACCS's maximum regional built rate is increased accordingly to 42 MtCO2 per year as well.As shown in Fig. 19E, higher deployment rates lead to higher, yet limited, deployments of AR to the detriment of BECCS and DACCS, and reduce by 7–18% the cumulative cost of CDR to $47 per tCO2, $76 per tCO2 and $79 per tCO2 in 2100 in the COOPERATION, CURRENT POLICY and ISOLATION scenarios, respectively. However, this does not improve the ability to meet the Paris Agreement's 2100 CDR objectives in the absence of international cooperation in climate mitigation policy (in the CURRENT POLICY and ISOLATION scenarios).
In the COOPERATION scenario, in which AR is the most deployed, total CO2 removal via AR increases by 32 GtCO2 in 2100, but BECCS contribution to the cost-optimal CDR pathway is still predominant. This is because, even with higher afforestation rates, AR deployment is bio-geophysically limited by land availability. In India, 92% of the land with a potential for reforestation is already allocate to AR as early as 2050. In Brazil and in the EU, AR is deployed by 2060 over 89% and 91% of the available land, respectively. This is also because BECCS is still more cost-efficient than AR. Overall, we find that 98–100% of the total CO2 removed by 2100 in Brazil and India is achieved via AR, but 45–69% in the EU and the USA, and only 16% in China.
In the CURRENT POLICY scenario, BECCS is also replaced by AR, but only by 16 GtCO2. As in the base-case CURRENT POLICY scenario, this is because of the absence of international cooperation policy in climate mitigation. Even with higher afforestation rates, BECCS is still more cost-efficient and therefore more deployed than AR by 2100.
Finally, in the ISOLATION scenario, higher deployment rates results into the full replacement of DACCS by AR.
The above therefore shows that higher deployment rates can alleviate the Paris Agreement's financial burden by deploying AR instead of BECCS and DACCS. Without international cooperation in climate change policy, this is however insufficient to deliver the Paris Agreement at scale by 2100. In a pessimistic ‘isolation’ paradigm, DACCS's contribution to the CDR pathway is very low, but could nonetheless still compromise the sustainability of the CDR pathway by requiring the deployment of new power capacity as well.
Fig. 20 summarises cumulative net costs of CDR under all three alternative policy options, for both the base-case scenarios and the sensitivity analysis. It emphasises the urgency of mitigating climate change as early as possible, to minimise the need for CDR, and therefore its financial burden (high CDR targets). It also shows that high afforestation rates can slightly reduce the financial burden of financial burden of the Paris Agreement's CDR objectives (high deployment rates), but that the biggest reduction potential arises from well distributed CO2 storage with high capacity, with international cooperation in climate mitigation policy (high CO2 storage capacity).
Acknowledgements
The authors thank Imperial College London and the Centre for Environmental Policy for the funding of a PhD Scholarship. The authors are futher grateful to NERC for grants NE/P019900/1 (Comparative assessment and region-specific optimisation of GGR) and NE/V013106/1 (GGR Directorate CO2RE Hub) and the European Union’s Horizon 2020 Research and Innovation Programme under Grant Agreement No. 869192 (NEGEM).References
- U. N. F. C. on Climate Change (UNFCCC), Adoption of the Paris Agreement, 2015.
- A. H. MacDougall and P. Friedlingstein, J. Clim., 2015, 28, 4217–4230 CrossRef.
- Intergovernmental Panel on Climate Change, Climate Change 2014: Synthesis Report. Contribution of Working Groups I, II and III to the Fifth Assessment Report of the Intergovernmental Panel on Climate Change, IPCC, Geneva, Switzerland, 2014, p. 151.
- H. D. Matthews, N. P. Gillett, P. A. Stott and K. Zickfeld, Nature, 2009, 459, 829–832 CrossRef CAS PubMed.
- K. Zickfeld, M. Eby, H. Damon Matthews and A. J. Weaver, Proc. Natl. Acad. Sci. U. S. A., 2009, 106, 16129–16134 CrossRef CAS PubMed.
- Intergovernmental Panel on Climate Change (IPCC), Global Warming of 1.5. An IPCC Special Report on the impacts of global warming of 1.5 above pre-industrial levels and related global greenhouse gas emission pathways, in the context of strengthening the global response to the threat of climate change, Press, 2018.
- D. Huppmann, J. Rogelj, E. Kriegler, V. Krey and K. Riahi, Nat. Clim. Change, 2018, 8, 1027–1030 CrossRef.
- H. D. Matthews, J. S. Landry, A. I. Partanen, M. Allen, M. Eby, P. M. Forster, P. Friedlingstein and K. Zickfeld, Curr. Clim. Change Rep., 2017, 3, 69–77 CrossRef.
- R. J. Millar, J. S. Fuglestvedt, P. Friedlingstein, J. Rogelj, M. J. Grubb, H. D. Matthews, R. B. Skeie, P. M. Forster, D. J. Frame and M. R. Allen, Nat. Geosci., 2017, 10, 741–747 CrossRef CAS.
- G. Luderer, R. C. Pietzcker, C. Bertram, E. Kriegler, M. Meinshausen and O. Edenhofer, Environ. Res. Lett., 2013, 8, 34033 CrossRef.
- G. Luderer, C. Bertram, K. Calvin, E. De Cian and E. Kriegler, Clim. Change, 2016, 136, 127–140 CrossRef.
- B. M. Sanderson and B. C. O'Neill, Sci. Rep., 2020, 10, 1–12 CrossRef PubMed.
- M. Victoria, K. Zhu, T. Brown, G. B. Andresen and M. Greiner, Nat. Commun., 2020, 11, 1–9 CrossRef PubMed.
- D. McLaren, Clim. Change, 2020, 162, 2411–2428 CrossRef CAS.
- J. Hansen, M. Sato, P. Kharecha, K. Von Schuckmann, D. J. Beerling, J. Cao, S. Marcott, V. Masson-Delmotte, M. J. Prather, E. J. Rohling, J. Shakun, P. Smith, A. Lacis, G. Russell and R. Ruedy, Earth System Dyn., 2017, 8, 577–616 CrossRef.
- R. Hanna, A. Abdulla, Y. Xu and D. G. Victor, Nat. Commun., 2021, 12, 1–13 CrossRef PubMed.
- Climate Analytics and New Climate Institute, Glasgow's 2030 credibility gap: net zero's lip service to climate action - Warming Projections Global Update, Climate Action Tracker Technical Report November, 2021.
- United Nations Framework Convention on Climate Change (UNFCCC), Nationally determined contributions under the Paris Agreement, 2021.
- Climate Analytics and New Climate Institute, Countries | Climate Action Tracker, 2022, https://climateactiontracker.org/countries/.
- A. Geiges, A. Nauels, P. Yanguas Parra, M. Andrijevic, W. Hare, P. Pfleiderer, M. Schaeffer and C. F. Schleussner, Earth System Dyn., 2020, 11, 697–708 CrossRef.
- J. Rogelj, M. Den Elzen, N. Höhne, T. Fransen, H. Fekete, H. Winkler, R. Schaeffer, F. Sha, K. Riahi and M. Meinshausen, Nature, 2016, 534, 631–639 CrossRef CAS PubMed.
- G. Luderer, Z. Vrontisi, C. Bertram, O. Y. Edelenbosch, R. C. Pietzcker, J. Rogelj, H. S. De Boer, L. Drouet, J. Emmerling, O. Fricko, S. Fujimori, P. Havlík, G. Iyer, K. Keramidas, A. Kitous, M. Pehl, V. Krey, K. Riahi, B. Saveyn, M. Tavoni, D. P. Van Vuuren and E. Kriegler, Nat. Clim. Change, 2018, 8, 626–633 CrossRef CAS.
- J. Rogelj, A. Popp, K. V. Calvin, G. Luderer, J. Emmerling, D. Gernaat, S. Fujimori, J. Strefler, T. Hasegawa, G. Marangoni, V. Krey, E. Kriegler, K. Riahi, D. P. Van Vuuren, J. Doelman, L. Drouet, J. Edmonds, O. Fricko, M. Harmsen, P. Havlík, F. Humpenöder, E. Stehfest and M. Tavoni, Nat. Clim. Change, 2018, 8, 325–332 CrossRef CAS.
- J. G. Canadell and M. R. Raupach, Science, 2008, 320, 1456–1457 CrossRef CAS PubMed.
- M. Obersteiner, C. Azar, P. Kauppi, K. Möllersten, J. Moreira, S. Nilsson, P. Read, K. Riahi, B. Schlamadinger, Y. Yamagata, J. Yan and J.-P. van Ypersele, Science, 2001, 294, 786–787 CrossRef CAS PubMed.
- R. Socolow, M. Desmond, R. Aines, J. Blackstock, O. Bolland, T. Kaarsberg, N. Lewis, M. Mazzotti, A. Pfeffer, K. Sawyer, J. Siirola, B. Smit and J. Wilcox, Direct Air Capture of CO2 with Chemicals: A Technology Assessment for the APS Panel on Public Affairs, 2011.
- D. W. Keith, G. Holmes, D. St Angelo and K. Heidel, Joule, 2018, 2, 1573–1594 CrossRef CAS.
- P. Renforth and T. Kruger, Energy Fuels, 2013, 27, 4199–4207 CrossRef CAS.
- T. M. Lenton and C. Britton, Global Biogeochem. Cycles, 2006, 20, 3009 Search PubMed.
- R. D. Schuiling and P. Krijgsman, Clim. Change, 2006, 74, 349–354 CrossRef CAS.
- D. Woolf, J. E. Amonette, F. A. Street-Perrott, J. Lehmann and S. Joseph, Nat. Commun., 2010, 1, 1053 Search PubMed.
- P. Smith, GCB Bioenergy, 2016, 22, 1315–1324 Search PubMed.
- B. Minasny, B. P. Malone, A. B. McBratney, D. A. Angers, D. Arrouays, A. Chambers, V. Chaplot, Z. S. Chen, K. Cheng, B. S. Das, D. J. Field, A. Gimona, C. B. Hedley, S. Y. Hong, B. Mandal, B. P. Marchant, M. Martin, B. G. McConkey, V. L. Mulder, S. O'Rourke, A. C. Richer-de Forges, I. Odeh, J. Padarian, K. Paustian, G. Pan, L. Poggio, I. Savin, V. Stolbovoy, U. Stockmann, Y. Sulaeman, C. C. Tsui, T. G. Vågen, B. van Wesemael and L. Winowiecki, Geoderma, 2017, 292, 59–86 CrossRef.
- J. Strefler, N. Bauer, F. Humpenöder, D. Klein, A. Popp and E. Kriegler, Environ. Res. Lett., 2021, 16, 074021 CrossRef CAS.
- J. Fuhrman, H. McJeon, P. Patel, S. C. Doney, W. M. Shobe and A. F. Clarens, Nat. Clim. Change, 2020, 10, 920–927 CrossRef CAS.
- G. Realmonte, L. Drouet, A. Gambhir, J. Glynn, A. Hawkes, A. C. Köberle and M. Tavoni, Nat. Commun., 2019, 10, 1–12 CrossRef PubMed.
- J. Strefler, N. Bauer, E. Kriegler, A. Popp, A. Giannousakis and O. Edenhofer, Environ. Res. Lett., 2018, 13, 044015 CrossRef.
- A. Marcucci, S. Kypreos and E. Panos, Clim. Change, 2017, 144, 181–193 CrossRef.
- J. Fuhrman, H. McJeon, S. C. Doney, W. Shobe and A. F. Clarens, Front. Clim., 2019, 1, 11 CrossRef.
- Drax Group Plc, 2020, https://tinyurl.com/3hbyjvcb.
- Carbon Engineering Ltd, 2020, https://carbonengineering.com/our-technology/.
- Climeworks, 2020, https://www.climeworks.com/co2-removal.
- NASA LCLUC, Afforestation Along the Gobi Desert's Margin, Northern China, https://tinyurl.com/bh7bw83n.
- World Bank, China: Afforestation Project in Shandong Improves Environment and Farmers' Incomes, 2017, https://tinyurl.com/3rcma2ab.
- S. Fuss, W. F. Lamb, M. W. Callaghan, J. Hilaire, F. Creutzig, T. Amann, T. Beringer, W. De Oliveira Garcia, J. Hartmann, T. Khanna, G. Luderer, G. F. Nemet, J. Rogelj, P. Smith, J. V. Vicente, J. Wilcox, M. Del Mar Zamora Dominguez and J. C. Minx, Environ. Res. Lett., 2018, 13, 063002 CrossRef.
- V. Heck, D. Gerten, W. Lucht and A. Popp, Nat. Clim. Change, 2018, 8, 151–155 CrossRef CAS.
- G. F. Nemet, M. W. Callaghan, F. Creutzig, S. Fuss, J. Hartmann, J. Hilaire, W. F. Lamb, J. C. Minx, S. Rogers and P. Smith, Environ. Res. Lett., 2018, 13, 063003 CrossRef.
- P. Smith, S. J. Davis, F. Creutzig, S. Fuss, J. Minx, B. Gabrielle, E. Kato, R. B. Jackson, A. Cowie, E. Kriegler, D. P. Van Vuuren, J. Rogelj, P. Ciais, J. Milne, J. G. Canadell, D. McCollum, G. Peters, R. Andrew, V. Krey, G. Shrestha, P. Friedlingstein, T. Gasser, A. Grübler, W. K. Heidug, M. Jonas, C. D. Jones, F. Kraxner, E. Littleton, J. Lowe, J. R. Moreira, N. Nakicenovic, M. Obersteiner, A. Patwardhan, M. Rogner, E. Rubin, A. Sharifi, A. Torvanger, Y. Yamagata, J. Edmonds and C. Yongsung, Nat. Clim. Change, 2016, 6, 42–50 CrossRef CAS.
- National Academies of Sciences, Engineering, and Medicine, Negative Emissions Technologies and Reliable Sequestration: A Research Agenda, National Academies Press, Washington, DC, 2019 Search PubMed.
- M. Honegger, A. Michaelowa and J. Roy, Clim. Policy, 2021, 21, 678–698 CrossRef.
- A. Mohan, O. Geden, M. Fridahl, H. J. Buck and G. P. Peters, One Earth, 2021, 4, 1348–1351 CrossRef.
- D. R. Morrow, M. S. Thompson, A. Anderson, M. Batres, H. J. Buck, K. Dooley, O. Geden, A. Ghosh, S. Low, A. Njamnshi, J. Noël, O. O. Táíwò, S. Talati and J. Wilcox, One Earth, 2020, 3, 150–153 CrossRef.
- L. Ringius, A. Torvanger and A. Underdal, Int. Environ. Agreements, 2002, 2, 1–22 CrossRef.
- C. Pozo, Á. Galán-Martín, D. M. Reiner, N. Mac Dowell and G. Guillén-Gosálbez, Nat. Clim. Change, 2020, 10, 640–646 CrossRef CAS.
- M. Fajardy and N. Mac Dowell, One Earth, 2020, 3, 214–225 CrossRef.
- N. Bauer, C. Bertram, A. Schultes, D. Klein, G. Luderer, E. Kriegler, A. Popp and O. Edenhofer, Nature, 2020, 588, 261–266 CrossRef CAS PubMed.
- M. Honegger and D. Reiner, Clim. Policy, 2018, 18, 306–321 CrossRef.
- W. Rickels, A. Proelß, O. Geden, J. Burhenne and M. Fridahl, Front. Clim., 2021, 3, 62 Search PubMed.
- M. Brander, F. Ascui, V. Scott and S. Tett, Clim. Policy, 2021, 21, 699–717 CrossRef.
- M. J. Mace, C. L. Fyson, M. Schaeffer and W. L. Hare, Global Policy, 2021, 12, 67–81 CrossRef.
- M. Fajardy, S. Chiquier and N. Mac Dowell, Energy Environ. Sci., 2018, 11, 3408–3430 RSC.
- M. Fajardy, PhD thesis, Imperial College London, 2020.
- M. Fajardy and N. Mac Dowell, Energy Environ. Sci., 2017, 10, 1389–1426 RSC.
- M. R. Raupach, S. J. Davis, G. P. Peters, R. M. Andrew, J. G. Canadell, P. Ciais, P. Friedlingstein, F. Jotzo, D. P. Van Vuuren and C. Le Quéré, Nat. Clim. Change, 2014, 4, 873–879 CrossRef CAS.
- J. Gütschow, M. L. Jeffery, R. Gieseke, R. Gebel, D. Stevens, M. Krapp and M. Rocha, Earth Syst. Sci. Data, 2016, 8, 571–603 CrossRef.
- J. Gütschow, A. Günther and M. Pflüger, The PRIMAP-hist national historical emissions time series v2.3 (1750-2019), zenodo, 2021 DOI:10.5281/zenodo.5175154.
- J. Penman, M. Gytarsky, T. Hiraishi, W. Irving and T. Krug, 2006 IPCC Guidelines for National Greenhouse Gas Inventories, 2006.
- World Bank, World Development Indicators, 2020, https://databank.worldbank.org/source/world-development-indicators.
- H. A. Daggash, C. F. Heuberger and N. Mac Dowell, Int. J. Greenhouse Gas Control, 2019, 81, 181–198 CrossRef CAS.
- H. A. Daggash and N. Mac Dowell, Joule, 2019, 3, 2120–2133 CrossRef.
- H. A. Daggash and N. Mac Dowell, Int. J. Greenhouse Gas Control, 2019, 85, 174–181 CrossRef.
- H. A. Daggash and N. Mac Dowell, Joule, 2019, 3, 1239–1251 CrossRef.
- C. Heaton, Modelling Low-Carbon Energy System Designs with the ETI ESME Model, 2014 Search PubMed.
- LP DAAC - MCD12Q1, https://lpdaac.usgs.gov/products/mcd12q1v006/.
- FAO, Global Forest Resources Assessment 2020, FAO, 2020 Search PubMed.
- B. W. Griscom, J. Adams, P. W. Ellis, R. A. Houghton, G. Lomax, D. A. Miteva, W. H. Schlesinger, D. Shoch, J. V. Siikamäki, P. Smith, P. Woodbury, C. Zganjar, A. Blackman, J. Campari, R. T. Conant, C. Delgado, P. Elias, T. Gopalakrishna, M. R. Hamsik, M. Herrero, J. Kiesecker, E. Landis, L. Laestadius, S. M. Leavitt, S. Minnemeyer, S. Polasky, P. Potapov, F. E. Putz, J. Sanderman, M. Silvius, E. Wollenberg and J. Fargione, Proc. Natl. Acad. Sci. U. S. A., 2017, 114, 11645–11650 CrossRef CAS PubMed.
- X. Cai, X. Zhang and D. Wang, Environ. Sci. Technol., 2011, 45, 334–339 CrossRef CAS PubMed.
- Q. Yu, L. You, U. Wood-Sichra, Y. Ru, A. Joglekar, S. Fritz, W. Xiong, M. Lu, W. Wu and P. Yang, Earth Syst. Sci. Data Discuss., 2020, 1–40 Search PubMed.
- F. Gassert, M. Landis, M. Luck, P. Reig and T. Shiao, AQUEDUCT GLOBAL MAPS 2.1, 2015 Search PubMed.
- USDOE, Carbon Storage Atlas, 5th Edn, 2015.
- X. Li, N. Wei, Y. Liu, Z. Fang, R. T. Dahowski and C. L. Davidson, Energy Procedia, 2009, 1, 2793–2800 CrossRef CAS.
- R. T. Dahowski, X. Li, C. L. Davidson, N. Wei and J. J. Dooley, Regional Opportunities for Carbon Dioxide Capture and Storage in China, USDOE Technical Report, December, 2009.
- T. Vangkilde-Pedersen, K. L. Anthonsen, N. Smith, K. Kirk, F. Neele, B. van der Meer, Y. Le Gallo, D. Bossie-Codreanu, A. Wojcicki, Y.-M. Le Nindre, C. Hendriks, F. Dalhoff and N. Peter Christensen, Energy Proc., 2009, 1, 2663–2670 CrossRef CAS.
- T. Vangkilde-Pedersen and GEUS, Assessing European Capacity for Geological Storage of Carbon Dioxide - WP2 Report Storage Capacity, Project no. SES6-518318, 2009.
- N. Poulsen, S. Holloway, F. Neele, N. A. Smith and K. Kirk, CO2StoP Final Report - Assessment of CO2storage potential in Europe, 2014.
- D. Gammer, A Picture of CO2 Storage in the UK - Learnings from ETI's UKSAP and derived Projects, Energy Technologies Institute technical report.
- G. C. Rockett, J. M. M. Ketzer, A. Ramírez and M. Van Den Broek, Energy Proc., 2013, 37, 5124–5133 CrossRef CAS.
- J. M. M. Ketzer, C. X. Machado, G. C. Rockett and R. S. Iglesias, Brazilian atlas of CO2capture and geological storage, CEPAC/EDIPUCRS, 2014.
- S. Holloway, A. Garg, M. Kapshe, A. Deshpande, A. S. Pracha, S. R. Khan, M. A. Mahmood, T. N. Singh, K. L. Kirk and J. Gale, Energy Procedia, 2009, 1, 2607–2613 CrossRef CAS.
- CEC, Installed capacity of electric power generation in China between 2010 and 2020 (in gigawatts), 2022, https://www.statista.com/statistics/302269/china-installed-power-generation-capacity/.
- U.S. Energy Information Administration, Electricity explained - Electricity generation, capacity, and sales in the United States, 2022, https://www.eia.gov/energyexplained/electricity/electricity-in-the-us-generation-capacity-and-sales.php.
- European Commission, Cumulative electricity capacity installed by generation type in the European Union (EU-27) as of 2019 (in megawatts), 2022, https://www.statista.com/statistics/<?ccdc_no 807675?>807675<?ccdc END?>/installed-power-capacity-european-union-eu-28/.
- IEA, CO2 Emissions from Fuel Combustion 2018, OECD/IEA, 2018.
- FAO, Global Ecological Zoning for the Global Forest Resources Assessment 2000, 56, 2001.
- FAO, Global Ecological Zones for FAO Forest Repoting: 2010 Update, 2012.
- H. Aalde, P. Gonzalez, M. Gytarsky, T. Krug, W. A. Kurz, S. Ogle, J. Raison, D. Schoene, N. Ravindranath, N. G. Elhassan, L. S. Heath, N. Higuchi, S. Kainja, M. Matsumoto, M. J. S. Sánchez and Z. Somogyi, Forest Land: Agriculture, Forestry and Other Land Use 2006 IPCC Guidelines for National Greenhouse Gas Inventories, 2006, Ch. 4, Vol. 4.
- H. Aalde, P. Gonzalez, M. Gytarsky, T. Krug, W. A. Kurz, R. D. Lasco, D. L. Martino, B. G. McConkey, S. Ogle, K. Paustian, J. Raison, N. H. Ravindranath, D. Schoene, P. Smith, Z. Somogyi, A. van Amstel and L. Verchot, Generic Methodologies Applicable To Multiple Land-Use Categories, Agriculture, Forestry and Other Land Use 2006 IPCC Guidelines for National Greenhouse Gas Inventories, 2006, Ch. 2, Vol. 4.
- C. J. Schulp, G. J. Nabuurs, P. H. Verburg and R. W. de Waal, For. Ecol. Manage., 2008, 256, 482–490 CrossRef.
- B. Berg, P. Gundersen, C. Akselsson, M. B. Johansson, Å. Nilsson and L. Vesterdal, Silva Fennica, 2007, 541–558 Search PubMed.
- E. G. Jobbágy and R. B. Jackson, Ecol. Appl., 2000, 10, 423–436 CrossRef.
- K. Pingoud, K. E. Skog, D. L. Martino, M. Tonosaki and Z. Xiaoquan, Harvested Wood Products, Agriculture, Forestry and Other Land Use 2006 IPCC Guidelines for National Greenhouse Gas Inventories., 2006, Ch. 12, Vol 4.
- G. A. Stainback and J. R. Lavalapati, Nat. Resour. Model., 2004, 17, 299–317 CrossRef.
- L. Hu, G. A. Stainback and X. Li, Southern Agricultural Economics Association's 2016, Annual Meeting, San Antonio, Texas, 2016.
- S. Couture and A. Reynaud, Ecol. Econ., 2011, 70, 2002–2011 CrossRef.
- S. G. McNulty, Environ. Pollut., 2002, 116, S17–S24 CrossRef CAS.
- M. D. Hurteau, B. A. Hungate and G. W. Koch, Carbon Balance Manage., 2009, 4, 1 CrossRef PubMed.
- E. Chuvieco, I. Aguado, S. Jurdao, M. L. Pettinari, M. Yebra, J. Salas, S. Hantson, J. De La Riva, P. Ibarra, M. Rodrigues, M. Echeverría, D. Azqueta, M. V. Román, A. Bastarrika, S. Martínez, C. Recondo, E. Zapico and F. J. Martínez-Vega, Int. J. Wildland Fire, 2014, 23, 606–619 CrossRef.
- D. M. Szpakowski and J. L. Jensen, Remote Sens., 2019, 11, 2638 CrossRef.
- LANDFIRE Program: Data Products - Fire Regime, https://www.landfire.gov/fireregime.php.
- L. Giglio, L. Boschetti, D. Roy, A. A. Hoffman and M. Humber, Collection 6 MODIS Burned Area product User Guide, 2016 Search PubMed.
- C. Whittaker, N. Mortimer, R. Murphy and R. Matthews, Biomass Bioenergy, 2011, 35, 4581–4594 CrossRef CAS.
- J. Morison, R. Matthews, G. Miller, M. Perks, T. Randle, E. Vanguelova, M. White and S. Yamulki, Understanding the carbon and greenhouse gas balance of forests in Britain, Forestry Commission Research technical report, 2012.
- M. Röder, C. Whittaker and P. Thornley, Biomass Bioenergy, 2015, 79, 50–63 CrossRef.
- C. Whittaker, N. Mortimer and R. Matthews, Understanding the carbon footprint of timber transport in the United Kingdom, North Energy technical report, 2010.
- Y. Aldentun, J. Cleaner Prod., 2002, 10, 47–55 CrossRef.
- V. Timmermann and J. Dibdiakova, Int. J. Life Cycle Assess., 2014, 19, 1593–1606 CrossRef CAS.
- S. Berg and T. Karjalainen, Forestry, 2003, 76, 271–284 CrossRef.
- J. Kenney, T. Gallagher, M. Smidt, D. Mitchell and T. Mcdonald, 37th Council on Forest Engineering Annual Meeting, Moline, Illinois, USA, 2014 Search PubMed.
- E. I. S. UK Department for Business, Greenhouse gas reporting - conversion factors 2020: full set (for advanced users), 2020.
- R. Edwards, J.-F. Larivé, D. Rickeard and W. Weindorf, WELL-TO-TANK Report Version 4.a JEC WELL-TO-WHEELS ANALYSIS, European Commission Joint Research Centre Institute for Energy and Transport technical report, 2014.
- L. Honorio, J.-G. Bartaire, R. Bauerschmidt, T. Ohman, Z. Tihanyi, H. Zeinhofer, J. F. Scowcroft, V. De Janeiro, H. Kruger, H.-J. Meier, D. Offermann and U. Langnickel, Efficiency in Electricity Generation, EURELECTRIC/VGB, 2003.
- G. G. Camargo, M. R. Ryan and T. L. Richard, BioScience, 2013, 63, 263–273 CrossRef.
- I. Lewandowski, A. Kicherer and P. Vonier, Biomass Bioenergy, 1995, 8, 81–90 CrossRef CAS.
- P. Nixon and M. Bullard, Planting and Growing Miscanthus: Best Practice Guidelines for Applicants to DEFRA's Energy Crops Scheme, DEFRA technical report, 2001.
- M. A. Elsayed, R. Matthews and N. D. Mortimer, Carbon and energy balances for a range of biofuels options, Resources Research Unit Sheffield Hallam University technical report, 2003.
- E. M. Smeets, I. M. Lewandowski and A. P. Faaij, Renewable Sustainable Energy Rev., 2009, 13, 1230–1245 CrossRef.
- C. De Klein, R. S. Novoa, S. Ogle, K. A. Smith, P. Rochette, T. C. Wirth, B. G. McConkey, A. Mosier and K. Rypdal, N2O emissions from managed soils Agriculture, Forestry and Other Land Use 2006 IPCC Guidelines for National Greenhouse Gas Inventories, 2006, Ch. 11, Vol. 4, pp. 1–54 Search PubMed.
- R. Parajuli, S. Løkke, P. A. Østergaard, M. T. Knudsen, J. H. Schmidt and T. Dalgaard, Biomass Bioenergy, 2014, 68, 115–134 CrossRef CAS.
- F. Murphy, G. Devlin and K. McDonnell, Renewable Sustainable Energy Rev., 2013, 23, 412–420 CrossRef.
- M. M. Mekonnen and A. Y. Hoekstra, Hydrol. Earth Syst. Sci., 2011, 15, 1577–1600 CrossRef.
- World Bank, Pump price for diesel fuel (US$ per liter), 2020, https://tinyurl.com/vnv8n4s.
- Ministry of Mines and Energy, Monthly Energy Bulletin - December 2018, 2018, https://tinyurl.com/3v56ybz5.
- CEIC, Price of electricity, 2020, https://tinyurl.com/az6ya5d3.
- EUROSTAT, Electricity prices by type of user (EUR per kWh), 2020, https://tinyurl.com/fh8fe7au.
- Government of India, Evaluation Report on Rajiv Gandhi Grameen Vidyutikaran Yojana, 2014.
- Energy Information Administration, Average retail price of electricity (cents per kilowatthour), 2020, https://tinyurl.com/ak46bh6j.
- R. Brinker, J. Kinard, R. Rummer and B. Lanford, Machine rates for selected forest harvesting machines, Auburn University technical report, 2002.
- J. Johansson, J.-E. Liss, T. Gullberg and R. Björheden, Biomass Bioenergy, 2006, 30, 334–341 CrossRef.
- US Bureau of Labor Statistics, Occupational Employment and Wage Statistics, 2019, https://www.bls.gov/oes/current/oes_stru.htm.
- M. Duffy, Estimated Costs for Production, Storage and Transportation of Switchgrass, Iowa State University, Department of Economics technical report, 2008.
- M. de Wit and A. Faaij, Biomass Bioenergy, 2010, 34, 188–202 CrossRef.
- ALBA TREES, ALBA TREES - The UK's largest producer of cell grown plants, 2020, https://tinyurl.com/3wr53ee3.
- HomeGuide, How Much Does Crushed Stone or Gravel Cost?, 2020, https://tinyurl.com/5d38jm7e.
- World Bank, Official exchange rate (LCU per US$, period average), 2020, https://tinyurl.com/8zkyt2f8.
- World Bank, inflation, GDP deflator (annual%), 2020, https://tinyurl.com/4hfy6mj3.
- World Bank, PPP conversion factor, GDP (LCU per international $), 2020, https://tinyurl.com/uhfu2m48.
- Global Monitoring Laboratory, Carbon Cycle Greenhouse Gases, 2020, https://gml.noaa.gov/ccgg/.
- H. Herzog, MIT Energy Initiative - Low-Carbon Energy Center Webinar Series, 2021.
- E. S. Sanz-Pérez, C. R. Murdock, S. A. Didas and C. W. Jones, Chem. Rev., 2016, 116, 11840–11876 CrossRef PubMed.
- J. Wurzbacher, Internationaler Motorenkongress 2017, 2017, pp. 499–511 Search PubMed.
- K. S. Lackner, Eur. Phys. J.: Spec. Top., 2009, 176, 93–106 Search PubMed.
- Climeworks, Direct Air Capture & Storage (DACS) Factsheet for Researchers, 2018.
- D. L. Mccollum and J. M. Ogden, Techno-Economic Models for Carbon Dioxide Compression, Transport, and Storage, 2006.
- P. Balcombe, K. Anderson, J. Speirs, N. Brandon and A. Hawkes, ACS Sustainable Chem. Eng., 2017, 5, 3–20 CrossRef CAS.
- O. Schuller, B. Reuter, J. Hengstler, S. Whitehouse and L. Zeitzen, Greenhouse Gas Intensity of Natural Gas, Thinkstep technical report, 2017.
- L. J. Smith and M. S. Torn, Clim. Change, 2013, 118, 89–103 CrossRef CAS.
- A. Hu and Q. Dong, Nat. Gas Ind., 2015, 2, 374–382 Search PubMed.
- EUROSTAT, Gas prices by type of user (EUR per gigajoule), 2020, https://tinyurl.com/yw3hbv6m.
- Energy Information Administration, Natural Gas Prices (Dollards per Thousanf Cubic Feet), 2020, https://tinyurl.com/pcdtj4hx.
- N. Johnson, N. Parker and J. Ogden, Energy Proc., 2014, 6770–6791 CrossRef.
- S. Evans, The Swiss company hoping to capture 1% of global CO2 emissions by 2025, 2017, https://tinyurl.com/39j6usvc.
- Global CCS Institute, The Global Status of CCS 2018, 2018.
- J. J. Dooley, Energy Proc., 2013, 5141–5150 CrossRef.
- J. Kearns, G. Teletzke, J. Palmer, H. Thomann, H. Kheshgi, Y.-H. H. Chen, S. Paltsev and H. Herzog, Energy Proc., 2017, 114, 4697–4709 CrossRef CAS.
- W. Heidug, S. T. Brennan, S. Holloway, P. D. Warwick, S. McCoy and T. Yoshimura, Methods to assess geological CO2 storage capacity: Status and best practice, IEA technical report, 2013.
- S. Bachu, Comparison between Methodologies Recommended for Estimation of CO2 Storage Capacity in Geological Media, Carbon Sequestration Leadership Forum Technical Report April, 2008.
- L. Zhongyang, Z. Jiutian and K. Burnard, Energy Proc., 2009, 1, 3909–3916 CrossRef.
- J. M. Pearce, M. Li, S. Ren, G. Li, W. Chen, C. J. Vincent and K. L. Kirk, Energy Proc., 2011, 4, 6037–6044 CrossRef.
- NZEC, China-UK - Near Zero Emissions Coal (NZEC) Initiative - Summary report, 2009.
- COACH, COACH - Cooperation Action within CCS China-EU - Executive Report, Project No. 038966, 2009.
- C. Vincent, S. Dai, C. Wenying, Z. Rongshu, D. Guosheng, R. Xu and F. Dalhoff, Energy Proc., 2010, 1, 2785–2792 CrossRef.
- C. J. Vincent, R. Zeng, W. Chen, G. Ding, M. Li, S. Dai and N. E. Poulsen, Energy Proc., 2011, 4, 4641–4647 CrossRef.
- N. E. Poulsen, Geol. Surv. Denmark Greenland Bull., 2010, 95–98 CrossRef.
- Z. Jiao, R. C. Surdam, L. Zhou, P. H. Stauffer and T. Luo, Energy Proc., 2011, 4, 5982–5989 CrossRef CAS.
- K. Ellett, Q. Zhang, C. Medina, J. Rupp, G. Wang and T. Carr, Energy Proc., 2013, 37, 5151–5159 CrossRef CAS.
- G. Wang and T. Carr, 2011 GSA Northeastern/North-Central Joint Section Meeting WANG, 2011, p. 94.
- Y. Zhou, J. Chen, J. Liu and H. Yuan, IOP Conf. Ser.: Earth Environ. Sci., 2020, 514, 2 Search PubMed.
- T. Wildenborg, S. Holloway, C. Hendriks, E. Kreft, A. Lokhorst, M. Brook, R. Brandsma, P. Egberts and M. Larsen, Building the cost curves for CO2 storage: European sector, IEAGHG technical report, 2004.
- P. D. Warwick, M. S. Blondes, S. T. Brennan, M. D. Corum and M. D. Merrill, Energy Proc., 2013, 37, 5275–5279 CrossRef CAS.
- U.S. Geological Survey Geologic Carbon Dioxide Storage Resources Assessment Team, National assessment of geologic carbon dioxide storage resources—Results (ver. 1.1, September 2013), USGS technical report, 2013.
Footnotes |
| † These numbers account for negative emissions arising from both “CCS/Biomass” and “CO2/AFOLU”, as categorised by the IPCC. |
| ‡ The CO2 capture capacity of a BECCS plant is calculated here for a 500 MW dedicated biomass power plant, with a capture rate of 90%, as presented previously.62 |
| § After comparing all scenarios of the IPCC SR15 (P1, P2, P3 and P4), we found that the maximum deployment rate for AR was 47 Mha per year, between 2020–2030, in the IPCC P2 scenario—a sustainable development scenario.7 |
| ¶ The monitoring, reporting, and verification challenges implicit in delivering this verification step are non-trivial, and will vary for each CDR option. For simplicity, we do not address this point further in this study, leaving it for future work. |
| || An ecological zone is defined as “a zone or area with broad yet relatively homogeneous natural vegetation formations, similar (not necessarily identical) in physiognomy”.94 |
| ** R1 and R1 were obtained by solving a non-linear curve-fitting (data-fitting) problem in least-squares sense in Python 3.7 (function scipy.optimize.leastsq). |
| †† mFRI and VDep are processed in ArcGIS 10.6 (ESRI). |
| ‡‡ In Keith et al.,27 two DAC plant configurations are investigated. In the first, natural gas is used both for heat and power, whereas in the second, natural gas is replaced by electricity for power. In this study, we only consider the second DAC plant configuration. |
| §§ Because Climeworks's first pilot plant was operated in Switzerland, we used the electricity price of Switzerland. |
| This journal is © The Royal Society of Chemistry 2022 |

