 Open Access Article
Carbene-like reactivity of methoxy groups in a single crystal SAPO-34 MTO catalyst†
Ivalina B.
Minova
a,
Michael
Bühl
 a,
Santhosh K.
Matam
 bc,
C. Richard A.
Catlow
bcd,
Mark D.
Frogley
e,
Gianfelice
Cinque
 e,
Paul A.
Wright
 a and
Russell F.
Howe
 *f
*f
aEastCHEM School of Chemistry, University of St Andrews, St Andrews KY16 9ST, UK
bUK Catalysis Hub, Research Complex at Harwell, Rutherford Appleton Laboratory, Oxford, OX11 0FA, UK
cCardiff Catalysis Institute, School of Chemistry, Cardiff University, Cardiff CF10 3AT, UK
dDepartment of Chemistry, University College London, London WC1E 6BT, UK
eMIRIAM beamline B22, Diamond Light Source, Harwell Science and Innovation Campus, Didcot, OX11 0DE, UK
fChemistry Department, University of Aberdeen, AB24 3UE, UK. E-mail: r.howe@abdn.ac.uk
First published on 21st February 2022
Abstract
Synchrotron FTIR microspectroscopy coupled with mass spectrometric analysis of desorbed products has been used to investigate the initial stages of the methanol to olefins (MTO) reaction in single crystals of SAPO-34. Surface methoxy groups (SMS) are key to initial dimethylether (DME) and subsequent carbon–carbon bond formation. Deprotonation of SMS is the critical first step in direct olefin formation at low temperatures and DME is not involved in the carbon–carbon forming step. Experiments with CD3OH confirm the deprotonation step and show an inverse kinetic isotope effect consistent with irreversible deprotonation. The subsequent formation of alkoxide species, which are the precursors of the olefinic hydrocarbon pool present in working MTO catalysts, is initiated via insertion of surface carbene-like species into adjacent SMS. The observed induction period for this process is determined by the limited mobility of SMS and/or carbene species. Olefins formed from cracking of the alkoxide species then transmit carbon–carbon bond formation through the SAPO-34 by rapid diffusion and reaction with further SMS. Acetyl species seen with methanol at higher temperatures support the insertion of CO into SMS suggested in the literature, but these species do not play a role in direct olefin formation.
Introduction
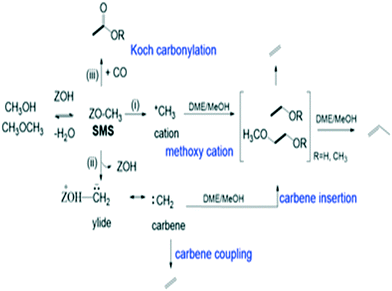
The catalytic conversion of methanol to hydrocarbons (MTH) in the methanol-to-olefins (MTO) and the methanol-to-gasoline (MTG) processes has been widely investigated due to its importance in the production of C2–C4 olefins and liquid fuels from natural resources including waste biomass.1–4 The mechanisms of hydrocarbon formation over ZSM-5, SAPO-34 and other zeotype catalysts have been extensively researched in the ∼40 years since the reaction was first reported.5–11 In the case of MTG there is general agreement that the reaction chemistry involves a hydrocarbon pool (HCP) comprising olefinic and aromatic species that are important co-catalytic organic reaction centres within the zeolite pores under steady state conditions. In ZSM-5, the catalyst of choice for MTG, current thinking is that the HCP is involved in two competing reaction cycles, one involving adsorbed olefinic species and one adsorbed aromatic species.5–11 For MTO, the preferred catalyst is SAPO-34, a silicon-substituted aluminophosphate zeotype with smaller pores and weaker acidity than ZSM-5.12 A similar hydrocarbon pool is usually assumed to operate in SAPO-34, and there is a wealth of spectroscopic and analytical evidence for the presence of methyl aromatic species in the pores of working catalysts which are too large to escape from the pores but which can undergo cracking typically at 723 K to release the ethene and propene that are the major products of MTO.13–20 A distinction is made between this so-called indirect olefin formation via the HCP and olefins formed directly from methanol or dimethyl ether (DME) prior to establishment of the HCP (seen at lower temperatures). There is both experimental15,21 and theoretical22 evidence that the olefinic cycle may be dominant in the early stages of reaction (and in catalysts containing low concentrations of acid sites),23,24 in which olefins are formed by cracking of olefinic or alkoxide species. In this description, the aromatic cycle becomes more dominant as the HCP matures at longer reaction times and higher temperatures. Zhang et al.25 have recently proposed an expanded HCP model in SAPO-34 involving a third cycle consisting of cyclopentadiene species which they suggest link the olefinic and aromatic cycles.Regardless of the precise nature of the HCP at various stages of the MTO reaction, a crucial mechanistic question which remains controversial is how the HCP is formed in the first instance from methanol or DME which contain no carbon–carbon bonds. Surface bound methoxy groups (SMS) generated by methanol or DME dissociation at Brønsted acid sites are thought to be key reactive species in MTH chemistry.26 Once methoxy groups are generated, several different pathways to carbon–carbon bond formation have been proposed, with varying degrees of experimental support.27Scheme 1 gives an overview. Wang et al. first showed from NMR measurements that SMS alone were capable of forming olefins.28 Hutchings et al. suggested earlier that SMS deprotonated to form a surface bound oxonium ylide (equivalent to a bound carbene species) which could react with methanol to form ethoxide species.29–31 More recent proposals for C–C bond formation have involved reaction of SMS with methanol or DME,13,32,33 or insertion of CO into the SMS to form acetate-like species.34–36
Stavitski et al.37 were the first to show that the enhanced brightness of a synchrotron infrared source permitted infrared spectra to be measured quickly on single crystals of zeolite catalysts. As crystals can be studied individually, the homogeneity between and within crystals can be assessed.38 Another advantage of the single crystal synchrotron infrared microscopic experiment over macroscopic spectroscopic studies is that it detects immediately changes occurring in one crystal as opposed to integrating over all the crystals in a sample. We have recently demonstrated that the technique has the time and spatial resolution needed to observe events occurring when methanol is first injected into a single crystal of HZSM-5 at reaction temperatures.39 We showed that the first appearance of olefin products, after a short induction period, correlated with deprotonation of the SMS in HZSM-5. Olefin oligomers (surface alkoxy groups) are the first adsorbed species containing carbon–carbon bonds to appear, and these subsequently cyclise to form methylcyclopentenyl cations as the first cyclic component of the HCP. In a subsequent paper40 we showed that the induction period for the first direct formation of olefins shortened as the crystal size was decreased, and became negligible at higher temperatures, concluding that the HCP is formed almost immediately with small crystals at higher temperatures.
In this paper we report application of the same technique to the reaction of methanol in single crystals of SAPO-34, the archetypical MTO catalyst. Qian et al. reported in 2014 a comprehensive infrared microspectroscopy study of SAPO-34 single crystals exposed to a continuous flow of methanol at different temperatures, complemented with UV-visible microspectroscopic measurements.41 They identified methoxy groups (SMS), protonated DME, and polyalkylated benzene carbocations in the first stage of HCP formation, followed by polyaromatic species in the outer rim of the crystal which were associated with deactivation. In this study we have used either short pulses of methanol or continuous flow of DME coupled with MS analysis of evolved products to separate the initial stages of HCP formation and in particular to observe the direct formation of olefins. Our aim was to determine if the C–C bond-forming chemistry in this smaller pore zeotype with weaker acid sites was different from that in HZSM-5, and whether there were any differences in the initial hydrocarbon pool species detected by infrared spectroscopy.
Experimental
Synthesis and characterisation of SAPO-34 crystals
SAPO-34 crystals were synthesised as described in the ESI† using a morpholine template and calcined at 823 K (2 K min−1) in air for 14 h to give the proton form (HSAPO-34, hereafter referred to as SAPO-34). Methods employed for characterisation of the crystals by XRF, X-ray powder diffraction, SEM, solid state NMR, acid site measurement by ammonia titration and BET analysis are also described in the ESI.†Infrared microspectroscopy
SAPO-34 crystals were sprinkled on CaF2 windows and placed on the heated sample stage of an environmental Linkam FTIR600 cell (ca. 50 mL internal volume) mounted on a (Bruker) Hyperion 3000 IR microscope coupled to a Vertex 80 V FTIR at the MIRIAM beamline B22 at the Diamond Light Source.42 The infrared experiment requires only a single crystal of the catalyst, but to improve the sensitivity of the MS detection we typically added around 1 mg of SAPO-34 to the cell and checked that the spectra seen from one crystal were reproducibly seen from other crystals in the sample. The infrared experiments were collected in transmission from individual crystals at spatial resolution down to 10 × 10 μm2 at the sample plane using a 36× objective/condenser optics, averaging 16 scans at 4 cm−1 resolution, collecting IR spectra continuously once every two seconds. Unless otherwise stated, single point spectra were collected from the centre of SAPO-34 crystals. For mapping experiments, an aperture of 10 × 10 μm2 and an oversampling step size of 5 μm were utilized. Background measurements were performed with a spectral resolution of 4 cm−1 and 64 scans per spectrum. The output of the gas phase products from the cell was analysed by mass spectrometry (a Pfeiffer Omnistar quadrupole MS with electron multiplier detection, mass range 0–100 amu) and correlated with the time-resolved IR spectral changes. Gases or liquids were introduced into a N2 flow (100 mL min−1) upstream of the heated cell. Multiple methanol pulses (each pulse 8 μL in volume) were syringe injected, and dimethyl ether (DME), at 1 bar (5 mL min−1), was mixed in the N2 stream (100 mL min−1) and introduced in a continuous flow.Results and discussion
Synthesis and characterisation of crystals
Full characterisation data for the SAPO-34 crystals are presented in the ESI† (Fig. S1–S4†) and summarised in Table 1. Thermogravimetric analysis of the as-synthesised crystals (Fig. S1†) estimates 1.7 morpholine molecules per cha cage. The number of Brønsted acid sites was estimated from NH3-TPD as 1.2 mmol g−1. This is lower than the total silicon content from XRF (1.8 mmol g−1), indicating the presence of some silicon islands, which is confirmed by 29Si NMR (Fig. S4†).| Crystal size (SEM) | 20–100 μm |
| Composition (XRF) | Al17.3P14.7Si4.0O72 |
| Acid site concentration (NH3-TPD) | 1.2 mmol g−1 |
| Acid sites per CHA cage | 0.87 |
| t-Plot pore volume (N2) & BET surface area | 0.24 cm3 g−1 |
| ∼680 m2 g−1 | |
| Si concentration (XRF) | 1.8 mmol g−1 |
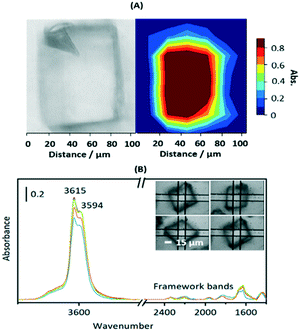
Fig. S3† shows SEM images of calcined crystals which show the expected morphology with sizes ranging between 20 and 100 μm. Infrared spectra were measured from many different crystals dehydrated at 623 K and were closely similar, indicating a uniformity of composition and acid site concentration. The intensity map of the ν(OH) region from one crystal (∼80 × 110 μm) in Fig. 1(A) shows a uniform distribution of OH groups. Likewise, the examples of FTIR spectra in Fig. 1(B) show similar concentrations of OH groups in four similarly sized crystals (∼50 μm).
The ν(OH) region of the spectra displays 2 intense overlapping bands due to Brønsted acid sites, at 3615 and 3594 cm−1, plus an additional broad shoulder at higher frequency possibly due to SiOH vibrations in silica islands. The presence of two distinct OH groups in SAPO-34 is widely reported in the literature. Halasz et al. have proposed most recently that the higher frequency band is due to protons located at O1 sites in the CHA framework and the lower frequency band to protons at O2 and O4,43 although Bordiga et al. earlier suggested the lower frequency mode was due to O3 sites based on its slower response to adsorbed CO.44 Regardless, the important conclusion from the microspectroscopy here is that the numbers of both types of site do not vary significantly across any one crystal or from one crystal to another.
Also evident in the spectra in Fig. 1(B) are weak bands between 2400 and 1400 cm−1 attributed to overtones and combinations of AlPO4 lattice modes at lower frequencies. These framework band contributions are much less intense than the corresponding overtone and combination bands in ZSM-5 crystals. Below 1400 cm−1 the rising baseline due to fundamental lattice modes prevented clear observation of any new bands due to adsorbed species in subtracted spectra.
The catalytic performance of the calcined SAPO-34 crystals used here was evaluated in a conventional microreactor, as described in reference.45 Catalytic data are presented in the ESI† (Fig. S5). As expected the large SAPO-34 crystals deactivate rapidly, which agrees with observations made by Dai et al.,17 but show an initial high selectivity to ethene and propene. TGA analysis of the sample recovered after the reaction revealed 3 wt% of carbonaceous species were retained in the large SAPO-34 crystals after the MTO reaction (compared to 16 wt% carbonaceous species in a commercial SAPO-34 powder under the same conditions), consistent with deactivation occurring in the outer rim of the crystals, as shown previously by single crystal fluorescence microspectroscopy.46 These microreactor experiments confirmed however that the large SAPO-34 crystals studied here have the expected initial MTO activity when tested in a conventional microreactor.
Formation of surface methoxy groups in SAPO-34
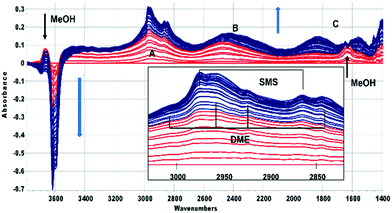
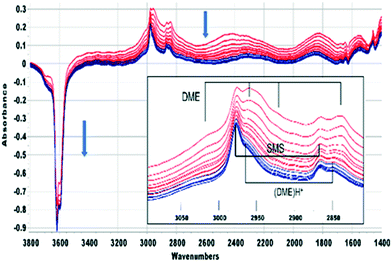
In this section the chemistry involved in SMS formation from methanol and dimethylether is considered. We examine first the spectroscopic evidence for formation of SMS when methanol is initially introduced into the SAPO-34 crystals. Fig. 2 shows difference spectra recorded at 2 s intervals following injection of a methanol pulse into a SAPO-34 crystal at 523 K.The first adsorbed species formed is hydrogen bonded methanol (red traces in Fig. 2). The spectra are similar to those reported by Bordiga et al. for methanol adsorbed in SAPO-34 at low coverage.47 The ν(OH) bands of the SAPO-34 acid sites lose intensity, but a positive feature in the difference spectra at 3670 cm−1 is due to the free ν(OH) mode of the hydrogen bonded methanol. The hydrogen bonded hydroxyl groups of the SAPO-34 give rise to a so-called ABC triplet, due to splitting of the broad ν(OH) mode of the hydroxyl groups by Fermi resonance with overtones of the OH deformation modes. At low coverage, only the A (∼2950 cm−1) and B (∼2500 cm−1) components are clearly seen. A band at 1620 cm−1 is assigned to the in plane OH bending mode of hydrogen bonded methanol (shifted up from 1346 cm−1 in methanol vapour48).
Beyond 20 seconds (blue traces), the spectral features of hydrogen bonded methanol are lost, the ν(OH) bands of the acid sites continue to lose intensity, and spectral features due to surface methoxy groups (SMS) and hydrogen bonded dimethyl ether (DME) grow. In the ν(CH) region (inset in Fig. 2) bands due to SMS at 2977 cm−1 and 2867 cm−1 appear before those of DME (3011, 2960, 2945 and 2836 cm−1). These assignments are based on previous literature and experiments with DME at lower temperatures (Table 2). The most distinct marker of DME formation is the symmetric CH3 stretching mode at 2836 cm−1; this appears and grows after the SMS first appear. DME formation is observed in MS analysis of evolved products, shown in ESI† Fig. S7 (Fig. S6† shows MS analysis from a blank experiment when DME was flowed through the empty cell at 573 K). The ABC features of the acid site hydroxyl groups hydrogen bonded to DME differ from those seen initially with methanol (blue traces in Fig. 2). The B component is shifted to lower frequency and the much more intense C component (also shifted to lower frequency) is further split by an Evans hole at ∼1650 cm−1. These differences relate to the effects of increased hydrogen bonding strength on both the stretching and bending modes of the hydroxyl groups. Also evident in the blue traces is a sharp band at 1456 cm−1 due to a δ(CH3) mode of the DME. These experiments indicate that the sequence occurring on injection of methanol into SAPO-34 at 523 K is: (i) adsorption of methanol on the acid sites, (ii) dissociation of methanol to SMS and (iii) methylation of methanol by SMS to form DME.
| ν asymm(CH3)/cm−1 | Combination bands/cm−1 | ν symm(CH3)/cm−1 | δ(CH3)/cm−1 | Ref. | |
|---|---|---|---|---|---|
| Asterisks (*) mark the results from this work (±2 cm−1). a The 2140 cm−1 band has been assigned to an overtone of the CD3 symmetric bending mode of SMS-d3 or a combination of this mode with the CO stretching mode, enhanced by Fermi resonance based on ref. 48.b The crystalline solid contains additional splittings due to factor group effects. | |||||
| CH3OZ | 2977 (2210) | (2140)a | 2867 (2095) | 1455 | SAPO-34* |
| 2978 | 2868 | 1457 | SAPO-34 (ref. 41) | ||
| 2980 (2203) | 2868 (2100) | ZSM-5 (ref. 53) | |||
| 2980 (2233) (2220) | 2870 (2070) (2070) | ZSM-5* | |||
| ZSM-5 (ref. 55) | |||||
| CH3OH H-bonded | 3003, 2957 (2230) | 2844 (2080) | SAPO-34* | ||
| 3005, 2953 | 2845 | SAPO-34 (ref. 56) | |||
| 3003, 2958 | 2853 | SAPO-34 (ref. 47) | |||
| CH3OH(g) | 3010, 2982 (2232) | 2875 (2094) | This work* and ref. 49 | ||
| CH3OCH3 H-bonded | 3011, 2960, 2945 (2225) | (2134) | 2836 (2072) | 1456 | SAPO-34* |
| 3012, 2944 (2221) | 2840 (2070) | SAPO-34 (ref. 41) | |||
| 3000, 2943 | 2830 | SAPO-34 (ref. 47) | |||
| CH3OHCH3+ | 3030, 2963 | 2845 | SAPO-34* | ||
| CH3OCH3 (solid)b | 2987, 2922 | 2818 | 57 | ||
| (CH3OCH3)2H+ SbCl6 salt | 3037, 3010, 2955 | 2847 | 54 | ||
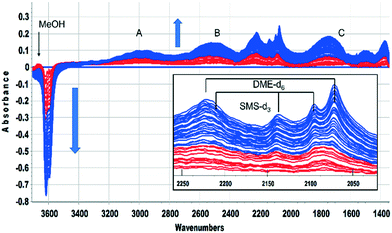
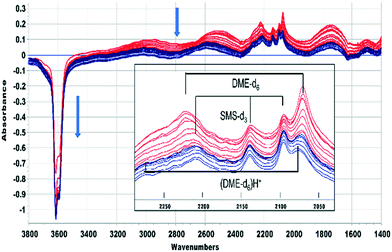
This was confirmed by performing the same experiment with CD3OH. The corresponding infrared spectra are shown in Fig. 3. The initial spectra (red traces) are those of hydrogen bonded CD3OH, but this is quickly replaced by SMS-d3 and hydrogen bonded DME-d3 (blue traces). Deuterated SMS show three bands in this region (2210, 2140, 2095 cm−1). The asymmetric stretching mode at 2210 cm−1 is overlapped by the asymmetric stretching mode of DME-d6 at ∼2230 cm−1, but the band at 2140 cm−1 (which is likely to be an overtone of the CD3 symmetric bending mode or a combination of this mode with the CO stretching mode, enhanced by Fermi resonance48) is a clear indicator of SMS formation occurring within 20 s of injection. The bands due to DME-d6 (2230, 2072 cm−1) appear and grow subsequent to the SMS-d3.
The literature suggests two different possible mechanisms for formation of DME from methanol in acid zeolites: a bimolecular (direct) reaction between two adsorbed methanol molecules, or sequential (indirect) methylation of methanol by a surface methoxy group. Our observations support the conclusion of Wang et al.49 from stopped-flow NMR studies on ZSM-5 that the sequential mechanism is operating: SMS are formed from methanol before DME is formed by methylation of methanol by SMS. Recent theoretical calculations also show that the indirect mechanism proposed here is more likely than the direct mechanism.50
On flowing nitrogen at 523 K for longer periods following injection of a methanol or methanol-d3 pulse the bands due to hydrogen bonded DME slowly decline, but there is no corresponding recovery of the acid site OH groups. This is illustrated in Fig. 4 for CH3OH which shows spectra recorded at 40 second intervals from 60 seconds after injection. The bands of hydrogen-bonded DME are completely lost 420 seconds following injection (colour change red to blue). The SMS bands remain unchanged during this time, but the spectra after 420 seconds show the presence of a third species (bands at ∼3030, 2965 and 2850 cm−1, identified in Fig. 4 as (DME)H+). The ABC profile characteristic of strongly hydrogen bonded OH groups is also modified, the 1455 cm−1 band due to CH3 deformation modes of H-bonded DME is lost and a new band appears in this region at 1470 cm−1.
A similar conclusion is reached from the spectra shown in Fig. 5 for CD3OH. The hydrogen bonded DME-d6 is lost after 420 seconds, but the SMS-d3 bands remain, and the new bands marked as (DME-d6)H+ are revealed. One difference from CH3OH is that the A and B components of hydrogen bonding shift to higher frequency as the bands of DME-d6 are lost. Desorption of hydrogen bonded DME on flushing at 523 K should recover the SAPO-34 acid sites involved in the hydrogen bonding. In fact, there is if anything a further loss of OH groups as the hydrogen bonded DME is removed, suggesting that the hydrogen bonded DME is being converted to the third species responsible for the new bands in Fig. 4 and 5.
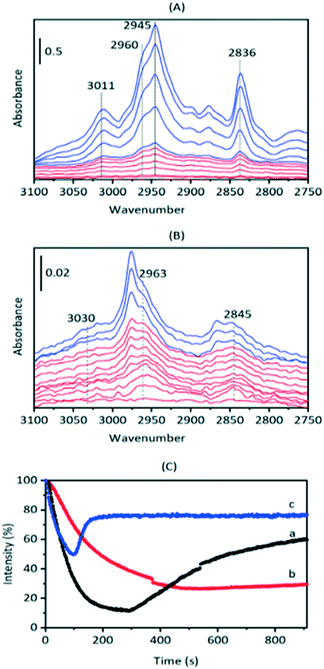
To investigate these residual bands further, SAPO-34 crystals were exposed to a continuous flow of DME at different temperatures. Full-range difference spectra are reported in the ESI† (Fig. S8). Fig. 6(A) shows an expansion of the ν(CH) region for difference spectra recorded when a SAPO-34 crystal was exposed to a continuous flow of DME at 473 K. The only species detected at this temperature is hydrogen bonded DME. The full range difference spectra show clearly the ABC triplet of this species (Fig. S7†). In the ν(CH) region bands at 3011, 2960, 2945 and 2836 cm−1 which grow in intensity on initial exposure to DME are similar to those of hydrogen bonded DME in HZSM-5 (Table 2) and match those seen to form from methanol in SAPO-34 at 523 K (Fig. 2). At 473 K the hydrogen-bonded DME bands were removed on subsequent flushing, leaving a very weak residual spectrum of SMS (Fig. S8†).
Hydrogen-bonded DME is not observed at all when a SAPO-34 crystal is exposed to DME at 573 K (Fig. 6(B), full range spectra Fig. S9†). At this temperature, the first bands to appear are those at higher frequency (3030, 2963, 2845 cm−1) which were seen to remain after methanol injection at 523 K, followed by the SMS bands at 2977 and 2867 cm−1 which continue to grow in intensity over the initial 100 seconds. At later times, the SMS react to form olefins and olefin oligomers, as discussed further below.
We suggest that the bands appearing before the SMS on exposure to DME at 573 K and remaining after desorption of hydrogen-bonded DME formed from methanol at 523 K are due to protonated DME. Formation of SMS from methanol is considered to occur via protonation of the neutral molecule,51 although spectroscopically complete proton transfer to methanol is seen only at high methanol coverages in HZSM-5.52 Formation of SMS from DME would also be expected to occur via the protonated molecule, and recent theoretical calculations have indicated that complete proton transfer occurs from the acid sites in ZSM-5 to DME.50
The behaviour of the ν(OH) bands on exposure to DME (Fig. 6(C)) also fits this picture of two forms of adsorbed DME: H-bonded DME and protonated DME. At 473 K hydrogen bonding of DME is the dominant process, causing rapid loss of ν(OH) intensity which is partially recovered over the subsequent 600 s as the H-bonded DME is slowly desorbed. At 523 K, loss of ν(OH) intensity is considerably slower, consistent with competing formation and desorption of H-bonded DME, activated protonation of DME and formation of SMS. At 573 K, as seen in Fig. 6(B), the loss of ν(OH) intensity is due mostly to formation of SMS (via protonated DME) which occurs rapidly at this temperature. The rapid recovery of ν(OH) intensity after ∼120 s is due to further reaction of the SMS to form oligomeric species, which releases OH groups as discussed below.
The bands originally assigned by Forester and Howe53 to protonated DME in HZSM-5 were subsequently shown by Zecchina et al. to be due to hydrogen-bonded DME (particularly from analysis of the ABC triplet),52 and these match closely those seen here and assigned to hydrogen-bonded DME in SAPO-34. The bands at 3030, 2963 and 2845 cm−1 seen following methanol injection at 523 K (Fig. 4) and DME injection at 573 K (Fig. 6(b)) are shifted upwards by a further ∼10–20 cm−1 from those of the hydrogen-bonded DME. We suggest that these shifts are consistent with proton transfer to the DME. Similar upward shifts are seen in the ν(CH) frequencies of DME in the protonated salt (DME)2H+SbCl6− (Table 2) and attributed to a decreased perturbation of CH bonds by oxygen lone-pairs in the protonated DME.54 The corresponding frequency shifts in the ν(CD) region for adsorbed methanol-d3 (Fig. 5) support these observations. The extent of proton transfer in SAPO-34 is uncertain; the ν(CH) frequencies calculated for fully protonated DME in ZSM-5 are considerably higher than those seen here,52 but the full range spectra of DME at 573 K (Fig. S8†) show little evidence of hydrogen bonding.
The chemistry occurring on initial injection of methanol into HSAPO-34 at 523 K or above is thus an interplay of SMS formation from methanol via protonated methanol (not observed), methylation of methanol by SMS to form DME, hydrogen bonding of DME, and SMS formation from DME via protonated DME (which is observed). Scheme 2 illustrates this chemistry.
The formation of SMS from methanol and/or DME is crucial to the subsequent carbon–carbon bond forming chemistry described in the following section.
Reactivity of surface methoxy groups
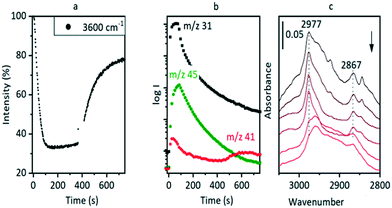
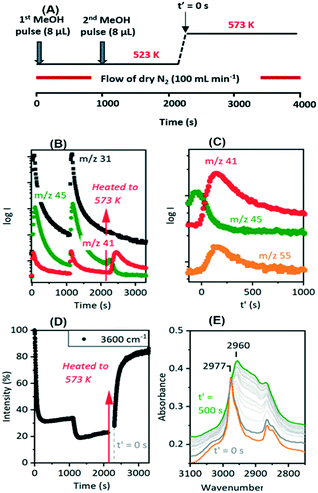
Hydrocarbon formation from methanol is first observed in these SAPO-34 crystals at 573 K. Injection of methanol into a SAPO-34 crystal at 573 K produces propene product in MS analysis following an induction period of ∼450 seconds. This is illustrated in Fig. 7 (full range spectra are plotted in Fig. S10†). Initial injection of methanol causes a rapid loss of OH groups correlating with formation of SMS and hydrogen bonded DME. In the MS analysis, DME is evolved very shortly after methanol. The selected ν(CH) spectra show initial formation of SMS (2977 and 2867 cm−1) and hydrogen-bonded DME as discussed above. The DME is completely lost after 300 seconds without any recovery of ν(OH) intensity, and the ν(CH) spectrum at this point shows SMS plus the third species identified above as protonated DME.The appearance of propene in the MS analysis and recovery of ν(OH) intensity beyond 450 seconds correlates with a complete change in the ν(CH) profile. These changes are very similar to those seen when methanol is injected into a ZSM-5 crystal at 573 K.36 There are two significant differences from ZSM-5: the induction period for propene formation is considerably longer in SAPO-34 than in ZSM-5, and the evolution of propene occurs more slowly.
The ν(CH) profile observed following propene evolution from SAPO-34 matches closely that obtained when propene is reacted in SAPO-34. This is illustrated in Fig. 8. The ν(CH) profiles seen for methanol and propene reacting in SAPO-34 closely resemble those seen in similar experiments with ZSM-5 crystals.36
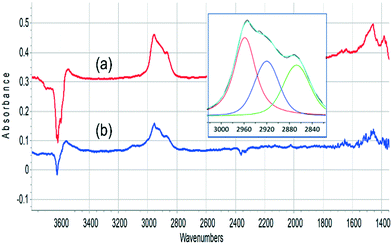
The oligomerisation of propene in HZSM-5 has been extensively studied by both infrared spectroscopy,58–61 and (more recently) inelastic neutron scattering.62–64 The chemistry of oligomerisation involves protonation of propene at a Brønsted acid site followed by further chain propagation to form alkoxy species.63 The ν(CH) profile of these alkoxy species contains contributions from CH3 and CH2 asymmetric and symmetric ν(CH) modes (2960, 2925, 2870 and 2850 cm−1 respectively), while at lower frequency CH3 and CH2 bending modes occur around 1460 cm−1.65 The SAPO-34 crystal exposed to propene at 523 K or to methanol at 573 K shows the expected ν(CH) profile for oligomeric alkoxide (the symmetric CH3 and CH2 modes cannot be resolved in the curve fitting) while the deformation modes, which are expected to be less intense than the stretching modes,65 are seen as weaker features ∼1460 cm−1.
The reaction sequence occurring at 573 K involves SMS reacting to form olefins and/or surface bound alkoxide and releasing acid OH groups, which can be formally represented as:
| n(ZOCH3) → (n − 1)ZOH + ZOCnH2n+1 or |
| n(ZOCH3) → nZOH + (n/3)C3H6 |
The evolution of olefins was accompanied by recovery of ν(OH) band intensity and changes in the ν(CH) band profile similar to those described above in Fig. 7viz. loss of SMS and growth of the bands due to oligomeric alkoxide species. The alkoxide bands continued to grow in intensity for 500 seconds following the temperature jump, whereas the gas phase propene and butene signals in the MS reached a maximum after ∼200 seconds and then decayed, suggesting strongly that at this temperature the olefins are formed directly from the SMS rather than through cracking of the alkoxide species, and that the alkoxide species are formed subsequently by oligomerisation of olefins.
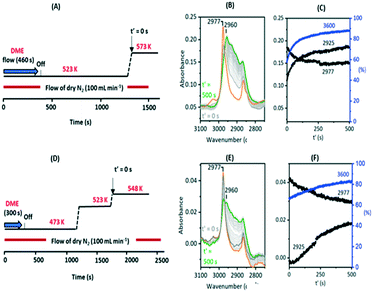
Fig. 10 shows two temperature jump experiments performed with DME. Full spectra are shown in Fig. S12 and S13.† The first of these (Fig. 10(A)) used a similar protocol to that for methanol in Fig. 9. DME was flowed for 460 s at 523 K, the cell flushed with nitrogen for a further 900 s, then the temperature ramped to 573 K. Immediately prior to the T-jump the spectrum is dominated by the SMS bands at 2977 cm−1 and 2867 cm−1, although traces remain of the bands assigned above to protonated DME (3030, 2963, 2845 cm−1, the orange trace). These are lost immediately following the T-jump, the SMS bands quickly decay, the 3600 cm−1 OH band intensity recovers, and the ν(CH) region evolves as for methanol in Fig. 9. The intensity at 2925 cm−1 where there is no contribution from the SMS is plotted to show that the growth of the new ν(CH) profile of alkoxide species correlates with recovery of ν(OH) intensity and the loss of SMS, just as it does with methanol.
This experiment does not allow us to completely eliminate the possibility of olefin formation from reaction of SMS with residual (protonated) DME. By altering the experimental protocol however it was possible to obtain a crystal containing only SMS with no trace of residual DME, illustrated in Fig. 10(E) (full range spectra shown in Fig. S13†). This was achieved by introducing a 300 second pulse of DME at 473 K, flushing at this temperature for 900 seconds, ramping to 523 K for 500 seconds then to a final temperature of 548 K. The ν(CH) spectrum initially at 548 K shows only the SMS bands (orange trace), which are much weaker than those formed at higher temperatures, but these bands are thereafter gradually lost as ν(OH) intensity is recovered and the alkoxide bands (monitored by the intensity at 2925 cm−1) grow, These changes occur more slowly than at 573 K and residual SMS bands can still be seen after 500 seconds at 548 K. This second experiment confirms that conversion of SMS to alkoxide and recovery of OH groups does not require the presence of adsorbed DME.
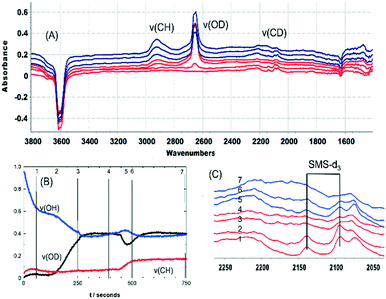
The recovery of OH groups at the point where SMS bands are lost, alkoxide bands grow and olefins are detected in the MS analysis (Fig. 7 and 9) is due to the breaking of CH bonds of the SMS. This can be seen from experiments with CD3OH. Fig. 11 plots selected spectra and band intensities versus time following injection of CD3OH at 573 K. Injection of the first pulse of CD3OH produces initially SMS-d3 and DME-d6, causing loss of OH groups (trace 1 in (A) and (C)). The ν(CD) bands appearing initially are similar to those seen at 523 K in Fig. 3 above, although the amount of hydrogen bonded DME is less at 573 K. After 140 seconds the hydrogen bonded DME is lost, protonated DME-d6 is seen together with SMS, and ν(OD) bands begin to appear at 2650 and 2660 cm−1 (trace 2). As plotted in Fig. 11(B) growth of the 2650 cm−1 band is accompanied by a further loss in intensity of the ν(OH) band. At the same time the ν(CD) bands of SMS-d3 are removed (Fig. 11(C) traces 3 and 4), and a new broad band appears in the ν(CH) region at ∼2920 cm−1.
The growth of ν(OD) bands coincident with loss of the SMS-d3 bands is consistent with the breaking of CD bonds in the SMS generating new OD groups. Following the chemistry described above, this process should generate perdeuterated olefins and alkoxide species. The accompanying further loss of ν(OH) intensity and the appearance of a new ν(CH) band further indicates that hydrogen from the OH groups is being incorporated into the alkoxide species. Scheme 3 shows a possible pathway for exchange between propene-d6 and the OH groups producing propene-d5 and partially H-substituted alkoxide oligomers.
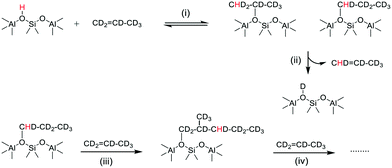 | ||
| Scheme 3 Chain propagation with H incorporation into propene-d6 alkoxide oligomers. (i) Protonation of propene-d6, (ii) elimination of propene-d5, (iii) and (iv) further reaction of propene. | ||
In a separate experiment performed at 623 K, shown in Fig. S14,† MS analysis detected propene-d5 coincident with generation of OD groups. The partially deuterated alkoxide species in Fig. 11 show a different ν(CH) profile from the non-deuterated species (Fig. 8). The 2920 cm−1 band dominating this profile is assigned to the ν(CH) mode of –CHD– groups in the alkoxide chains. DFT calculations of vibrational frequencies for various possible H substitution models support this assignment (Fig. S17†).
As seen in the blue set of spectra (Fig. 11), addition of a second pulse of CD3OH generates considerably more of this partially exchanged alkoxide species. Formation of further SMS-d3 by reaction of CD3OH with OH and OD groups during this second pulse (trace 5) will release H2O and HDO which can further exchange with the alkoxide species. The changes in ν(OH) and ν(OD) band intensities accompanying the growth of the 2920 cm−1 band during this second pulse (Fig. 11(B)) support this explanation. Also evident in the spectra is the growth of a band at ∼1460 cm−1 which is attributed to deformation modes of CH and CH2 groups in the partially exchanged alkoxide groups. The bands remaining in the ν(CD) region after addition of the second pulse of CD3OH (trace 7) will be those of the partially H substituted alkoxide, but the overlapping of these bands (and the relative weakness of ν(CD) modes compared with ν(CH) modes) precludes a detailed analysis.
The incorporation of hydrogen from both the SAPO-34 acid sites and the methanol OH into the alkoxide species was confirmed by comparing spectra obtained from reaction of CH3OH, CD3OH and CD3OD with HSAPO-34 and CD3OD with DSAPO-34, shown in Fig. S15.† In particular, very little hydrogen exchanged alkoxide is seen when CD3OD is reacted with a SAPO-34 crystal which has been 75% D exchanged with D2O prior to reaction.
A further important point from these experiments with CD3OH is that no evidence is seen for exchange between SMS-d3 and hydrogen from the OH groups of the SAPO-34 or the methanol. The absence of exchange between SMS and SMS-d3 in SAPO-34 was taken by Marcus et al.66 as evidence that the CH bonds of SMS in SAPO-34 do not break and that carbene species are not formed. The experiments here show conclusively that CH bond breakage in the SAPO-34 SMS does occur and the absence of exchange means that this process is irreversible (this point was also made by Wang and Hunger from earlier 13C NMR studies).26
The correlations observed here between loss of SMS, recovery of OH groups (or formation of OD groups in the case of CD3OH) and appearance of olefins all fit with a model of SMS behaving as a carbene precursor rather than as a methylating agent in the initial C–C bond forming chemistry, i.e. C–H bond activation rather than C–O bond activation of the SMS.
Hutchings et al. proposed that deprotonation of SMS could form a surface bonded methyloxonium ion, isoelectronic with a carbene, which would react with methanol to form either ethene and water or methane and formaldehyde.29 Wang et al. showed that SMS could behave both as a carbene (e.g. insertion onto a CH bond of cyclohexane to form methylcyclohexane) or as a methylating agent (e.g. addition to toluene to form xylenes).26 Carbene-like behaviour of SMS was also reported in infrared studies by Yamazaki et al.,67 who showed that methylation of ethene by SMS-d3 produced CD2HCH![[double bond, length as m-dash]](https://www.rsc.org/images/entities/char_e001.gif) CH2. Involvement of carbene species in carbon–carbon bond formation was also considered in early discussions of MTH mechansisms,27 and supported by experiments with diazomethane by Lee and Wu, who showed that ethene was formed upon diazomethane decomposition over acid zeolites.68
CH2. Involvement of carbene species in carbon–carbon bond formation was also considered in early discussions of MTH mechansisms,27 and supported by experiments with diazomethane by Lee and Wu, who showed that ethene was formed upon diazomethane decomposition over acid zeolites.68
Formation of a bound carbene species by deprotonation of SMS was first considered theoretically by Sinclair and Catlow,69 who estimated an activation barrier for this process of between 215 and 232 kJ mol−1 (compared with the activation energy for hydrocarbon formation of 195 kJ mol−1). More recently, Lesthaeghe et al. have calculated a higher activation barrier for SMS deprotonation (245 kJ mol−1) and concluded that the bridging oxide ions in a zeolite are insufficiently basic to make proton abstraction a feasible pathway.70,71 Nastase et al. also find formation of an isolated carbene species to be energetically implausible, but suggest that involvement of carbene species in carbon–carbon bond formation may occur via a concerted process rather than step-wise.50
Comparison of the time evolution of the spectra seen with CD3OH (Fig. 11) and CH3OH (Fig. 7) at 573 K reveals that CD3OH reacts more quickly than CH3OH. The induction time for CH(D) bond breakage and olefin/alkoxide formation at 573 K is ∼150 s for CD3OH and ∼400 s for CH3OH. This difference indicates an inverse kinetic isotope effect is operating, consistent with formation of an OH(D) bond which is stronger than the CH(D) bond broken. The absence of any reversible exchange between SMS-d3 and zeolite protons suggests that the inverse isotope effect is kinetic rather than thermodynamic. This can be explained by a mechanism in which the transition state for SMS dissociation lies close to the final state (as is the case in the calculated reaction profile of Sinclair and Catlow69).
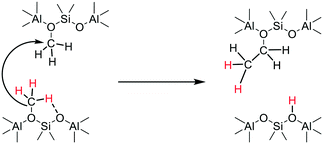
The experiments (e.g.Fig. 10) showing that deprotonation of SMS can occur in the absence of adsorbed methanol or dimethyl ether, rule out a reaction between SMS and adsorbed methanol or dimethyl ether as the key carbon–carbon bond forming step.29,36 These findings are consistent with the stopped-flow NMR experiments of Wang et al. which showed hydrocarbon formation directly from SMS in zeolites HY, HZSM-5 and HSAPO-34.26,28 We therefore have to consider a mechanism for initial carbon–carbon bond formation which involves only SMS. Scheme 4 envisages insertion of a carbene formed by SMS deprotonation into the CH bond of an adjacent SMS to form ethoxide, occurring in a concerted manner rather than step-wise.72
Carbene insertion into CH bonds is a well-known route to carbon–carbon bonds in synthetic organic chemistry.73 This mechanism requires two SMS to be present in the same cha cage of the SAPO-34 structure. The SAPO-34 contains on average only about 0.9 acid site per cha cage, so that the probability of this initiation reaction is low in the absence of any mobility of either SMS or carbene species. Calculations show that SMS have a very low mobility in zeolites although adsorbed carbene species may be more mobile.50 Once formed however, the ethoxide will quickly eliminate ethene. Kondo et al. showed that ethoxide species formed in ZSM-5 decomposed completely above 493 K.74
Ethene can readily diffuse through the SAPO-34 pores and become methylated by SMS to form propene via the carbene insertion shown by Yamazaki et al., illustrated in Scheme 5. The diffusion of ethene and propene between the cha cages in SAPO-34 has been shown both theoretically and experimentally to be facile and enhanced by the presence of acid protons.75 The propene may be evolved as an initial gas phase product or diffuse and be further methylated, forming longer chain alkyl species.
 | ||
| Scheme 5 Propagation of C–C bond forming reaction through carbene-like insertion into CH bond of ethene (as demonstrated in ref. 67). | ||
In this description, the carbon–carbon bond formation chemistry can be regarded as autocatalytic. The difficult initiation step of forming the first olefins is followed by rapid propagation throughout the crystal with ethene and propene acting as mobile vectors of carbon–carbon bond formation, as summarised in Scheme 6 below. Higher olefins will be less mobile and more likely to form alkoxide species, although these may subsequently crack to form more light olefins at higher temperatures.
 | ||
| Scheme 6 Suggested steps in the olefin-driven propagation of C–C bond forming reactions through the SAPO-34 crystal. | ||
The induction time for initiation of this chemistry reflects the low probability of the initiation step, requiring two SMS in the same cha cage or possibly limited mobility between two adjacent cages. The induction time decreases as the reaction temperature is raised, for example with a single 8 μL pulse of methanol it falls from 366 seconds at 573 K to ∼25 s at 673 K. We have reported elsewhere that when the acid site concentration in the same SAPO-34 crystals is reduced by steam treatment the induction time further increases,45 consistent with the above suggestions.
Lin et al. have recently presented a similar autocatalytic scheme for methanol conversion in ZSM-5 in which initially formed olefins ignite the first autocatalytic cycle.75 They propose however that the autocatalysis is initiated by reaction of SMS with DME. The experiments described here show that in SAPO-34 the presence of DME is not required to initiate the autocatalysis.
Formation of the hydrocarbon pool
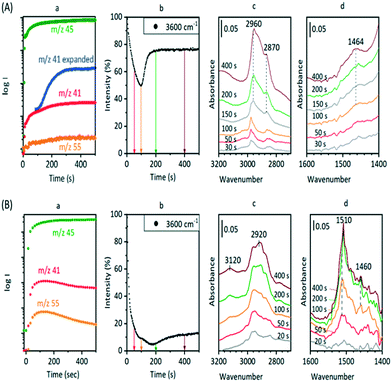
The experiments described above relate to the first carbon–carbon bonds formed on initial exposure of SAPO-34 crystals to methanol or dimethyl ether at 573 K and show that the predominant adsorbed species present initially are alkoxides. We have also performed experiments at longer reaction times and at higher temperatures to investigate species found under conditions closer to those of practical MTO catalysis. Fig. 12 compares MS analyses, ν(OH) intensities and selected spectra from SAPO-34 (Fig. 12(A)) and ZSM-5 (Fig. 12(B)) crystals exposed to a continuous flow of DME at 573 K.In the case of ZSM-5, the MS analysis shows propene and butene appearing and then slowly declining over 500 seconds, the propene contribution to the m/z = 41 MS intensity being superimposed on the contribution from DME fragmentation. The ν(OH) intensity falls rapidly then recovers only slightly at longer reaction times. In ZSM-5, as discussed elsewhere,39 the alkoxide species formed initially are converted into dimethylcyclopentenyl cations (DMCP). The assignment to DMCP was based on the close similarity of the frequencies to the published frequencies of this species in the gas phase76 and the NMR identification by Haw et al. of 1,3-DMCP as the first cyclic species to be formed from DME in ZSM-5.77 In ZSM-5 the build-up of cyclic alkenyl cations during the first 400 seconds of exposure to DME is irreversibly depleting the population of zeolite OH groups and the catalyst begins to poison.
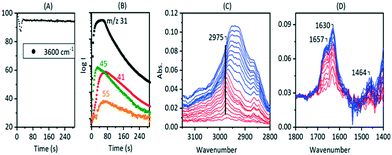
In SAPO-34, the formation of propene and butene is much less distinct than in ZSM-5, but a rise in the m/z = 41 signal above the contribution from DME fragmentation (see blank experiment with DME in ESI† Fig. S6) is seen to accompany the growth of a weak m/z = 55 signal due to butene, and to correlate with the recovery of ν(OH) intensity and conversion of SMS to alkoxide species. However, there is no evidence for the formation of the DMCP cation in SAPO-34 at this temperature. The only band detected in the 1600–1400 cm−1 region is at ∼1464 cm−1, which is most likely due to CH bending modes of the alkoxide oligomers. Qian et al.41 in their IR microspectroscopy study of SAPO-34 exposed to a continuous flow of methanol at 553 K attributed a band at this frequency to ν(C–C) vibrations of either polyalkyl benzenium cations or alkylated polyaromatic species (supported by observation of a band at 400 nm in the UV-VIS spectrum). However, polyalkyl benzenium and alkylated polyaromatic species also show ν(C–C) vibrations at higher frequencies, and these were not observed by Qian et al. An alternative assignment of the 1464 cm−1 band to the asymmetric C![[double bond, length as m-dash]](https://www.rsc.org/images/entities/char_e001.gif) C–C stretching mode of cycloalkenyl cations cannot be completely ruled out. As noted above, this vibration in the 1,3-dimethylcyclopentenyl cation formed in HZSM-5 occurs at 1510 cm−1.39 The more recent study of cyclic and acyclic alkenyl cations both in acidic solution and in zeolites by Hernandez and Jentoft78 confirmed this assignment, but pointed out that methyl substitution in the 2 position in the cyclopentenyl cation in acid zeolites shifts the C
C–C stretching mode of cycloalkenyl cations cannot be completely ruled out. As noted above, this vibration in the 1,3-dimethylcyclopentenyl cation formed in HZSM-5 occurs at 1510 cm−1.39 The more recent study of cyclic and acyclic alkenyl cations both in acidic solution and in zeolites by Hernandez and Jentoft78 confirmed this assignment, but pointed out that methyl substitution in the 2 position in the cyclopentenyl cation in acid zeolites shifts the C![[double bond, length as m-dash]](https://www.rsc.org/images/entities/char_e001.gif) C–C stretching frequency lower, to 1493 cm−1, for tetramethyl(n-propyl)cyclopentenyl. The corresponding vibration in the 1,2,3,4-tetramethylcyclobutenyl cation in acid solution76 is shifted even lower, to 1465 cm−1, although this species has not hitherto been identified in a zeolite. If the 1464 cm−1 band in SAPO-34 is due to cycloalkenyl cations it does not correlate at all with the initial formation of carbon–carbon bonds or evolution of initial olefin products.
C–C stretching frequency lower, to 1493 cm−1, for tetramethyl(n-propyl)cyclopentenyl. The corresponding vibration in the 1,2,3,4-tetramethylcyclobutenyl cation in acid solution76 is shifted even lower, to 1465 cm−1, although this species has not hitherto been identified in a zeolite. If the 1464 cm−1 band in SAPO-34 is due to cycloalkenyl cations it does not correlate at all with the initial formation of carbon–carbon bonds or evolution of initial olefin products.
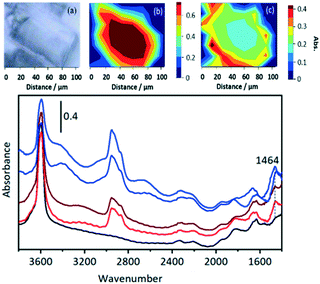
In a further comparison with the experiments of Qian et al.,41 the distribution of OH groups (as measured by the ν(OH) intensity) and hydrocarbon species (as measured by the ν(CH) intensity at 2955 cm−1) was mapped in a SAPO-34 crystal exposed to a continuous flow of DME for 1000 s at 573 K (Fig. 13).
The distribution of OH groups within the crystal (Fig. 13(b)) is uniform within the crystal, but there is loss of OH intensity in the outer edges of the crystal after reaction (in comparison with the fresh crystal spectrum in black). In the ν(CH) region, Fig. 13(c), the concentration of oligomer species in the centre of the crystal is approximately half that at the edges. The higher concentration of oligomer species at the rim (and hence reduced OH intensity) reflects the diffusion restrictions on DME reaching the centre of the crystal during continuous flow due to the pores being partially blocked with oligomeric alkoxide species. Selected spectra from the hyperspectral map (Fig. 13) taken from the crystal outer edge (blue traces) and interior (red traces) show no differences in the nature of the adsorbed species present.
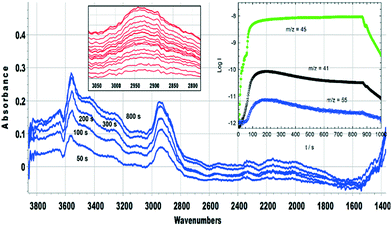
Fig. 14 (inset) shows MS data for an experiment in which SAPO-34 was exposed to a continuous flow of DME at 673 K for 900 seconds. The yields of propene and butene are considerably higher than those from the corresponding experiment at 573 K (Fig. 12), but decay throughout the 900 seconds. The difference spectra recorded at the times marked on the figure show several important differences from those measured at lower temperatures. The fraction of OH groups lost throughout the measurement is less than 10% of the total, and the appearance of a positive feature on the low frequency side of the n(OH) band indicates that some of that loss is due to weak hydrogen bonding with adsorbed species. No spectroscopic signature of SMS can be seen during the first 20 seconds of exposure to DME; the broad n(CH) profile centred on ∼2930 cm−1 which appears after 2 seconds of exposure grows in intensity thereafter without changing shape. This profile has no resolved components and looks quite different from the spectroscopic signature of oligomeric alkoxides seen at lower temperatures with both methanol and DME (e.g.Fig. 8). The breadth of the n(CH) band makes it impossible to identify the species responsible other than that they contain sp3 CH bonds. Given the wealth of NMR and UV-VIS evidence in the literature for the presence of alkyl cycloalkenyl and aromatic carbocations in the hydrocarbon pool found in SAPO-34 reacted at high temperatures, it may be that the n(CH) profile observed here arises from such alkyl groups in the hydrocarbon pool. The rising of the baseline at high frequencies (seen in the wide-range spectra in Fig. S16†) is consistent with the onset of electronic absorption bands in the visible and near-infrared expected for these species, although none of the characteristic ν(CC) modes can be seen below 1700 cm−1. What is clear is that the ν(CH) profile of the hydrocarbon pool appears before butene and propene appear in the MS analysis, indicating that at this temperature the olefins formed in continuously flowing DME are generated indirectly from the hydrocarbon pool rather than directly from SMS as seen at 573 K. The formation of the hydrocarbon pool from DME at 673 K is occurring too rapidly to be seen in the infrared measurements (within 2 seconds).
Fig. 15 shows MS analysis and selected spectra from an experiment in which a pulse of methanol was injected into SAPO-34 crystals at 673 K. The first formation of propene and butene is detected in the MS analysis after an induction period of ∼25 seconds, whereas DME formation is coincident with the methanol injection.
The full-range spectra recorded after injection of three successive methanol pulses at 673 K (Fig. S16†) are similar to those seen with DME at the same temperature with the exception of the appearance of new bands in the 1700–1600 cm−1 region which were not seen at all with DME. The initial spectra seen on injecting the first pulse of methanol shown in Fig. 15 reveal more differences from DME. The first species formed on methanol injection at 673 K are SMS, with the characteristic νasym(CH3) band at 2977 cm−1 marked in the figure. After 20 seconds (colour change from red to blue in Fig. 15) this evolves initially to the ν(CH) profile seen at lower temperatures, assigned to oligomeric alkoxide species (Fig. 8), but this immediately broadens and shifts to lower frequency to resemble more closely the profile seen with DME at 673 K (Fig. S16† inset). In the 1700–1400 cm−1 region the new bands comprising 1630 cm−1 and a shoulder at higher frequency grow in intensity during the first 20 seconds then remain constant thereafter. The spectra at longer times and following second and third pulses of methanol (Fig. S16†) show that these new bands decline in intensity.
The initial spectra during injection of the first methanol pulse at 673 K showing conversion of SMS to alkoxide correlating with propene and butene appearance indicate that the direct olefin formation chemistry described above at lower temperatures is also occurring initially here. Thereafter however the ν(CH) spectra suggest that hydrocarbon pool species seen with DME dominate and olefin formation is likely to be indirect. The immediate appearance of bands at 1630 and ∼1660 cm−1 on first injection of methanol at 673 K was not seen at lower temperatures and requires explanation.
Detailed NMR studies of SAPO-34 reacted with methanol at 673 K for 30 minutes show clearly the formation of acetate and formate species at this temperature as well as methylated polyenes and benzenes,35 supporting the suggestions of CO insertion into SMS as a route to C–C bond formation. Liu et al. suggested CO was generated by reaction of methanol with the walls of the reactor at high temperatures.34 Wen et al. captured formaldehyde during methanol conversion over ZSM-5 and SAPO-34 at 723 K using photo-ionisation mass spectrometry, but although they observed formaldehyde formation in blank experiments without catalyst, they considered that the reaction of SMS with methanol to form formaldehyde and methane was the primary route to initial carbon–carbon bond formation at 723 K.79 Formaldehyde formation at much lower temperatures (>523 K) was reported for methanol in HZSM-5 by Liu et al.,80 who assigned infrared bands at 1630, 1700 and 1730 cm−1 to adsorbed water, acetate and formate species respectively.
The band at 1630 cm−1 seen in Fig. 15 to grow in intensity following initial injection of methanol into SAPO-34 at 673 K cannot be due to adsorbed water, which would not persist in the zeolite at this temperature. An alternative explanation for this band comes from infrared studies of DME carbonylation over HMOR zeolite catalysts at 473 K.81 Li et al. assigned a band at 1630 cm−1 to bound acetyl species formed by insertion of CO into SMS species formed in a mordenite zeolite.81 Given the literature evidence for high temperature formation of CO during methanol conversion, we may consider that such CO insertion chemistry is occurring during the experiment described in Fig. 15. Nevertheless, it must be pointed out that the growth of the 1630 cm−1 band does not correlate at all with the growth of SMS on initial injection of methanol or the first appearance of olefins, and it is not seen at all in the DME experiment at 673 K (Fig. S16†), suggesting that this species is not involved in the initial direct formation of olefins.
Conclusions
The key finding from this work is that the chemistry responsible for direct olefin formation in the initial stages of methanol conversion over single crystals of SAPO-34 is closely similar to that previously proposed for methanol conversion over single crystals of HZSM-5, notwithstanding the weaker acid site strength of the hydroxyl groups in SAPO-34. Surface methoxy groups play a central role in both catalysts, and carbon–carbon bond formation is initiated by deprotonation of the methoxy groups and carbene insertion into adjacent methoxy groups and not by reaction of methoxy groups with adsorbed methanol or dimethyl ether. We propose here that that the long induction period for olefin formation at lower temperatures is determined by the low probability of encounter between methoxy groups, and that, as also proposed by Lin et al.80 it is initially formed olefins which propagate the carbon–carbon bond forming chemistry throughout the crystal, leading to hydrocarbon pool formation through an autocatalytic route.We note further that our ability to observe this initial chemistry in both SAPO-34 and HZSM-5 is dependent both on the advantage of the synchrotron microspectroscopic technique employed (rapid scanning of spectra from individual crystals coupled to MS analysis of products) and on the fact that the reactions involved occur more slowly in the large crystals that the technique requires than in the sub-micron sized crystals typically employed in MTO catalysis and in other macroscopic spectroscopic characterisation experiments.
In these studies, the initial hydrocarbon pool species detected are alkoxide species which may be regarded as incipient olefin pool species. There is little evidence with the large crystals of SAPO-34 used here for cyclic hydrocarbon pool species, but this illustrates a limitation of the technique. The rapid deactivation of the large crystal catalysts at higher temperatures has precluded detailed study of the indirect formation of olefins which is the pathway operating in steady state MTO catalysis.
Nevertheless, developments of the technique to achieve higher time resolution, improved signal to noise and smaller spot sizes offer the hope of extending studies of this kind closer to the conditions of the working catalyst for MTH and other catalytic chemistries.
Data availability
The research data supporting this publication can be accessed at https://doi.org/10.17630/42adc9c0-c790-4b52-9ba9-846cfdfe4da9.Conflicts of interest
There are no conflicts to declare.Acknowledgements
IBM and PAW would like to thank the EPSRC and CRITICAT Centre for Doctoral Training for Financial Support (PhD studentship to IBM EP/I017008/1, and ESI† equipment grant EP/L016419/1). The UK Catalysis Hub is thanked for resources and support provided via membership of the UK Catalysis Hub Consortium and funded by EPSRC (grants EP/I038748/1, EP/I019693/1, EP/K014706/1, EP/K014668/1, EP/K014854/1, EP/K014714/1 and EP/M013219/1). We thank the Diamond Light Source for provision of beam time and support facilities at the MIRIAM beamline B22 (Experiments SM18680-1, SM 20906-1, SM 22347-1, SM23081-1).References
- C. D. Chang, Methanol to Hydrocarbons, Catal. Rev.: Sci. Eng., 1983, 25, 1–118 CrossRef CAS.
- S. Xu, Y. Zhi, J. Han, W. Zhan, X. Wu, T. Sun, Y. Wei and Z. Liu, Advances in Catalysis for Methanol-to-Olefins Conversion, in Advances in Catalysis, Elsevier, 2017, vol. 61, pp. 37–122 Search PubMed.
- P. Tian, Y. Wei, M. Ye and Z. Liu, Methanol to Olefins (MTO): From Fundamentals to Commercialization, ACS Catal., 2015, 5(3), 1922–1938 CrossRef CAS.
- M. Stöcker, Methanol-to-Hydrocarbons: Catalytic Materials and Their Behavior, Microporous Mesoporous Mater., 1999, 29(1–2), 3–48 CrossRef.
- J. F. Haw, W. Song, D. M. Marcus and J. B. Nicholas, The Mechanism of Methanol to Hydrocarbon Catalysis, Acc. Chem. Res., 2003, 36(5), 317–326 CrossRef CAS PubMed.
- S. Ilias and A. Bhan, Mechanism of the Catalytic Conversion of Methanol to Hydrocarbons, ACS Catal., 2013, 3, 18–31 CrossRef CAS.
- K. Hemelsoet, J. Van der Mynsbrugge, K. De Wispelaere, M. Waroquier and V. Van Speybroeck, Unraveling the Reaction Mechanisms Governing Methanol-to-Olefins Catalysis by Theory and Experiment, ChemPhysChem, 2013, 14, 1526–1545 CrossRef CAS PubMed.
- U. Olsbye, S. Svelle, K. P. Lillerud, Z. H. Wei, Y. Y. Chen, J. F. Li, J. G. Wang and W. B. Fan, The Formation and Degradation of Active Species During Methanol Conversion over Protonated Zeotype Catalysts, Chem. Soc. Rev., 2015, 44, 7155–7176 RSC.
- I. Yarulina, A. D. Chowdhury, F. Meirer, B. M. Weckhuysen and J. Gascon, Recent trends and fundamental insights in the methanol-to-hydrocarbons process, Nat. Catal., 2018, 1, 398–411 CrossRef CAS.
- H. Schulz, About the Mechanism of Methanol Conversion on Zeolites, Catal. Lett., 2018, 148, 1263–1280 CrossRef CAS.
- C. Wang, J. Xu and F. Deng, Mechanism of Methanol-to-hydrocarbon Reaction over Zeolites: A solid-state NMR Perspective, ChemCatChem, 2020, 12, 965–980 CrossRef CAS.
- M. E. Potter, Down the Microporous Rabbit Hole of Silicoaluminophosphates: Recent Developments on Synthesis, Characterization, and Catalytic Applications, ACS Catal., 2020, 10, 9758–9789 CrossRef CAS.
- X. Wu, S. Xu, Y. Wei, W. Zhang, J. Huang, S. Xu, Y. He, S. Lin, T. Sun and Z. Liu, Evolution of C–C Bond Formation in the Methanol-to-Olefins Process: From Direct Coupling to Autocatalysis, ACS Catal., 2018, 8, 7356–7361 CrossRef CAS.
- E. Borodina, H. S. H. Kamaluddin, F. Meirer, M. Mokhtar, A. M. Asiri, S. A. Al-Thabaiti, S. N. Basahel, J. Ruiz-Martinez and B. M. Weckhuysen, Influence of the Reaction Temperature on the Nature of the Active and Deactivating Species During Methanol-to-Olefins Conversion over H-SAPO-34, ACS Catal., 2017, 7, 5268–5281 CrossRef CAS PubMed.
- W. Dai, C. Wang, M. Dyballa, G. Wu, N. Guan, L. Li, Z. Xie and M. Hunger, Understanding the Early Stages of the Methanol-to-Olefin Conversion on H-SAPO-34, ACS Catal., 2015, 5, 317–326 CrossRef CAS.
- D. Xiao, X. Han, X. Bao, G. Hou and F. Blanc, Identification of different carbenium ion intermediates in zeolites with identical chabazite topology via 13 C–13C through-bond NMR correlations, RSC Adv., 2019, 9, 12415–12418 RSC.
- W. Dai, G. Wu, L. Li, N. Guan and M. Hunger, Mechanisms of the Deactivation of SAPO-34 Materials with Different Crystal Sizes Applied as MTO Catalysts, ACS Catal., 2013, 3, 588–596 CrossRef CAS.
- B. Arstad and S. Kolboe, The Reactivity of Molecules Trapped within the SAPO-34 Cavities in the Methanol-to-Hydrocarbons Reaction, J. Am. Chem. Soc., 2001, 123, 8137–8138 CrossRef CAS PubMed.
- M. Signorile, D. Rojo Gama, F. Bonino, S. Svelle, P. Beato and S. Bordiga, Operando UV-Raman study of the methanol to olefins reaction over SAPO-34: Spatiotemporal evolution monitored by different reactor approaches, Catal. Today, 2019, 336, 203–209 CrossRef CAS.
- Y. Jiang, J. Huang, V. R. Reddy Marthala, Y. S. Ooi, J. Weitkamp and M. Hunger, In situ MAS NMR–UV/Vis investigation of H-SAPO-34 catalysts partially coked in the methanol-to-olefin conversion under continuous-flow conditions and of their regeneration, Microporous Mesoporous Mater., 2007, 105, 132–139 CrossRef CAS.
- A. Hwang, D. Prieto-Centurion and A. Bhan, Isotopic tracer studies of methanol-to-olefins conversion over HSAPO-34: The role of the olefins-based catalytic cycle, J. Catal., 2016, 337, 52–56 CrossRef CAS.
- C.-M. Wang, Y.-D. Wang and Z.-K. Xie, Insights into the reaction mechanism of methanol-to-olefins conversion in HSAPO-34 from first principles: Are olefins themselves the dominating hydrocarbon pool species?, J. Catal., 2013, 301, 8–19 CrossRef CAS.
- B. Hu, G. Mao, D. Wang, Y. Fu, B. Wang and M. Luo, Conversion and coking of olefins on SAPO-34, Catal. Sci. Technol., 2017, 7, 5785–5794 RSC.
- W. Dai, X. Wang, G. Wu, L. Li, N. Guan and M. Hunger, Methanol-to-Olefin Conversion Catalyzed by Low-Silica AlPO-34 with Traces of Brønsted Acid Sites: Combined Catalytic and Spectroscopic Investigations, ChemCatChem, 2012, 4, 1428–1435 CrossRef CAS.
- W. Zhang, Y. Zhi, J. Huang, X. Wu, S. Zeng, S. Xu, A. Zheng, Y. Wei and Z. Liu, Methanol to Olefins Reaction Route Based on Methylcyclopentadienes as Critical Intermediates, ACS Catal., 2019, 9, 7373–7379 CrossRef CAS.
- W. Wang and M. Hunger, Reactivity of Surface Alkoxy Species on Acidic Zeolite Catalysts, Acc. Chem. Res., 2008, 41, 895–904 CrossRef CAS PubMed.
- G. J. Hutchings, Spiers Memorial Lecture: Understanding reaction mechanisms in heterogeneously catalysed reactions, Faraday Discuss., 2021, 229, 9–34 RSC.
- W. Wang, A. Buchholz, M. Seiler and M. Hunger, Evidence for an Initiation of the Methanol-to-Olefin Process by Reactive Surface Methoxy Groups on Acidic Zeolite Catalysts, J. Am. Chem. Soc., 2003, 125, 15260–15267 CrossRef CAS PubMed.
- G. J. Hutchings, F. Gottschalk, M. V. M. Hall and R. Hunter, Hydrocarbon formation from methylating agents over the zeolite catalyst ZSM-5. Comments on the mechanism of carbon–carbon bond and methane formation, J. Chem. Soc., Faraday Trans. 1, 1987, 83, 571 RSC.
- G. J. Hutchings, G. W. Watson and D. J. Willock, Methanol conversion to hydrocarbons over zeolite catalysts: comments on the reaction mechanism for the formation of the first carbon–carbon bond, Microporous Mesoporous Mater., 1999, 29, 67–77 CrossRef CAS.
- G. Hutchings and R. Hunter, Hydrocarbon formation from methanol and dimethyl ether: a review of the experimental observations concerning the mechanism of formation of the primary products, Catal. Today, 1990, 6, 279–304 CrossRef CAS.
- J. Li, Z. Wei, Y. Chen, B. Jing, Y. He, M. Dong, H. Jiao, X. Li, Z. Qin, J. Wang and W. Fan, A Route to Form Initial Hydrocarbon Pool Species in Methanol Conversion to Olefins over Zeolites, J. Catal., 2014, 317, 277–283 CrossRef CAS.
- Z. Wei, Y.-Y. Chen, J. Li, P. Wang, B. Jing, Y. He, M. Dong, H. Jiao, Z. Qin, J. Wang and W. Fan, Methane formation mechanism in the initial methanol-to-olefins process catalyzed by SAPO-34, Catal. Sci. Technol., 2016, 6, 5526–5533 RSC.
- Y. Liu, S. Müller, D. Berger, J. Jelic, K. Reuter, M. Tonigold, M. Sanchez-Sanchez and J. A. Lercher, Formation Mechanism of the First Carbon–Carbon Bond and the First Olefin in the Methanol Conversion into Hydrocarbons, Angew. Chem., Int. Ed., 2016, 55, 5723–5726 CrossRef CAS PubMed.
- A. D. Chowdhury, K. Houben, G. T. Whiting, M. Mokhtar, A. M. Asiri, S. A. Al-Thabaiti, S. N. Basahel, M. Baldus and B. M. Weckhuysen, Initial Carbon–Carbon Bond Formation during the Early Stages of the Methanol-to-Olefin Process Proven by Zeolite-Trapped Acetate and Methyl Acetate, Angew. Chem., Int. Ed., 2016, 55, 15840–15845 CrossRef CAS PubMed.
- A. D. Chowdhury, A. L. Paioni, K. Houben, G. T. Whiting, M. Baldus and B. M. Weckhuysen, Bridging the Gap between the Direct and Hydrocarbon Pool Mechanisms of the Methanol-to-Hydrocarbons Process, Angew. Chem., Int. Ed., 2018, 57, 1–6 CrossRef.
- E. Stavitski, M. H. F. Kox, I. Swart, F. M. F. de Groot and B. M. Weckhuysen, In Situ Synchrotron-Based IR Microspectroscopy To Study Catalytic Reactions in Zeolite Crystals, Angew. Chem., Int. Ed., 2008, 47, 3543–3547 CrossRef CAS PubMed.
- E. C. V. Eschenroeder, A. Turrina, A. L. Picone, G. Cinque, M. D. Frogley, P. A. Cox, R. F. Howe and P. A. Wright, Monitoring the Activation of Copper-Containing Zeotype Catalysts Prepared by Direct Synthesis Using in Situ Synchrotron Infrared Microcrystal Spectroscopy and Complementary Techniques, Chem. Mater., 2014, 26, 1434–1441 CrossRef CAS.
- I. B. Minova, S. K. Matam, A. Greenaway, C. R. A. Catlow, M. D. Frogley, G. Cinque, P. A. Wright and R. F. Howe, Elementary Steps in the Formation of Hydrocarbons from Surface Methoxy Groups in HZSM-5 Seen by Synchrotron Infrared Microspectroscopy, ACS Catal., 2019, 9, 6564–6570 CrossRef CAS.
- I. B. Minova, S. K. Matam, A. Greenaway, C. R. A. Catlow, M. D. Frogley, G. Cinque, P. A. Wright and R. F. Howe, Effects of crystal size on methanol to hydrocarbon conversion over single crystals of ZSM-5 studied by synchrotron infrared microspectroscopy, Phys. Chem. Chem. Phys., 2020, 22, 18849–18859 RSC.
- Q. Qian, J. Ruiz-Martínez, M. Mokhtar, A. M. Asiri, S. A. Al-Thabaiti, S. N. Basahel and B. M. Weckhuysen, Single-Particle Spectroscopy of Alcohol-to-Olefins over SAPO-34 at Different Reaction Stages: Crystal Accessibility and Hydrocarbons Reactivity, ChemCatChem., 2014, 6, 772–783 CrossRef CAS.
- G. Cinque, M. Frogley, K. Wehbe, J. Filik and J. Pijanka, Multimode InfraRed Imaging and Microspectroscopy (MIRIAM) Beamline at Diamond, Synchrotron Radiat. News, 2011, 24, 24–33 CrossRef.
- I. Halasz, B. Moden, A. Petushkov, J.-J. Liang and M. Agarwal, Delicate Distinction between OH Groups on Proton-Exchanged H-Chabazite and H-SAPO-34 Molecular Sieves, J. Phys. Chem. C, 2015, 119, 24046–24055 CrossRef CAS.
- S. Bordiga, L. Regli, D. Cocina, C. Lamberti, M. Bjørgen and K. P. Lillerud, Assessing the Acidity of High Silica Chabazite H−SSZ-13 by FTIR Using CO as Molecular Probe: Comparison with H−SAPO-34, J. Phys. Chem. B, 2005, 109, 2779–2784 CrossRef CAS PubMed.
- I. B. Minova, N. S. Barrow, A. C. Sauerwein, A. B. Naden, D. B. Cordes, A. M. Z. Slawin, S. J. Schuyten and P. A. Wright, Silicon redistribution, acid site loss and the formation of a core–shell texture upon steaming SAPO-34 and their impact on catalytic performance in the Methanol-to-Olefins (MTO) reaction, J. Catal., 2021, 395, 425–444 CrossRef CAS.
- K. De Wispelaere, C. S. Wondergem, B. Ensing, K. Hemelsoet, E. J. Meijer, B. M. Weckhuysen, V. Van Speybroeck and J. Ruiz-Martínez, Insight into the Effect of Water on the Methanol-to-Olefins Conversion in H-SAPO-34 from Molecular Simulations and in Situ Microspectroscopy, ACS Catal., 2016, 6, 1991–2002 CrossRef CAS.
- S. Bordiga, L. Regli, C. Lamberti, A. Zecchina, M. Bjørgen and K. P. Lillerud, FTIR Adsorption Studies of H2O and CH3OH in the Isostructural H-SSZ-13 and H-SAPO-34: Formation of H-Bonded Adducts and Protonated Clusters, J. Phys. Chem. B, 2005, 109, 7724–7732 CrossRef CAS PubMed.
- M. Falk and E. Whalley, Infrared Spectra of Methanol and Deuterated Methanols in Gas, Liquid, and Solid Phases, J. Chem. Phys., 1961, 34, 1554–1568 CrossRef CAS.
- W. Wang, M. Seiler and M. Hunger, Role of Surface Methoxy Species in the Conversion of Methanol to Dimethyl Ether on Acidic Zeolites Investigated by in Situ Stopped-Flow MAS NMR Spectroscopy, J. Phys. Chem. B, 2001, 105, 12553–12558 CrossRef CAS.
- S. A. F. Nastase, C. R. A. Catlow and A. J. Logsdail, QM/MM study of the stability of dimethyl ether in zeolites H-ZSM-5 and H-Y, Phys. Chem. Chem. Phys., 2021, 23, 2088–2096 RSC.
- J. Van der Mynsbrugge, S. L. C. Moors, K. De Wispelaere and V. Van Speybroeck, Insight into the Formation and Reactivity of Framework-Bound Methoxide Species in H-ZSM-5 from Static and Dynamic Molecular Simulations, ChemCatChem., 2014, 6, 1906–1918 CrossRef CAS.
- A. Zecchina, S. Bordiga, G. Spoto, D. Scarano, G. Spanò and F. Geobaldo, IR Spectroscopy of Neutral and Ionic Hydrogen-bonded Complexes Formed upon Interaction of CH3OH, C2H5OH, (CH3)2O, (C2H5)2O and C4H8O with H-Y, H-ZSM-5 and H-mordenite: Comparison with Analogous Adducts Formed on the H-Nafion Superacidic Membrane, J. Chem. Soc., Faraday Trans., 1996, 92, 4863–4875 RSC.
- T. R. Forester and R. F. Howe, In situ FTIR studies of methanol and dimethyl ether in ZSM-5, J. Am. Chem. Soc., 1987, 109, 5076–5082 CrossRef CAS.
- A. Loutellier, L. Schriver, A. Burneau and J. P. Perchard, Matrix isolation of dimethylether-hydracid complexes: Part I. Interactions involving hydriodic acid in nitrogen matrices, J. Mol. Struct., 1982, 82, 165–176 CrossRef CAS.
- Y. Ono and T. Mori, Mechanism of methanol conversion into hydrocarbons over ZSM-5 zeolite, J. Chem. Soc., Faraday Trans. 1, 1981, 77, 2209 RSC.
- K.-H. Schnabel, R. Fricke and C. Peuker, Catalytic and Infrared Spectroscopic Investigations of the Molecular Sieve Types SAPO-34 and SAPO-11, J. Chem. Soc., Faraday Trans., 1991, 87, 6 RSC.
- A. Allan, D. C. McKean, J.-P. Perchard and M.-L. Josien, Vibrational spectra of crystalline dimethyl ethers, Spectrochim. Acta, Part A, 1971, 27, 1409–1437 CrossRef CAS.
- G. Spoto, S. Bordiga, G. Ricchiardi, D. Scarano, A. Zecchina and E. Borello, IR study of ethene and propene oligomerization on H-ZSM-5: hydrogen-bonded precursor formation, initiation and propagation mechanisms and structure of the entrapped oligomers, J. Chem. Soc., Faraday Trans., 1994, 90, 2827 RSC.
- A. N. Mlinar, P. M. Zimmerman, F. E. Celik, M. Head-Gordon and A. T. Bell, Effects of Brønsted-acid site proximity on the oligomerization of propene in H-MFI, J. Catal., 2012, 288, 65–73 CrossRef CAS.
- M. Bernauer, E. Tabor, V. Pashkova, D. Kaucký, Z. Sobalík, B. Wichterlová and J. Dedecek, Proton proximity – New key parameter controlling adsorption, desorption and activity in propene oligomerization over H-ZSM-5 zeolites, J. Catal., 2016, 344, 157–172 CrossRef CAS.
- M. L. Sarazen, E. Doskocil and E. Iglesia, Catalysis on solid acids: Mechanism and catalyst descriptors in oligomerization reactions of light alkenes, J. Catal., 2016, 344, 553–569 CrossRef CAS.
- A. P. Hawkins, A. Zachariou, P. Collier, R. A. Ewings, R. F. Howe, S. F. Parker and D. Lennon, Low-temperature studies of propene oligomerization in ZSM-5 by inelastic neutron scattering spectroscopy, RSC Adv., 2019, 9, 18785–18790 RSC.
- A. P. Hawkins, A. Zachariou, S. F. Parker, P. Collier, I. P. Silverwood, R. F. Howe and D. Lennon, Onset of Propene Oligomerization Reactivity in ZSM-5 Studied by Inelastic Neutron Scattering Spectroscopy, ACS Omega, 2020, 5, 7762–7770 CrossRef CAS PubMed.
- A. P. Hawkins, A. Zachariou, S. F. Parker, P. Collier, R. F. Howe and D. Lennon, Studies of propene conversion over H-ZSM-5 demonstrate the importance of propene as an intermediate in methanol-to-hydrocarbons chemistry, Catal. Sci. Technol., 2021, 11, 2924–2938 RSC.
- S. D. Williams, T. J. Johnson, S. W. Sharpe, V. Yavelak, R. P. Oates and C. S. Brauer, Quantitative vapor-phase IR intensities and DFT computations to predict absolute IR spectra based on molecular structure, J. Quant. Spectrosc. Radiat. Transfer, 2013, 129, 298–307 CrossRef CAS.
- D. M. Marcus, K. A. McLachlan, M. A. Wildman, J. O. Ehresmann, P. W. Kletnieks and J. F. Haw, Experimental Evidence from H/D Exchange Studies for the Failure of Direct C-C Coupling Mechanisms in the Methanol-to-Olefin Process Catalyzed by HSAPO-34, Angew. Chem., Int. Ed., 2006, 45, 3133–3136 CrossRef CAS PubMed.
- H. Yamazaki, H. Shima, H. Imai, T. Yokoi, T. Tatsumi and J. N. Kondo, Evidence for a “Carbene-like” Intermediate during the Reaction of Methoxy Species with Light Alkenes on H-ZSM-5, Angew. Chem., Int. Ed., 2011, 50, 1853–1856 CrossRef CAS PubMed.
- C. S. Lee and M. M. Wu, Reaction of Carbenoid Species from Diazomethane Decomposition over Zeolite ZSM-5, J. Chem. Soc., Chem. Commun., 1985, 250–252 RSC.
- P. E. Sinclair and C. R. A. Catlow, Generation of Carbenes during Methanol Conversion over Brönsted Acidic Aluminosilicates. A Computational Study, J. Phys. Chem. B, 1997, 101, 295–298 CrossRef CAS.
- D. Lesthaeghe, V. Van Speybroeck, G. B. Marin and M. Waroquier, The Rise and Fall of Direct Mechanisms in Methanol-to-Olefin Catalysis: An Overview of Theoretical Contributions, Ind. Eng. Chem. Res., 2007, 46, 8832–8838 CrossRef CAS.
- D. Lesthaeghe, V. Van Speybroeck, G. B. Marin and M. Waroquier, Understanding the Failure of Direct C–C Coupling in the Zeolite-Catalyzed Methanol-to-Olefin Process, Angew. Chem., Int. Ed., 2006, 45, 1714–1719 CrossRef CAS PubMed.
- S. A. F. Nastase, A. J. Logsdail and C. R. A. Catlow, QM/MM Study of the Reactivity of Zeolite Bound Methoxy and Carbene Groups, Phys. Chem. Chem. Phys., 2021, 23, 17634–17644 RSC.
- M. P. Doyle, R. Duffy, M. Ratnikov and L. Zhou, Catalytic Carbene Insertion into C–H Bonds, Chem. Rev., 2010, 110, 704–724 CrossRef CAS PubMed.
- J. N. Kondo, D. Nishioka, H. Yamazaki, J. Kubota, K. Domen and T. Tatsumi, Activation Energies for the Reaction of Ethoxy Species to Ethene over Zeolites, J. Phys. Chem. C, 2010, 114, 20107–20113 CrossRef CAS.
- S. Lin, Y. Zhi, W. Chen, H. Li, W. Zhang, C. Lou, X. Wu, S. Zeng, S. Xu, J. Xiao, A. Zheng, Y. Wei and Z. Liu, Molecular Routes of Dynamic Autocatalysis for Methanol-to-Hydrocarbons Reaction, J. Am. Chem. Soc., 2021, 143, 12038–12052 CrossRef CAS PubMed.
- J. D. Mosley, J. W. Young, J. Agarwal, H. F. Schaefer, P. V. R. Schleyer and M. A. Duncan, Structural isomerization of the gas-phase 2-norbornyl cation revealed with infrared spectroscopy and computational chemistry, Angew. Chem., Int. Ed., 2014, 53, 5888–5891 CrossRef CAS PubMed.
- J. F. Haw, J. B. Nicholas, W. Song, F. Deng, Z. Wang, T. Xu and C. S. Heneghan, Roles for Cyclopentenyl Cations in the Synthesis of Hydrocarbons from Methanol on Zeolite Catalyst HZSM-5, J. Am. Chem. Soc., 2000, 122, 4763–4775 CrossRef CAS.
- E. D. Hernandez and F. C. Jentoft, Spectroscopic Signatures Reveal Cyclopentenyl Cation Contributions in Methanol-to-Olefins Catalysis, ACS Catal., 2020, 10, 5764–5782 CrossRef CAS.
- W. Wen, S. Yu, C. Zhou, H. Ma, Z. Zhou, C. Cao, J. Yang, M. Xu, F. Qi, G. Zhang and Y. Pan, Formation and Fate of Formaldehyde in Methanol-to-Hydrocarbon Reaction: In Situ Synchrotron Radiation Photoionization Mass Spectrometry Study, Angew. Chem., Int. Ed., 2020, 59, 4873–4878 CrossRef CAS PubMed.
- Y. Liu, F. M. Kirchberger, S. Müller, M. Eder, M. Tonigold, M. Sanchez-Sanchez and J. A. Lercher, Critical role of formaldehyde during methanol conversion to hydrocarbons, Nat. Commun., 2019, 10, 1462 CrossRef PubMed.
- Y. Li, S. Huang, Z. Cheng, S. Wang, Q. Ge and X. Ma, Synergy between Cu and Brønsted acid sites in carbonylation of dimethyl ether over Cu/H-MOR, J. Catal., 2018, 365, 440–449 CrossRef CAS.
Footnote |
| † Electronic supplementary information (ESI) available: Synthesis and characterisation of crystals, catalyst evaluation, supplementary IR and mass spectra and results of DFT calculations. See DOI: 10.1039/d1cy02361f |
| This journal is © The Royal Society of Chemistry 2022 |

