Setting the limit for the lateral thermal expansion of layered crystals via helium atom scattering
Gloria
Anemone
 ab,
Amjad Al
Taleb
 a,
Antonio
Politano
 c,
Chia-Nung
Kuo
de,
Chin Shan
Lue
de,
Rodolfo
Miranda
afgh and
Daniel
Farías
 *agh
*agh
aDepartamento de Física de la Materia Condensada, Universidad Autónoma de Madrid, 28049 Madrid, Spain. E-mail: daniel.farias@uam.es
bDepartamento de Matemática Aplicada y Estadística, Universidad San Pablo-CEU, CEU Universities, Madrid 28003, Spain
cDipartimento di Scienze Fisiche e Chimiche (DSFC), Università degli Studi dell'Aquila, Via Vetoio 10, I-67100 L’Aquila, Italy
dDepartment of Physics, National Cheng Kung University, Tainan 70101, Taiwan
eTaiwan Consortium of Emergent Crystalline Materials, Ministry of Science and Technology, Taipei 10601, Taiwan
fInstituto Madrileño de Estudios Avanzados en Nanociencia (IMDEA-Nanociencia), 28049 Madrid, Spain
gInstituto “Nicolás Cabrera”, Universidad Autónoma de Madrid, 28049 Madrid, Spain
hCondensed Matter Physics Center (IFIMAC), Universidad Autónoma de Madrid, 28049 Madrid, Spain
First published on 23rd May 2022
Abstract
The knowledge of the thermal expansion coefficient is of crucial importance to prevent the poor performance of devices, especially when these are made up of several layers of different materials, as in the case of 2D heterostructures. Helium atom scattering is a suitable tool for the direct measurement of the surface thermal expansion coefficient of materials. This information can be obtained directly from the position of the helium diffraction peaks, which allows determining the surface lattice constant at different temperatures by merely applying Bragg's law. We present new data for PdTe2 which confirm a trend observed for several 2D dichalcogenides, namely, that the in-plane lattice constant remains unchanged (within experimental error) in the temperature range of interest for applications, which enables setting an upper limit for the lateral thermal expansion coefficients of these materials.
1 Introduction
In recent years, there has been an increasing interest in the study of layered crystals due to the exciting possibility of selecting a material with electronic, optical, mechanic, chemical or thermal properties appropriate for a specific application.1–3 In this regard, after the advent of graphene, layered noble-transition-metal dichalcogenides (TMDs) with composition MX2 (M = Mo, W, Pd, Pt, etc. and X = S, Se and Te) have attracted significant attention because they can be exotic semimetals or semiconductors with an easy energy-gap tunability with the thickness or the strain, well-suited for potential applications in field effect transistors, optoelectronics or sensors.4–6Many of these applications depend on the thermal expansion coefficient of the layered crystals (or flakes), i.e. the temperature dependence of their lattice constant. In particular, it is important to identify and characterize materials with reduced thermal mismatch and low thermal expansion coefficients, i.e. below αT ≤ 2 × 10⁻⁶ K−1. This requirement is of crucial relevance for systems experiencing large temperature variations in nanoelectronic or optoelectronic device operation.4
The thermal expansion coefficient (TEC) of bulk layered materials with the CdI2 or CdCl2 structure is anisotropic, with the out-of-plane expansion, i.e. in the axis perpendicular to the surface, expected to be much larger than the one in the surface plane, which often can even be negative. This is related to the fact that layered compounds are characterized by strong intra-layer and weak van der Waals interlayer forces. This difference between the two TEC components, α‖ and α⊥ shows that mean-square displacements (MSDs) of the anions are larger out-of-plane than in-plane. It should also be considered that the potential experienced by the anion MSDs in-plane and out-of-plane is also different. Out-of-plane, the potential has a cubic anharmonic term, since the anion planes do not have mirror symmetry, whereas by symmetry this term does not appear in-plane. Such dynamical anisotropy tends to be smaller, with stronger interlayer forces. Additionally, for free standing 2D layers, such as graphene, the thermal expansion is often large and negative in a wide temperature range (an exception being MoS2) following the predicted behavior for membranes due to anharmonic couplings of the in-plane stretchings and out-of-plane bendings, driven by flexural modes. The effective lateral thermal expansion of 2D layers when deposited on a substrate depends strongly on the interaction with the chosen substrate and, thus, it has to be determined for each system. In addition, it should be mentioned that the TEC might be strongly temperature dependent.7
However, most of the experimental techniques available for the determination of the TEC in bulk samples are not suitable for characterizing the surface of a 2D monolayer (or ultrathin flakes). Due to the difficulty of performing experimental measurements on atomically thin, micron-sized, and optically transparent 2D flakes, the current studies of TEC in 2D materials often rely on indirect characteristics, e.g. plasmon energies,8 that depend extensively on modelling and simulations to yield the lattice parameters. Additionally, temperature-dependent Raman spectroscopy, a widely used technique, is not without serious problems of interpretation. As a result, the TEC values available in the literature, both theoretical and experimental, vary widely for the same physical system. Helium atom scattering (HAS), in contrast, is a suitable tool for directly obtaining the surface lattice parameter, owing to its unique surface sensitivity.9,10 This sensitivity arises from a combination of the low energies employed (∼ 50 meV) and the Pauli exclusion principle, which gives an interaction dominated by the valence electrons of the sample. By monitoring the position of the He diffraction peaks in the angular distributions taken at different surface temperatures one can establish experimentally, the limits of the values of the thermal expansion coefficients with a precision below few times 10−6 K−1.
2 Experimental
Single crystals of 1T-PdTe2 were synthesized by the slow cooling method as detailed elsewhere.11,12 The stoichiometry and the structure of the crystals were examined by means of a Bruker-D2 PHASER X-ray diffractometer using Cu-Kα radiation and energy-dispersive X-ray spectroscopy (EDX). The PdTe2 sample was mechanically exfoliated in air using Scotch tape and transferred into an ultra-high vacuum (UHV) chamber, where the surface was cleaned by flash-annealing. The surface cleanliness and order were monitored by checking the angular distribution of the He reflected beam, as well as by low-electron energy diffraction (LEED). The crystals were mounted on a sample holder that could be electronically heated by electron bombardment and cooled to 90 K by liquid nitrogen. The surface temperature was measured using a C-type thermocouple soldered to the edge of the sample. All the data presented in this work were taken using a thermal energy atomic and molecular scattering system (TEAMS). This apparatus allows determining the absolute intensity of in-plane (defined by the beam direction and the normal to the surface) and out-plane diffracted peaks, thanks to a quadrupole mass spectrometer installed on a two-axis goniometer. The incident beam energy can be modified by cooling or heating of the platinum nozzle.3 Results and discussion
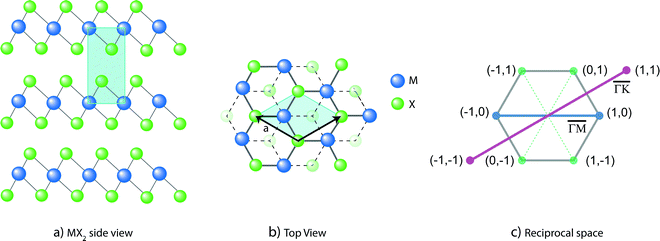
We will focus here on setting the limits of the thermal expansion coefficient of 1T-PdTe2, comparing it with the isostructural 1T-PtTe2, predicted to be Lorentz-violating, type-II Dirac semimetals hosting fermions that emerge from a tilted Dirac cone,13 and 2H-MoS2, a well-known semiconducting TMD. We will also compare with the results for graphene grown epitaxially on Cu(111). The crystalline structure of TMDs, such as 1T-PdTe2 and 1T-PtTe2, illustrated in Fig. 1 consists of stacks of MX2 trilayers (TL) with strong lateral intra-layer bonding, the perpendicular stacking being dictated by weak van der Waals inter-layer interactions. The trilayers are formed by a hexagonal array of metal atoms sandwiched between two hexagonal layers of chalcogenide atoms. The weak inter-layer bonding allows exfoliation into ultrathin, eventually atomically thin, flakes. | ||
| Fig. 1 (a) Side and (b) top views of crystal structure of layered noble-transition-metal dichalcogenides. (c) Reciprocal space diagram. | ||
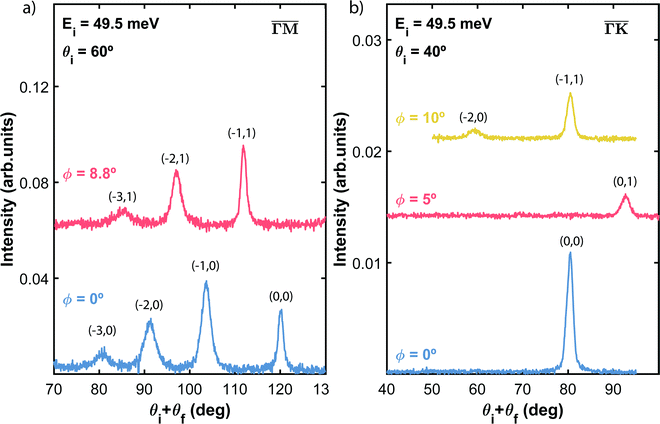
Fig. 2 shows the angular distributions of He atoms scattered from a clean PdTe2 surface for an incident beam energy Ei = 49.5 meV. Both in-plane and out-plane spectra have been taken along the two main symmetry directions  (Fig. 2a) and
  (Fig. 2b) keeping the surface at a temperature of 90 K. In Fig. 2(a) a diffraction pattern taken for an incident angle of 60° is presented, revealing the appearance of up to the third order peak both in-plane (blue spectrum) and out-of-plane (red spectrum). The intensity of the peaks gives information about the corrugation of the surface and in this case the lower intensity of the specular peaks, compared to the other diffraction peaks, revealing that the Te-terminated, PdTe2 surface is highly corrugated, a property of significant relevance for the measurement of the thermal expansion coefficient. The corresponding spectra along
  are shown in Fig. 2(b). The high surface corrugation leads in this case to the appearance of intense out-of-plane diffraction peaks at an angle of 10°, in addition to the (0,1) peak detected at an out-of-plane angle of 5°. The absence of additional in-plane diffraction peaks is very likely due to the small angle of incidence used along this symmetry direction.
It is interesting to note that, despite the very low intensity of the diffracted peaks, their detection is clear due to the very low background. This behaviour together with the observation of a narrow specular peak corroborates the presence of well-ordered surface domains with a low density of defects. Since the position of the diffraction peaks follows Bragg's law for a hexagonal two-dimensional structure, it is possible to determine the surface lattice constant of this material, that results in a = (3.95 ± 0.05) Å, which is consistent with the values reported by STM and X-ray diffraction experiments.12,14,15
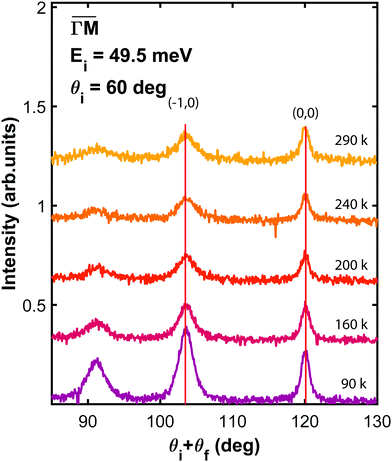
Because of its unique surface sensitivity, He diffraction provides a direct method for measuring the lattice constant of only the surface layer without any contribution from bulk layers. Fig. 3 presents in-plane He angular distributions measured at different surface temperatures, ranging from 90 to 290 K, taken along  direction at the same incident conditions: an incident angle of 60° and incident energy of 49.5 meV. Although two in-plane diffraction peaks are clearly resolved in the spectra taken at 90 K, only the first order diffraction peak has been taken into account for further analysis. Indeed, when the temperature increases a strong attenuation is caused by the Debye–Waller factor, making it quite difficult to determine its position with enough accuracy. On the other hand, the first order diffraction peak is sharp even at the highest temperature reached in the experiment. Looking at the position of this peak with respect to the specular one, as derived from a Gaussian fit, it is clear that the angular separation between the two does not change with temperature. This indicates that PdTe2 has a temperature-independent surface lateral lattice parameter within an experimental error of 0.02 Å, i.e. a negligible in-plane thermal expansion coefficient between 90 and 290 K. It is important to bear in mind that this error is smaller than the error made in the determination of the lattice constant, because in this case all initial conditions are fixed and identical for all measurements. So, any systematic error would affect all measurements equally. Also, the error in the angular position of the diffraction peaks resulting from the Gaussian fit is much smaller than the resolution of the instrument. In other words, the error that can be made in the measurement of the angular distance between the specular peak and the first order diffraction peak depends essentially on the angular resolution of the apparatus.
 | ||
Fig. 3 Angular distribution of He scattered by PdTe2 as a function of surface temperature, taken at an incident energy of 49.5 meV, along  . . | ||
We would also like to point out that previous studies have shown that it is possible to detect thermal surface expansion via HAS. For example, in systems in which the surface layer has a strong coupling with the substrate, such as the case of graphene on Ni(111), a clear inward shift of the position of the diffraction was observed,19 revealing an increase in the surface (lateral) lattice parameter of more than 1% in this temperature range, i.e. a positive α‖ ≈ 32 × 10−6 K−1, approximately greater by a factor of two than that of the Ni substrate.16 We note in passing that this result is also relevant because the in-plane TEC is strongly negative for free-standing graphene8 in this temperature range, demonstrating that the interaction with the substrate can modify substantially the effective thermal expansion of 2D materials. In this sense, we should also mention that graphene grown on a weakly interacting substrate such as Cu(111) showed a negligible surface expansion in the range of temperatures from 100 to 500 K.17
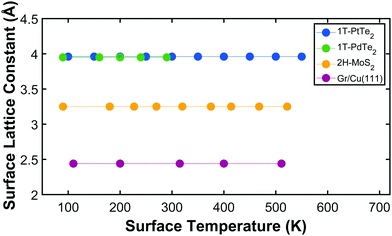
Using Bragg's law we can deduce the surface lattice constant corresponding to each temperature and represent it as function of temperature, as shown in Fig. 4 (green circles) together with other 2D materials previously studied with this technique: PtTe2, MoS2 and graphene/Cu(111).12,17–19 What stands out in this graph is that for all the 2D-materials considered in this and previous studies, the surface lattice constant does not change in this temperature range. This allows us to set the limits of the in-plane thermal expansion coefficient for these materials in the explored temperature range. The in-plane (linear) thermal expansion coefficient is defined as α‖ = (ΔL/L)1/ΔT, where ΔL in this case is the experimental error, i.e. 0.02 Å for the TEAMS apparatus and 0.01 Å for the HAS-TOF apparatus, used in previous work for PtTe2 and graphene/Cu(111). The observation of lateral lattice constants that do not change within experimental error with temperature in an ≈ 450 K range allows us to set the limit of the maximum value of α‖ for these materials as α‖ ≤ 24.8 × 10⁻⁶ K−1 for PdTe2 (because of the limited temperature range explored), α‖ ≤ 5.6 × 10⁻⁶ K−1 for PtTe2, α‖ ≤ 14 × 10−6 K−1 for MoS2 and α‖ ≤ 5.11 × 10⁻⁶ K−1 for graphene/Cu(111).
 | ||
| Fig. 4 Comparison of the lattice constant as a function of surface temperature derived from HAS data in four different 2D materials. | ||
These values are compared with others available in the literature. Graphite has a large, negative, in-plane TEC between 20 K and 270 K (α‖ ≈ −12.7 × 10⁻⁶ K−1 at 270 K).20 A free-standing graphene monolayer has an even more negative TEC, α‖ ≈ −21.4 × 10⁻⁶ K−1 in the range between 373 K and 723 K.8 For a monolayer graphene clamped to a substrate, a smaller value has been reported (α‖ ≈ −8 × 10⁻⁶ K−1) at room temperature.21 In contrast to graphene, layered transition metal dichalcogenides are much less studied. The available experimental values of TEC for bulk crystals are, in general, positive, although relatively small (and with large dispersion); e.g. 3.26–6.35 × 10⁻⁶ K−1 for WS2,22 6.8–11.08 × 10⁻⁶ K−1 for WSe2,23,24 7.2–12.9 × 10⁻⁶ K−1 for MoSe224 and 4.9–11.5 × 10⁻⁶ K−1 for MoS2.25 There is a general trend when moving from bulk crystals to flakes or monolayers: the TECs decrease strongly from free-standing monolayers to monolayers supported on substrates and to bulk single crystals. For a monolayer of MoS2, for instance, the in-plane TEC was reported to be 7.6 ± 0.9 × 10⁻⁶ K−1 from temperature dependent micro-Raman.26 A summary of the in-plane thermal expansion coefficients for several 2D materials is given in Table 1. It is worth noting that in the case of measurements showing negligible in-plane thermal expansion, it is the upper limit of the TEC that is reported.
| Samples | α ‖ (10−6 K−1) | T S range (K) |
|---|---|---|
| PdTe2 | ≤24.8 | 90–290 |
| PtTe219 | ≤5.6 | 90–550 |
| MoS218 | ≤14 | 90–522 |
| Graphene/Cu(111)17 | ≤5.11 | 110–511 |
| Graphene/Ni(111)19 | 32 | 110–550 |
| Graphite20 | −1 to −12.7 | 20–270 |
| Free-standing graphene8 | −21.4 | 373–723 |
| Monolayer graphene21 | −8 | 300 |
| WS222 | 3.26 | 473–573 |
| WSe223,24 | 6.8–11.08 | 25–600 |
| MoSe224 | 7.2 | 293–1073 |
The present study sets a well-defined limit for the maximum average in-plane TEC over the explored temperature range and increases the possibility that extremely small in-plane thermal expansion coefficients could be a characteristic of layered dichalcogenides more general than expected, as suggested by a recent theoretical study.27
4 Conclusions
We have shown that the diffraction of He atoms provides a direct method for measuring the surface thermal expansion experienced by the lattice constant, whereby it can be obtained directly by measuring the position of the peaks governed by the Bragg law. In the case of the 2D materials studied, PdTe2, PtTe2, MoS2 and graphene/Cu(111), we were able to set a limit for the thermal expansion coefficient in the range α‖ ≤ 5–25 × 10−6 K−1. Furthermore, we demonstrate that the thermal expansion behaviour is related to the interaction of the first layer with the substrate, since the topmost layer of these 2D materials does not expand laterally when they are weakly bound to the substrate but may follow the thermal expansion of the substrate when they are strongly bound.Conflicts of interest
There are no conflicts to declare.Acknowledgements
This work has been partially supported by the Spanish Ministerio de Ciencia e Innovación under the projects PID2019-109525RB-I00 and PGC2018-098613-B-C21 (SpOrQuMat). D. F. and R. M. acknowledge financial support from the Spanish Ministry of Economy and Competitiveness, through the “María de Maeztu” Programme for Units of Excellence in R&D (CEX2018-000805-M). This research was also financed by the Regional Government of Madrid through Project P2018/NMT-4321 (NANOMAGCOST-CM). IMDEA Nanociencia is supported by the “Severo Ochoa” Programme for Centres of Excellence in R&D, MINECO.References
- A. Gupta, T. Sakthivel and S. Seal, Prog. Mater. Sci., 2015, 73, 44–126 CrossRef CAS.
- D. Jariwala, V. K. Sangwan, L. J. Lauhon, T. J. Marks and M. C. Hersam, ACS Nano, 2014, 8, 1102–1120 CrossRef CAS PubMed.
- N. R. Glavin, R. Rao, V. Varshney, E. Bianco, A. Apte, A. Roy, E. Ringe and P. M. Ajayan, Adv. Mater., 2020, 32, 1904302 CrossRef CAS PubMed.
- G. Plechinger, A. Castellanos-Gomez, M. Buscema, H. S. van der Zant, G. A. Steele, A. Kuc, T. Heine, C. Schüller and T. Korn, 2D Mater., 2015, 2, 015006 CrossRef.
- W. Yang, L. Gan, H. Li and T. Zhai, Inorg. Chem. Front., 2016, 3, 433–451 RSC.
- M. Donarelli and L. Ottaviano, Sensors, 2018, 18, 3638 CrossRef PubMed.
- Z. Lin, W. Liu, S. Tian, K. Zhu, Y. Huang and Y. Yang, Sci. Rep., 2021, 11, 1–9 CrossRef.
- X. Hu, P. Yasaei, J. Jokisaari, S. Öğüt, A. Salehi-Khojin and R. F. Klie, Phys. Rev. Lett., 2018, 120, 055902 CrossRef CAS PubMed.
- Y. Ekinci and J. P. Toennies, Surf. Sci., 2004, 563, 127 CrossRef CAS.
- D. Farías and K.-H. Rieder, Rep. Prog. Phys., 1998, 61, 1575 CrossRef.
- G. D'Olimpio, et al. , Adv. Funct. Mater., 2019, 1906556 Search PubMed.
- G. Anemone, P. C. Aguilar, M. Garnica, F. Calleja, A. Al Taleb, C.-N. Kuo, C. S. Lue, A. Politano, A. L.-V. de Parga and G. Benedek, et al. , npj 2D Mater. Appl., 2021, 5, 1–7 CrossRef.
- M. Yan, H. Huang, K. Zhang, E. Wang, W. Yao, K. Deng, G. Wan, H. Zhang, M. Arita and H. Yang, et al. , Nat. Commun., 2017, 8, 257 CrossRef.
- A. Kjekshus and F. Grønvold, Acta Chem. Scand., 1959, 13, 1767–1774 CrossRef CAS.
- A. Lyons, D. Schleich and A. Wold, Mater. Res. Bull., 1976, 11, 1155–1159 CrossRef CAS.
- T. Kollie, Phys. Rev. B: Solid State, 1977, 16, 4872 CrossRef CAS.
- A. Al Taleb, H. K. Yu, G. Anemone, D. Faras and A. M. Wodtke, Carbon, 2015, 95, 731–737 CrossRef CAS.
- G. Anemone, A. A. Taleb, A. Castellanos-Gomez and D. Farías, 2D Mater., 2018, 5, 035015 CrossRef.
- G. Anemone, M. Garnica, M. Zappia, P. C. Aguilar, A. Al Taleb, C.-N. Kuo, C. S. Lue, A. Politano, G. Benedek and A. L.-V. de Parga, et al. , 2D Mater., 2020, 7, 025007 CrossRef CAS.
- A. Bailey and B. Yates, J. Appl. Phys., 1970, 41, 5088–5091 CrossRef CAS.
- D. Yoon, Y.-W. Son and H. Cheong, Nano Lett., 2011, 11, 3227–3231 CrossRef CAS PubMed.
- A. Matthäus, A. Ennaoui, S. Fiechter, S. Tiefenbacher, T. Kiesewetter, K. Diesner, I. Sieber, W. Jaegermann, T. Tsirlina and R. Tenne, J. Electrochem. Soc., 1997, 144, 1013–1019 CrossRef.
- L. Brixner, J. Electrochem. Soc., 1963, 110, 289–293 CrossRef.
- S. El-Mahalawy and B. Evans, J. Appl. Crystallogr., 1976, 9, 403–406 CrossRef.
- R. Murray and B. Evans, J. Appl. Crystallogr., 1979, 12, 312–315 CrossRef CAS.
- L. Zhang, Z. Lu, Y. Song, L. Zhao, B. Bhatia, K. R. Bagnall and E. N. Wang, Nano Lett., 2019, 19, 4745–4751 CrossRef CAS.
- K. Michel, S. Costamagna and F. Peeters, Phys. Status Solidi B, 2015, 252, 2433–2437 CrossRef CAS.
| This journal is © the Owner Societies 2022 |


