 Open Access Article
Novel near-infrared II aggregation-induced emission dots for in vivo bioimaging†
Jiacheng
Lin‡
ab,
Xiaodong
Zeng‡
ab,
Yuling
Xiao‡
ab,
Lin
Tang
a,
Jinxia
Nong
a,
Yufang
Liu
a,
Hui
Zhou
 ab,
Bingbing
Ding
a,
Fuchun
Xu
c,
Hanxing
Tong
d,
Zixin
Deng
a and
Xuechuan
Hong
 *abc
*abc
aState Key Laboratory of Virology, Key Laboratory of Combinatorial Biosynthesis and Drug Discovery (MOE), Hubei Provincial Key Laboratory of Developmentally Originated Disease, Wuhan University School of Pharmaceutical Sciences, Wuhan 430071, China. E-mail: xhy78@whu.edu.cn
bShenzhen Institute of Wuhan University, Shenzhen, 518057, China
cInnovation Center for Traditional Tibetan Medicine Modernization and Quality Control, Medical College, Tibet University, Lhasa, 850000, China
dDepartment of General Surgery, Zhongshan Hospital, Fudan University, Shanghai, 200032, China
First published on 9th November 2018
Abstract
Near-infrared II fluorescence imaging holds great promise for in vivo imaging and imaging-guided surgery with deep penetration and high spatiotemporal resolution. However, most NIR-II aromatic luminophores suffer from the notorious aggregation-caused quenching (ACQ) effect in the aqueous solution, which largely hinders their biomedical application in vivo. In this study, the first NIR-II organic aggregation-induced emission (AIE) fluorophore (HLZ-BTED), encapsulated as nanoparticles (HLZ-BTED dots) for in vivo biomedical imaging, was designed and synthesized. The NIR-II AIE HLZ-BTED dots showed high temporal resolution, high photostability, outstanding water-solubility and biocompatibility in vitro and in vivo. The HLZ-BTED dots were further used for long-term breast tumor imaging and visualizing tumor-feeding blood vessels, long-term hind limb vasculature and incomplete hind limb ischemia. More importantly, as a proof-of-concept, this is the first time that non-invasive and real-time NIR-II imaging of the gastrointestinal tract in health and disease has been performed, making the AIE dots a promising tool for gastrointestinal (GI) tract research, such as understanding the healthy status of GI peristalsis, diagnosing and evaluating intestinal motility dysfunction, and assessing drug effects on intestinal obstruction.
Introduction
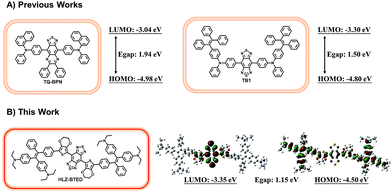
Optical fluorescence imaging in the near-infrared window (NIR, 700–1700 nm) is a well-established and powerful tool for biomedical application in scientific research and clinical practice, such as noninvasive in vivo vascular imaging,1 lymphatic mapping,2 cancer diagnosis,3 and image-guided surgery.4 Compared with the conventional first near-infrared window (NIR-I, 700–900 nm) fluorescence imaging, fluorescence imaging in the second near-infrared window (NIR-II, 1000–1700 nm) has deeper penetration and higher spatiotemporal resolution due to low photon absorption and scattering and low auto-fluorescence of normal biological tissues.5 Numerous organic or inorganic nanostructured NIR-II contrast agents such as rare earth nanoparticles (NPs),6 quantum dots (QDs),7 carbon nanotubes (CNTs),8 and conjugated polymer NPs9 have been reported for biological imaging. Recently, the first rapidly renally excreted NIR-II fluorophore CH1055 has been developed based on a benzobisthiadiazole (BBTD)-based donor–acceptor–donor (D–A–D) structure for high-quality NIR-II biomedical imaging.10 After that, a series of small-molecule organic NIR-II dyes were reported for use in bioimaging with or without the BBTD core.11 However, most of these NIR-II aromatic luminophores suffer from the notorious aggregation-caused quenching (ACQ) effect, with strong emission as isolated molecules but poor emission efficiency in the aggregate state due to intense intermolecular π–π stacking interactions, which largely hinders their biomedical application in NIR-II imaging.Research efforts to solve the ACQ problem by hampering chromophore aggregation have ended with limited success until 2001.12 A novel AIE phenomenon, an exactly opposite phenomenon to overcome the notorious ACQ effect was reported by Tang and his co-workers.12 The luminescent molecules with AIE characteristics usually show strong fluorescence emission upon aggregation, and weak or non-emissive fluorescence in dilute solvents. So far, a variety of small fluorescent organic molecules have been developed as AIE fluorogens (AIEgens) with visible (Vis) or NIR-I fluorescence emission.13 Recently, two short-wave infrared (SWIR, 900–1700 nm) AIEgens TQ-BPN and TB1 were reported with the maximum fluorescence emission peak at 810 nm and 975 nm for high-resolution bioimaging and dual fluorescence and photoacoustic imaging for precise brain cancer diagnosis.14,15 Hence, many efforts have been made to optimize the brightness of small-molecule NIR-II fluorophores and increase the emission wavelengths of NIR-II AIEgens.
Herein, a novel NIR-II small-molecule organic fluorogen HLZ-BTED with AIE characteristics based on BBTD and tetraphenylethylene (TPE) was designed and facilely prepared.16 The fluorescence emission wavelength of encapsulated HLZ-BTED dots was longer than 1000 nm. The HLZ-BTED dots were used for passive targeted long-term NIR-II fluorescence imaging of breast cancer based on the enhanced permeability and retention (EPR) effect, and in vivo visualizing of tumor-feeding arteries, long-term hind limb vasculature and incomplete hind limb ischemia. In a proof-of-concept study, we have developed a new concept for the real-time imaging of normal gastrointestinal motility and intestinal obstruction in a mouse model using the NIR-II HLZ-BTED dots, which could be a powerful biomedical research tool for identifying gastrointestinal function and diseases.
Results and discussion
A new type of NIR-II AIE dye HLZ-BTED with a different core structure from TB1 was designed and synthesized. Based on the D–A–D scaffold, herein we incorporated a 3,4-ethylenedioxythiophene (EDOT) spacer and 4,4′-(2,2-diphenylethene-1,1-diyl)bis(N,N-diethylaniline) as the AIE functional group for the fluorescent compound HLZ-BTED and investigated the relationship between the structure and absorption/fluorescence properties. DFT calculations with the B3LYP exchange functional employing 6-31G(d, p) basis sets were performed to obtain the highest occupied molecular orbital (HOMO) and lowest unoccupied molecular orbital (LUMO) of TQ-BPN, TB1 and HLZ-BTED. The HOMOs of HLZ-BTED are delocalized on the whole molecular backbone including BBTD, EDOT, and TPE units, while the LUMOs are mainly localized on the electron-deficient BBTD acceptor and the EDOT donor (Fig. 1B). As shown in Fig. S1A and S1B,† the electronic structures of TQ-BPN and TB1 are similar to that of the HLZ-BTED fluorophore. However, the energy bandgaps of HLZ-BTED (1.15 eV) are lower than those of TQ-BPN (1.94 eV) and TB1 (1.50 eV). Thus, HLZ-BTED showed larger red-shifts of the absorption spectra and fluorescence emission peaks compared to TQ-BPN and TB1 (Fig. 1 and S1C†).The small-molecule AIE fluorophore, HLZ-BTED, was facilely prepared according to the synthetic route shown in Fig. 2A. 1-(4-Bromophenyl)-1-phenyl-2,2-bis(4-diethylamino)phenylethene 2 was prepared via a McMurry coupling reaction between 4-bromobenzophenone and 4,4′-bis(diethylamino)benzophenone using titanium tetrachloride as the catalyst and zinc dust as the reducing agent.17 The boric acid ester substrate 3 was then obtained from compound 2 in the presence of bis(pinacolato)diboron and PdCl2(dppf) in dioxane. A Suzuki cross-coupling reaction between compound 4 (ref. 18) and compound 3 using PdCl2(dppf)CH2Cl2 as the catalyst in THF to afford the coupling adduct 5, followed by zinc reduction and N-thionylaniline-induced ring closure resulted in the formation of HLZ-BTED. The structure of HLZ-BTED was characterized using NMR and MALDI-TOF-MS (Fig. S11–S17†). The AIE properties of HLZ-BTED were investigated in THF–water mixtures with changing water volume fractions (fws). As shown in Fig. 2B, HLZ-BTED exhibited weak NIR-II fluorescence emission in the pure THF solution, but extremely strong fluorescence emission in the THF–water mixed solution with 95% fw. To further confirm the AIE properties of HLZ-BTED, the fluorescence emission spectra of the fluorophore in THF–water mixtures with changing fws were subsequently collected under 785 nm excitation (Fig. 2C) and investigated. The fluorescence (FL) intensity of HLZ-BTED significantly decreased with the gradual increase of fw from 0 to 40%, which was possibly due to the increased solvent polarity. The FL intensity of HLZ-BTED increased sharply on further increasing the fw from 40 to 90%, indicating a typical AIE characteristic, and remained stable with the increase of fw from 90 to 95% (Fig. 2D). This phenomenon may stem from the insolubility of the organic fluorophore in water and results in efficient aggregate emission with a high fw. The molecular fluorophore HLZ-BTED with efficient aggregate emission in water is eligible for further NIR-II biomedical fluorescence imaging.
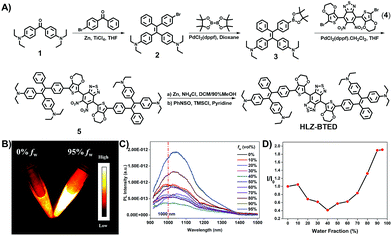 | ||
| Fig. 2 (A) Synthetic routes of the AIE fluorophore HLZ-BTED based on BBTD and TPE. (B) NIR-II fluorescence images (808 nm excitation, 1000 LP, 10 ms) of HLZ-BTED in pure tetrahydrofuran (THF) and a THF/water mixture with 95% water volume fraction (fw). The concentration is 2 × 10⁻⁵ M. (C) Fluorescence (FL) emission spectra of HLZ-BTED in THF/water mixtures with different fw (0% to 95%). Excitation wavelength at 785 nm. (D) FL intensity ratio (calculated from Fig. 2C) (I/I0) of the HLZ-BTED fluorophore in different fws. I0 is the FL intensity of HLZ-BTED in pure THF. | ||
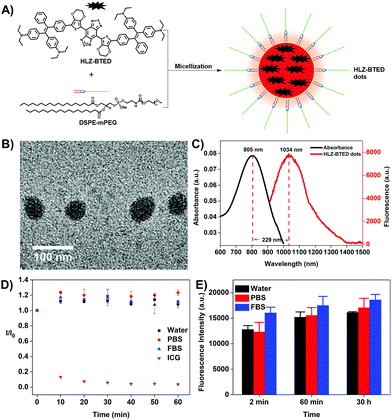
To illustrate the feasibility of HLZ-BTED for bioimaging application, we fabricated water-soluble and biocompatible AIE dots (HLZ-BTED dots) through a nanoprecipitation method by using 1,2-distearoyl-sn-glycero-3-phosphoethanolamine-N-(methoxy(polyethylene glycol)-5000) (DSPE-PEG5000) as the encapsulation matrix (Fig. 3A). Briefly, a HLZ-BTED/THF mixture was quickly added into the DSPE-PEG5000 deionized water solution in an ice bath under continuous sonication. Then, the remaining THF in the mixture was removed completely under a nitrogen flow. The redundant DSPE-PEG5000 was removed by ultrafiltration using 50 kDa centrifugal filter devices to obtain HLZ-BTED dots. The synthesized HLZ-BTED dots showed high monodispersity and homogeneity with an average particle size of ∼50 nm as determined by transmission electron microscopy (TEM, Fig. 3B) and a hydrodynamic diameter of ∼60 nm as determined by dynamic light scattering (DLS, Fig. S3A†). The zeta potential distribution of the HLZ-BTED dots was measured and the colloidal stability of the AIE dots under physiological conditions was evaluated. The results have demonstrated that the nanoparticles have negative surface charges and excellent stability in water and physiological media (Fig. S3B and S4†). The UV-vis-NIR absorption and NIR-II fluorescence emission spectra of the HLZ-BTED dots in water were investigated under 785 nm excitation. As shown in Fig. 3C, the absorption peak was at ∼805 nm, while the fluorescence emission peak was at ∼1034 nm with a 229 nm Stokes shift. In Fig. S2,† the NIR-II quantum yield (QY) of the HLZ-BTED dots in water was measured to be 0.18% under 785 nm laser excitation using IR-26 dye as a reference (QY = 0.5%), which was around two-fold higher than that of the fluorophore in THF (QY = 0.1%) and matched well with the results for exploring the AIE property in Fig. 2D. The large Stokes shift and appropriate fluorescence efficiency of the HLZ-BTED dots are remarkably beneficial for NIR-II AIE bioimaging.
The HLZ-BTED dots showed superior photostability in water, phosphate buffered saline (PBS), and fetal bovine serum (FBS) under continuous 808 nm laser irradiation for 1 h at a power density of 180 mW cm−2, while indocyanine green (ICG), which is approved by the FDA for NIR-I biomedical fluorescence imaging in water, showed a drastic decrease in fluorescence intensity using the same measurement method (Fig. 3D). To explore time-dependent fluorescence stability in different media, the variation in fluorescence intensity of the HLZ-BTED dots in water, PBS, and FBS was observed at different time points (2 min, 60 min and 30 h) after incubation at room temperature, exhibiting excellent temporal stability without an obvious change in the FL intensity (Fig. 3E). These photo and temporal stability results demonstrated that the HLZ-BTED dots could be useful for long-term in vivo imaging.
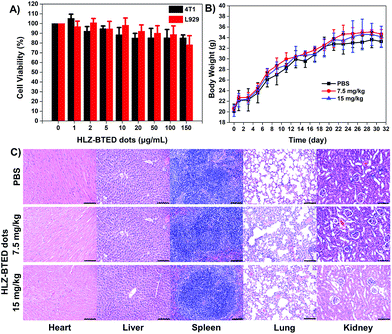
To further demonstrate the capability of the HLZ-BTED dots as a NIR-II imaging contrast agent in vivo, the pharmacokinetics and potential toxicity of the HLZ-BTED dots were carefully evaluated. The pharmacokinetics were studied via the measurement of the blood circulation half-life. The half-life time of the HLZ-BTED dots was 204 min (Fig. S5†). The long circulation time of the AIE dots in blood was mainly due to the strong interaction between the HLZ-BTED dots and serum albumin (Fig. S6,†KD = 0.0303 nM), and allowed them to reach their imaging target. The cytotoxicity of the HLZ-BTED dots to 4T1 mammary cancer and L929 mouse fibroblast cell lines was demonstrated using the standard 3-(4,5-dimethylthiazol-2-yl)-2,5-diphenyl tetrazolium bromide (MTT) assay. As shown in Fig. 4A, no obvious cytotoxicity was observed even when the concentration was increased to 150 μg mL−1. The long-term potential toxicity of the HLZ-BTED dots in normal KM mice was evaluated. A solution of PBS (0.2 mL, n = 3) and medium dose HLZ-BTED dots (0.2 mL, 7.5 mg kg−1, n = 3), or high dose HLZ-BTED dots (0.2 mL, 15 mg kg−1, n = 3) was injected into normal KM mice by intravenous injection (i.v.) via the tail vein. No significant difference in body weight was observed between the PBS control group and the HLZ-BTED dot administered groups during the research process (31 days) (Fig. 4B). Moreover, the major organs of the mice, including the heart, liver, spleen, lungs and kidneys were obtained and stained with hematoxylin and eosin (H&E) for histopathological study at 31 days after treatment. The H&E staining results shown in Fig. 4C exhibited no obvious necrosis or inflammation lesions in all the major organs, indicating that the HLZ-BTED dots have excellent biocompatibility and are more applicable for NIR-II bioimaging in vivo.
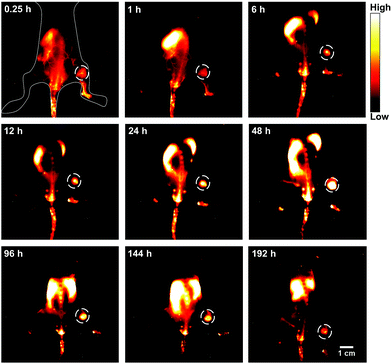
Breast cancer is the most common cancer in women worldwide.19 Early diagnosis of breast cancer with the use of systemic therapy has an excellent prognosis and increases the long-term disease-free survival (DFS).20 Firstly, the in vitro cellular endocytosis of the HLZ-BTED dots was studied using 4T1 breast cancer cells. As shown in Fig. S7,† the NIR-II fluorescence intensity of the 4T1 cells incubated with the HLZ-BTED dots showed explicit time dependence, suggesting that the AIE dots can permeate into the cells via the cellular membrane. To explore the ability of the HLZ-BTED dots to diagnose breast cancer early, a mouse model of breast cancer was established. 4T1 breast cancer cells (roughly 2 × 10⁶) were subcutaneously injected into the right leg of female BALB/c mice. NIR-II fluorescence imaging of 4T1 breast tumors was carried out by intravenously injecting the AIE dots (0.2 mL, 10 mg kg−1) into 4T1 tumor-bearing mice (n = 3) through the tail vein when the tumors reached ∼60 mm3 in a week. The fluorescence intensity (1000 nm LP, 100 ms) in tumors reached the highest level at 48 h post-injection under 808 nm excitation with a power density of 90 mW cm−2 (Fig. 5 and S8†). For up to 8 days post-injection, the NIR-II fluorescence signal of tumors was extremely strong and clearly delineated the normal tissues, indicating that the AIE HLZ-BTED dots are adequate for long-term tumor imaging and real-time image-based monitoring for solid tumor therapy. An ex vivo biodistribution study was performed for the HLZ-BTED dots to evaluate their distribution in major organs at 192 h (Fig. S9†). High accumulation was observed in the liver and spleen, which suggested that the clearance routes of the HLZ-BTED dots were through the hepatobiliary system. In addition, the AIE dots showed high accumulation in 4T1 tumors for up to 8 days (Fig. S9†).
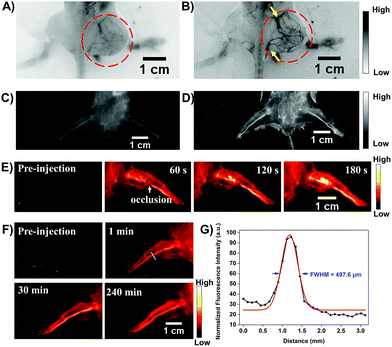
Transcatheter arterial embolization (TAE) is widely used in the clinic to increase survival for cancer patients who are not suitable for chemotherapy and surgical resection.21 To estimate the potential feasibility of the HLZ-BTED dots as a NIR-II contrast agent for the in vivo imaging of the tumor-feeding blood vessels to implement TAE, the AIE HLZ-BTED dots were i.v. injected into 4T1 tumor bearing BALB/c mice (n = 3). At 2 min post-injection, the tumor vasculature was visualized using an InGaAs camera with 1000 nm (Fig. 6A, 200 ms exposure time) and 1250 nm (Fig. 6B, 800 ms exposure time) long-pass filters under 808 nm laser excitation. The NIR-II fluorescence images of the 4T1 tumor blood vessels showed a more distinct vascular network with the 1250 nm long-pass filter than with the 1000 nm one, owing to both reduced biological auto-fluorescence and photon scattering in the longer wavelength NIR-II region. Meanwhile a similar image quality via different long-pass filters has been demonstrated in the hind limb vasculature of C57BL/6 mice (Fig. 6C and D). Moreover, we performed a surgery to induce incomplete hind limb ischemia to mimic the NIR-II fluorescence imaging-guided vascular embolization procedure. The occlusion site of the blood supply vessels was precisely monitored by NIR-II imaging using the HLZ-BTED dots (Fig. 6E). Then the capability of long-term vasculature imaging using the HLZ-BTED dots was investigated. As shown in Fig. 6F, at 4 h post-injection, the vasculature was still clearly visualized through NIR-II imaging which would be adequate for surgical operation. The resolution (497.6 μm) of the hind limb vasculature was investigated via the Gaussian-fitted full width at half maximum (FWHM), which further confirmed the excellent ability of the HLZ-BTED dots to precisely map vascular vessels with NIR-II imaging (Fig. 6G).
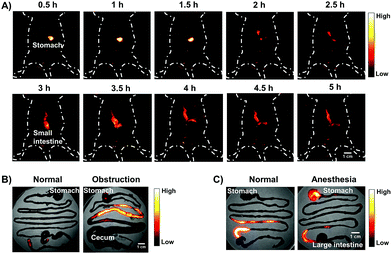
The gastrointestinal (GI) tract is an organ system, which includes all organ structures between the mouth and the anus, such as the esophagus, stomach, small intestine, and large intestine. The GI tract is responsible for ingesting and digesting food, extracting and absorbing nutrients, and expelling the waste as feces. Recently, non-invasive imaging modalities such as positron emission tomography (PET),22 magnetic resonance imaging (MRI),23 X-ray computed tomography (CT),24 and photoacoustic (PA)22 imaging, have played an important role in GI function research and the diagnosis and prognosis of GI diseases. However, these imaging modalities are limited by their serious drawbacks, notably radiation risk, expensive instrument cost, long imaging times and limited spatial resolution for real-time gut function study such as physiological or pathological intestinal motility. NIR-II fluorescence imaging may provide a reliable method for monitoring intestinal motility disorders or dysfunction and providing evaluation information of GI therapeutic agents in vivo due to superior temporal–spatial resolution.25 Therefore, as a proof of concept, we demonstrated the feasibility of the AIE HLZ-BTED dots for in vivo NIR-II imaging of the GI tract by oral administration. First, the fluorescence intensity and hydrodynamic sizes of the HLZ-BTED dots in different pH buffers ranging from 1 to 9 or in gastric pH 1 buffer were investigated respectively. No significant difference was observed between different conditions, demonstrating the excellent stability and capability of the AIE dots as a GI tract contrast agent (Fig. S10†). Second, healthy BALB/c mice (n = 3) were gavaged with the HLZ-BTED dots (0.1 mL, 5 mg kg−1) for real-time imaging of intestinal motility and monitoring the behavior of micelles within the GI tract. NIR-II fluorescence images at different time points (5, 10, 20, 30, 60, 90, 180, 480, 600 and 1440 min) were obtained under 808 nm laser irradiation (180 mW cm−2, within the safety limits (329 mW cm−2) determined by the International Commission on Non-ionizing Radiation Protection) through an InGaAs camera (200 ms exposure time) with a 1250 nm long-pass filter. As shown in Fig. 7A, from 5 min to 480 min after gavaging, the fluorescent signals were observed in the stomach, duodenum, jejunum, ileum, cecum, and colon. During the imaging procedure of the intestine, the contractile function of the intestine was demonstrated by the recorded Movie S1.† The fluorescence intensity movement in the small intestine indicated vigorous contractility with peristalsis and segmental contractions of the intestine at 330 min after gavaging. By fluorescence intensity map analysis of regions of interest (ROIs),25f the intestine peristalsis frequency and propagation velocity was about 28–40 cycles min−1 and 2.61 ± 0.23 cm s−1, respectively. At 600 min after gavaging, the fluorescent signal was first detected in feces, indicating that the NIR-II dots moved out of the body from the rectum and anus. At 24 h after gavaging, no fluorescent signal of the abdomen was detected. These results illustrated that the HLZ-BTED dots can be totally excreted through the GI tract within 24 h and are not absorbed into the body through the intestine. The HLZ-BTED dots used in GI tract imaging are excreted quickly due to low absorption in the GI tract while the HLZ-BTED dots would interact with serum plasma and the immune system by i.v. injection, leading to the slow clearance routes of the HLZ-BTED dots through the hepatobiliary system. Moreover, in Fig. 7B and 8C, the experimental results showed that the use of an anesthetic, pentobarbital sodium, could suppress duodenum motility and gastric emptying, indicating that the NIR-II HLZ-BTED dots could be a powerful tool for assessing the effects of drugs on the GI tract.
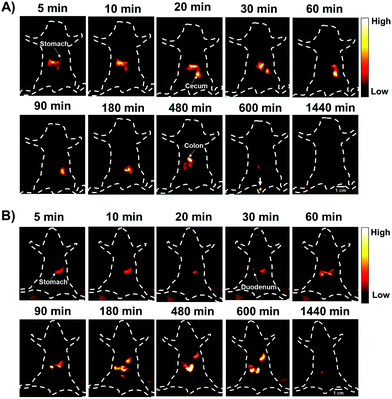 | ||
| Fig. 7 (A and B) Representative non-invasive NIR-II fluorescence images (1250 nm LP, 200 ms, 808 nm excitation, 180 mW cm−2) of the gastrointestinal tract (GI tract) in BALB/c mice gavaged with the HLZ-BTED dots (0.1 mL, 5 mg kg−1) for real-time monitoring of gastrointestinal peristalsis of normal mice (A) and mice anesthetized (B) using pentobarbital sodium (n = 3 mice). The white arrow indicates the feces of mice (Fig. 7A, 600 min). Scale bar: 1 cm. | ||
To investigate the ability of the HLZ-BTED dots to diagnose intestinal diseases such as obstructions which impede or block peristaltic movement, we built a mouse model of intestinal partial obstruction according to the reported methods.26 Then, we gavaged the mice with intestinal obstruction with the HLZ-BTED dots (0.1 mL, 5 mg kg−1). The NIR-II images shown in Fig. 8A and 7A exhibited differences in the intestinal distribution of dots between the mice with obstruction and healthy mice. At 5 h after gavaging, the lower small intestine was fully filled and distended after dissection, and the fluorescent signal was strong in the upper and medial small intestine (Fig. 8B), indicating that the HLZ-BTED dots were accumulated in these parts and are suitable for diagnosing intestinal obstruction.
Experimental section
All animal experiments were performed according to the Chinese Regulations for the Administration of Affairs Concerning Experimental Animals and approved by the Institutional Animal Care and Use Committee (IACUC) of Wuhan University. And all experimental details are provided in the ESI.†Conclusions
In conclusion, we have successfully designed and synthesized a novel NIR-II organic fluorophore HLZ-BTED with AIE features. The organic fluorophore could be encapsulated as HLZ-BTED dots with good water-solubility and biocompatibility for in vivo NIR-II biomedical imaging. We further performed in vivo NIR-II imaging experiments that revealed the excellent passive targeted long-term NIR-II fluorescence imaging performance of the HLZ-BTED dots in breast tumor-bearing mice. Moreover, the HLZ-BTED dots were an excellent NIR-II imaging contrast agent for superior spatial–temporal resolution of tumor-feeding vessels imaged with a 1250 nm long-pass filter, precisely monitoring the occlusion site of incomplete hind limb ischemia and long-term hind limb vasculature, and have the potential capability for image-guided transcatheter arterial embolization. To the best of our knowledge, as a proof-of-concept, this is the first time that non-invasive and real-time NIR-II imaging of the gastrointestinal tract in health and in disease has been performed. Furthermore, dynamic NIR-II fluorescence imaging with gavage of the HLZ-BTED dots can be used to monitor intestinal motility in real-time, and thus provides a method for the diagnosis of intestinal motility disorders and information on the response of the intestine to therapeutic agents.Conflicts of interest
There are no conflicts to declare.Acknowledgements
This work was partially supported by grants from the NSFC (81773674, 81573383, and 21390402), NSFHP (2017CFA024, 2017CFB711, and 2016ACA126), ABRPSTCS (SYG201521), NSFJP (BK20160387), Shenzhen Science and Technology Research Grant (JCYJ20170303170809222), Fundamental Research Funds for the Central Universities and Open Research Fund Program of the Hubei Province Engineering and Technology Research Center for Fluorinated Pharmaceuticals.Notes and references
- (a) X. D. Zhang, H. Wang, A. L. Antaris, L. Li, S. Diao, R. Ma, A. Nguyen, G. Hong, Z. Ma, J. Wang, S. Zhu, J. M. Castellano, T. Coray, Y. Liang, J. Luo and H. Dai, Adv. Mater., 2016, 28, 6872–6879 CrossRef CAS PubMed; (b) H. Wan, J. Yue, S. Zhu, T. Uno, X. Zhang, Q. Yang, K. Yu, G. Hong, J. Wang, L. Li, Z. Ma, H. Gao, Y. Zhong, J. Su, A. L. Antaris, Y. Xia, J. Luo, Y. Liang and H. Dai, Nat. Commun., 2018, 9, 1171 CrossRef PubMed.
- (a) E. C. Rossi, A. Ivanova and J. F. Boggess, Gynecol. Oncol., 2012, 124, 78–82 CrossRef PubMed; (b) G. Wishart, S.-W. Loh, L. Jones and J. Benson, Eur. J. Surg. Oncol., 2012, 38, 651–656 CrossRef CAS PubMed; (c) C. Hirche, D. Murawa, Z. Mohr, S. Kneif and M. Hünerbein, Breast Cancer Res. Treat., 2010, 121, 373–378 CrossRef PubMed.
- (a) M. Herranz and A. Ruibal, J. Oncol., 2012, 2012, 863747 Search PubMed; (b) C. Zeng, W. Shang, X. Liang, X. Liang, Q. Chen, C. Chi, Y. Du, C. Fang and J. Tian, ACS Appl. Mater. Interfaces, 2016, 8, 29232–29241 CrossRef CAS PubMed; (c) S. Luo, E. Zhang, Y. Su, T. Cheng and C. Shi, Biomaterials, 2011, 32, 7127–7138 CrossRef CAS PubMed; (d) J. Yang, Q. Xie, H. Zhou, L. Chang, W. Wei, Y. Wang, H. Li, Z. Deng, Y. Xiao, J. Wu, P. Xu and X. Hong, J. Proteome Res., 2018, 17, 2428–2439 CrossRef CAS PubMed.
- (a) Y. Sun, X. Zeng, Y. Xiao, C. Liu, H. Zhu, H. Zhou, Z. Chen, F. Xu, J. Wang, M. Zhu, J. Wu, M. Tian, H. Zhang, Z. Deng, Z. Cheng and X. Hong, Chem. Sci., 2018, 9, 2092–2097 RSC; (b) Y. Sun, M. Ding, X. Zeng, Y. Xiao, H. Wu, H. Zhou, B. Ding, C. Qu, W. Hou, A. Erbu, Y. Zhang, Z. Cheng and X. Hong, Chem. Sci., 2017, 8, 3489–3493 RSC.
- (a) F. Ding, Y. Zhan, X. Lu and Y. Sun, Chem. Sci., 2018, 9, 4370–4380 RSC; (b) G. Hong, A. L. Antaris and H. Dai, Nat. Biomed. Eng., 2017, 1, 0010 CrossRef; (c) F. Ding, S. Chen, W. Zhang, Y. Tu and Y. Sun, Bioorg. Med. Chem., 2017, 25, 5179–5184 CrossRef CAS PubMed; (d) Y. Xu, M. Tian, H. Zhang, Y. Xiao, X. Hong and Y. Sun, Chin. Chem. Lett., 2018, 29, 1093–1097 CrossRef CAS; (e) S. He, J. Song, J. Qu and Z. Cheng, Chem. Soc. Rev., 2018, 47, 4258–4278 RSC; (f) W. Zhu, Sci. China: Chem., 2016, 59, 203–204 CrossRef CAS; (g) B. Li, L. Lu, M. Zhao, Z. Lei and F. Zhang, Angew. Chem., Int. Ed., 2018, 57, 7483–7487 CrossRef CAS PubMed; (h) H. Zhou, Y. Xiao and X. Hong, Chin. Chem. Lett., 2018, 29, 1425–1428 CrossRef CAS; (i) J. Yang and X. Hong, Sci. China: Chem., 2018 DOI:10.1007/s11426-018-9341-7.
- (a) L. Liu, S. Wang, B. Zhao, P. Pei, Y. Fan, X. Li and F. Zhang, Angew. Chem., 2018, 130, 7640–7644 CrossRef; (b) Y. Fan, P. Wang, Y. Lu, R. Wang, L. Zhou, X. Zheng, X. Li, J. A. Piper and F. Zhang, Nat. Nanotechnol., 2018, 13, 941–946 CrossRef CAS PubMed; (c) P. Wang, Y. Fan, L. Lu, L. Liu, L. Fan, M. Zhao, Y. Xie, C. Xu and F. Zhang, Nat. Commun., 2018, 9, 2898 CrossRef PubMed; (d) Y. Zhong, Z. Ma, S. Zhu, J. Yue, M. Zhang, A. L. Antaris, J. Yuan, R. Cui, H. Wan, Y. Zhou, W. Wang, N. F. Huang, J. Luo, Z. Hu and H. Dai, Nat. Commun., 2017, 8, 737 CrossRef PubMed; (e) X. Jiang, C. Cao, W. Feng and F. Li, J. Mater. Chem. B, 2016, 4, 87–95 RSC; (f) D. Naczynski, M. Tan, M. Zevon, B. Wall, J. Kohl, A. Kulesa, S. Chen, C. Roth, R. Riman and P. Moghe, Nat. Commun., 2013, 4, 2199 CrossRef CAS PubMed.
- (a) M. Zhang, J. Yue, R. Cui, Z. Ma, H. Wan, F. Wang, S. Zhu, Y. Zhou, Y. Kuang, Y. Zhong, D.-W. Pang and H. Dai, Proc. Natl. Acad. Sci. U. S. A., 2018, 201806153 Search PubMed; (b) Z. Ma, M. Zhang, J. Yue, C. Alcazar, Y. Zhong, T. C. Doyle, H. Dai and N. F. Huang, Adv. Funct. Mater., 2018, 28, 1803417 CrossRef; (c) G. Chen, S. Lin, D. Huang, Y. Zhang, C. Li, M. Wang and Q. Wang, Small, 2018, 14, 1702679 CrossRef PubMed; (d) C. Li, Y. Zhang, G. Chen, F. Hu, K. Zhao and Q. Wang, Adv. Mater., 2017, 29, 1605754 CrossRef PubMed; (e) G. Chen, F. Tian, C. Li, Y. Zhang, Z. Weng, Y. Zhang, R. Peng and Q. Wang, Biomaterials, 2015, 53, 265–273 CrossRef CAS PubMed; (f) G. Hong, J. T. Robinson, Y. Zhang, S. Diao, A. L. Antaris, Q. Wang and H. Dai, Angew. Chem., Int. Ed., 2012, 51, 9818–9821 CrossRef CAS PubMed; (g) Y. Zhang, G. Hong, Y. Zhang, G. Chen, F. Li, H. Dai and Q. Wang, ACS Nano, 2012, 6, 3695–3702 CrossRef CAS PubMed.
- (a) G. Hong, S. Diao, J. Chang, A. L. Antaris, C. Chen, Z. Bo, Z. Su, D. N. Atochin, P. L. Huang, K. I. Andreasson, C. J. Kuo and H. Dai, Nat. Photonics, 2014, 8, 723–730 CrossRef CAS PubMed; (b) J. T. Robinson, K. Welsher, S. M. Tabakman, S. P. Sherlock, H. Wang, R. Luong and H. Dai, Nano Res., 2010, 3, 779–793 CrossRef CAS PubMed.
- (a) K. Shou, Y. Tang, H. Chen, S. Chen, L. Zhang, A. Zhang, Q. Fan, A. Yu and Z. Cheng, Chem. Sci., 2018, 9, 3105–3110 RSC; (b) G. Hong, Y. Zou, A. L. Antaris, S. Diao, D. Wu, K. Cheng, X. Zhang, C. Chen, B. Liu, Y. He, J. Z. Wu, J. Yuan, B. Zhang, Z. Tao, C. Fukunaga and H. Dai, Nat. Commun., 2014, 5, 4206 CrossRef CAS PubMed.
- (a) A. L. Antaris, H. Chen, K. Cheng, Y. Sun, G. Hong, C. Qu, S. Diao, Z. Deng, X. Hu, B. Zhang, X. Zhang, O. K. Yaghi, Z. R. Alamparambil, X. Hong, Z. Cheng and H. Dai, Nat. Mater., 2016, 15, 235–242 CrossRef CAS PubMed; (b) A. L. Antaris, H. Chen, S. Diao, Z. Ma, Z. Zhang, S. Zhu, J. Wang, A. X. Lozano, Q. Fan, L. Chew, M. Zhu, K. Cheng, X. Hong, H. Dai and Z. Cheng, Nat. Commun., 2017, 8, 15269 CrossRef CAS PubMed; (c) Y. Feng, S. Zhu, A. L. Antaris, H. Chen, Y. Xiao, X. Lu, L. Jiang, S. Diao, K. Yu, Y. Wang, S. Herraiz, J. Yue, X. Hong, G. Hong, Z. Cheng, H. Dai and A. J. Hsueh, Chem. Sci., 2017, 8, 3703–3711 RSC.
- (a) K. Shou, C. Qu, Y. Sun, H. Chen, S. Chen, L. Zhang, H. Xu, X. Hong, A. Yu and Z. Cheng, Adv. Funct. Mater., 2017, 27, 1700995 CrossRef PubMed; (b) S. Zhu, Q. Yang, A. L. Antaris, J. Yue, Z. Ma, H. Wang, W. Huang, H. Wan, J. Wang, S. Diao, B. Zhang, X. Li, Y. Zhong, K. Yu, G. Hong, J. Luo, Y. Liang and H. Dai, Proc. Natl. Acad. Sci. U. S. A., 2017, 114, 962–967 CrossRef CAS PubMed; (c) Q. Yang, Z. Ma, H. Wang, B. Zhou, S. Zhu, Y. Zhong, J. Wang, W. Hao, A. Antaris, M. Rui, X. Zhang, J. Yang, X. Zhang, H. Sun, W. Liu, Y. Liang and H. Dai, Adv. Mater., 2017, 29, 1605497 CrossRef PubMed; (d) Y. Sun, C. Qu, H. Chen, M. He, C. Tang, K. Shou, S. Hong, M. Yang, Y. Jiang, B. Ding, Y. Xiao, L. Xing, X. Hong and Z. Cheng, Chem. Sci., 2016, 7, 6203–6207 RSC; (e) Q. Yang, Z. Hu, S. Zhu, R. Ma, H. Ma, Z. Ma, H. Wan, T. Zhu, Z. Jiang, W. Liu, L. Jiao, H. Sun, Y. Liang and H. Dai, J. Am. Chem. Soc., 2018, 140, 1715–1724 CrossRef CAS PubMed; (f) S. Zhu, S. Herraiz, J. Yue, M. Zhang, H. Wan, Q. Yang, Z. Ma, Y. Wang, J. He, A. L. Antaris, Y. Zhong, S. Diao, Y. Feng, Y. Zhou, K. Yu, G. Hong, Y. Liang, A. J. Hsueh and H. Dai, Adv. Mater., 2018, 30, 1705799 CrossRef PubMed.
- J. Luo, Z. Xie, J. W. Lam, L. Cheng, H. Chen, C. Qiu, H. S. Kwok, X. Zhan, Y. Liu, D. Zhu and B. Z. Tang, Chem. Commun., 2001, 1740–1741 RSC.
- (a) Z. Chen, J. Zhang, M. Song, J. Yin, G.-A. Yu and S. H. Liu, Chem. Commun., 2015, 51, 326–329 RSC; (b) J. Mei, N. L. Leung, R. T. Kwok, J. W. Lam and B. Z. Tang, Chem. Rev., 2015, 115, 11718–11940 CrossRef CAS PubMed; (c) G. Feng and B. Liu, Acc. Chem. Res., 2018, 51, 1404–1414 CrossRef CAS PubMed; (d) J. Shi, Q. Deng, C. Wan, M. Zheng, F. Huang and B. Tang, Chem. Sci., 2017, 8, 6188–6195 RSC; (e) T. He, N. Niu, Z. Chen, S. Li, S. Liu and J. Li, Adv. Funct. Mater., 2018, 28, 1706196 CrossRef; (f) Q. Hu, M. Gao, G. Feng and B. Liu, Angew. Chem., Int. Ed., 2014, 53, 14225–14229 CrossRef CAS PubMed; (g) S. Zhen, S. Wang, S. Li, W. Luo, M. Gao, L. G. Ng, C. C. Goh, A. Qin, Z. Zhao and B. Liu, Adv. Funct. Mater., 2018, 28, 1706945 CrossRef.
- J. Qi, C. Sun, A. Zebibula, H. Zhang, R. T. Kwok, X. Zhao, W. Xi, J. W. Lam, J. Qian and B. Z. Tang, Adv. Mater., 2018, 30, 1706856 CrossRef PubMed.
- Z. Sheng, B. Guo, D. Hu, S. Xu, W. Wu, W. H. Liew, K. Yao, J. Jiang, C. Liu, H. Zheng and B. Liu, Adv. Mater., 2018, 30, 1800766 CrossRef PubMed.
- (a) F. Zhao, Z. Chen, G. Liu, C. Fan and S. Pu, Tetrahedron Lett., 2018, 59, 836–840 CrossRef CAS; (b) B. Xu, J. He, Y. Mu, Q. Zhu, S. Wu, Y. Wang, Y. Zhang, C. Jin, C. Lo, Z. Chi, A. Lien, S. Liua and J. Xu, Chem. Sci., 2015, 6, 3236–3241 RSC; (c) Z. Zhang, R. T. Kwok, Y. Yu, B. Z. Tang and K. M. Ng, J. Mater. Chem. B, 2018, 6, 4575–4578 RSC; (d) J. Mei, Y. Hong, J. W. Lam, A. Qin, Y. Tang and B. Z. Tang, Adv. Mater., 2014, 26, 5429–5479 CrossRef CAS PubMed; (e) S. Xu, Y. Yuan, X. Cai, C.-J. Zhang, F. Hu, J. Liang, G. Zhang, D. Zhang and B. Liu, Chem. Sci., 2015, 6, 5824–5830 RSC; (f) Y. Yuan, C. J. Zhang, M. Gao, R. Zhang, B. Z. Tang and B. Liu, Angew. Chem., Int. Ed., 2015, 54, 1780–1786 CrossRef CAS PubMed.
- (a) H. Shi, S. Wang, L. Fang and B. Z. Tang, Tetrahedron Lett., 2016, 57, 4428–4434 CrossRef CAS; (b) X. Y. Shen, Y. J. Wang, E. Zhao, W. Z. Yuan, Y. Liu, P. Lu, A. Qin, Y. Ma, J. Z. Sun and B. Z. Tang, J. Phys. Chem. C, 2013, 117, 7334–7347 CrossRef CAS.
- X. Zeng, Y. Xiao, J. Lin, S. Li, H. Zhou, J. Nong, G. Xu, H. Wang, F. Xu, J. Wu, Z. Deng and X. Hong, Adv. Healthcare Mater., 2018, 7, 1800589 CrossRef PubMed.
- (a) J. Ferlay, I. Soerjomataram, R. Dikshit, S. Eser, C. Mathers, M. Rebelo, D. M. Parkin, D. Forman and F. Bray, Int. J. Cancer, 2015, 136, E359–E386 CrossRef CAS PubMed; (b) M. Ding, H. Wang, C. Qu and X. Hong, Cancer Lett., 2018, 432, 47–55 CrossRef CAS PubMed; (c) C. Qu, M. Ding, H. Wang, M. X. Zhu and X. Hong, J. Med. Chem., 2017, 60(11), 4680–4692 CrossRef CAS PubMed.
- C. Burgess, V. Cornelius, S. L ove, J. Graham, M. Richards and A. Ramirez, BMJ, 2005, 330, 702 CrossRef PubMed.
- Ş. Aksoy, B. Akçe, Ö. Kılıçkesmez, R. U. Gürsü, M. S. Çakır, M. A. Nazlı and A. Aren, Journal of Breast Health, 2016, 12, 137–140 CrossRef PubMed.
- (a) Y. Zhang, M. Jeon, L. J. Rich, H. Hong, J. Geng, Y. Zhang, S. Shi, T. E. Barnhart, P. Alexandridis, J. D. Huizinga, M. Seshadri, W. Cai, C. Kim and J. F. Lovell, Nat. Nanotechnol., 2014, 9, 631–638 CrossRef CAS PubMed; (b) Y. Zhang, D. Wang, S. Goel, B. Sun, U. Chitgupi, J. Geng, H. Sun, T. E. Barnhart, W. Cai, J. Xia and J. F. Lovell, Adv. Mater., 2016, 28, 8524–8530 CrossRef CAS PubMed.
- (a) J. Huang, Q. Shu, L. Wang, H. Wu, A. Y. Wang and H. Mao, Biomaterials, 2015, 39, 105–113 CrossRef CAS PubMed; (b) V. S. Perera, G. Chen, Q. Cai and S. D. Huang, Analyst, 2016, 141, 2016–2022 RSC; (c) A. Khalaf, C. L. Hoad, R. C. Spiller, P. A. Gowland, G. W. Moran and L. Marciani, World J. Gastrointest. Pathophysiol., 2015, 6, 140–149 CrossRef PubMed; (d) J. Alyami, R. Spiller and L. Marciani, Neurogastroenterol. Motil., 2015, 27, 1687–1692 CrossRef CAS PubMed.
- (a) X. Zheng, J. Shi, Y. Bu, G. Tian, X. Zhang, W. Yin, B. Gao, Z. Yang, Z. Hu, X. Liu, L. Yan, Z. Gu and Y. Zhao, Nanoscale, 2015, 7, 12581–12591 RSC; (b) Z. Liu, X. Ran, J. Liu, Y. Du, J. Ren and X. Qu, Biomaterials, 2016, 100, 17–26 CrossRef CAS PubMed; (c) Z. Liu, J. Liu, R. Wang, Y. Du, J. Ren and X. Qu, Biomaterials, 2015, 56, 206–218 CrossRef CAS PubMed.
- (a) M. G. Panthani, T. A. Khan, D. K. Reid, D. J. Hellebusch, M. R. Rasch, J. A. Maynard and B. A. Korgel, Nano Lett., 2013, 13, 4294–4298 CrossRef CAS PubMed; (b) R. Wang, L. Zhou, W. Wang, X. Li and F. Zhang, Nat. Commun., 2017, 8, 14702 CrossRef PubMed; (c) N. Geva-Zatorsky, D. Alvarez, J. E. Hudak, N. C. Reading, D. Erturk-Hasdemir, S. Dasgupta, U. H. Von Andrian and D. L. Kasper, Nat. Med., 2015, 21, 1091–1100 CrossRef CAS PubMed; (d) J. Li, S. Thamphiwatana, W. Liu, B. Esteban-Fernández de Ávila, P. Angsantikul, E. Sandraz, J. Wang, T. Xu, F. Soto, V. Ramez, X. Wang, W. Gao, L. Zhang and J. Wang, ACS Nano, 2016, 10, 9536–9542 CrossRef CAS PubMed; (e) S. Kwon, C. Davies-Venn and E. M. Sevick-Muraca, Neurogastroenterol. Motil., 2012, 24, 494–497 CrossRef CAS PubMed; (f) S. Kwon and E. M. Sevick-Muraca, Neurogastroenterol. Motil., 2011, 23, 881 CrossRef CAS PubMed; (g) K. Tahara, M. Nishio and H. Takeuchi, Drug Dev. Ind. Pharm., 2018, 44, 608–614 CrossRef CAS PubMed.
- S. Ha, L. Wei, B. Jorgensen, M. Lee, P. Park, S. Poudrier and S. Ro, J. Visualized Exp., 2018, 133, e57381 Search PubMed.
Footnotes |
| † Electronic supplementary information (ESI) available. See DOI: 10.1039/c8sc04363a |
| ‡ These authors contributed equally to this work. |
| This journal is © The Royal Society of Chemistry 2019 |

