 Open Access Article
Pattern recognition of toxic metal ions using a single-probe thiocoumarin array†
David G.
Smith‡
 ,
Linda
Mitchell‡
and
Elizabeth J.
New
 *
*
School of Chemistry, The University of Sydney, NSW 2006, Australia. E-mail: elizabeth.new@sydney.edu.au
First published on 27th November 2018
Abstract
Pattern recognition methods such as linear discriminant analysis and principal component analysis are useful tools for the identification of analytes such as metal ions. These typically use a number of distinct molecular probes that exhibit cross-reactivity. Here we report a single molecule that demonstrates varying response in different solvents, therefore enabling the combination of probe and solvent to generate the required array diversity. Seven toxic metal ions were introduced as aqueous samples, and PCA and LDA techniques applied. The array could correctly identify all metals in pure water samples, all metals in doped lake-water samples. Further, we have explored the limit of detection of the system for two metal ions, Cu(II) and Hg(II), confirming the promise of the system as a candidate to identify toxic metals in environmental water sources.
Introduction
Heavy metals are known to have highly toxic effects in biological systems.1 Mercury2 and lead3 primarily affect the nervous system, whereas nickel4 and cadmium5 are carcinogenic. While silver has beneficial antimicrobial properties, it can be absorbed into the body and silver nanoparticles potentially have undesirable effects.6 Human activities have led to increased levels of exposure to these contaminants in the environment over the course of the twentieth century.7One method for detecting these metals is mass spectrometry, which can be applied to both environmental8 and biological9 sensing. Mass spectrometry generally requires specialized equipment, which are often expensive and non-portable. There is therefore an ongoing need for the development of faster, more efficient ways to detect these metals, especially in the field, and including equipment that is more readily available to the majority of end-users.
Fluorescence is a highly attractive alternative technique, and there are currently many reported fluorescent probes for metal ions.10–12 Fluorescence sensing offers great sensitivity, specificity, simplicity and speed. Typically, when designing metal-sensitive fluorescent probes, one aims for high selectivity for the analyte of interest. Conversely, an array often works best when the opposite is achieved, and the fluorescent probes used in the array exhibit high diversity and cross-reactivity.13,14 Array-based sensing methodologies have gained increasing prominence over the past decade.15–17 Arrays offer advantages of high-throughput, fast, and straightforward analysis. Arrays typically use a number of distinct chemical probes in combination, and their combined fingerprint response allows the unambiguous identification of an analyte.18 In contrast, the use of alternative methods to generate diversity of responses, whether environmental (pH,19 solvent,20 temperature) or involving other parameters (e.g. kinetics of response) has not yet been as widely studied. Arrays constructed from a single-receptor fluorescent probe are relatively rare, with examples only recently being reported.21–23
Here, we report an array derived from a single structural probe operating in a number of solvents. We use principal component analysis (PCA) and linear discriminate analysis (LDA) for data analysis. This array is capable of identifying heavy metal ions in water and environmental water samples, and recognizing differing concentrations. A key feature of this work is the use of a single-molecular probe to form the array. This method offers great synthetic simplicity and allows seven metal ions to be distinguished using a single molecule.
Results and discussion
Initial observations on the response of thiocoumarins with metal ions
Thiocoumarins have previously been reported as probes for Hg2+, Au3+ and Ag+.24–26 The fluorescence signalling in each of these reported cases involves an increase in fluorescence due to the induced conversion from the non-fluorescent thiocarbonyl to highly fluorescent carbonyl species upon interaction with the metal ion. This desulfurization phenomenon has been observed for a range of thioketones; thionaphthalimides have been demonstrated to convert to their analogous oxygen counterparts upon treatment with Hg2+.27We became interested in thiocoumarins as suitable cross-reactive metal probes after noting that for a benzothiazolylcoumarin to be used as a selective probe for Au3+, it was necessary to add a chelator such as N,N,N′,N′-tetrakis(2-pyridinylmethyl)-1,2-ethanediamine (TPEN) to suppress interference from other metal ions, particularly Hg2+.25 We sought to investigate this further and to take advantage of this cross-reactive behaviour in creating a sensing array.
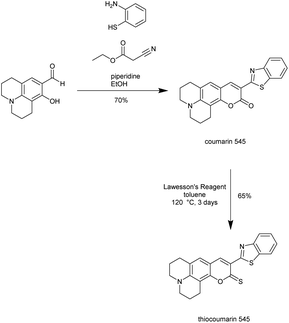
Our initial investigations involved thiocoumarin 545, a novel compound that we synthesized in two steps as outlined in Scheme 1. When either Hg2+ or Au3+ is added to thiocoumarin 545 in aqueous solution, the outcome is the same: both metal ions induce a large increase in the fluorescence intensity consistent with desulfurization of the thiocarbonyl to a carbonyl. This same fluorescence increase was also observed for other metal ions, with Ag+, Cd2+, Cu2+, Pt2+ and Pb2+ showing differing degrees of fluorescent enhancement. This list of metal species is not surprising as they are all largely thiophilic metals, which might be expected to promote the desulfurization process. This result implies that thiocoumarins of this type are not suitable as selective metal ion probes, but have potential as cross-reactive probes. The presence of common salts (Na+, K+, Mg+, Ca+ does not interfere with this transition metal-induced response and these common salts alone do not induce any change in fluorescence intensity (Fig. S1†).
An additional observation we made was that the fluorescent enhancement, which corresponds to desulfurization, occurs at to differing extents (Fig. S2†) and varying rates (Fig. S3 and Table S1†) in different solvents. Combining these two aspects leads to a large degree of variation in fluorescence emission. These differences indicated to us that this information can be used to distinguish and identify metals based upon their unique fingerprint responses.
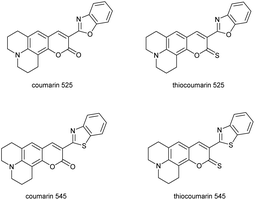
In order to determine whether thiocoumarin 545 was the best candidate for a single probe array, we investigated variants with different sulfur-to-oxygen substitutions (Chart 1). Coumarin 525 and thiocoumarin 525 were synthesized in a similar procedure to coumarin 545 and thiocoumarin 545 (methods in ESI†). We studied the four coumarins with a variety of solvents and metal ions to identify if the selected thiocoumarin 545 was the best candidate for the single probe array (Fig. 1). By comparing metal-specific responses of these four compounds, it is evident that the variation in emission response arises from the extent and rate of desulfurization of thiocoumarin variants, with the oxocoumarin forms showing little variation from metal to metal. We also observed a greater variation in response of thiocoumarin 545 compared to thiocoumarin 525. Based on these studies, we focussed on the thiocoumarin variants, and specifically thiocoumarin 545, for use in array analysis.
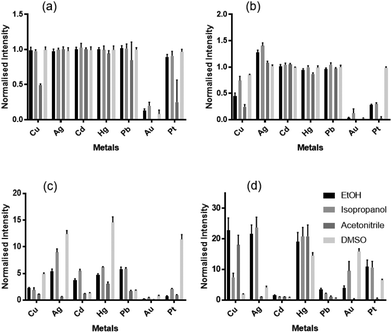 | ||
| Fig. 1 Normalized fluorescence intensity of (a) coumarin 525, (b) thiocoumarin 525, (c) coumarin 545 and (d) thiocoumarin 545 in the presence of added metal ion in the stated solvent. | ||
An initial fluorescent sensing array for the identification of metal ions
Thiocoumarin 545 was the most promising candidate for array-based sensing given that a number of metal ions show differential response depending on the solvent used (Fig. 1d). These metal ions are all relevant for environmental detection as they are toxic metals with deleterious effects. There is a requirement for all the solvents incorporated in the array to be water miscible to function with the aqueous samples we wish to test. The solvents used as the basis for the probe elements in the array were HEPES buffer, methanol, ethanol, isopropanol, acetonitrile, DMF and DMSO.96-Well plates were set up to examine combinations of each metal ion in the individual solvents, with a 20![[thin space (1/6-em)]](https://www.rsc.org/images/entities/char_2009.gif) :
:![[thin space (1/6-em)]](https://www.rsc.org/images/entities/char_2009.gif) 80 ratio of water to specified solvent (Fig. S4†) to ensure that water samples could be analyzed by this method. Five replicates of each combination were collected, and the fluorescence intensity measured on a plate reader. The data were interrogated using principal component analysis (PCA) and linear discriminant analysis (LDA). PCA reduces a larger set of variables into a smaller set, whilst still accounting for most of the variance in the original variables. LDA is also used for dimension reduction, and can further be used to predict group membership.
80 ratio of water to specified solvent (Fig. S4†) to ensure that water samples could be analyzed by this method. Five replicates of each combination were collected, and the fluorescence intensity measured on a plate reader. The data were interrogated using principal component analysis (PCA) and linear discriminant analysis (LDA). PCA reduces a larger set of variables into a smaller set, whilst still accounting for most of the variance in the original variables. LDA is also used for dimension reduction, and can further be used to predict group membership.
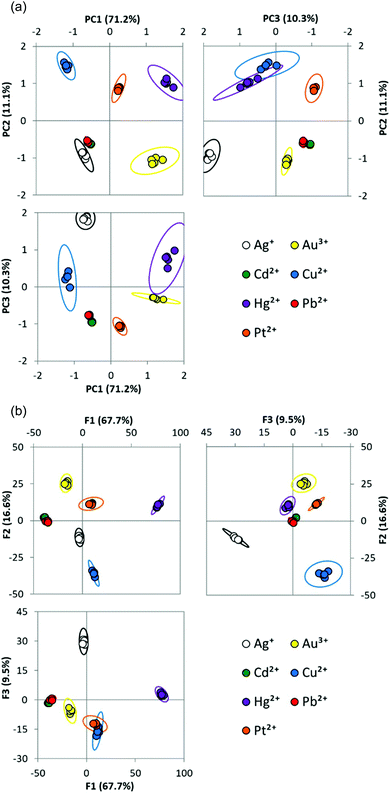
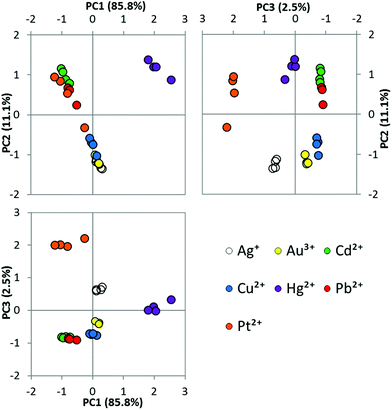
PCA of the data from seven metals in eight solvents shows that 93% of the original variance is explained by the first three principal components. Clear clustering between replicates of the same metal, and good separation between the clusters indicates the data is well suited for analysis by these methods (Fig. 2a). Using LDA (Fig. 2b), the percentage of replicates that can be correctly assigned can be examined through the jack-knife procedure. In this case, 100% of replicates were correctly classified.
When the analogous array was run using thiocoumarin 525, 100% of cases were also correctly classified (Fig. S5†). This result confirms that both thiocoumarins illustrated excellent discrimination power in the various solvents. We proceeded with only thiocoumarin 545 in subsequent array studies due to ease of synthesis and purification, attributed to its greater stability.
Reducing the number of sensor elements in the array
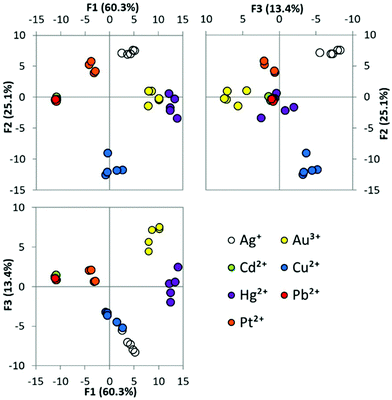
Even without statistical analysis, visual examination of data (Table S2†) for the array of seven metals in seven solvent sensor-elements indicates that some sensor-elements show similarity to one another. Other sensor-elements, such as HEPES, appear to show little discrimination between metals. This indicates these elements may contribute little to the discriminatory power of the array. We have previously reported methods for reducing the size of the array in terms of reducing the number of sensor-elements, based upon the statistical outputs during PCA and LDA procedures.28 Applying a similar procedure to this data allowed the number of sensor-elements, solvents in this case, to be reduced. We first used the correlation coefficient, which is a measure of how similar one probe is to another probe, to remove DMF as a sensor-element due to its similarity to acetonitrile. We next looked at the measure of sampling adequacy (MSA) values for the individual sensor-elements. A value of less than 0.5 would be considered unsatisfactory, and signal that a sensor-element with such a value could be removed as it will not be making a significant contribution to the array.29 HEPES was removed at this point based on this analysis. Re-running the PCA analysis after the removal of DMF and HEPES then indicated that methanol also gave a low MSA, and so methanol was also removed. This resulted in a four-membered array system consisting of thiocoumarin-545 in ethanol, isopropanol, acetonitrile, and DMSO respectively. Attempts to further remove any of these remaining four sensor-elements from the array had a detrimental effect on the success of the array. An array experiment was re-run using these four sensor-elements consisting of 1.6 μM thiocoumarin 545 and 100 μM of added metal ion. Applying PCA to this reduced array set of four sensor-elements shows clear grouping of the replicates and spacing between these groups. Applying LDA to this four sensor-element array shows that 98% of samples are classified into the correct group (Fig. 3 and S6†). The main advantage of using a smaller set of sensor-elements is that less sample preparation time is required, without losing the discriminatory power of the array.In order to investigate the effect of counteranion on array response, we collected measurements for two other mercury and copper(II) salts as a test data set (Table S3†), with the original data as a training set. In each case, the salt was correctly classified according to cation, confirming that the nature of the counteranion does not appear to impact the correct classification of the metal ion.
We have therefore demonstrated that the four sensor-element array can distinguish seven metal ions commonly associated with environmental toxicity. We anticipate that the array may be applicable to a wider range of heavy metals: for example, we have shown that Ru3+ can be distinguished from other metals (Table S4†). We also found that other first row transition metals such as Fe2+, Zn2+ and Ni2+ are discriminated, but to a lesser degree (Table S4†), and these metals do not interfere with the analysis of the main set of metals. We further anticipate that future work, expanding the range of environmental sensor-elements to include, for example, temperature or pH, may allow this larger range of metal ions to be identified with greater success.
Identification of metal ions in an environmental water sample
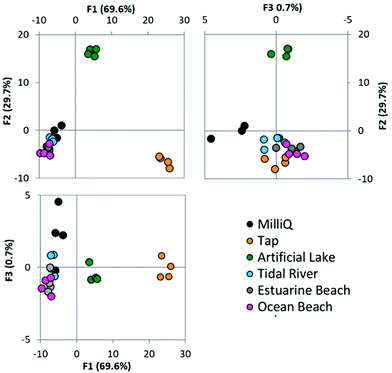
We next sought to examine the suitability of the array using water from an environmental sample. This is a greater challenge than using carefully controlled MilliQ water prepared samples that are otherwise free from background species and potential interferents. To assess this, the previous metal-ion identification experiment was repeated using water taken from a lake to prepare the metal ion solutions. PCA (Fig. 4) and LDA (Fig. S7a†) were performed using this data set. Good clustering of replicates, and clear spacing between groups was again observed following PCA, although the variation within groups appeared slightly greater than when using MilliQ water. 100% of the replicates were assigned to their correct group using LDA, showing that the array is robust to using environmental water samples.Examination of water samples from different environments
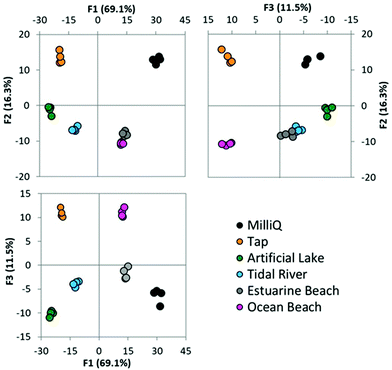
We next sought to expand the range and sources of the environmental water samples we tested. Initially, six water samples collected from various environments were tested using the full seven solvent array, without the addition of any doped metal ions. PCA (Fig. S7†) and LDA (Fig. 5) analysis were performed using this data. It is observed that tap water and lake water are significantly different from the other samples tested.Tap water can be easily distinguished in the primary factor, and lakewater using the second factor. MilliQ water can also be distinguished from all other samples using the third factor. The remaining three samples are not easily resolved from one another. These three samples originate from either the ocean, or are harbour locations open to the ocean and perhaps likely to be of similar composition and with a high salt content. It is not possible to correctly identify the location of these samples within this subset.
We next sought to test the ability of the array to detect metal ions in a range of environmental water samples. Cu2+ was chosen as a representative metal ion to be investigated and was dissolved in the various water samples before being added to the solvents that constituted the array. Fig. 6 shows the LDA plot resulting from the analysis of various environmental samples doped with Cu2+, in the selected four solvent array. It is observed that once Cu2+ has been doped into the samples, they are now all distinguishable from one another with 100% of replicates correctly assigned to their group.
Identification of concentrations of metal ions
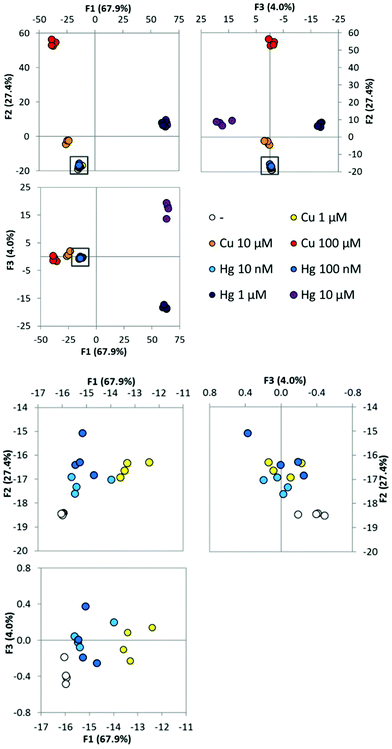
Having established the ability of the array to distinguish and identify between a set of distinct metal ions, we then investigated the sensitivity of the method. The scientific literature contains many reported arrays for toxic metal ions but to ensure applicability the arrays should operate with detection limits below regulated levels of the metal ion species of interest. The WHO specifies guideline values for limits of metal ions in drinking water. For copper this is 2000 μg L−1 which is approximately 30 μM and mercury is 6 μg L−1 which is approximately 30 nM.30 We performed an experiment in which a range of concentrations of either copper or mercury were added as solutions in MilliQ water to the four member array. Four replicates of each condition were performed. PCA (Fig. S9†) and LDA (Fig. 7) were performed on the complete data set containing both metal ions concurrently. Clearly, the highest concentrations of the metal ions tested are easily distinguishable (Cu2+ above 10 μM and mercury above 1 μM). When an expansion of the region containing the lower concentration replicates is shown, the remaining lower concentrations can be visually distinguished, although there is overlap when visualizing the 95% confidence intervals in the 2D plots. When LDA is performed and the leave-one-out procedure applied, all samples were classified as both their correct concentration, and correct metal ion identity. Both copper and mercury have been detected at concentrations below the WHO specified guidelines. It is further significant to note that this statistical analysis examined both metal ions simultaneously.Experimental
Synthesis
The chemical synthesis of the probes is detailed in the ESI.†Array procedure
For all experiments concentrated stock solutions of metal ions and probes were made. Stock metal ion solutions were made from K2PtCl4, Cu(NO3)2, AgNO3, CdCl2, Hg(NO3)2, Pb(NO3)2 and HAuCl4 at a concentration of 10 mM using the water source as stated in the individual experiment. Stock solutions of the (thio)coumarin probes were prepared as 1 mM solutions in DMSO.Working stock solutions were made from these concentrated stock solutions. As an example, for the experiment described in Fig. 3, a working stock solution of the metal ions was prepared by taking 50 μL of the 10 mM concentrated metal stock into a total volume of 1 mL using MilliQ water (or the appropriate environmental water source as specified, in other experiments) to make a 500 μM metal ion solution. Working thiocoumarin solutions were prepared by taking 10 μL of the 1 mM concentrated stock into a total volume of 5 mL of one of the specified solvents (methanol, ethanol, isopropanol, acetonitrile, DMSO, DMF or HEPES buffer) which formed the array.
All array experiments were performed in 96-well black polypropylene plates (Greiner). A total well volume of 300 μL was used consisting of 60 μL of the working metal solution with 240 μL of the working probe solution. Measurements were recorded on a PerkinElmer Enspire plate-reader. Prior to emission measurements being taken the plate was shaken for 30 s. An excitation wavelength of 485 nm and emission wavelength of 525 nm was used for a duration of 50 flashes.
Statistical analysis
Performed using SPPS Statistics version 24. Statistical analysis involved principal component analysis (PCA) during which three factors were extracted and a varimax rotation applied. Linear discriminant analysis (LDA) involved the use of the leave-one-out classification. The factor scores in each case were saved as variables and the data exported to Microsoft Excel to be plotted. There was no normalisation of the data prior to analysis – the raw fluorescence intensity values were used as-is in each case.Conclusions
In summary, we have developed a fluorescent probe array consisting of a single thiocoumarin probe in different solvents. We observed an increase in fluorescence intensity as the thiocoumarin is converted to the highly fluorescent oxocoumarin, and as this process is solvent and metal dependent, there is sufficiently diverse information to distinguish metal ions. Seven metal ion species can be differentiated in pure water and lake water samples. The sensitivity of the array was demonstrated by assessing varying concentrations of mercury and copper. In summary, we have shown that an efficient array can consist of just a single chemical sensor using variables such as solvent to create the required sensor-elements.Conflicts of interest
There are no conflicts to declare.Acknowledgements
D. G. S. acknowledges a Florence Mabel and Henry Bertie Gritton Postdoctoral Fellowship from the University of Sydney. E. J. N. acknowledges the Westpac Bicentennial Foundation for a Research Fellowship, and the Australian Research Council (DP150100649) for funding. L. M. acknowledges the support of the Research Training Program Scholarship and the Westpac Bicentennial Foundation for a Westpac Future Leaders Scholarship.References
- P. B. Tchounwou, C. G. Yedjou, A. K. Patlolla and D. J. Sutton, Molecular, Clinical and Environmental Toxicology, 2012, vol. 101 Search PubMed.
- B. Fernandes Azevedo, L. Barros Furieri, F. M. Peçanha, G. A. Wiggers, P. Frizera Vassallo, M. Ronacher Simões, J. Fiorim, P. Rossi de Batista, M. Fioresi, L. Rossoni, I. Stefanon, M. J. Alonso, M. Salaices and D. Valentim Vassallo, J. Biomed. Biotechnol., 2012, 2012, 1–11 CrossRef PubMed.
- T. Sanders, Y. Liu, V. Buchner and P. B. Tchounwou, Rev. Environ. Health, 2009, 24, 15–45 CAS.
- Y. Chervona, A. Arita and M. Costa, Metallomics, 2012, 4, 619 RSC.
- M. P. Waalkes, Mutat. Res., Fundam. Mol. Mech. Mutagen., 2003, 533, 107–120 CrossRef CAS PubMed.
- K. Mijnendonckx, N. Leys, J. Mahillon, S. Silver and R. Van Houdt, BioMetals, 2013, 26, 609–621 CrossRef CAS PubMed.
- L. Järup, Br. Med. Bull., 2003, 68, 167–182 CrossRef.
- S. D. Richardson, Anal. Chem., 2000, 72, 4477–4496 CrossRef CAS PubMed.
- D. J. Hare, E. J. New, M. D. de Jonge and G. McColl, Chem. Soc. Rev., 2015, 44, 5941–5958 RSC.
- D. W. Domaille, E. L. Que and C. J. Chang, Nat. Chem. Biol., 2008, 4, 168–175 CrossRef CAS PubMed.
- K. P. Carter, A. M. Young and A. E. Palmer, Chem. Rev., 2014, 114, 4564–4601 CrossRef CAS PubMed.
- D. Wu, A. C. Sedgwick, T. Gunnlaugsson, E. U. Akkaya, J. Yoon and T. D. James, Chem. Soc. Rev., 2017, 46, 7105–7123 RSC.
- W. J. Peveler, M. Yazdani and V. M. Rotello, ACS Sens., 2016, 1, 1282–1285 CrossRef CAS PubMed.
- D. G. Smith, I. L. Topolnicki, V. E. Zwicker, K. A. Jolliffe and E. J. New, Analyst, 2017, 3549–3563 RSC.
- P. Anzenbacher, P. Lubal, P. Bucek, M. A. Palacios and M. E. Kozelkova, Chem. Soc. Rev., 2010, 39, 3954–3979 RSC.
- A. T. Wright and E. V. Anslyn, Chem. Soc. Rev., 2006, 35, 14–28 RSC.
- Y. Liu, M. Mettry, A. D. Gill, L. Perez, W. Zhong and R. J. Hooley, Anal. Chem., 2017, 89, 11113–11121 CrossRef CAS PubMed.
- L. Liu and H. Lin, Anal. Chem., 2014, 86, 8829–8834 CrossRef CAS PubMed.
- Y. L. Liu, M. A. Palacios and P. Anzenbacher, Chem. Commun., 2010, 46, 1860–1862 RSC.
- S. Marbumrung, K. Wongravee, V. Ruangpornvisuti, G. Tumcharern, T. Tuntulani and B. Tomapatanaget, Sens. Actuators, B, 2012, 171–172, 969–975 CrossRef CAS.
- B. Roy, T. Saha Roy, S. A. Rahaman, K. Das and S. Bandyopadhyay, ACS Sens., 2018, 3(10), 2166–2174 CrossRef CAS PubMed.
- L. Zhang, X. Huang, Y. Cao, Y. Xin and L. Ding, ACS Sens., 2017, 2, 1821–1830 CrossRef CAS PubMed.
- J. Fan and L. Ding, Analyst, 2018, 143, 3775–3788 RSC.
- J. O. Moon, J. W. Lee, M. G. Choi, S. Ahn and S. K. Chang, Tetrahedron Lett., 2012, 53, 6594–6597 CrossRef CAS.
- J. E. Park, M. G. Choi and S. K. Chang, Inorg. Chem., 2012, 51, 2880–2884 CrossRef CAS PubMed.
- Z. Lim, D. G. Smith, J. L. Kolanowski, R. L. Mattison, J. C. Knowles, S. Baek, W. Chrzanowski and E. J. New, J. R. Soc., Interface, 2018, 15 CrossRef CAS PubMed , 20180346.
- J. O. Moon, M. G. Choi, T. Sun, J. I. Choe and S. K. Chang, Dyes Pigm., 2013, 96, 170–175 CrossRef CAS.
- D. G. Smith, N. Sajid, S. Rehn, R. Chandramohan, I. J. Carney, M. A. Khan and E. J. New, Analyst, 2016, 141, 4608–4613 RSC.
- H. F. Kaiser, Educ. Psychol. Meas., 1974, 34, 111–117 CrossRef.
- H. G. Gorchev and G. Ozolins, WHO Chron., 2011, 38, 104–108 Search PubMed.
Footnotes |
| † Electronic supplementary information (ESI) available: Data tables, additional PCA and LDA plots, synthetic details. See DOI: 10.1039/c8an01747f |
| ‡ These authors contributed equally. |
| This journal is © The Royal Society of Chemistry 2019 |

