New potential model for atomic-scale peeling of armchair graphene: toward understanding of micrometer-scale peeling†
Ryoji
Okamoto
,
Koki
Yamasaki
and
Naruo
Sasaki
 *
*
Department of Engineering Science, Graduate School of Informatics and Engineering, The University of Electro-Communications, 1-5-1 Chofugaoka, Chofu, Tokyo 182-8585, Japan. E-mail: naruo.sasaki@uec.ac.jp
First published on 18th September 2018
Abstract
We developed a new potential model to simulate the adhesive characteristics of the peeling process of an armchair-type graphene sheet from a frictionless graphite substrate surface. First the transition of the shape of the graphene sheet and the vertical force curve during the peeling process obtained by this model successfully reproduced those obtained by our previous model. The computation time by this potential model is reduced to 1/6400 compared to that by our previous model. Next this potential model was extended to include the effective stiffness of atomic force microscopy (AFM) which consists of the stiffness of the cantilever, tip and contact region. A characteristic step structure of the vertical force curve is obtained by the extended model. Our approach opens new directions for multiscale physics of the peeling process of a π-conjugated sheet from atomic-scale to micrometer-scale, and interpretation of force-spectroscopy observed by AFM.
1. Introduction
As the size of objects becomes smaller, the effect of the surface to volume ratio becomes larger. For nano- or micro-meter scale objects, physical and chemical interaction forces appearing at the interface become much larger than the gravity proportional to the volume, which results in the marked increase of friction and adhesion. Therefore control of the atomic-scale friction and adhesion is required for effective control of the motion of nano- or micro-meter scale objects at the interface. In this paper the peeling process of a graphene sheet is discussed as one example of controling adhesion of nano-scale objects. Graphene is a promising material which has attracted the attention of many researchers due to its mechanical, electronical, magnetic, spintronical and optical properties.1–3We have so far performed numerical and experimental studies of the atomic-scale peeling and adhesion mechanics of a monolayer graphene sheet adsorbed onto a graphite surface. The peeling process of the graphene sheet was numerically studied based on the molecular relaxation technique using structural optimization.4–7 The peeling process of both a monolayer graphene sheet and a multilayer graphene plate with a thickness of several mm was also studied by using atomic-force microscopy (AFM) measurement.8 Based on the comparison between simulation and experiment, frictional and adhesive features during the surface contact were revealed.8 However, in the previous simulation the following problems are yet to be solved: (1) it is difficult to separate the pure effect of adhesion from that of friction during the peeling process. (2) Direct comparison of the simulated vertical force curve with the experimental force curve is difficult. (3) Computation time becomes larger as the graphene size increases. Therefore, in Section 2, in order to solve the above three problems, a new potential model to describe the adhesive characteristics during the peeling process of the graphene sheet was developed, and simulated results were compared with those obtained by our previous model. In Section 3, the present model is extended to simulate the vertical force curve of AFM.
2. Model
2.1 Development of a new potential model
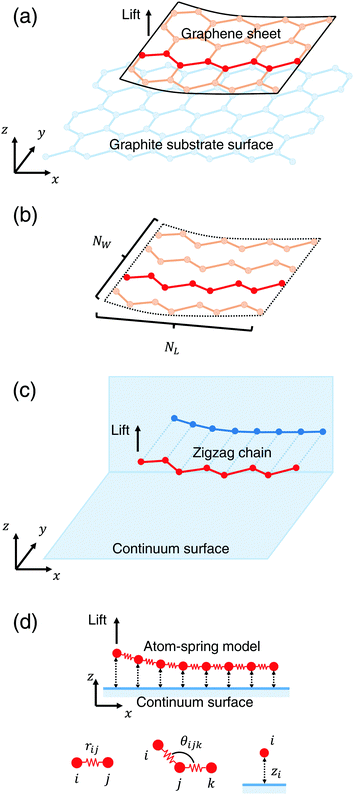
Fig. 1(a) shows a schematic illustration of the model composed of the armchair-type graphene sheet and the graphene substrate surface used in our previous simulation.4–7 First our previous model is briefly explained. As a model of the peeling sheet, a rectangular-shaped monolayer graphene sheet with each side of 3.8 nm × 2.1 nm composed of 310 carbon atoms with armchair edge is adopted. As a model of the substrate surface, a rigid rectangular monolayer graphene sheet with each side of 16.4 nm × 5.8 nm composed of 3536 carbon atoms is adopted. The total energy of this system is the summation of the covalent bonding energy described by the Tersoff potential function9 and the nonbonding energy described by the modified Lennard-Jones potential function.10,11Then this model shown in Fig. 1(a) is simplified using a structural symmetry of the armchair-type graphene sheet in order to reduce computation time. First, as illustrated in Fig. 1(b), the rectangular graphene sheet is modeled by a parallel spring comprising NW zigzag carbon chains, each of which consists of NL atoms. When each zigzag chain is projected onto the xz plane, it can be regarded as a serial spring as illustrated in Fig. 1(c). Here, in order to focus only on the adhesion characteristics and reduce the computation time, the substrate surface of the rigid graphene sheet is modeled by an infinite frictionless continuum sheet. Thus the problem is ascribed to the peeling process of a parallel spring comprising NW atom-spring chains, each of which consists of NL atoms as shown in Fig. 1(d). Here it is assumed that NW equivalent atom-spring chains are lifted simultaneously from the substrate surface just in phase during the peeling process.
The total energy Vtotal of the system comprising NW parallel atom-spring chains and a continuum surface is described by the sum of the following potential functions, vstrGr, vbendGr and vintGr–S as follows,
 | (1) |
Here the rectangular graphene sheet comprising 310 carbon atoms used in our previous simulation4–7 corresponds to parameters NW = 10 and NL = 31 (1 ≤ i ≤ NL).
First vstrGr represents the stretching energy between the nearest neighboring carbon atoms i and j of the graphene sheet within the xz plane. vstrGr is written as a function of the distance between i and j, rij (Fig. 1(d)), within the xz plane as follows,
 | (2) |
![[thin space (1/6-em)]](https://www.rsc.org/images/entities/char_2009.gif) 000 carbon atoms along the x direction and calculating the second derivatives of the total elastic energy based on the Tersoff potential.9
000 carbon atoms along the x direction and calculating the second derivatives of the total elastic energy based on the Tersoff potential.9
Next vbendGr represents the bending energy between the neighboring carbon atoms i, j and k of the graphene sheet within the xz plane. vbendGr is written as a function of the angle among i, j and k, θijk (Fig. 1(d)), within the xz plane as follows,
 | (3) |
Finally vintGr–S is an interaction energy acting between the graphene sheet and the infinite frictionless continuum sheet as mentioned above. Therefore vintGr–S is calculated by the integration of the Lennard-Jones (LJ) potential function, vLJ(ri) = 4ε[(σ/ri)12 − (σ/ri)6] over the continuum sheet. Here ri means the distance between the i-th carbon atom of the graphene sheet and the arbitrary position within the continuum sheet. Thus vintGr–S is obtained as
 | (4) |
2.2 Method of simulation
First the initial stable vertical height of the graphene sheet from the continuum substrate surface is zi = σ (Fig. 2(a)A). Similar to our previous simulation,4–7 atoms on the lifting edge of the graphene sheet (Fig. 1(d)) are assumed to be attached to the atomic-force microscopy tip apex. Then they are lifted by 0.01 nm along the z direction. For each lifting position Δz, displacement from the initial position of z, the total energy Vtotal (eqn (1)) is minimized using the conjugate gradient (CG) method.12 We set the convergence criterion so that the maximum of absolute value of all the forces Fi acting on the movable atoms becomes smaller than 1.6 × 10⁻⁵ nN. Since this procedure is simultaneously performed for NW = 10 parallel atom-spring chains in phase, the optimized stable shape of the graphene sheet and the vertical force Fz acting on the lifting edge during the peeling process are calculated.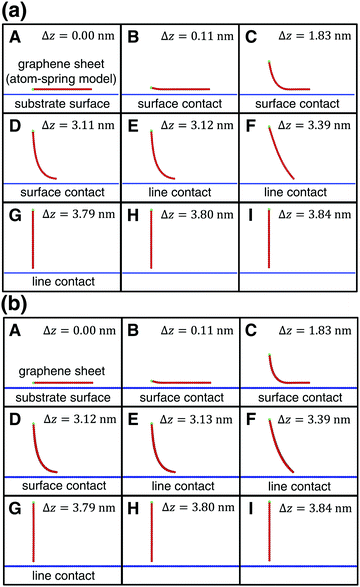 | ||
| Fig. 2 Transition of the shape of the armchair graphene sheet during the peeling process from A to I within the xz plane obtained by (a) the present model and (b) the previous model.4–7 Δz is a peeling distance from the initial position. (a) and (b) are in very good agreement with each other for each Δz. | ||
2.3 Calculated results
As the left edge of the graphene sheet is lifted, its shape changes within the xz plane as shown in Fig. 2(a)A–I. The vertical force acting on the lifting edge Fz is plotted as a function of the lifting height Δz as illustrated in Fig. 3(a). It is noted that the computation time is reduced to 1/6400 compared with that of the previous simulation,4–7 the reason for which will be explained in Section 2.4.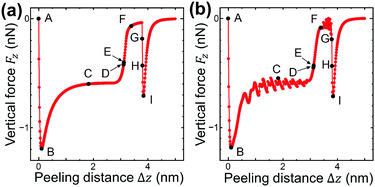 | ||
| Fig. 3 The vertical force FZ, acting on the lifting edge, plotted as a function of Δz during the peeling process obtained by (a) the present model and (b) the previous model.4–7 (a) and (b) are in very good agreement with each other except for atomic corrugation at surface- and line-contact regions. | ||
First the graphene sheet is located parallel to the substrate surface and it takes surface contact with the surface (Fig. 2(a)A) for Fz = 0 nN (Fig. 3(a)A). Just after it is lifted (Fig. 2(a)B), the vertical force takes the maximum attractive force |Fz| = 1.19 nN (Fig. 3(a)B). After that, as the peeling proceeds, the surface contact area gradually decreases (Fig. 2(a)B–D) and Fz increases (Fig. 3(a)B–D).
For the lifting position Δz = 3.12 nm, the surface contact breaks and the line contact appears (Fig. 2(a)E). Similar to our previous simulations, the line contact is defined as follows: (1) Repulsive interaction force acts on the atoms on the outermost right edge. (2) Attractive interaction force acts on the second atoms from the outermost right edge. These two conditions are satisfied at Δz = 3.11nm, but not at Δz = 3.12 nm, where the transition from the surface contact to the line contact occurs. For the line contact, as the peeling proceeds, the curved shape of the graphene sheet (Fig. 2(a)E and F) gradually turns into the line shape (Fig. 2(a)G). The attractive force |Fz| decreases to nearly zero (Fig. 3(a)E and F) and increases a little again (Fig. 3(a)G).
Then at Δz = 3.80 nm, the condition of the line contact is not satisfied any longer, and the line contact breaks (Fig. 2(a)H). As the graphene sheet is lifted further (Fig. 2(a)I), the attractive force |Fz| increases (Fig. 3(a)H and I) to take a maximum value (Fig. 3(a)I), and then it decreases to zero, which results in the complete peeling of the graphene sheet from the substrate surface.
The peeling process obtained by the present atom-spring potential model is compared with that obtained by our previous model using Tersoff potential and modified LJ potential.4–7 The transition of the shape of the graphene sheet obtained by the present atom-spring model (Fig. 2(a)A–I) completely reproduces that obtained by our previous model (Fig. 2(b)A–I). The lifting position of the transition from the surface- to the line-contact region E deviates quite a little by Δ|Δz| = 0.01 nm. Similarly, the vertical force curve obtained by the present model (Fig. 3(a)) is in good agreement with that obtained by our previous model (Fig. 3(b)) except for the atomic-scale corrugation appearing during the surface contact region (Fig. 3(b)B–D) and the line contact region (Fig. 3(b)E–G). This is due to the effect of modeling whether friction is included or not. Since our present model includes no effect of friction, the computation time is reduced to 1/6400 compared with that of our previous simulation. Thus it is clarified that our potential model is suitable for describing the adhesion characteristics of the peeling process with small computation time.
2.4 Reduction of computation time
The reason for the cost reduction of the present modeling can be explained as follows: First the computation time by the present simulation for a certain peeling height, T, is assumed to be written as the total iteration number of the conjugate gradient method 2NL multiplied by arithmetic operation time per iteration ΔT,| T ≈ 2NL × ΔT = 2NL × NL × (tstr + tbend + tint). | (5) |
| Told ≈ 3N × N × (Ncovtcov + NLJtLJ). | (6) |
 | (7) |
In addition, decrease of the number of arithmetic operations and that of I/O with the file can contribute to the reduction of the computation time. The bottleneck of the real computation time T ∝ NL2 is clearly a number of the mass point of the present model, NL, which can be decreased by a coarse-grained method adopted often for the case of the polymeric materials.
3. Extended model
3.1 Model including effective stiffness of AFM
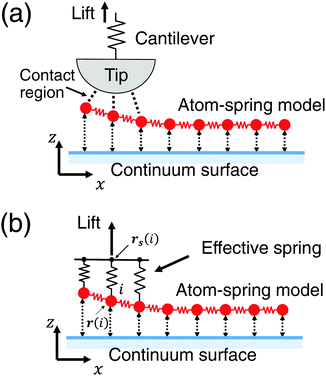
In this section the atom-spring model of the graphene sheet adsorbed onto the substrate surface developed in Section 2 is extended to be connected to the mechanical system of AFM. We consider the case that the AFM tip connected to the cantilever is attached to the graphene sheet as shown in Fig. 4(a). Here the size of the contact region between the AFM tip and the graphene sheet is described by the number of atoms, Neff. Then elasticity of the cantilever, tip and contact region is assumed to be described by the effective stiffness of AFM, keff. Thus Fig. 4(a) can be modeled by Fig. 4(b). As illustrated in Fig. 4(b), effective stiffness of AFM is modeled by a parallel spring composed of Neff equivalent springs connected to the i-th carbon atoms (1 ≤ i ≤ Neff) of the atom-spring model. Furthermore it should be noted that NW equivalent components, each of which is shown in Fig. 4(b), are aligned along the y direction. When the effective spring constant of the whole parallel spring is assumed as keff, each spring constant, k0eff, is defined as | (8) |
 | (9) |
Thus the total energy Vtotal of the extended system is obtained as
 | (10) |
3.2 Method of simulation
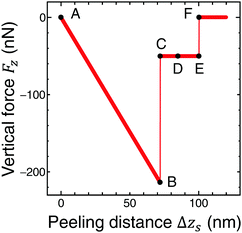
In the simulation, the initial distance between the graphene sheet and the substrate surface is set as the stable distance σ in eqn (4). Then the support position of the spring rs(i) is moved upward along the z direction by 0.1 nm. The total energy Vtotal is minimized by the CG method for each lifting distance Δzs from the initial position of zs. For the structural optimization, the convergence criterion is set so that the maximum of the absolute value of the force acting on all the relaxed atoms, Fi, becomes less than 1.6 × 10⁻⁵ nN. Thus the optimized shape of the graphene sheet and the vertical force acting on the supporting position Fz are obtained.Parameters used for the simulation are chosen as follows: First keff = 3 N m−1, the typical order of the magnitude of the cantilever spring constant of the contact AFM, is determined as the slope of the experimental Δz–FZ curve8 just before the maximum attractive force |FZ| appears during the peeling process. Then the graphene size, NL and NW, and the contact area, Neff, are chosen by reproducing the following quantities observed by AFM measurement:8 (1) the maximum attractive force |FZ|, (2) FZ just before the surface contact breaks, and (3) the distance between the maximum attractive position and pull off position. As a result, NL = 671, NW = 8.5 × 10² and Neff = 6, are determined. These parameters correspond to the submicrometer-size graphene sheet with a length of 85 nm and a width of 186 nm.
3.3 Calculated results
Fig. 5 shows the vertical force FZ plotted as a function of the peeling distance Δzs from the initial position of zs. As shown in Fig. 5, FZ discretely changes between B and C, and E and F. As the peeling proceeds from A to B, the slope of the Δz–FZ curve is nearly constant and the attractive peeling force |FZ| linearly increases. This indicates nearly all the region of the graphene sheet takes surface contact with the substrate surface, and only the effective spring stretches linearly (Fig. 6A and B). Between B and C, FZ discretely changes (Fig. 5B and C). Here the graphene sheet is discretely peeled from the surface and the surface contact area between the graphene sheet and the substrate surface discretely and rapidly decreases (Fig. 6B and C). After that FZ takes a nearly constant value (Fig. 5C–E) although the surface contact area between the graphene sheet and the substrate surface gradually decreases (Fig. 6C–E). This is because FZ is mainly due to the attractive force acting on the atoms of the boundary region between the peeled area and surface contact area of the graphene sheet. In addition, the shape of the boundary region does not change during the peeling process. Finally FZ discretely changes again between E and F (Fig. 5E and F) and the graphene sheet is completely peeled from the substrate surface (Fig. 6F). Thus the vertical force curve exhibits a characteristic step structure.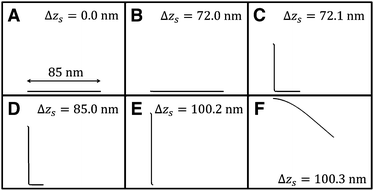 | ||
| Fig. 6 Transition of the shape of the armchair graphene sheet during the peeling process from A to F within the xz plane obtained by the extended model. | ||
4. Conclusions
In this work a new potential model to describe the adhesive characteristics of the peeling process of the armchair-type graphene sheet is developed. Using the symmetry of the armchair graphene, a rectangular sheet is modeled by a parallel spring comprising NW zigzag carbon chains and the problem is reduced to the mechanics of each atom-spring model comprising NL atoms. Furthermore, in order to focus on the effect of adhesion, the graphite substrate is modeled by a continuum surface. As a result, the present model successfully reproduces the previous simulation based on the Tersoff potential and modified Lennard-Jones potential function except for the effect of friction, and it is noted that the computation time is markedly reduced to 1/6400. Therefore simulation of the large-area graphene sheet becomes possible.The method we have proposed is universal and can be applied to the study of adhesion properties of any nanostructure on any substrate. Therefore the effective potential can be determined only if the total energy can be obtained as a function of the characteristic deformation variables, whichever classical-, tight binding- or quantum mechanical/chemical method you use. Thus, in our new method, any model and calculation method will do. Therefore the present method can be applied even to the case of a polymeric material with many atomic species.
In the present simulation a bare-edge graphene sheet is adopted. However, since chemical bonding of the graphene edge gives marked chemical interaction with the substrate, preliminary simulation has been performed for the hydrogen(H-) terminated graphene sheet using AIREBO potential. The vertical peeling force curve for the H-terminated graphene sheet is quite similar to Fig. 3(b) for the bare-edge graphene sheet. Furthermore, the maximum adhesion forces for the H-terminated and bare-edge graphene sheets are only by several percents different from each other. Thus the peeling process of the bare-edge graphene is qualitatively similar to that of the H-terminated graphene sheet particularly for the surface contact region. Such chemical bonding effect of the graphene edge is now being studied and will be systematically discussed in the near future.
Then this potential model is extended to include the effective stiffness of AFM comprising the stiffness of the cantilever, tip and contact region. The characteristic step structure of the vertical force curve is obtained by the extended model. In the previous experimental studies, it was reported that submicrometer-scale multiple step structures appear in the force curve for the 50 nm thick graphite flake.8 The interpretation of such submicrometer-scale force spectroscopy has been so far difficult. However the new potential model developed in this work is expected as a time-consuming simulator of the peeling process of such a submicrometer-scale multilayer graphene sheet. By using this extended model, direct comparison with atomic-force microscopy (AFM) measurement becomes possible. Thus our approach opens new directions for multiscale physics of the peeling process of the π-conjugated sheet from atomic-scale to micrometer-scale, and interpretation of force-spectroscopy observed by AFM.
Conflicts of interest
There are no conflicts to declare.Acknowledgements
This research was supported by Grant-in-Aid for Scientific Research on Innovative Areas (No. 26102016), Scientific Research (A) (No. 16H02076), and Scientific Research (B) (No. 17H02785) from the Japan Society for the Promotion of Science.References
- K. S. Novoselov, A. K. Geim, S. V. Morozov, D. Jiang, Y. Zhang, S. V. Dubonos, I. V. Grigorieva and A. A. Firsov, Science, 2004, 306, 666 CrossRef CAS PubMed.
- K. S. Novoselov, A. K. Geim, S. V. Morozov, D. Jiang, M. I. Katsnelson, I. V. Grigorieva, S. V. Dubonos and A. A. Firsov, Nature, 2005, 438, 197 CrossRef CAS PubMed.
- A. K. Geim and K. S. Novoselov, Nat. Mater., 2007, 6, 183 CrossRef CAS PubMed.
- N. Sasaki, H. Okamoto, N. Itamura and K. Miura, e-J. Surf. Sci. Nanotechnol., 2009, 7, 783 CrossRef.
- N. Sasaki, H. Okamoto, N. Itamura and K. Miura, e-J. Surf. Sci. Nanotechnol., 2010, 8, 105 CrossRef CAS.
- N. Sasaki, H. Okamoto, S. Masuda, K. Miura and N. Itamura, J. Nanomater., 2010, 742127 Search PubMed.
- N. Sasaki, T. Ando, S. Masuda, H. Okamoto, N. Itamura and K. Miura, e-J. Surf. Sci. Nanotechnol., 2016, 14, 204 CrossRef CAS.
- M. Ishikawa, M. Ichikawa, H. Okamoto, N. Itamura, N. Sasaki and K. Miura, Appl. Phys. Express, 2012, 5, 065102 CrossRef.
- J. Tersoff, Phys. Rev. Lett., 1998, 61, 2879 CrossRef PubMed.
- J. P. Lu, X.-P. Li and R. M. Martin, Phys. Rev. Lett., 1992, 68, 1551 CrossRef CAS PubMed.
- S. D. Stoddard and J. Ford, Phys. Rev., 1973, A8, 1504 Search PubMed.
- W. H. Press, S. A. Teukolsky, W. T. Vetterling and B. P. Flannery, Numerical Recipes, Cambridge Univ. Press, New York, 2nd edn, 1992, 413 Search PubMed.
Footnote |
| † Electronic supplementary information (ESI) available: Movies of a simulation of the peeling of a graphene sheet (Fig. 2(a) and 6). See DOI: 10.1039/c8qm00267c |
| This journal is © the Partner Organisations 2018 |

