 Open Access Article
Creative Commons Attribution 3.0 Unported Licence
Gravitational collapse of depletion-induced colloidal gels
R.
Harich†
a,
T. W.
Blythe
b,
M.
Hermes
a,
E.
Zaccarelli
c,
A. J.
Sederman
b,
L. F.
Gladden
b and
W. C. K.
Poon
*a
aSUPA and School of Physics & Astronomy, The University of Edinburgh, JCMB, Peter Guthrie Tait Road, Edinburgh EH9 3FD, UK. E-mail: w.poon@ed.ac.uk
bMagnetic Resonance Research Centre, Department of Chemical Engineering and Biotechnology, University of Cambridge, Pembroke Street, Cambridge CB2 3RA, UK
cCNR-ISC Uos Sapienza and Dipartimento di Fisica, Sapienza Università di Roma, P.le A. Moro 2, I-00185, Roma, Italy
First published on 11th March 2016
Abstract
We study the ageing and ultimate gravitational collapse of colloidal gels in which the interparticle attraction is induced by non-adsorbing polymers via the depletion effect. The gels are formed through arrested spinodal decomposition, whereby the dense phase arrests into an attractive glass. We map the experimental state diagram onto a theoretical one obtained from computer simulations and theoretical calculations. Discrepancies between the experimental and simulated gel regions in the state diagram can be explained by the particle size and density dependence of the boundary below which the gel is not strong enough to resist gravitational stress. Visual observations show that gravitational collapse of the gels falls into two distinct regimes as the colloid and polymer concentrations are varied, with gels at low colloid concentrations showing the onset of rapid collapse after a delay time. Magnetic resonance imaging (MRI) was used to provide quantitative, spatio-temporally resolved measurements of the solid volume fraction in these rapidly collapsing gels. We find that during the delay time, a dense region builds up at the top of the sample. The rapid collapse is initiated when the gel structure is no longer able to support this dense layer.
1 Introduction
Many industrial products contain colloids at intermediate volume fractions (say, ≈5–40%) in which the particles are denser than the liquid. A key requirement is that the particles must not sediment appreciably during a ‘shelf life’ of months to years, but, when required, the products must flow under moderate applied stresses. These seemingly contradictory requirements can be met by formulating the product as a colloidal gel: a space-spanning network of attractive particles with a yield stress high enough to bear the material's own weight, but low enough to be overcome in use to give flowability.This can be achieved using particles with short-range attraction. The equilibrium phase behaviour of such particles is simple, especially when they are too polydisperse to crystallise. As the attraction increases, a homogeneous fluid phase gives way, at a sharp boundary (the binodal), to coexisting gas (or vapour) and liquid phases. At low attraction strength the randomly-arranged particles in each phase are ergodic (they move throughout the phase volume). However, as the attraction strength is increased, the dense phase arrests, becomes glassy, and no longer reaches equilibrium on experimental time scales. Many studies1,2 suggest that there are (at least!) two classes of colloidal gels. The first is formed when the system phase separates through spinodal decomposition into this arrested glass phase at high volume fraction.3–8 The second class of systems form ‘equilibrium gels’ without phase separating.9–15 The mechanistic distinction between these two classes of gels is not yet completely understood, although the recent invention of a system that could be ‘tuned’ to show either kind of gelation2 represents an important step forward.
The colloid–polymer mixture studied in this work belongs to the first class, and only gels through spinodal decomposition. To understand gelation in this system, we therefore need to know the position of the binodal and spinodal. The binodal is a function of the inter-particle interaction, U(r) (where r is the centre-to-centre distance). According to the ‘extended law of corresponding states’ (ELCS), the binodals of all short-range attractive particles collapse into a universal curve in (ϕ, b2) space,16Fig. 1 (solid black), where ϕ is the colloid volume fraction, and b2, the reduced second virial coefficient for particles with diameter D, is defined as
 | (1) |
![[r with combining tilde]](https://www.rsc.org/images/entities/i_char_0072_0303.gif) = r/D.
= r/D.
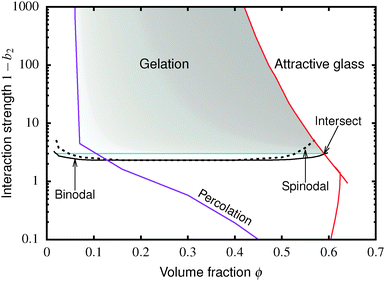 | ||
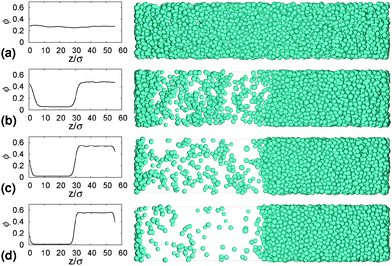
| Fig. 1 Simulated universal binodal (solid black) and spinodal (dashed black) of non-crystallizing particles, volume fraction ϕ, with short-range attraction quantified by the reduced second virial coefficient, b2. The glass transition lines calculated from mode coupling theory (MCT) mapped to simulations21,22 are shown in red. Percolation is observed in our simulations to the right of the purple line. A percolated system below the cyan line was observed to reach equilibrium, while a percolated system above this horizontal line was unable to equilibrate. Thus, spinodal gelation is predicted to occur in the shaded region, where the dense phase of a coarsening, percolating texture will arrest upon reaching the glass line. | ||
Inside this binodal there is a spinodal (dashed black, Fig. 1), inside of which the homogeneous state is unstable against infinitesimal concentration fluctuations, and phase separates via spinodal decomposition into a texture that spans space bicontinuously for compositions to the right of the percolation line (purple, Fig. 1). This texture coarsens with time. If the composition of the liquid phase in this coarsening bicontinuous texture reaches the attractive glass transition line17 (red, Fig. 1), the texture arrests into a gel. Thus, gelation is expected to occur above the ‘onset tie line’ (cyan, Fig. 1) where the binodal intersects the attractive glass boundary,1 and to the right of the percolation line inside the spinodal (purple, Fig. 1), i.e. inside the shaded region in Fig. 1.‡
The two classes of gels behave quite differently under gravitational stress.15,23 Since arrested spinodal gels are non-equilibrium states en route to phase separation, they can undergo sudden gravitational collapse after a certain ‘latency period’.4,7 Such sudden collapse limits shelf life in applications. A sedimented product is also unsightly, and leads to concentration gradients that can have catastrophic consequences (e.g. in drug formulations). Whether such collapse can be predicted is therefore of urgent interest.
We study the gravitational collapse of arrested spinodal gels in a model system in which the short-range attraction between hard-sphere-like colloids is induced by non-adsorbing polymers. Exclusion of polymers (radius of gyration rg) from the region between the surfaces of two nearby colloids, diameter D, leads to a net osmotic pressure pressing the particles together. The range and depth of this ‘depletion’ attraction can be separately ‘tuned’ by changing the molecular weight (and therefore rg) and the concentration of the polymer. Its range is ≈ξD, where ξ = 2rg/D. When ξ ≪ 1, the full depletion potential can be approximated by24
 | (2) |
α = (1 − ϕ)![[thin space (1/6-em)]](https://www.rsc.org/images/entities/char_2009.gif) exp(−Aγ − Bγ2 − Cγ3), exp(−Aγ − Bγ2 − Cγ3), | (3) |
Arrested spinodal gels in such colloid–polymer mixtures display gravitational collapse.4 Here, we show that three distinct collapse regimes exist depending on ϕ and ηp. Literature data25 from systems with the same ξ but different D show that these regimes are D-dependent. This contrasts strongly with equilibrium phase behaviour, which only depends on ξ.26 We infer that ageing in these gels may be partly gravity driven. Comparison with simulations shows that hydrodynamics drives sudden collapse, which magnetic resonance imaging (MRI) reveals is initiated by processes at the top of the gel.
2 Materials and methods
2.1 Colloids and polymers
We used poly-methylmethacrylate (PMMA) colloids (density ρp ≈ 1.15 g cm−3) sterically stabilized with poly-12-hydroxystearic acid ‘hairs’ with radius a = D/2 = 326 nm and 7.5% polydispersity, synthesised in-house and dispersed in cis-decalin (density ρs = 0.897 g cm−3, so that Δρ≈ρp − ρs = 0.253 g cm−3). These particles are too polydisperse to crystallize quickly, although we do sometimes observe iridescent Bragg colours in samples left undisturbed for a few weeks. The gravitational length of these particles in our solvent is lg ≈ 10 μm ≈ 15D. We used linear polystyrene with molecular weight Mw = 6.0 × 10⁵ g mol−1 (Mw/Mn = 1.05) and a gyration radius of rg ≈ 21 nm,27 giving ξ = rg/a = 0.064. The equilibrium phase behaviour, phase transition kinetics, and kinetic arrest in this and similar colloid–polymer mixtures have been studied in detail before.28 In particular, they form transient gels that collapse suddenly after a latency period.4,72.2 Visual observations
We determined the state of our samples and followed gravitational collapse in gels using digital imaging.7,23 Samples with various compositions were prepared and thoroughly homogenised on a roller mixer before transfer to 10 × 10 × 45 mm3 glass cuvettes for time-lapse observations at 20 °C. In samples separating into coexisting colloidal gas (upper) and liquid (lower) phases, e.g.Fig. 2, and in gravitationally collapsing gels, there are sharp, horizontal interfaces, which we detect digitally using a Sobel edge finding algorithm,§ and plot their height as a function of time normalised by the height of the bottom of the meniscus, h(t)/h0 (defined in Fig. 2). The experiments were performed in a temperature controlled cabinet in which the temperature was controlled to within 1 °C. We have verified that the results presented here do not depend on the accuracy of our temperature control by repeating experiments in a chamber in which the temperature was controlled to within 0.1 °C. The h(t) and the delay time measured in the better controlled chamber fall within the spread of the experiments in the cabinet. The temperature gradients over the samples were too small to measure and their effect was excluded by repeating experiments with samples placed inside cm thick metal blocks.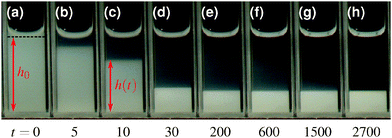 | ||
| Fig. 2 Images of a non-gelling, phase separating, sample. The time t is given in minutes after homogenisation. The time-dependent interface height h(t) and the meniscus height h0 are as defined. | ||
2.3 Simulations
We performed constant NVT event-driven Brownian dynamics (EDBD) and event driven molecular dynamics (EDMD) simulations of 4000 to 5 × 10⁴ attractive hard spheres in 3D. We used periodic boundary conditions in all three directions and did not include gravity. In our EDMD the temperature was thermostatted. Assuming ELCS, we used not the depletion potential, eqn (2), but attractive square wells, for which b2 is calculable analytically. To avoid crystallization, we used either a 50![[thin space (1/6-em)]](https://www.rsc.org/images/entities/char_2009.gif) :
:![[thin space (1/6-em)]](https://www.rsc.org/images/entities/char_2009.gif) 50 binary mixture with size ratio 0.8 or a system with quasi-continuous size distribution of 10% polydispersity; we cannot distinguish their binodals. Periodic boundary conditions in an elongated box allow accurate measurement of coexistence density profiles. Note that EDMD and EDBD do not include hydrodynamics.
50 binary mixture with size ratio 0.8 or a system with quasi-continuous size distribution of 10% polydispersity; we cannot distinguish their binodals. Periodic boundary conditions in an elongated box allow accurate measurement of coexistence density profiles. Note that EDMD and EDBD do not include hydrodynamics.
For a gel to form the system needs to form a percolating network of particles attached to each other, otherwise it will not have a yield stress and will not be able to support its own weight. The equilibrium percolation line has been obtained in computer simulations and theory29,30 and follows the binodal at high attraction strength. However, it can take a very long time for the system to form a percolating structure at low colloid volume fractions. If the colloids are severely affected by gravity in this time a gel might never form. Therefore we calculated a dynamic percolation line, which we have defined as the volume fraction ϕperc(1 − b2) at which the time it takes to form a percolating structure is longer than the time it takes for single particles to sediment significantly. To test for percolation we define particles to be connected if they are in each other's square well. To obtain the dynamic percolation line the simulation was started with an equilibrated HS configuration and a EDBD simulation (without gravity) was run until a percolating structure was formed or the time limit exceeded. As a time limit we have taken the time it takes for a single particle to sediment its radius in our experiments.
In an event-driven simulation the most time consuming step is finding the next event in the list of future events, which we optimised with a binary search tree.31 We simulated well widths from 0.01D and 0.1D, in which range ELCS is expected16 to remain at least approximately valid.
2.4 Magnetic resonance imaging (MRI)
MRI has previously been used quantitatively to measure the local volume fraction of non-colloidal suspensions.32 Here, we extend the use of MRI to quantify the liquid phase volume fraction of the collapsing colloidal gels as a function of height and time. MRI experiments were performed using a Bruker DMX300 spectrometer operating with a 7 T vertical-bore superconducting magnet fitted with a 25 mm inner diameter radio frequency (rf) coil tuned to a frequency of 300.1 MHz for the 1H resonance. A three-axis magnetic field gradient system was used for spatial encoding with a maximum gradient strength of 98.7 G cm−1. Homogenised samples were placed in round, flat-bottomed NMR tubes with outer diameter 10 mm and inner diameter 8.8 mm. A polytetrafluoroethylene insert was used to reduce the diameter of the rf coil to 10 mm and ensure optimal (and reproducible) positioning of the sample. The round NMR tubes show qualitatively the same h(t) behaviour as the square cuvettes used for the visual observations, although for weak gels the delay time seems to be systematically larger in the square cuvettes. The temperature of the sample environment was controlled to within 0.1 °C using gradient hardware cooling.In order to quantify the spin density (concentration) of the liquid phase, the effect of signal relaxation on the MRI experiments must be accounted for. In MRI experiments, the signal measured is proportional to the spin density of the liquid phase, I0, but the signal decays such that, at a time t after signal excitation, the measured signal, I, will be:
 | (4) |
3 Results
3.1 Equilibrium behaviour
 . In either case, the system will spontaneously phase separate because many modes of infinitesimal density fluctuation will grow. The resulting universal binodal and spinodal, Fig. 1, touch at the critical point at ϕ = 0.289, 1 − b2 = 2.174.38
We also estimated the density at which a system-spanning structure was first formed in the simulation box as the attractive well depth increases. The simulation was initialised with an equilibrated hard sphere configuration before a square-well attraction was switched on. We tested for percolation every few time units by identifying particles that were inside each other's attractive range. For low attraction strengths below the critical point, the percolated system was able to equilibrate. For high attraction strengths above the critical point, the percolation transition shifts to very low ϕ and the percolated system failed to reach equilibrium. Both portions of the percolation line so obtained are also shown in Fig. 1.
A sample with a sufficiently low polymer concentration, or equivalently a low enough 1 − b2 ( in Fig. 4), remains single-phase for an extended period of time. Over many hours, sedimentation begins to be observable, producing a diffuse interface (cf. upper phase, Fig. 2(e)).¶ As the polymer concentration (or equivalent 1 − b2) is increased, a point is reached where a sharp interface develops quickly and evolves as shown in Fig. 2 to a state of gas–liquid coexistence (
 in Fig. 4). Note that there clearly are particles in the upper, albeit very dilute, gas phases (cf. the cloudiness of the dilute phase in Fig. 2).
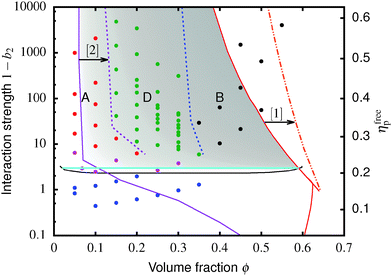 | ||
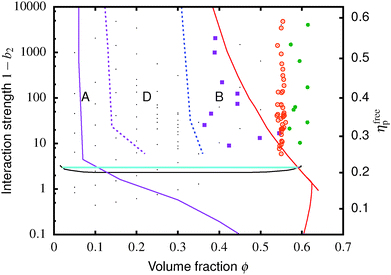
Fig. 4 The equilibrium phase diagram and gelation state diagram for (polydisperse, not crystallizing) colloids mixed with non-adsorbing polymer at a size ratio of 2rg/D = ξ = 0.07. The solid black line is the gas–liquid binodal from computer simulations.  = single phase, = single phase,  = gas–liquid coexistence, = gas–liquid coexistence,  = gels with collapse behaviour A, = gels with collapse behaviour A,  = gels with collapse behaviour D, ● = gels with collapse behaviour B. The purple, red and cyan boundaries have the same meanings as in Fig. 1. The predicted gel region without accounting for gravity is shaded. The real attractive glass line is likely to lie to the right of the boundary predicted by MCT mapped to simulations37 (arrow [1]); in finite gravity, the gelation line should lie to the right of the percolation boundary (arrow [2]). = gels with collapse behaviour D, ● = gels with collapse behaviour B. The purple, red and cyan boundaries have the same meanings as in Fig. 1. The predicted gel region without accounting for gravity is shaded. The real attractive glass line is likely to lie to the right of the boundary predicted by MCT mapped to simulations37 (arrow [1]); in finite gravity, the gelation line should lie to the right of the percolation boundary (arrow [2]). | ||
The simulated ‘universal binodal’ passes between points denoting single-phase and phase-separating samples, Fig. 4. Our experimental data are therefore consistent with equilibrium simulations up to ϕ ≈ 40% to within uncertainties.
3.2 Gel formation and collapse
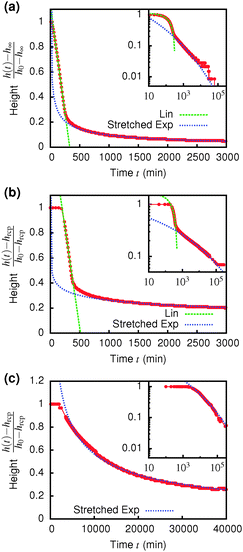
Immediately across the gas–liquid phase boundary, samples separate into coexisting gas and liquid phases ( , Fig. 4). This behaviour ceases rather abruptly across a line at 1 − b2 ≈ 5, above which samples show three kinds of gravitational collapse behaviour (A, D and B, Fig. 4), which we report in terms of a time-dependent dimensionless, rescaled height variable ĥ(t) = (h(t) − hrcp)/(h0 − hrcp), that decreases from 1 towards 0 during an experiment. Here, h0 = h(0) and hrcp is the height of a random close packed sediment (with ϕrcp ≈ 0.64). Typical ĥ(t) plots from these three regimes are shown in Fig. 5.
The low-ϕ regime (A) is characterised by a delay time of less than 3 minutes, Fig. 5(a), which was how long it took for a sample to be mounted and the disturbance from the homogenisation to damp out and air bubbles to escape. A linear dependence of h(t) (i.e. constant-speed gravitational collapse) is followed by a stretched exponential compaction until changes in sediment height could no longer be resolved. These samples are distinguishable from phase-separating samples by supernatants that are devoid of particles, though the distinction between a clear supernatant and a very dilute upper phase is not always easy to draw. However, the final sediment height (see later) clearly demarcates regime A from phase separation.
Samples in the intermediate-ϕ regime (D), Fig. 5(b), show a delay of ≳3 min, during which samples are gravitationally stable – these are gels. Then fast (linear) collapse occurs, followed by stretched exponential compaction, which, however, suddenly stops at a well-defined sediment height (and therefore ϕ), Fig. 5(a) inset.|| Samples in the high-ϕ regime (B) have long delay times – these are also gels. Sedimentation is stretched exponential without first showing linear collapse. The stretch exponent we find (β ≈ 0.12) is much smaller than the one found for smaller particles.25,40 For a full understanding of this a more detailed analysis of the poroelastic model would be required, but we can speculate that the larger gravitational stress of our larger particles might result in a more anisotropic structure containing more cracks or voids7,41 and thus a wider distribution of relaxation time scales and a more stretched sedimentation behaviour.
A striking difference between the regimes is the volume fraction of the last-observed sediment, ϕfinal, Fig. 6. Samples in regime A always stop at a ϕfinal below the attractive glass transition line, with samples closer to the boundary with regime B showing higher ϕfinal than more dilute ones. Samples in regime B all arrest fully at ϕfinal ≈ 0.55. At the point when we stopped observing, samples in regime C all reached ϕfinal > 0.55; however, there is no sign from ĥ(t), Fig. 5 inset, that the compaction is stopping at this point, Fig. 5(c). We suggest that these sediments are collapsing towards maximum compaction, i.e. ϕfinal(t → ∞) → ϕrcp ≳ 0.64.
4 Discussion
4.1 Understanding the limits of the gel region
Of the four types of sedimentation behaviour observed in our experiments, B and D show measurable delay times before gravitational collapse, Fig. 5(b) and (c). By this criterion, samples in these regions are (transient) gels. The experimental gel region in the (ϕ, b2) state plane, Fig. 4 (B and D), appears to be shifted relative to the predicted gel region (shaded).First, we expect to see gels above a line at 1 − b2 ≈ 3, which is where the calculated attractive glass line intersects the simulated binodal. We observe gelation at 1 − b2 ≳ 5. This shift is partly due to gravity: gels formed immediately across a putative gel line at 1 − b2 ≈ 3 will not be strong enough to support their own weight. We account for this shift in the next paragraph. Another possible source of discrepancy is linked to the apparent observation of samples showing gel-like collapse to the right of the attractive glass line (red, Fig. 4) calculated according to mode coupling theory (MCT) mapped to simulations.21,22 It is possible that the mapping could be improved,37 and that the true attractive glass line lies to the right of the one we have used (shift along arrow [1], in Fig. 4). This will have two effects. First, the onset tie line will move up from 1 − b2 ≈ 3. Secondly, most if not all of our regime B data points would fall to its left. However, the difference between regime B gels and attractive glasses is as yet wholly unclear, and needs further investigation before definitive statements could be made.
Next, in zero gravity, we expect to see gels immediately to the right of the percolation line inside the spinodal. The observed A–B boundary is at considerably higher ϕ (arrow [2], Fig. 4). This is likely a gravitational effect. In gravity, a gel needs a yield stress that is at least equal to the gravitational stress exerted by a single particle. The latter is
 | (5) |
 | (6) |
The unperturbed gel boundary, σy = 0, occurs at the tie line where the MCT glass line crosses the binodal, which for us is ηMCT = 0.215, and at the percolation boundary, which occurs for us at ϕgel ≈ 0.075. The effect of gravity can be predicted by solving σg = σy. This predicts gravity-shifted gelation at
 | (7) |
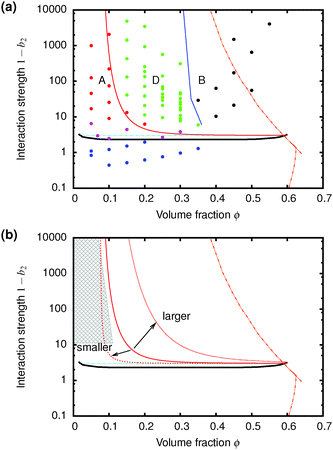 | ||
| Fig. 7 (a) The predicted gravitationally-shifted A–D boundary, eqn (7), overlaid onto our data. (b) The scaling of the transition between A and D with particle size. The grey area marks regime A from previous work25 on colloidal gels with smaller particles. | ||
Furthermore, eqn (7) predicts a strong particle size dependence. First, the gravitational stress scales as σg ∝ a, eqn (5), while we expect the yield stress to scale as σy ∝ a−3via the constant c on dimensional grounds, eqn (6), so that σg/c ∝ a−4 in eqn (7). Fig. 7(b) shows the predicted size dependence of the transition between the A and the D regime. This prediction is qualitatively consistent with the observations of Secchi et al.25 In their system of significantly smaller attractive hard spheres, the high-ϕ limit of their non-gelling regime A has shifted to the left, Fig. 7(b) (shaded), closer to the percolation line obtained from our gravity-free simulations. Quantitative comparison is, however, not possible, because we do not know the scale-setting constant c, eqn (6), for their system.
4.2 The origins of delayed rapid gravitational collapse
Gels in regimes D and B, Fig. 4, show a ‘delay time’, τd, before gravitational collapse. The latter is rapid in regime D, Fig. 5(b), and gradual in regime B, Fig. 5(c). The gradual collapse of colloidal gels can be modelled as poroelastic compression,43,44 predicting a stretched exponential law h(t),44 as we find, Fig. 5(b) (blue line).Delayed rapid collapse is less well understood. Optical imaging7 suggests that this is initiated from the top of the suspension. MRI confirms this by probing the space-resolved liquid fraction. This is then converted into height profiles of solid volume fraction, shown as colour maps for a typical sample in each regime, Fig. 8. In regime A, Fig. 8(a), the body of the sample remains homogeneous as a dense layer builds at the bottom. In contrast, as a gel in regime D detaches from the meniscus, a dense layer builds up on top. This shows up as a widening band of deepening purple coloration in Fig. 8(b).
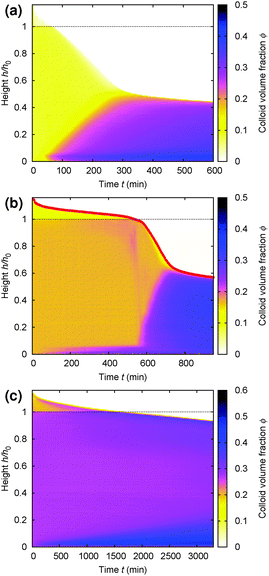 | ||
| Fig. 8 Time evolution of the height profile, ϕ(z), from MRI. In all cases, the dashed horizontal line marks the bottom of the meniscus (h0 in Fig. 2). (a) A typical sample showing type A gravitational collapse. (b) A typical sample showing regime D gravitational collapse. The time-dependent height profile of this sample, picked out in red, is reproduced in Fig. 9(a). (c) A sample just inside regime B. | ||
A more detailed analysis of this rather surprising phenomenon is shown in Fig. 9, where part (a) gives the time-dependent height profile of this sample, showing that fast sedimentation commences after ≈570 min. Zooming in to the rapid collapse region of the density profile colour map, Fig. 9(b), we see clearly the build up of denser material on top (purple colour), and the rapid sedimentation of this material through the sample (arrow) before the commencement of macroscopic rapid collapse. Notably, the speed of this collapse (slope of the arrow in part (b)), ≈8 μm s−1, is an order of magnitude higher than the speed of the rapid macroscopic collapse (slope of the linear fit, green, in part (a)), ≈0.6 μm s−1.
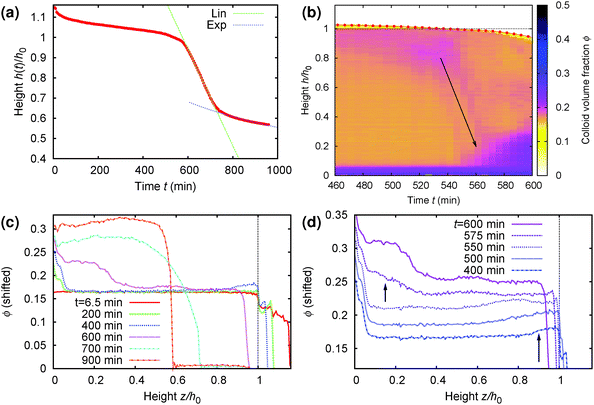 | ||
| Fig. 9 Details of the collapse behaviour of the regime D sample whose time-dependent density profile from MRI is shown in Fig. 8(b). It has an initial height of h0 = 14 mm and a delay time ≈570 min. (a) Normalised height, z = h/h0, as a function of time (picked out in red in Fig. 8(b)), showing clearly the onset of rapid collapse at t ≈ 570 min. (b) Zoom view of the MRI density profile colour map to the collapse region, from t = 460 min to 600 min. (c) The volume fraction profile, ϕ(z), plotted at times specified in the legend spanning the whole time range of interest. (d) The same as (c) but now focussing on the 3 h before to the 30 min after rapid collapse, with the curves shifted vertically for distinguishability. In (b)–(d), we see a layer of higher-ϕ ‘debris’ building up at the top, z ≳ 0.85 (long arrow in (d)), by t = 400 min. This dense ‘debris’ falls rapidly through the sample (arrow in (b)) just prior to the onset of rapid sedimentation of the whole sample at t = 570 min, giving rise to dense sediment at the bottom (short arrow in (d)). | ||
Previous optical imaging7 suggests that the dense material accumulating at the top consists of broken up and compacted gel ‘debris’. The stress exerted by a random close packed cluster of N particles is  , with ϕrcp ≈ 0.64 and Δρ ≈ 0.28 g cm−3. The yield stress of the gel in Fig. 8(b) was measured to be σy ≈ 20 mPa. Equating these two quantities, σy ≈ σN, gives an estimate of the radius of a compact cluster capable of yielding the gel by its weight:
 | (8) |
| r ≈ (9uη/2gΔρϕrcp)1/2 ≈ 14 μm, | (9) |
We do not yet know the origins of these dense clusters. However, we were unable to reproduce such clusters in our Brownian dynamics simulations, in which we never observed delayed rapid sedimentation. This suggests that hydrodynamics, left out in such simulations, is essential. It is possible that as a gel sediments slowly and tears itself away from the top interface (to which it is initially held by the depletion attraction45), hydrodynamic back flow from the compacting gel merges and consolidates the gel fragments thus created. Detailed investigations, however, must be left to future work.
The formation of a dense layer of colloids on top of a more dilute layer has been observed before,7,25 however, the sedimentation of this dense layer through the body of the gel is new. The density profiles containing three regimes observed by Secchi et al.25 are a direct consequence of this. In line with Secchi et al.,25 the density profile observed after 575 and 600 minutes can be divided in three distinct regions named foot, leg, column. The dense foot is formed by slow compaction of the gel during the delay time, the leg is formed by the more loosely packed clusters falling through the gel during the rapid collapse and the column is formed by the still standing gel.
Interestingly, a dense top layer also appears to form in regime B, Fig. 8(c) (blue band on top), although fast collapse does not happen. Perhaps the yield stress of the gel is now high enough to support these dense clusters. This is a reasonable hypothesis because we know that the yield stress of a gel increases sharply with the colloid volume fraction, eqn (6) with ν ≈ 3.5 to 6,42 so that the size of a cluster heavy enough to overcome this yield stress increases sharply with ϕ. However, quantitative testing of this hypothesis will not be possible until the origins and properties of these clusters are known.
The scale-setting constant c in the expression for the yield stress of colloidal gels, eqn (6), is expected to scale with particle size as c ∼ a−3. Secchi et al.25 worked with a = 90 nm particles, some 3.6 times smaller than ours. We therefore expect that their gels should have very considerably higher yield stresses (noting that 3.63 ≈ 48). The absence of a regime D in their system may therefore be due simply to the fact that dense debris forming on top could no longer break any of the gels. Only a detailed understanding of what determines the size of this debris will show whether this interpretation is correct.
4.3 The final sediment volume fraction
The average volume fraction of the final sediment ϕfinal was measured from the height of the sediment at the end of the experiment. Below the gel line ϕfinal approaches random close packing, above the gel line three sedimentation regimes, A, D and B, give different ϕfinal, Fig. 6. Most strikingly, in regime B, rapid gravitational collapse abruptly ceases at a well-defined ϕfinal ≈ 0.55, Fig. 5(b) (inset). The abrupt exit from a stretched-exponential compression to this ϕfinal suggests some fundamental underlying physics. Possibly, the shear stresses caused by the large-scale recirculating flow fields generated in fast sedimentation7 facilitate particle ordering46 inside sedimenting clusters, so that the final sediment is quasi-crystalline, though heavily defected due to multiple boundaries between small grains (≳10 μm). Interestingly, some sediments showed iridescence when observed for very long times. Our data suggest that crystallization is not possible when the gel simply compresses slowly in regime D, so that ϕrcp → 0.64. In regime A, gelation fails; the data is too scattered to be certain about the true steady-state ϕfinal, although it is possible that, for reasons not yet understood, these tend towards the attractive glass line.5 Summary and conclusions
We have delineated in detail the gel region in a model colloidal suspension: a dispersion in decalin of hard-sphere-like sterically stabilised PMMA particles in which an interparticle attraction is induced via the depletion effect caused by added non-adsorbing polystyrene polymers. Comparison of our data with simulations and simple theoretical calculations confirm that the gelation mechanism is arrested spinodal decomposition. Significantly, however, contrary to the case of equilibrium phase behaviour, there is no ‘law of corresponding states’ for gelation – the absolute particle size matters in determining the position of the low-ϕ gel boundary, the type of sedimentation behaviour, and the density of final sediment obtained. Thus, for example, small enough particles do not show delayed rapid collapse.Another significant finding is that dense debris accumulate on the top of gels as they sediment. If these are heavy enough, they can fall through the gel body and cause catastrophic failure and rapid gravitational collapse. Identifying the origins of such debris will constitute a next significant step towards obtaining a full understanding of these colloidal gels.
Acknowledgements
We thank Andy Schofield for synthesising PMMA particles, and Roberto Piazza and Stefano Buzzaccaro for helpful discussions. RH was funded by EU network COMPLOIDS. TWB held an EPSRC iCASE studentship with Johnson Matthey. MH and WCKP were funded by EPSRC Programme Grant EP/J007404/1 and by the International Fine Particles Research Institute (IFPRI). AJS and LFG were funded by EPSRC Programme Grant EP/J007404/1. EZ acknowledges support from MIUR-IT Futuro in Ricerca ANISOFT/RBFR125H0M.References
- E. Zaccarelli, J. Phys.: Condens. Matter, 2007, 19, 323101 CrossRef.
- M. E. Helgeson, Y. Gao, S. E. Moran, J. Lee, M. Godfrin, A. Tripathi, A. Bose and P. S. Doyle, Soft Matter, 2014, 10, 3122–3133 RSC.
- M. Carpineti and M. Giglio, Phys. Rev. Lett., 1992, 68, 3327–3330 CrossRef CAS PubMed.
- W. C. K. Poon, A. D. Pirie and P. N. Pusey, Faraday Discuss., 1995, 101, 65–76 RSC.
- N. A. M. Verhaegh, D. Asnaghi, H. N. W. Lekkerkerker, M. Giglio and L. Cipelletti, Physica A, 1997, 242, 104–118 CrossRef CAS.
- W. C. K. Poon, S. P. Meeker, L. Starrs, A. Moussaid, R. M. L. Evans, P. N. Pusey and M. M. Robins, Faraday Discuss., 1999, 112, 143–154 RSC.
- L. Starrs, W. C. K. Poon, D. J. Hibberd and M. M. Robins, J. Phys.: Condens. Matter, 2002, 14, 2485–2505 CrossRef CAS.
- P. J. Lu, E. Zaccarelli, P. Ciculla, A. B. Schofield, F. Sciortino and D. A. Weitz, Nature, 2008, 453, 499–503 CrossRef CAS PubMed.
- C. G. de Kruif and J. C. van Miltenburg, J. Chem. Phys., 1990, 93, 6865–6869 CrossRef CAS.
- M. C. Grant and W. B. Russel, Phys. Rev. E: Stat. Phys., Plasmas, Fluids, Relat. Interdiscip. Top., 1993, 47, 2606–2614 CrossRef CAS.
- H. Verduin and J. K. G. Dhont, J. Colloid Interface Sci., 1995, 172, 425–437 CrossRef CAS.
- I. Saika-Voivod, E. Zaccarelli, F. Sciortino, S. Buldyrev and P. Tartaglia, Phys. Rev. E: Stat., Nonlinear, Soft Matter Phys., 2004, 70, 041401 CrossRef CAS PubMed.
- A. P. R. Eberle, N. J. Wagner and R. Castaneda-Priego, Phys. Rev. Lett., 2011, 106, 105704 CrossRef PubMed.
- B. Ruzicka, E. Zaccarelli, L. Zulian, R. Angelini, M. Sztucki, A. Moussad, T. Narayanan and F. Sciortino, Nat. Mater., 2011, 10, 56–60 CrossRef CAS PubMed.
- J. M. Kim, J. Fang, A. P. R. Eberle, R. Castaneda-Priego and N. J. Wagner, Phys. Rev. Lett., 2013, 110, 208302 CrossRef PubMed.
- M. G. Noro and D. Frenkel, J. Chem. Phys., 2000, 113, 2941–2944 CrossRef CAS.
- K. N. Pham, A. M. Puertas, J. Bergenholtz, S. U. Egelhaaf, A. Moussaïd, P. N. Pusey, A. B. Schofield, M. E. Cates, M. Fuchs and W. C. K. Poon, Science, 2002, 296, 104–106 CrossRef CAS PubMed.
- S. Hayward, D. W. Heermann and K. Binder, J. Stat. Phys., 1987, 49, 1053–1081 CrossRef.
- G. Lironis, D. W. Heermann and K. Binder, J. Phys. A: Math. Gen., 1990, 23, L329–L334 CrossRef.
- M. D. Haw and W. C. K. Poon, Adv. Colloid Interface Sci., 1997, 73, 71–126 CrossRef.
- F. Sciortino, P. Tartaglia and E. Zaccarelli, Phys. Rev. Lett., 2003, 91, 268301 CrossRef PubMed.
- E. Zaccarelli and W. C. K. Poon, Proc. Natl. Acad. Sci. U. S. A., 2009, 106, 15203–15208 CrossRef CAS PubMed.
- R. Buscall, T. H. Choudhury, M. A. Faers, J. W. Goodwin, P. A. Luckham and S. J. Partridge, Soft Matter, 2009, 5, 1345–1349 RSC.
- J. Bergenholtz, W. C. K. Poon and M. Fuchs, Langmuir, 2003, 19, 4493–4503 CrossRef CAS.
- E. Secchi, S. Buzzaccaro and R. Piazza, Soft Matter, 2014, 10, 5296–5310 RSC.
- H. N. W. Lekkerkerker, W. C. K. Poon, P. N. Pusey, A. Stroobants and P. B. Warren, Europhys. Lett., 1992, 20, 559–564 CrossRef CAS.
- G. C. Berry, J. Chem. Phys., 1966, 44, 4550–4564 CrossRef CAS.
- W. C. K. Poon, J. Phys.: Condens. Matter, 2002, 14, R859–R880 CrossRef CAS.
- M. A. Miller and D. Frenkel, J. Chem. Phys., 2004, 121, 535 CrossRef CAS PubMed.
- R. Fantoni, D. Gazzillo and A. Giacometti, J. Chem. Phys., 2005, 122, 034901 CrossRef PubMed.
- D. Rapaport, J. Comput. Phys., 1980, 34, 184–201 CrossRef CAS.
- G. Ovarlez, F. Bertrand and S. Rodts, J. Rheol., 2006, 50, 259–292 CrossRef CAS.
- P. T. Callaghan, Principles of Nuclear Magnetic Resonance Microscopy, Clarendon Press, Oxford, 1993 Search PubMed.
- L. F. Gladden, Chem. Eng. Sci., 1994, 49, 3339–3408 CrossRef CAS.
- J. Mitchell, T. C. Chandrasekera and L. F. Gladden, Prog. Nucl. Magn. Reson. Spectrosc., 2012, 62, 34–50 CrossRef CAS PubMed.
- J. Mitchell, T. C. Chandrasekera, D. J. Holland, L. F. Gladden and E. J. Fordham, Phys. Rep., 2013, 526, 165–225 CrossRef CAS.
- P. Tartaglia, AIP Conf. Proc., 2008, 982, 295–303 CrossRef CAS.
- J. Largo, M. A. Miller and F. Sciortino, J. Chem. Phys., 2008, 128, 134513 CrossRef CAS PubMed.
- J. Perrin, Atoms, Ox Bow Press, Woodbridge, 1990 Search PubMed.
- G. Brambilla, S. Buzzaccaro, R. Piazza, L. Berthier and L. Cipelletti, Phys. Rev. Lett., 2011, 106, 118302 CrossRef CAS PubMed.
- N. A. Verhaegh, D. Asnaghi and H. N. Lekkerkerker, Phys. A, 1999, 264, 64–74 CrossRef CAS.
- V. Kobelev and K. S. Schweizer, J. Chem. Phys., 2005, 123, 164902 CrossRef PubMed.
- R. Buscall and L. R. White, J. Chem. Soc., Faraday Trans. 1, 1987, 83, 873–891 RSC.
- J. Y. Huh, M. L. Lynch and E. M. Furst, Ind. Eng. Chem. Res., 2011, 50, 78–84 CrossRef CAS.
- H. N. W. Lekkerkerker and R. Tuinier, Colloids and the Depletion Interaction, Springer, Dorcrecht, 2011 Search PubMed.
- M. D. Haw, W. C. K. Poon and P. N. Pusey, Phys. Rev. E, 1998, 57, 6859–6864 CrossRef CAS.
Footnotes |
| † Now at Laboratoire Ondes et Matière d'Aquitaine (LOMA), 351 Cours de la Libération, 33405 Talence Cedex, France. |
| ‡ Ising model simulations18,19 find a ‘kinetic percolation line’ inside the spinodal. To the right of this line, the system separates into a bicontinuous texture that is frozen for finite time before the spinodal decomposition continues. The relevance of this for colloidal gelation was pointed out some time ago.20 |
| § Note from Fig. 2 that after ≈100 min, the gas phase starts to sediment visibly; but this kind of diffuse interface is of no interest to us in this work. |
| ¶ Eventually, sedimentation equilibrium39 will be established. |
| || Note the logarithmic x-axis: ĥfinal is stable for ≳4 month. |
| This journal is © The Royal Society of Chemistry 2016 |

