Out-of-equilibrium forces between colloids
Indira
Sriram†
and
Eric M.
Furst
*
Department of Chemical Engineering and Center for Molecular and Engineering Thermodynamics, University of Delaware, Allan P. Colburn Laboratory, 150 Academy Street, Newark, Delaware 19716, USA. E-mail: furst@udel.edu; Tel: +1 302 8310102
First published on 14th February 2012
Abstract
Two colloidal probe particles are held with optical traps orthogonal to a uniformly flowing suspension of colloidal bath particles. Using confocal microscopy, the local bath suspension microstructure is characterized as a function of the probe separation and flow velocity. At sufficiently close separations, bath particles are excluded from passing between the probes, resulting in an asymmetric, non-equilibrium microstructure in which the major features are a depleted region between the probes and dense boundary layers along the surfaces that face away from the neighboring probe. As a consequence, the drag force acting on the probes is lower than that acting on a single probe and a net force pushes the probes together along their line of centers. The strength of the latter mutual force increases with increasing flow velocity. These experiments demonstrate that depletion-like forces can be induced between two particles by a non-equilibrium microstructure in a strongly driven suspension.
1 Introduction
The addition of non-adsorbing polymer or other small particles to a colloidal dispersion modifies the interparticle interactions by inducing an attractive interaction known as depletion. This behavior has been intensively studied because it offers a straightforward method to tune the interparticle potential in colloidal dispersions, leading to a rich variety of coexisting equilibrium phases and non-equilibrium states, such as attractive glasses and gels.1,2 The seminal model of the depletion potential was developed first by Asakura and Oosawa3 for flat plates and later by Vrij4 for hard spheres. They showed how a non-adsorbing polymer induces the attractive interaction: as a pair of particles approach, the area between them eventually excludes the polymer, and the resulting imbalance of osmotic pressure pushes the larger particles together. Depletion is a purely entropic phenomenon; from the viewpoint of the statistical mechanics of depletion, the smaller particles gain entropy when the volumes that exclude their center of mass around the larger particles overlap. Thus, depletion attraction scales with the thermal energy, kT. In the recent literature, direct measurements of depletion interactions,5–8 and their use to direct colloidal assembly both on surfaces9 and between particles with complex shape10 have been reported.The majority of the previous work on depletion constitutes the study of interactions at equilibrium. However, analogous and potentially strong osmotic stresses are expected to arise under out-of-equilibrium conditions. In the non-equilibrium case, such as when probe particles are driven externally by a force and attain a finite drift velocity, the suspension contribution to the osmotic stresses exerted on the probes are no longer isotropic or determined solely by the geometry of overlapping depletion volumes, but instead are dependent on the perturbed suspension microstructure.
The possible existence and nature of such out-of-equilibrium depletion forces have been treated by recent theory. Dzubiella and coworkers considered two particles in a uniform flow containing smaller Brownian particles.11 They found that the forces acting on the probe particles should be unequal and dependent on their configuration with respect to the flow. By considering the superposition of the microstructural deformation caused by a single probe particle, these forces were interpreted in terms of the expected non-equilibrium distribution of suspension particles. Likewise, Khair and Brady investigated, both analytically and using computer simulations, the forces experienced by probe particles as they translate through a bath suspension. Focusing on the case in which the probes translate along their line of centers, Khair and Brady employed an analytical model to calculate the suspension structure and forces.12 Similar to Dzubiella et al., they found that the two probes should experience net forces due to the non-equilibrium microstructure of the surrounding bath suspension.
The work presented here constitutes the results of experiments in which two probe particles are held in a uniform flow of almost identically sized “bath” particles. As illustrated in Fig. 1 the flow is perpendicular to the line of centers between the probes. An anistotropic, non-equilibrium structure develops around both probes. The presence of this microstructure correlates with force measurements that both impede the probe motion (drag forces) and push the probes together. The magnitude of the forces depends both on the separation and flow velocity. Before discussing these results in detail, we first describe the materials and experimental methods used in this study.
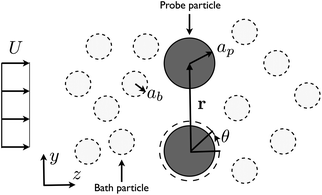 | ||
| Fig. 1 Experimental configuration. Two probes are held using a time shared optical trap. The probe particle and bath particle have radii of ap and ab, respectively. The velocity of the flow is indicated by U. The center-to-center distance between the probes is indicated by r. | ||
2 Methods and materials
2.1 Materials
Our experiments employ two particle types. The bath suspension consists of 2ab = 1.53 μm diameter poly(methyl methacrylate) (PMMA) particles that are fluorescently labeled with the fluorescent dye Nile Red (9-diethylamino-5-benzo [α]phenoxazinone, excitation wavelengths λex = 515–530 nm, emission wavelength λem = 525–605 nm). The probe particles are carboxylated 2ap = 3.0 μm diameter melamine, fluorescently labeled with fluorescein isothiocyanate (FITC, λex = 490 nm, λem = 525 nm, product number 88486, Fluka, Buchs, Switzerland). The bath and probe particles are dispersed in a mixture of 65.6% cyclohexyl bromide and 34.4% cis-decalin v/v, which has the same density and refractive index as the bath particles. The viscosity of the CHB solution is ηs = 2 cP. A small amount of the organic salt tetrabutylammonium chloride (TBAC, 86852, Fluka) at a final concentration of 0.84 mM is added to the mixture to help screen the electrostatic interactions between particles. We determine the effective bath particle diameter by analyzing the radial distribution function in a quiescent suspension.13 We then model this radial distribution function, employing a repulsive Yukawa potential in Monte Carlo simulations. From the Yukawa parameters, we estimate an effective bath radius, ab,eff = 1.04 μm, and a Debye screening length of 0.64 μm. Thus, while the solids volume fraction of bath particles used here is ϕ = 0.2, the effective bath volume fraction is approximately ϕeff = 0.5.We ensure the quality of the density matching by centrifuging each suspension sample continuously for approximately five minutes at approximately 6000 rpm, after which we check for sedimentation or creaming. Each sample is then introduced into a custom built glass chamber by capillary action. The sample chamber is sealed using a sugar based adhesive, composed of a mixture of dextrose, galactose, and water, followed by a second layer consisting of UV cure optical adhesive (NOA 81, Norland Products, Cranbury, NJ).14
2.2 Optical trapping and force measurements
Optical trapping in the PMMA–CHB/decalin suspension is described in detail in our earlier work.13,15 Briefly, a 4 W neodinium:yttrium–aluminum–garnet (ND:YAG) laser (vacuum wavelength λ = 1064 nm) is introduced into an inverted microscope (Zeiss, Axiovert 200). The beam is focused through a high numerical aperture immersion objective (NA = 1.3 Zeiss Aprochromat 63× oil). Preceding the microscope, a set of guide optics are used to collimate the beam, steer it and overfill the back aperture of the objective. Multiple optical traps are generated by time-sharing using a computer controlled acousto-optic deflector (AOD, AA.DTS.XY-400, AA Optoelectronics.)Two melamine probe particles are trapped and translated through the quiescent bath suspension at velocities ranging from approximately U = 7–50 μm s−1 by translating the motorized mircroscope stage. The direction of the translation (flow) is orthogonal to the line of centers between the probes. Since the probe particle diameter is similar to that of the surrounding bath particles, we non-dimensionalize the velocity using the Péclet number
 | (1) |
We determine the force on both probe particles by measuring the displacement of each probe from its equilibrium position in the optical trap as a function of speed and separation distance. The drag force, Fz = kotΔz, where Δz is the average displacement of the probe from the optical trap, and kot is the optical trap stiffness. The corresponding force in the direction along the centers of the particles, Fy, is calculated in an identical manner for both probe particles. In this work, the trap stiffnesses range from 3.3 × 10⁻⁶ to 2.0 × 10⁻⁵ N m−1 at laser powers betwen 30 and 180 mW, respectively. The confocal images are all obtained while trapping at the higher laser power, 180 mW, to facilitate cleaner imaging and more accurate image analysis.
2.3 Confocal microscopy
Confocal microscopy is used to image the bath suspension. The confocal imaging system consists of a Nipkow scanning disk confocal head (QLC-100, Yokogawa Electric) and 10-bit digital intensified charge coupled device (ccd) camera (XR/Mega 10, Stanford Photonics) mounted to the trapping microscope. Images are recorded at 30 frames per second, in bursts of 1000–3000 images, saved directly to the random access memory of an image acquisition computer, then transferred to a hard drive.From these images, we locate the positions of bath particles for approximately 5000 frames, using quantitative tracking methods.18 The resulting particle position data is used to calculate two dimensional plots of the time-averaged bath particle density distribution. The x and y positions of the individual bath particles are compiled into two dimensional histograms, with one by one pixel binning, across all frames in a given data set. The count values are then normalized by the total number of frames analyzed for each combination of flow velocity and separation conditions. During the experiments, all bath particles transit past the probes and do not accumulate or aggregate.
3 Results and discussion
3.1 Non-equilibrium microstructure
We first discuss the structure of the bath suspension surrounding the probe particles as their separation and velocity are changed. The results of 12 of the 36 experimental conditions tested include four probe particle separations (r/ab = 5.7, 7.3, 8.2 and 13) each at three velocities (7.3, 18, and 47 μm s−1), and are shown in Fig. 2. This subset captures the overall variations observed for the microstructure.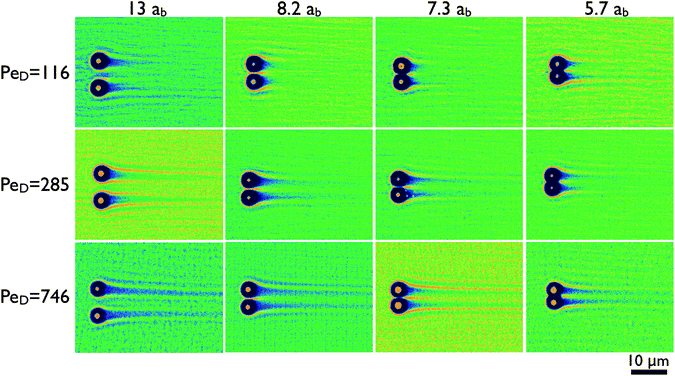 | ||
| Fig. 2 Microstructure of the bath suspension is organized into two dimensional representations of the time-averaged bath particle density for four probe particle separations and three velocities. The columns represent the probe separations given in terms of the bath particle hydrodynamic radius. The rows are the Péclet numbers defined by eqn (1). Dark colors indicate regions depleted of bath particles, while bright regions have an excess above the average bath suspension density. The bright dot at the center of each depleted region is the position of the probe particle. | ||
At large separations, several features are visible in the microstructure. As with recent single-probe experiments13,16 and theory,17,19,20 the microstructure is characterized by dense boundary layers of bath particles that collect on the upstream probe surfaces, and wakes depleted of bath particles that trail the probes. These microstructure features are expected due to the high Péclet number of the flow, defined in eqn (1), which range between 116 ≤ PeD ≤ 746. The formation of this microstructure represents a competition between the bath particle advection in the strong driving flow and the perturbed microstructure's recovery to a uniform equilibrium distribution by diffusion. Because PeD ≫ 1, convection of the bath particles dominates the transport in the vicinity of the probe except within a thin boundary layer region which scales as Pe−1D, leading to the formation of this dense band.17,20 The trailing wake is a result of the boundary layer separation.
At closer probe separations, bath particles are first constrained into a dense layer as they pass between the probes (cf. r/ab = 8.2), then the region between the probe particles is completely depleted of bath particles, as shown for r/ab ≤ 7.3. In addition, the population of bath particles in the boundary layer does not remain constant—a stagnation point is visible between the two probe particles, indicating that bath particles are initially retarded at this point, until they are able to advect around the two probe particles out of the imaging plane. A similar high density of bath particles is observed trailing the depleted region as bath particles return to the confocal imaging plane.
The physical parameters for Fig. 2, such as the probe center-to-center separation, r, and surface separation, h, are summarized in Table 1. The separation at which bath particles no longer pass between the two probes (r/ab = 7.3) is surprisingly large. In terms of the probe surface-to-surface distance h, this separation is on the order of twice the bath particle hydrodynamic diameter, h/2ab = 2.2. However, the ability of a bath particle to move between the probes is not solely a consequence of its solid diameter, but rather its effective collision diameter, which is larger due to electrostatic repulsion between the bath–bath and bath–probe particles. This aspect is discussed in detail below after we further consider the structure of the boundary layer region.
![[h with combining low line]](https://www.rsc.org/images/entities/i_char_0068_0332.gif) eff = h/2(ab,eff + ap,eff − ap), which takes into account the electrostatic repulsion between the bath and probe particles
eff = h/2(ab,eff + ap,eff − ap), which takes into account the electrostatic repulsion between the bath and probe particles
| r/ab | h/2ab | h/2ab,eff |
![[h with combining low line]](https://www.rsc.org/images/entities/i_char_0068_0332.gif) eff
eff
|
|---|---|---|---|
| 5.7 | 0.88 | 0.65 | 0.40 |
| 6.1 | 1.1 | 0.81 | 0.50 |
| 6.8 | 1.5 | 1.1 | 0.67 |
| 7.3 | 1.7 | 1.2 | 0.78 |
| 8.2 | 2.2 | 1.6 | 0.98 |
| 13 | 4.5 | 3.3 | 2.0 |
Next, we plot the bath particle radial distribution function at contact, g(rc,θ) in Fig. 3. The contact radius is obtained by locating the center of the boundary layer surrounding the probe particles for each individual data set. From the distribution plots, the average value of this radius is rc = 3.2 μm. The angle θ is zero at the point orthogonal to the centerline between the probes on the downstream face of each probe and increases in the direction of the neighboring probe; hence, θ = π/2 points toward the opposite probe, θ = π is the center of the upstream surface and θ = 3π/2 points away from the neighboring probe. The contact density plots are arranged in order of increasing probe separation. Individual panels show the variation in the structure as a function of the flow velocity.
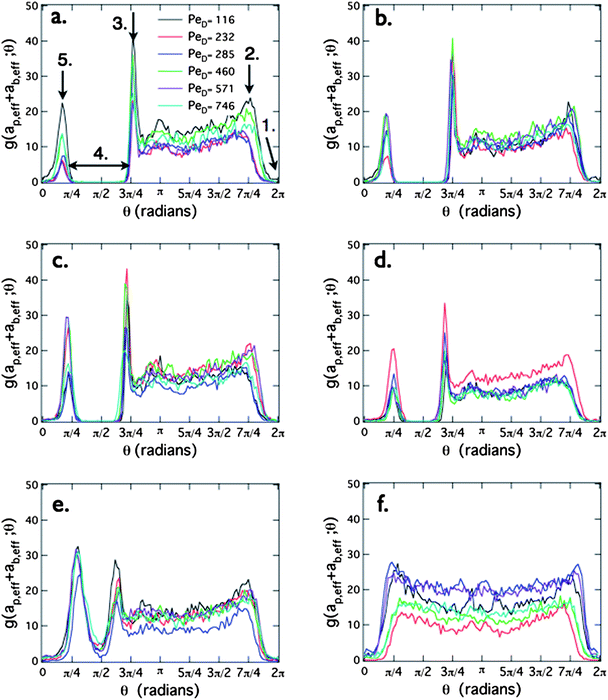 | ||
| Fig. 3 The bath density distribution at contact, g(rc,θ) around the probes is shown for separations r/ab = (a) 5.7, (b) 6.1, (c) 6.8, (d) 7.3, (e) 8.2, and (f)13. The Péclet numbers PeD = 116, 232, 285, 460, 571, and 746 are represented by black, red, blue, green, purple, and aqua symbols, respectively. Five arrows indicate interesting features in the distribution: (1) the wake trailing each probe particle; (2) the boundary layer separation on the face opposite of the neighboring probe; (3) a peak at the overlapping boundary layers between probes on the upstream face; (4) the depletion zone between the two probes; and (5) the overlapping boundary region on the downstream side. | ||
As discussed earlier for Fig. 2, the separation distance between the probes has a strong effect on the bath particle distribution at contact. We begin with the closest probe separation, r/ab = 5.7, shown in Fig. 3(a); several features are highlighted by arrows. At θ = 0 = 2π, (arrow 1) the value of g(rc,θ) is zero, corresponding to the bath particle-depleted wake behind the probe. Moving around the probe particle from θ = 2π to θ = 3π/2, a rapid increase in the bath particle density occurs as we enter the boundary layer at approximately θ = 7π/4 (arrow 2). The detachment of the boundary layer at this angle, and not θ = 3π/2, is indicative of hydrodynamic interactions between the bath and probe particles.20 From here around the probe, g(rc,θ) is roughly constant. The next feature is a large peak at approximately θ = 3π/4 (arrow 3). This is the point where the boundary layers of the probe particles overlap. Next is a second range of angles (arrow 4), corresponding to the depletion region between the two probe particles, followed by another peak (arrow 5). This second peak is interesting: it reflects the transport of bath particles back into the imaging plane after being diverted out-of-plane on the upstream face due to their inability to pass between the probe particles. The fact that it is lower than the upstream peak indicates that some bath particles detach prematurely. Thus, the overall microstructure includes not only the features visible in Fig. 2, but also a ring of high bath particle density around the circumference of the depleted region, an observation that has not been reported in the previous theoretical work, and one that may have important implications for the non-equilibrium depletion forces induced on the probes.
All of the features described above are observed if a depletion region exists between the probe particles; however, by Fig. 3(e) and Fig. 3(f), the angular density has a non-zero value in the interstitial region between the probe particles. In Fig. 3(e) (r/ab = 8.2), a dense peak is still visible, even though bath particles are clearly able to move between the probes. Finally, in Fig. 3(f), corresponding to r/ab = 13, the structure is similar to the single probe limit, and the density of the bath particles around the probes is nearly constant. A subtle and interesting difference in these structures from the single-probe experiments is their slight asymmetry, suggesting that the probe particles rotate in the +θ direction as they translate through the suspension.
Returning to the separation at which bath particles are first observed to flow between the probes, r/ab = 8.2, the boundary layer position enables us to estimate the effective probe radius ap,eff = rc − ab,eff = 2.2 μm. Dividing the surface separation by the sum of the effective bath diameter and thickness of the repulsive layer on the probes, ![[h with combining low line]](https://www.rsc.org/images/entities/i_char_0068_0332.gif) eff = h/2(ab,eff + ap,eff − ap), accounts for the unusually large separation, where
eff = h/2(ab,eff + ap,eff − ap), accounts for the unusually large separation, where ![[h with combining low line]](https://www.rsc.org/images/entities/i_char_0068_0332.gif) eff is now the effective non-dimensional probe separation. The values, summarized in Table 1, show that a probe separation r/ab = 8.2 is large enough to accommodate bath particles, and that the largest separation, r/ab = 13, can possibly allow the passage of two bath particles simultaneously.
eff is now the effective non-dimensional probe separation. The values, summarized in Table 1, show that a probe separation r/ab = 8.2 is large enough to accommodate bath particles, and that the largest separation, r/ab = 13, can possibly allow the passage of two bath particles simultaneously.
3.2 Forces acting on the probe particles
The previous section described the non-equilibrium bath microstructure surrounding two probe particles in a uniform flow. In this section, we present and discuss the forces acting on the probes.The separation and velocity of the probe particles strongly influences the bath suspension structure, and include the existence of depletion regions at sufficiently small probe separations. The highly asymmetric, non-equilibrium contact distribution of bath particles around each probe should lead to general osmotic stresses (pressures) that contribute to both the drag forces and the relative forces exerted along their line-of-centers. To understand this, consider that the bath particle contribution to the average force exerted between the bottom (b) and top (t) particles, 〈Fy〉 = (〈F〉t−〈F〉b)·r, is given by integrating the distribution of bath particles at contact around each probe,
| 〈F〉i = −nkT∮nigdSi, | (2) |
First, we consider the drag forces exerted on the probe particles, which are plotted in Fig. 4(a) as a function of probe particle separation and PeD. Two trends are readily observable in these data sets. For all of the data sets shown, the drag force increases with increasing PeD, as expected. Additionally, the drag forces on the upper and lower particles are equal. However, a second, more intriguing trend emerges when the effect of the probe separation distance on the drag force is considered. As the distance between the probes decreases, the drag force experienced by each probe particle correspondingly decreases.
 | ||
| Fig. 4 (a) Drag forces on probes in the z direction. Open and closed symbols correspond to the upper and lower particle, respectively. As indicated in the legend, black circles correspond to 5.7 ab, blue triangles correspond to 6.1 ab, red squares correspond to 6.8 ab, green inverted triangles correspond to 7.3 ab, purple left facing triangles correspond to 8.2 ab, and cyan diamonds correspond to 13 ab. (b) The scaled drag force Fz/6πapUηs on each probe particle as a function of PeD. Asterisks correspond to single particle experiments at a similar volume fraction, replotted from Sriram et al.13 | ||
We calculate the retarding force on each probe particle scaled by the Stokes drag calculated for a single probe in the solvent, Fz/6πapUηs. The resulting relative drag force is shown in Fig.4(b). At all separations, the drag force decreases relative to the solvent drag force with increasing PeD. This “microviscosity thinning” has been previously observed in the single probe limit,13 which is replotted for comparison. Of particular interest are the observations that (1) the scaled drag force is nearly a factor of two lower than the single probe limit at close separations (cf. for instance r/ab = 5.7 and 6.1), and (2) the single probe limit is recovered as the particle separation increases to r/ab = 13. The variation in the drag force is attributed to the number of bath particle collisions that the probe particles experience. At the smaller probe separations, the boundary layers overlap, effectively causing the probes to shield each other from collisions, thereby reducing the overall retarding force. Importantly, the drag forces confirm that the non-equilibrium distribution of bath particles around the probes leads to measurements consistent with the entropic forces expressed by eqn (2).
Next, we consider the force acting on the probes along their line of centers. In the absence of the bath suspension, no net force would be exerted along the line of centers for two translating spheres in a Newtonian fluid.21 However, in the case of two probes translating through a colloidal suspension, we find that they are pushed together as a function of separation and flow velocity. The relative force between the probe particles in the y direction, Fy, is shown in Fig. 5. Fy is ![[scr O, script letter O]](https://www.rsc.org/images/entities/char_e52e.gif) (0.1) pN, roughly one order of magnitude smaller than the drag forces. Notably, under the same conditions, both the Asakura–Oosawa model and the non-dilute depletion theory of Mao and co-workers, predict equilibrium depletion forces that are several orders of magnitude smaller than these non-equilibrium interactions.3,22
(0.1) pN, roughly one order of magnitude smaller than the drag forces. Notably, under the same conditions, both the Asakura–Oosawa model and the non-dilute depletion theory of Mao and co-workers, predict equilibrium depletion forces that are several orders of magnitude smaller than these non-equilibrium interactions.3,22
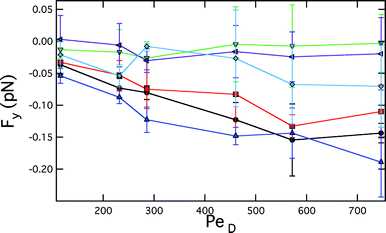 | ||
| Fig. 5 Interparticle forces on probes in the y direction. Black circles correspond to 5.7 ab, blue triangles corresponds to 6.1 ab, red squares correspond to 6.8 ab, green inverted triangles correspond to 7.3 ab, purple left facing triangles correspond to 8.2 ab, and cyan diamonds correspond to 13 ab. | ||
Examining the dependence on probe separation first, as the probe separation increase beyond r/ab ≥ 7.3, the effective attractive force diminishes beyond the detection limit. For separations r/ab = 5.7, 6.1 and 6.8, the force increases in magnitude with increasing PeD, consistent with an increase in the number of bath particles in the boundary layer as the flow velocity increases. Otherwise, there is no apparent dependence or onset of attraction for larger probe separations. Thus, the presence of the attractive force correlates with the non-equilibrium structure of the surrounding bath suspension, an in particular, the presence of a depletion region between the probes, as discussed above. One exception is interesting: the separation r/ab = 7.3. At this separation, a depleted region forms, yet there is no measurable net attraction. It is possible that the depletion region is too small to generate a force within the accuracy of our experiment; the range of angles with significant depletion is narrow, as shown in Fig. 3(e).
We end with a comparison of the depletion-like force calculated from the microstructure to the measured force as a function of probe separation. We first integrate the bath particle contact density (cf.eqn (2)) for the non-equilibrium microstructure plotted in Fig. 3, which gives 〈F〉i/nkT. Both the calculated interaction and the measured forces are shown for the strongest flow Pe = 746 in Fig. 6. As expected, 〈F〉i/nkT is attractive at close particle separations, reflecting the imbalance of bath particles around the probe. Moreover, as seen in the figure, the separation dependence of the measured attractive force closely follows the force calculated from the non-equilibrium microstructure.
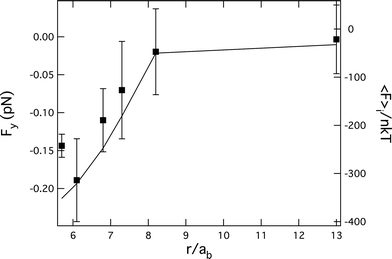 | ||
| Fig. 6 The force along the probe line of centers versus separation for Pe = 746 (symbols) is compared to the calculated force by integrating the non-equilibrium bath microstructure on the probe surfaces, 〈F〉i/nkT (line). | ||
4 Conclusions
Depletion interactions are ubiquitous in nature as well as technologically important soft materials, yet depletion interactions have normally only been modeled and measured for colloidal dispersions in equilibrium. The experiments presented in this work suggest that previous theoretical predictions that analogous forces arise in strongly driven, out-of-equilibrium suspensions, as occurs, for instance, when materials are processed and subjected to flow. In this case, the non-equilibrium microstructure of a colloidal suspension leads to a depletion-like force that acts to push two probe particles together in a strong flow at sufficiently close separations.There are several interesting aspects of our results that have not been accounted for in previous theory, including a detailed examination of the bath suspension microstructure in the vicinity of the depletion zone. The build up of bath particles along the circumference of the depletion region should mitigate somewhat the attractive force between the particles. Furthermore, the possibility that the probe particles rotate in the flow has not been accounted for previously. Nonetheless, the experiments and theory on out-of-equilibrium depletion to date demonstrate the surprising richness of this entropic force that has been of longstanding interest and utility in soft materials.
Acknowledgements
We thank J. F. Brady, A. Khair, R. Zia and J. Swan for helpful discussions and gratefully acknowledge the financial support from the National Science Foundation (award no. CBET-0730292).References
- A. P. Gast, C. K. Hall and W. B. Russel, J. Colloid Interface Sci., 1983, 96, 251–267 CrossRef CAS.
- W. C. K. Poon, A. D. Pirie and P. N. Pusey, Faraday Discuss., 1995, 101, 65–76 RSC.
- S. Asakura and F. Oosawa, J. Polym. Sci., 1958, 33, 183–192 CrossRef CAS.
- A. Vrij, Pure Appl. Chem., 1976, 48, 471–483 CrossRef CAS.
- D. L. Sober and J. Y. Walz, Langmuir, 1995, 11, 2352–2356 CrossRef CAS.
- J. C. Crocker, J. A. Matteo, A. D. Dinsmore and A. G. Yodh, Phys. Rev. Lett., 1999, 82, 4352–4355 CrossRef CAS.
- S. Biggs, R. R. Dagastine and D. C. Prieve, J. Phys. Chem. B, 2002, 106, 11557–11564 CrossRef CAS.
- L. Helden, R. Roth, G. H. Koenderink, P. Leiderer and C. Bechinger, Phys. Rev. Lett., 2003, 90, 048301 CrossRef CAS.
- K. H. Lin, J. C. Crocker, V. Prasad, A. Schofield, D. A. Weitz, T. Lubensky and A. Yodh, Phys. Rev. Lett., 2000, 85, 1770–1773 CrossRef CAS.
- S. Badaire, C. Cottin-Bizonne, J. W. Woody, A. Yang and A. D. Stroock, J. Am. Chem. Soc., 2007, 129, 40–41 CrossRef CAS.
- J. Dzubiella, H. Löwen and C. Likos, Phys. Rev. Lett., 2003, 91, 248301 CrossRef CAS.
- A. S. Khair and J. Brady, Proc. R. Soc. A, 2007, 223–240 CrossRef.
- I. Sriram, A. Meyer and E. M. Furst, Phys. Fluids, 2010, 22, 062003 CrossRef.
- L. L. Cai and S. Granick, Adv. Colloid Interface Sci., 2001, 94, 135–150 CrossRef CAS.
- I. Sriram, R. J. DePuit, T. M. Squires and E. M. Furst, J. Rheol., 2009, 53, 357–381 CrossRef CAS.
- A. Meyer, A. Marshall, B. G. Bush and E. M. Furst, J. Rheol., 2005, 50, 77–92 CrossRef.
- T. M. Squires and J. F. Brady, Phys. Fluids, 2005, 17, 073101 CrossRef.
- J. C. Crocker and D. G. Grier, J. Colloid Interface Sci., 1996, 179, 298–310 CrossRef CAS.
- I. C. Carpen and J. F. Brady, J. Rheol., 2005, 49, 1483–1502 CrossRef CAS.
- A. S. Khair and J. F. Brady, J. Fluid Mech., 2006, 557, 73–117 CrossRef.
- W. B. Russel, D. A. Saville and W. R. Schowalter, Colloidal Dispersions, Cambridge University Press, Cambridge, 1989 Search PubMed.
- Y. Mao, M. Cates and H. Lekkerkerker, Phys. A, 1995, 222, 10–24 CrossRef CAS.
Footnote |
| † Current address: Department of Chemical and Biomolecular Engineering, University of Colorado, Boulder, Colorado |
| This journal is © The Royal Society of Chemistry 2012 |
