Antiferromagnetism and insulator-metal transition of alkali metal-loaded sodalite†
Takehito
Nakano
 *a,
Kunihiro
Watanabe
b,
Atsufumi
Hanazawa
b,
Yuko
Ishida
b,
Kenji
Tanibe
b and
Ryosuke
Sakon
b
aInstitute of Quantum Beam Science, Graduate School of Science and Engineering, Ibaraki University, Mito, Ibaraki 310-8512, Japan. E-mail: takehito.nakano.phys@vc.ibaraki.ac.jp; Fax: +81 29 228 8357; Tel: +81 29 228 8357
bDepartment of Physics, Graduate School of Science, Osaka University, Toyonaka, Osaka 560-0043, Japan
First published on 11th April 2024
Abstract
Alkali metal clusters with a single unpaired s-electron can be arranged three-dimensionally in a sodalite crystal by loading the guest alkali atoms. Na, K, and K–Rb alloy clusters are known to be Mott insulators and to exhibit antiferromagnetic ordering. The Néel temperature increases from about 50 K to about 100 K in this order. In this study, Li–Na alloy, Na–K alloy, and pure Rb samples were newly prepared and their magnetic, electrical conductivity, and optical properties were investigated, including those of previous samples. The Na–K alloy samples showed antiferromagnetic properties, which were intermediate between those of the Na and K samples. However, the Rb sample showed a non-magnetic metallic state. The shallower ionization potential in Rb is thought to cause an insulator-metal transition (Mott transition) due to weaker on-site Coulomb repulsion between electrons and larger electron transfer energy between neighboring clusters. On the other hand, the Li–Na alloy sample showed a non-magnetic insulating state. It is thought that the two electrons form a spin-singlet pair due to the strong electron-lattice interaction. In terms of electron correlations and polaron effects, the full picture of the element species dependence of the alkali metal-loaded sodalite is reviewed.
1. Introduction
In host–guest materials, when the guest is an alkali metal, it acts as an electron donor, and the new electronic states can give rise to interesting physical and chemical phenomena. One of the most famous examples is the graphite intercalation compounds, in which alkali atoms are inserted between two-dimensional layers and electrons are supplied to the layers. Superconductivity can occur at low temperatures and has been the subject of much research.1 Another example as a typical three-dimensional system is the alkali metal-doped fullerene. Electrons are supplied to the three-dimensional band consisting of the LUMO (lowest unoccupied molecular orbital) of C60, which becomes conductive, leading to superconductivity, insulator-metal transition, and so on.2 There is also a huge amount of research.Zeolites, which are porous crystals, can also host alkali metals. They are good for one-dimensional and three-dimensional systems. Unlike fullerenes, this system does not use the unoccupied electronic state of the host crystal as it is. Basically the host crystal is just a container, and the guest alkali metals form new electronic states in the periodic nanospace. Depending on the combination of the host crystal structure and the guest alkali metal species, magnetic ordering can occur in the absence of magnetic elements, or an insulator metal transition can occur.3 This paper describes a detailed study of the alkali metal species dependence of the physical properties of the sodalite system, which has the simplest crystal structure in the zeolite family.
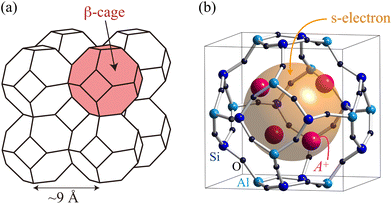
Sodalite is a type of aluminosilicate zeolite with the framework structure type of SOD.‡ The framework is formed by a covalent bond network of Si, Al and O atoms. The β-cages with an inner diameter of 7 Å are arranged in a body centered cubic (bcc) structure as shown in Fig. 1(a). The β-cage has eight nearest neighbors connected by the 6-membered rings (6Rs) and six next-nearest neighbors connected by the 4-membered rings (4Rs). In as-synthesized sodalite, four Na+ ions and one monovalent anion X−, such as Cl− or OH−, are accommodated in each β-cage. The chemical formula is given by (Na4XAl3Si3O12)2 per bcc unit cell containing two β-cages. After removing the NaX salt, a Na43+ paramagnetic cluster can be created by loading a guest Na atom.4 In this cluster, an unpaired s-electron provided by the guest Na atom is shared by four Na+ ions and is confined in the β-cage, as schematically shown in Fig. 1(b). The alkali cations are positioned near a 6R on the threefold axis, and the cluster exhibits Td symmetry. The equivalent sharing of the s-electron among the four Na+ ions is confirmed by the hyperfine structure in the electron spin resonance (ESR) spectrum.4 The charge state of the Na atoms in this cluster is unique: a simple calculation yields Na0.75+, i.e. each atom has an electronic charge of −0.25e. However, this is not correct. From the magnitude of the hyperfine splitting of ESR, the ratio of how much of the atomic s-orbital is occupied by electrons, the so-called “atomic character”, can be determined.5 Based on the ESR data,4 the atomic character is estimated to be only about 50% when we sum the contribution from the four ions. This implies that the wave function of the cluster has a large amplitude in the space of the cage center. Similar situations have also been found in Na43+ and K43+ clusters formed in zeolite Y.5 First-principles calculations of the sodalite system also support such an electronic state.6–10 In addition, the calculations show that there is only a small amplitude on the oxygen atoms. Therefore, in contrast to fullerenes, there is little charge transfer to the host framework.
When the Na43+ clusters were created in all cages, antiferromagnetic order was found to occur at about 50 K.11 The sample is an insulator, and the electron localized in the cluster has an exchange interaction with electrons in neighboring clusters mainly via the 6Rs. The antiferromagnetic transition temperature (Néel temperature, TN) was found to increase systematically when K clusters12 and K–Rb alloy clusters13,14 were prepared by changing the cations and guest atoms. The antiferromagnetic orders were confirmed using various microscopic probes.13,15–21 The situation where one electron is accommodated in each cage corresponds to an s-like energy band that is just half filled. It is an insulator because the on-site Coulomb repulsion energy U between two electrons is much larger than the electron transfer energy t between the sites. There are several theoretical studies that support that such a Mott-Hubbard scenario is valid for this system.6–10 It is interesting that such a strongly correlated electron system can be realized in alkali metals.
The purpose of this study is as follows: although Na, K, and K–Rb alloy clusters in sodalite have been studied previously, we will further extend the range of alkali element dependence to both sides and prepare pure Rb and Li–Na clusters, which have not been made before, and clarify their physical properties. The electrical conduction properties of all samples have never been investigated and will be newly elucidated experimentally. From these experimental results, the full picture of the alkali element species dependence of the sodalite system will be elucidated. The importance of electron correlations and polaron effects will also be discussed.
2. Experimental procedure
We used a powder specimen of sodalite with the crystal size of 2–3 μm. Synthesis and chemical analysis were performed by Tosoh Corporation, and the molar ratio of silicon to aluminum was found to be Si/Al = 1.0. We prepared a salt-free sodalite with a chemical formula of Na3Al3Si3O12 per β-cage by means of the Soxhlet extraction with distilled hot water. This is abbreviated as Na3-SOD in this paper. A K-type sodalite with the chemical formula of K3Al3Si3O12 (abbreviated as K3-SOD) was prepared by ion exchange of Na3-SOD in an aqueous solution of KNO3 at room temperature. We obtained K1.5Rb1.5Al3Si3O12 (K1.5Rb1.5-SOD) partially exchanged to Rb+ ions by soaking K3-SOD in RbNO3 aqueous solution at room temperature. We also obtained Rb3Al3Si3O12 (Rb3-SOD) completely exchanged to Rb+ ions by soaking K3-SOD in RbNO3 aqueous solution at 80 °C. In addition, we obtained Li2.3Na0.7Al3Si3O12 (Li2.3Na0.7-SOD) partially exchanged to Li+ ions by soaking Na3-SOD in a LiNO3 aqueous solution at room temperature. The chemical compositions of these sodalites were analyzed by using inductively coupled plasma optical emission spectrometry (ICP-OES) for alkali elements and aluminum. Table 1 lists the data of ICP-OES.| Name | Li (wt%) | Na (wt%) | K (wt%) | Rb (wt%) | Al (wt%) | Composition |
|---|---|---|---|---|---|---|
| Li2.3Na0.7-SOD | 3.47 | 3.59 | — | — | 17.9 | Li0.70Na2.26Al3Si3O12 |
| Na3-SOD | — | 13.5 | — | — | 16.1 | Na2.95Al3Si3O12 |
| K3-SOD | — | <0.05 | 21.8 | — | 15.7 | Na<0.01K2.87Al3Si3O12 |
| K1.5Rb1.5-SOD | — | <0.05 | 9.26 | 21.2 | 13.0 | Na<0.01K1.47Rb1.54Al3Si3O12 |
| Rb3-SOD | — | <0.05 | 0.1 | 33.4 | 11.7 | Na<0.01K0.02Rb2.70Al3Si3O12 |
These sodalites were dehydrated by heating at 400–500 °C in a vacuum for 24 hours. Weighted amounts of sodalites and distilled pure alkali metals were sealed in quartz glass tubes. The alkali metals were adsorbed into sodalites at 100–150 °C via the vapor phase. The molar ratio of the host sodalite β-cage to the guest alkali metal was 1![[thin space (1/6-em)]](https://www.rsc.org/images/entities/char_2009.gif) :
:![[thin space (1/6-em)]](https://www.rsc.org/images/entities/char_2009.gif) 1. Thus, each β-cage was loaded with an alkali atom. The samples were heated at 100–150 °C with stirring for about 4 weeks to achieve good homogeneity. Table 2 summarizes the combinations of host sodalite and guest alkali atom in this study.§ The average chemical composition of the clusters A43+ formed in the β-cage is also listed in Table 2. In an ideal case, for example in the (K1.5Rb2.5)3+ sample, (KRb3)3+ and (K2Rb2)3+ clusters are expected to be randomly distributed.
1. Thus, each β-cage was loaded with an alkali atom. The samples were heated at 100–150 °C with stirring for about 4 weeks to achieve good homogeneity. Table 2 summarizes the combinations of host sodalite and guest alkali atom in this study.§ The average chemical composition of the clusters A43+ formed in the β-cage is also listed in Table 2. In an ideal case, for example in the (K1.5Rb2.5)3+ sample, (KRb3)3+ and (K2Rb2)3+ clusters are expected to be randomly distributed.
| Host sodalite | Guest alkali atom | Average composition of cluster | T N (K) | T W (K) | J 1/kB (K) | J 2/kB (K) |
|---|---|---|---|---|---|---|
| Li2.3Na0.7-SOD | Na | (Li2.3Na1.7)3+ | — | −2.9 ± 0.3 | — | — |
| Na3-SOD | Na | Na43+ | 54 | −166 ± 5 | −27 ± 1 | −19 ± 1 |
| Na3-SOD | K | (Na3K)3+ | 60 | −253 ± 8 | −39 ± 1 | −32 ± 2 |
| K3-SOD | Na | (NaK3)3+ | 74 | −344 ± 22 | −52 ± 3 | −45 ± 4 |
| K3-SOD | K | K43+ | 80 | −348 ± 23 | −53 ± 4 | −45 ± 4 |
| K3-SOD | Rb | (K3Rb)3+ | 95 | −399 ± 38 | −62 ± 5 | −51 ± 6 |
| K1.5Rb1.5-SOD | Rb | (K1.5Rb2.5)3+ | 100 | −540 ± 53 | −80 ± 7 | −74 ± 8 |
| Rb3-SOD | Rb | Rb43+ | — | −5.7 ± 0.2 | — | — |
For magnetic and optical measurements, the samples were sealed in quartz glass tubes with helium gas. The magnetic susceptibility was measured by using a SQUID (superconducting quantum interference device) magnetometer (MPMS-XL, Quantum Design). To eliminate the signal from ferromagnetic impurities, which are present in very small amounts in the matrix,22 the magnetic susceptibility was determined as follows. The temperature dependence of the magnetization was measured in external magnetic fields of 30 kOe and 50 kOe. They were defined as M30 kOe and M50 kOe, respectively, and the magnetic susceptibility was calculated using the following equation:
 | (1) |
The diamagnetic signal χdia from the bottom of the quartz glass tube is included in the measured value. Usually, diamagnetism does not vary with temperature, and it was difficult to estimate this value accurately in this study. Therefore, the component of magnetic susceptibility that varies with temperature is discussed.
Optical diffuse reflectivity r was measured at room temperature using an FTIR spectrometer (iS50, Nicolet) and a NearIR-VIS-UV spectrometer (Cary 5G, Varian). KBr powder sealed in a quartz glass tube was used as the standard. The absorption spectra were obtained by the Kubelka-Munk function (1 − r)2/2r. The normal reflectance R spectra were obtained by the transformation R = 4r/(1 + r)2.23 For electrical resistivity measurements, powder samples were compressed between two gold electrodes and sealed in a handmade airtight cell with a helium gas. The cell was placed in a PPMS (Quantum Design) sample chamber and the temperature was controlled between 10 and 300 K. Impedance of the cell with the sample were measured using the 4-terminal method with an LCR meter (E4980A, Agilent) in the frequency range from 20 Hz to 2 MHz and DC. The resistivity value was obtained by multiplying the dimensional factor (area/thickness) of the compressed powder. The reliability of the DC resistivity ρ was confirmed by analyzing the frequency dependence of the complex impedance using Cole–Cole plots. Due to the constriction resistance at the powder particles, the observed value is approximately one to two orders of magnitude higher than the true value. The order of 109 Ω cm is the upper limit of the reliability.
3. Results
3.1. Magnetic susceptibility
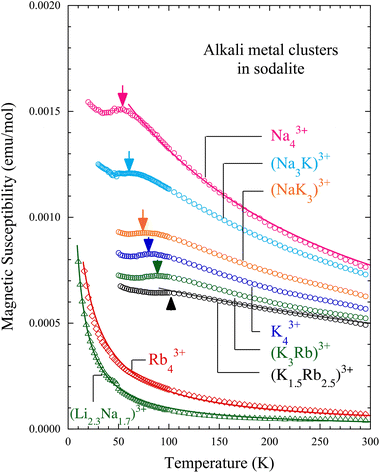
Fig. 2 shows the temperature dependence of the magnetic susceptibility χ of alkali metal-loaded sodalites. The temperature-independent negative magnetic susceptibility, which is mainly due to the diamagnetism of the quartz tube, is subtracted. The averaged chemical compositions of the alkali metal clusters A43+ are shown for each data. For the Na43+ sample, χ obeys the Curie–Weiss law above about 80 K. A peak is seen at about 50 K, indicated by an arrow. At lower temperatures, χ increases slightly again. This is a signal of paramagnetic impurities distributed in cages of a few percent on average, and is not intrinsic.22 These properties have been already reported in the literature.11,13 As alkali metals become progressively heavier, from the pure Na (Na43+) to the Na–K alloys ((Na3K)3+ and (NaK3)3+), the pure K (K43+), and the K–Rb alloys ((K3Rb)3+ and (K1.5Rb2.5)3+), the peak temperature systematically increases and the value of χ systematically decreases. The peaks of the magnetic susceptibility are rather broad. However, these are antiferromagnetic long-range orders, and it is known that the peak temperature approximately corresponds to TN: the development of a homogeneous internal magnetic field in the Na43+, K43+, and (K3Rb)3+ samples has been confirmed by muon spin rotation (μSR) experiments.13,16 In addition, magnetic Bragg peaks have been observed in neutron diffraction measurements for the Na43+ and K43+ samples.18,19We fit the data of these six samples using the Curie–Weiss law at high temperature region:
 | (2) |
Here a discussion of exchange coupling is given based on the mean-field approximation. As shown in Table 2, the relation TN < |TW| always holds for the antiferromagnetic samples. This can be explained by taking into account the exchange couplings between the nearest neighbors J1 as well as between the second nearest neighbors J2. TN and TW are given by
 | (3) |
 | (4) |
The properties are completely different for the heavier pure Rb system of Rb43+. χ obeys the Curie–Weiss law, but the value is much smaller than in the six samples above. No peak is observed, indicating a disappearance of the antiferromagnetic order. C and TW are evaluated by the fit using eqn (2) to be 0.016 K emu mol−1 and −5.7 K. This indicates that only 4% of the β-cages have the localized magnetic moments and the antiferromagnetic coupling almost disappears. As will be discussed later, this sample is metallic. Therefore, a temperature independent positive magnetic susceptibility, i.e. Pauli paramagnetism χPauli, is expected due to the conduction electrons in addition to the observed weak Curie–Weiss component. The number density of β-cage is about 3 × 1021 cm−3. This is the maximum possible value for the density of conduction electrons. In this case, χPauli is expected to be about 3 × 10⁻⁷ emu cm−3 or 6 × 10⁻⁵ emu mol−1 according to the three dimensional free electron model. However, because of χdia from the quartz tube, it was difficult to estimate χPauli accurately. It is necessary to confirm the existence of χPauli in the future by ESR, which is sensitive only to spin susceptibility and does not detect χdia.
On the side of the lighter elements there are also significant changes. In the Li–Na alloy system of (Li2.3Na1.7)3+, a Curie–Weiss behavior is also observed with small values of χ as shown in Fig. 2. No clear peak is observed. C and TW are evaluated to be 0.010 K emu mol−1 and −2.9 K. Only 3% of the β-cages have the localized magnetic moments and the antiferromagnetic coupling almost disappears. Thus, it has been found that when mixed with Li, the pure Na sample with robust antiferromagnetic order11,16,18 becomes non-magnetic.
3.2. Electrical resistivity
Fig. 3 shows the temperature dependence of the DC resistivity ρ of alkali metal-loaded sodalites. The vertical axis is in logarithmic scale. The Na43+ sample has a very high ρ of the order of 108 Ω cm at 300 K. With decreasing temperature, ρ easily reaches to the order of 109 Ω cm, which is the upper limit of the measurement setup in this study. The Na43+ sample is clearly a good insulator. The K43+ sample also shows a high ρ of the order of 108 Ω cm at 300 K. Although we have not measured the temperature dependence, this sample should also be a good insulator. As will be shown later, this is also supported by the optical absorption spectrum. In the K–Rb alloy system of (K1.5Rb2.5)3+, ρ significantly decreases down to about 30 Ω cm at 300 K. This value is about seven orders of magnitude smaller than that in K43+. With decreasing temperature, ρ increases and seems to diverge at absolute zero. In the pure Rb system of Rb43+, ρ decreases further down to about 1.8 Ω cm at 300 K. ρ increases with decreasing temperature, but is less temperature dependent. It does not seem to diverge even at absolute zero, but has a finite value.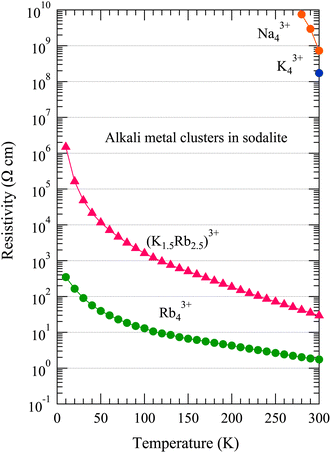 | ||
| Fig. 3 Temperature dependence of the DC resistivity of alkali metal-loaded sodalites. The vertical axis is in logarithmic scale. | ||
Normally ρ in intrinsic semiconductors shows the Arrhenius type of thermal activation due to the energy gap. For the (K1.5Rb2.5)3+ and Rb43+ samples, however, ρ does not obey the Arrhenius law. Fig. 4 shows ρ of these samples as a function of T−1/4. In the low temperature region at about T < 75 K (T−1/4 > 0.34 K−1/4), the data roughly follow straight lines. This behavior is known as the variable range hopping (VRH) in three-dimensional systems, where the system has a finite density of states at the Fermi energy, but its conductivity is governed by some disorder. In the Rb43+ sample ρ appears to settle to a constant value without divergence in the lowest temperature region.
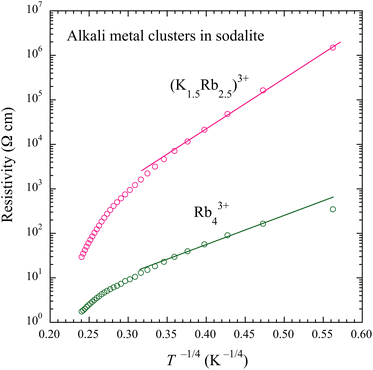 | ||
| Fig. 4 DC resistivity of alkali metal-loaded sodalites for the (K1.5Rb2.5)3+ and Rb43+ samples as a function of T−1/4. The solid straight lines are the guide to the eyes. | ||
3.3. Optical spectra
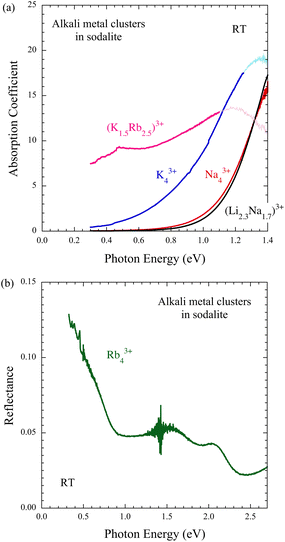
Fig. 5(a) shows the near-IR optical absorption spectra of alkali metal-loaded sodalites measured at room temperature. In the Na43+ sample an exponential-like absorption tail is clearly observed. It is an insulator with an optical gap of about 1 eV. The Li–Na alloy system (Li2.3Na1.7)3+ has a similar but slightly wider optical gap. Therefore, this sample is also a good insulator. The K43+ sample also shows an exponential-like absorption tail. The optical gap narrows to about 0.6 eV. This is consistent with the lower ρ than that of Na43+ at room temperature. The (K1.5Rb2.5)3+ sample behaves differently. The optical gap is not seen above 0.3 eV. Extrapolating the absorption tail to even zero energy, a finite value is expected. There is probably a finite number of conduction electrons at room temperature due to the thermal activation, and their response is on the low energy side. For the Rb43+ sample, the microcrystals reflect light in the measurement energy range, so a reflectance spectrum was obtained instead of an absorption spectrum, as shown in Fig. 5(b). Below about 0.8 eV, the reflectance increases significantly toward the low energy side. This is the Drude reflection due to conduction electrons, and the sample is clearly metallic. Assuming a plasma edge of 0.8 eV and a free electron mass, the density of conduction electrons is estimated to be about 0.2 per β-cage. The reflection peaks at 1.5 eV and 2.1 eV can be attributed to interband transitions in the energy bands formed by the s-electrons in the space of the arrayed β-cages.4. Discussion
Three important experimental results on the alklai metal-loaded sodalites obtained in this study are as follows: first, as the composition changes from the pure Na to the K–Rb alloy, the antiferromagnetic transition temperature systematically increases and the electrical resistivity decreases; second, for the pure Rb system, the sample becomes a non-magnetic metal; and third, in the Li–Na alloy system, the antiferromagnetism that was strong in the case of the pure Na system disappears and the sample becomes a non-magnetic insulator. We will attempt to understand these phenomena in a unified manner taking into account the electron correlation and the polaron effect.As shown in Fig. 1(b), the s-electron is confined in the β-cage, because it is attracted by the four alkali cations and repulsed by the negatively charged framework. The size of the s-electron wave function plays a key role in the antiferromagnetic exchange coupling as discussed in previous works.13,14 The heavier alkali atom has a larger cation size and a lower ionization energy. They lead to a weaker electron–phonon coupling. These factors contribute to the expansion of the cluster size and the reduction of the potential depth of the cluster. Then, in the heavier alkali metal clusters, the size of the cluster's s-electron wave function increases. This causes the on-site Coulomb repulsion energy U between two electrons in the cluster to decrease and the electron transfer energy t between adjacent clusters through the 6R windows of β-cages to increase. In general, a reduction in U/t enhances kinetic exchange coupling in the Mott-Hubbard insulating state.25 Thus, in the heavier alkali metal clusters in sodalite, the TN increases. First-principle calculations for Na43+ and K43+ in sodalite9,10 support this scenario. Experimentally we have extended it to the K–Rb alloy clusters.
As mentioned above, an important factor in determining the depth of the potential for the s-electrons is the ionization energy of the cluster's constituent atoms. This should also be positively correlated with both U/t and electron–phonon coupling. We therefore use the average ionization energies EIav of the elements in the cluster as a parameter, which is defined as  where EIi is the ionization energy of the ith atom in the A43+ cluster. In Fig. 6, TN is plotted as a function of EIav. In this way, we are able to visualize the alkali element dependence of the strength of the antiferromagnetic coupling as a physically relevant phase diagram. Besides the systematic increase in TN from Na43+ to (K1.5Rb2.5)3+ with decreasing EIav, antiferromagnetic order suddenly collapses in Rb43+ with metallic properties. This can simply be understood as a Mott type insulator-metal transition due to the decrease in U/t.
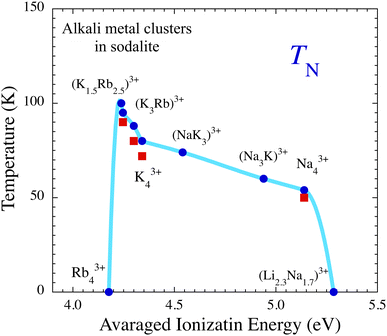 | ||
| Fig. 6 Néel temperature TN of alkali metal-loaded sodalites as a function of the average ionization energy of the atoms consisting the A43+ cluster. TN was estimated from the magnetic susceptibility (blue circles) and from the muon spin rotation/relaxation (red squares).13,16 For Rb43+ and (Li2.3Na1.7)3+, the antiferromagnetic phase transition was not observed above 1.8 K. The light blue curve is a guide for the eyes. | ||
There are various materials in which the Mott transition occurs by changing U/t without changing the filling of electrons into the energy bands. One useful technique is to use high pressure to increase t by squeezing the crystal lattice, and Mott transitions have been achieved in such as NiS2,26 organic conductors,27,28 alkali metal-doped fullerenes,29 and other materials. Another method is elemental substitution: in the alkali metal-doped fullerene,30 the donor alkali cation acts as a spacer, changing the lattice constant depending on the cation size and thus t can be changed. In organic conductors,31 anion molecules play this role. Conversely, a large anion size can increase the bandwidth, as in NiS2−xSex.32,33 The sodalite system is unlike any of these examples. As mentioned earlier, the larger the cations, the shallower the potential of the cluster and the lower the U/t. In addition to this, we will show below that structural changes in the host crystal also change t. In the Na43+ and K43+ samples, the values of TN and |TW| were found to decrease monotonically with applied pressure.34,35 The result that t does not increase with decreasing lattice constant by pressure is seemingly contradictory; it was expected that the 6R window narrows with pressurization.35Table 3 lists some parameters of the crystal structure of the Na43+, K43+, and (K1.5Rb2.5)3+ samples at ambient pressure. The antiferromagnetic exchange coupling becomes stronger as the lattice constant increases.22 This is the opposite of the usual expectation. As the lattice constant increases, the bond length changes only slightly, but the Al–O–Si bond angle increases markedly. Fig. 7 illustrates the 6R windows of the Na43+, K43+, and (K1.5Rb2.5)3+ samples. The systematic increase in the Al–O–Si bond angle results in an increase in the effective window size of 6R. As the cluster's constituent ions become heavier (larger), the potential for the s-electrons becomes shallower, and simultaneously, the 6R window becomes larger. These synergistic effects systematically reduce the U/t. In other words, the effect of the so-called chemical pressure is the opposite of that of conventional materials. A theoretical calculation predicted a collapse of the antiferromagnetic order and a non-magnetic metallic state by applying pressure up to the order of 10 GPa.36 However, it is experimentally realized in the Rb43+ sample at ambient pressure.
 | ||
| Fig. 7 The 6-membered rings for the alkali metal-loaded sodalites with (a) Na43+ (ref. 7), (b) K43+ (ref. 9), and (c) (K1.5Rb2.5)3+ (ref. 24) clusters obtained by crystal structure analysis. The views from the 111 direction and from the side are shown. The bonds forming the 6Rs are not planar but three-dimensionally bent. There is only one type of Al–O–Si bond angle for each sample. | ||
Although we have nominally labeled the sample Rb43+, the true charge state of the cluster (or atom) is unknown, unlike the Na43+ and K43+ samples. In the Rb43+ sample, the spatial broadening of the s-electron wavefunction may be very large, and charge transfer to the sodalite framework may partially occur. In alkali-doped fullerenes, charge transfer essentially occurs from the alkali metal to the fullerene molecule. In heavily doped samples, however, charge transfer is only partial and new electronic states are known to form also in the Na or Li clusters as the interstitials.37,38 Further element specific experiments, such as nuclear magnetic resonance (NMR), are needed to clarify the partial charge transfer in the Rb-loaded sodalite sample in the future.
Next, we discuss the non-magnetic insulator phase of the Li–Na alloy system (Li2.3Na1.7)3+. In this sample, not only has the antiferromagnetic order disappeared, but the magnetic moment no longer exists. This means that the s-electrons form spin-singlet pairs. The electron–phonon interaction is the most likely cause of pair formation, overcoming the Coulomb repulsion between electrons. This is also known as the polaron effect. Because of its smaller ion size and deeper ionization potential, Li has stronger electron–phonon interactions than Na. The exact structure of the cluster has not been determined, but the bipolaron-insulator state is probably realized in the Li–Na alloy system.
By systematically changing the chemical composition of the alkali metal clusters in sodalite from Li–Na alloy to Rb, we successively observed the bipolaron insulating state, the Mott insulating state with antiferromagnetic order, and the non-magnetic metallic state. It is thought that model materials such as those discussed in the Hubbard-Holstein model,39 which incorporates both electron–electron Coulomb repulsion and electron–phonon interactions, can be realized in sodalite crystals.
5. Conclusions
Li–Na alloy, Na–K alloy, and pure Rb clusters in sodalite crystals were newly prepared. In addition to the magnetic properties, the electrical and optical properties were investigated, including those of previous samples, namely, Na, K, and K–Rb alloy clusters. The Na, Na–K alloy, K, and K–Rb alloy clusters arranged in sodalite are insulators and exhibit antiferromagnetic ordering. TN systematically increases from about 50 K to about 100 K in this order. However, the Rb clusters show a non-magnetic metallic state. This can be understood as a Mott type insulator-metal transition due to the decrease in U/t. On the other hand, the Li–Na alloy clusters show a non-magnetic insulating state. A pairing of two electrons probably occur due to the strong electron–phonon coupling overcoming the electron–electron Coulomb repulsion. A phase diagram of this system was constructed using the averaged ionization energy as a parameter. This parameter should be positively correlated with both U/t and electron–phonon coupling. We propose that alkali metal-loaded sodalite is a good candidate material that can be described by the Hubbard-Holstein model with constant electron filling.Author contributions
K. W., A. H., Y. I., K. T. and R. S.: sample preparations and measurements; K. W., A. H., Y. I., K. T., R. S. and T. N.: data analysis; T. N.: research design, paper conceptualisation and writing.Conflicts of interest
There are no conflicts to declare.Acknowledgements
The authors are grateful to Yasuo Nozue for his support, and also to Shigeru Tamiya for performing the chemical analysis. This work was supported by JSPS KAKENHI Grant Numbers JP24244059, JP26400334, JP15KK0165 and JP19K03738.References
- M. S. Dresselhaus and G. Dresselhaus, Adv. Phys., 2002, 51, 1–186 CrossRef CAS.
- O. Gunnarsson, Rev. Mod. Phys., 1997, 69, 575–606 CrossRef CAS.
- T. Nakano and Y. Nozue, Adv. Phys.: X, 2017, 2, 254–280 CAS.
- R. Barrer and J. Cole, J. Phys. Chem. Solids, 1968, 29, 1755–1758 CrossRef CAS.
- M. Harrison, P. Edwards, J. Klinowski, J. Thomas, D. Johnson and C. Page, J. Solid State Chem., 1984, 54, 330–341 CrossRef CAS.
- O. F. Sankey, A. A. Demkov and T. Lenosky, Phys. Rev. B: Condens. Matter Mater. Phys., 1998, 57, 15129–15139 CrossRef CAS.
- G. K. H. Madsen, C. Gatti, B. B. Iversen, L. Damjanovic, G. D. Stucky and V. I. Srdanov, Phys. Rev. B: Condens. Matter Mater. Phys., 1999, 59, 12359–12369 CrossRef CAS.
- R. Windiks and J. Sauer, J. Chem. Phys., 2000, 113, 5466–5476 CrossRef CAS.
- G. K. H. Madsen, B. B. Iversen, P. Blaha and K. Schwarz, Phys. Rev. B: Condens. Matter Mater. Phys., 2001, 64, 195102 CrossRef.
- K. Nakamura, T. Koretsune and R. Arita, Phys. Rev. B: Condens. Matter Mater. Phys., 2009, 80, 174420 CrossRef.
- V. I. Srdanov, G. D. Stucky, E. Lippmaa and G. Engelhardt, Phys. Rev. Lett., 1998, 80, 2449 CrossRef CAS.
- L. Damjanovic, G. D. Stucky and V. I. Srdanov, J. Serb. Chem. Soc., 2000, 65, 311 CrossRef CAS.
- T. Nakano, R. Suehiro, A. Hanazawa, K. Watanabe, I. Watanabe, A. Amato, F. L. Pratt and Y. Nozue, J. Phys. Soc. Jpn., 2010, 79, 073707 CrossRef.
- T. Nakano, Y. Ishida, A. Hanazawa and Y. Nozue, J. Korean Phys. Soc., 2013, 62, 2197 CrossRef CAS.
- I. Heinmaa, S. Vija and E. Lippmaa, Chem. Phys. Lett., 2000, 327, 131–136 CrossRef CAS.
- R. Scheuermann, E. Roduner, G. Engelhardt, H.-H. Klauss and D. Herlach, Phys. Rev. B: Condens. Matter Mater. Phys., 2002, 66, 144429 CrossRef.
- M. Igarashi, T. Nakano, A. Goto, K. Hashi, T. Shimizu, A. Hanazawa and Y. Nozue, J. Phys. Chem. Solids, 2012, 73, 1534 CrossRef CAS.
- T. Nakano, M. Matsuura, A. Hanazawa, K. Hirota and Y. Nozue, Phys. Rev. Lett., 2012, 109, 167208 CrossRef PubMed.
- T. Nakano, M. Matsuura, A. Hanazawa and Y. Nozue, JPS Conf. Proc., 2015, 8, 034011 Search PubMed.
- T. Nakano, H. Tsugeno, A. Hanazawa, T. Kashiwagi, Y. Nozue and M. Hagiwara, Phys. Rev. B: Condens. Matter Mater. Phys., 2013, 88, 174401 CrossRef.
- T. Nakano, N. Fukuda, M. Seto, Y. Kobayashi, R. Masuda, Y. Yoda, M. Mihara and Y. Nozue, Phys. Rev. B: Condens. Matter Mater. Phys., 2015, 91, 140101 CrossRef.
- See ESI†.
- T. Kodaira, Y. Nozue, S. Ohwashi, T. Goto and O. Terasaki, Phys. Rev. B: Condens. Matter Mater. Phys., 1993, 48, 12245–12252 CrossRef CAS PubMed.
- T. Nakano, et al., unpublished.
- T. Moriya and H. Hasegawa, J. Phys. Soc. Jpn., 1980, 48, 1490–1503 CrossRef CAS.
- N. Mōri and H. Takahashi, J. Magn. Magn. Mater., 1983, 31–34, 335–336 CrossRef.
- F. Kagawa, K. Miyagawa and K. Kanoda, Nature, 2005, 436, 534–537 CrossRef CAS PubMed.
- Y. Kurosaki, Y. Shimizu, K. Miyagawa, K. Kanoda and G. Saito, Phys. Rev. Lett., 2005, 95, 177001 CrossRef CAS PubMed.
- A. Y. Ganin, Y. Takabayashi, P. Jeglič, D. Arčon, A. Potočnik, P. J. Baker, Y. Ohishi, M. T. McDonald, M. D. Tzirakis, A. McLennan, G. R. Darling, M. Takata, M. J. Rosseinsky and K. Prassides, Nature, 2010, 466, 221–225 CrossRef CAS PubMed.
- R. H. Zadik, Y. Takabayashi, G. Klupp, R. H. Colman, A. Y. Ganin, A. Potočnik, P. Jeglič, D. Arčon, P. Matus, K. Kamarás, Y. Kasahara, Y. Iwasa, A. N. Fitch, Y. Ohishi, G. Garbarino, K. Kato, M. J. Rosseinsky and K. Prassides, Sci. Adv., 2015, 1, e1500059 CrossRef PubMed.
- H. Kobayashi, H. Akutsu, E. Arai, H. Tanaka and A. Kobayashi, Phys. Rev. B: Condens. Matter Mater. Phys., 1997, 56, R8526–R8529 CrossRef CAS.
- X. Yao, J. M. Honig, T. Hogan, C. Kannewurf and J. Spałek, Phys. Rev. B: Condens. Matter Mater. Phys., 1996, 54, 17469–17475 CrossRef PubMed.
- M. Matsuura, H. Hiraka, K. Yamada and Y. Endoh, J. Phys. Soc. Jpn., 2000, 69, 1503–1508 CrossRef CAS.
- K. Mizoguchi, T. Takanashi, H. Sakamoto, L. Damjanovic and V. I. Srdanov, Mol. Cryst. Liq. Cryst., 2000, 341, 467–472 CrossRef CAS.
- K. Mizoguchi, T. Yamabe, H. Sakamoto, L. Damjanovic and V. I. Srdanov, Phys. B, 2003, 329–333, 1255–1256 CrossRef CAS.
- G. K. H. Madsen and P. Blaha, Phys. Rev. B: Condens. Matter Mater. Phys., 2003, 67, 085107 CrossRef.
- W. Andreoni, P. Giannozzi, J. F. Armbruster, M. Knupfer and J. Fink, Europhys. Lett., 1996, 34, 699 CrossRef CAS.
- F. Giglio, D. Pontiroli, M. Gaboardi, M. Aramini, C. Cavallari, M. Brunelli, P. Galinetto, C. Milanese and M. Riccò, Chem. Phys. Lett., 2014, 609, 155–160 CrossRef CAS.
- G. S. Jeon, T.-H. Park, J. H. Han, H. C. Lee and H.-Y. Choi, Phys. Rev. B: Condens. Matter Mater. Phys., 2004, 70, 125114 CrossRef.
Footnotes |
| † Electronic supplementary information (ESI) available. See DOI: https://doi.org/10.1039/d4dt00562g |
| ‡ The three-letter code is the framework type code assigned by the Structure Commission of the International Zeolite Association (IZA-SC). |
| § Na43+ and K43+ were first reported by Srdanov et al.11 and Damjanovic et al.,12 respectively. |
| ¶ The same analysis for Na43+ was first reported by Heinmaa et al.15 |
| This journal is © The Royal Society of Chemistry 2024 |

