 Open Access Article
Quantitative fluoride imaging of teeth using CaF emission by laser induced breakdown spectroscopy
Mauro
Martinez
 *a,
G. Jean
Harry
b,
Erin N.
Haynes
c,
Pi-I. D.
Lin
d,
Emily
Oken
d,
Megan K.
Horton
a,
Robert O.
Wright
a,
Manish
Arora
a and
Christine
Austin
 a
a
aDepartment of Environmental Medicine and Public Health, Icahn School of Medicine at Mount Sinai, New York, NY, USA. E-mail: mauro.martinez@mssm.edu
bMechanistic Toxicology Branch, Division of National Toxicology Program, National Institute of Environmental Health Sciences, Research Triangle Park, NC, USA
cDepartment of Epidemiology, College of Public Health, University of Kentucky, Lexington, KY, USA
dDivision of Chronic Disease Research Across the Life Course, Department of Population Medicine, Harvard Medical School and Harvard Pilgrim Health Care Institute, Boston, MA, USA
First published on 15th December 2022
Abstract
In this work, we propose the use of molecular emission of calcium fluoride (CaF) by laser induced breakdown spectroscopy (LIBS) to obtain quantitative fluoride distribution images of teeth. LIBS has proved to be an efficient technique to detect low amounts of fluoride in solids, and human teeth have the advantage being a matrix rich in calcium. We used new calibration material from sintered hydroxyapatite pellets doped with fluoride to determine the optimized LIBS conditions of argon flow at 1 L min−1 and using the green emission bands of CaF in 530 nm, and obtained a calibration curve between 0 and 400 μg g−1, and LOD of 18 μg g−1. This methodology was applied within a rat model of fluoride exposure and showed increasing tooth-fluoride with increased exposure dose. To demonstrate applicability of this method in human teeth, we quantified fluoride distribution in teeth from three children from non-fluorinated and fluorinated water regions. Samples from children living in fluoridated water regions showed higher fluoride concentrations in dentine formed after birth, compared to a child from a non-fluoridated region. Teeth have been used as biomarkers for environmental exposure and this new method opens the opportunity in epidemiology research to study critical windows of early life exposure to fluoride as well.
1 Introduction
Fluorine is the most electronegative and reactive element in the periodic table,1 and is most commonly distributed in the earth's crust as the minerals fluorite (CaF2), fluoroapatite (Ca5(PO4)3F) and cryolite (Na3AlF6).1,2 These minerals interchange fluoride ions when exposed to water, releasing fluoride into water sources around the globe.3–5 Fluoride exposure is highly dependent on geographical area. A primary source for fluoride exposure is drinking water,6 with 75–90% of fluoride exposure in humans related to consumption of high fluoride levels in natural and fluoridated water.5,7 Food is another major source of fluoride exposure, accounting for as much as 80–85% of intake in some areas.8,9 Drinking water is fluoridated in the US as a program to prevent dental caries across the population.10 Other counties, such as Mexico, include fluoride in common salt for similar reasons.11 Fluoride has a high affinity with calcium and its phosphate phases and is therefore predominately stored in bones and teeth after exposure.12 The mineral component of teeth and bones of vertebrates is predominantly hydroxyapatite (Ca5(PO4)3OH).13 Fluoride substitutes in the hydroxide position, forming fluorapatite, which is much less soluble in the presence of acids than hydroxyapatite, and the basis of using fluoride in dental health products to help prevent dental caries.13–15 Other tissues where fluoride is stored due the high presence of calcium are the pineal gland,16,17 kidney,18,19 hair and nails.20Fluoride is essential to living organisms; however, at elevated concentrations it can be harmful. Excess fluoride disrupts the development of teeth and bones; a condition called fluorosis.5,21 Fluorosis hampers enamel mineralization and can lead to tooth loss; also, bones can become more fragile;20 this process is irreversible. In addition, fluoride exposure has been associated with chronic kidney disease in children,18,19,22 neurological impairment23,24 and hormonal imbalance.25–27
Numerous methods have been used to identify and quantify fluoride in different matrices, typically requiring matrix dissolution prior to analysis. Well established techniques for fluoride determination are ion selective electrode (ISE)28,29 and ion chromatography (IC).29,30 However, fluoride detection is challenging via spectroscopy and spectrometry techniques due to its high ionization potential and electronegativity. However, using inductively coupled plasma (ICP-MS) with a reaction cell mode has been possible to determine fluoride in water after adding excess barium to form the ion BaF+.31,32 Techniques capable of solid sampling include laser induced breakdown spectroscopy (LIBS),33,34 X-ray fluorescence (XRF)35 and proton induced X-ray emission (PIXE).36–39 Fluoride limits of detection (LOD) for these techniques range between 100 to 1000 mg L−1, much higher than that reported for ISE or IC, 1 mg L−1 and 0.02 mg L−1 respectively. Fluoride detection by LIBS typically uses the atomic emission line at 685 nm. However, due to the high ionization potential, analysis requires a helium gas flow and only a relatively high LOD of 135 mg kg−1 can be achieved.33,40 This LOD is higher than the expected fluoride concentration in teeth. Another approach to fluoride quantification is to use the formation of calcium monofluoride molecule (CaF) by recombination, and detecting its molecular transition by absorption or emission. The observation of CaF molecular spectroscopy dates back at the beginning use of emission spark spectroscopy.41–43 Later the introduction of commercially available equipment for high-resolution continuum source atomic absorption spectrometry (HR-CS AAS) opened the opportunity to explore an application for fluoride quantification,44,45 especially using CaF,37,38 including the graphite furnace (HR-CS-GF AAS) for solid sampling.37,39,46 Using these methodologies, LODs as low as 3.75 mg kg−1 have been achieved.39
This molecular recombination approach can be leveraged in LIBS to improve sensitivity. During the cool down process in the laser-induced plasma, some microseconds after the laser–matter interaction, a recombination of atoms into small molecules begins.47 In addition, at this point the plasma temperature promotes electron excitation to higher molecular levels and by consequence the emission of light from these small molecules.47 By optimizing the gate delay between the laser pulse and signal acquisition, it is possible to record the presence of CaF in the plasma. The first use of CaF molecular bands in LIBS was reported by Gaft et al. in 2014 for elemental analysis of halogens.48 Furthermore, the first report of fluoride presence in Mars's surface came from the detection of CaF emission bands by the ChemCam Instrument of the Curiosity rover.49 This new approach has been used to quantify CaF in fluorite mining ores,50 fluoride in toothpaste50 and even fluoride in calcium-free samples by nebulizing a calcium containing solution on the sample surface.51
Solid sampling methods are advantageous as they enable quantitative mapping of fluoride distribution in tissues. Metals distribution imaging by laser ablation-ICP-MS and LIBS, has been used in different fields as geology52,53 and medicine.54–56 This is particularly important for the analysis of teeth where the spatial mapping of elements has been used to develop biomarkers for metal exposure during early child development.57–60 Deciduous teeth start to calcify as early has second trimester (starting at 13–16 weeks gestation for first group of incisors) and continue growing, until is exfoliated in childhood.61 During this time, circulating inorganic elements and organic molecules are incorporated into the tooth structure. Imaging fluoride in teeth can be used to reconstruct the timing of exposure to this halogen and study its association with different health outcomes. Previous methods used to measure fluoride in teeth have required the dissolution of whole teeth for measurement by ISE which destroys the temporal information encoded in teeth;62 or cutting micro sections from a tooth sample to procedure that take a long processing time.63,64 Other methodology used for mapping is PIGE/PIXE, however the scanning areas going up 1 mm by 1 mm and makes the mapping for a whole tooth area difficult and a long sample preparation process.36,65 In this case, LIBS has as advantage that is possible to map and quantify the fluoride in the whole tooth sample, no matter the dimensions.
In this work, we evaluate the use of CaF molecular emission bands for the quantitative imaging of fluoride in teeth by LIBS, with the overall aim of using tooth CaF as a biomarker of fluoride exposure during early development. The effect of the gas flow in the CaF formation, emission bands and other method parameters were studied. In addition, method parameters were optimized using hydroxyapatite sintered pellets standard material doped with fluoride, and calibration curves from CaF molecular emission bands were used to obtain a quantitative image of fluoride distribution in teeth. Finally, this method was applied to an animal model of fluoride exposure and teeth collected from children residing in areas with and without fluoridated water.
2 Experimental
2.1 Hydroxyapatite in house standards
A series of hydroxyapatite (HA) calibration materials containing fluoride were prepared following the co-precipitation procedure reported by Martinez et al.,66 with a nominal concentration between 0 (i.e. blank) to 1000 μg g−1. This range is expected to cover tooth-fluoride concentrations from individuals consuming fluoridated and non-fluoridated water and under other sources of exposure. Briefly, hydroxyapatite was precipitate from pure calcium nitrate tetra hydrate (Ca(NO3)2·4H2O, Acros Organic) and ammonium dihydrogen phosphate (NH4H2PO4, Acros Organic). Aqueous solutions of NH4H2PO4 (0.48 M) and Ca(NO3)2·4H2O (1 M) were prepared in ultrapure water (18 MΩcm) and pH-adjusted to a value of 9 by adding ammonium hydroxide (NH4OH, Fisher Scientific). Sodium fluoride (NaF2, Fisher Scientific) was added to the phosphate solution at a concentration adjusted to achieve suitable concentrations in the desired standard materials. The Ca(NO3)2·4H2O solution was added dropwise and under magnetic stirring to the NH4H2PO4 solution, then the mixture was then aged for 5 days at 37 °C. The precipitate was subsequently filtered, washed with sodium hydroxide (0.05 M NaOH, Fisher Scientific) and dried in an oven at 80 °C overnight. Later, this powder was lightly ground in an agate mortar, and calcined at 450 °C for three hours. The resulting powder was sieved until 200 Mesh to retain the smaller crystal grains. This new hydroxyapatite crystalline powder was pelletized in a die through uniaxial pressing at 0.5 MPa, following a cold isostatic pressing at 200 MPa. The resulting samples were consolidated by a sintering process in air at 1200 °C, using heating and cooling rates of 2 °C min−1 and a holding time of 2 h.Approximately 0.1 g of each pellet was dissolved with 1 mL of nitric acid (HNO3, trace metal, Acros Organic) overnight and 1 mL of 15% sodium acetate solution (NaCH3COO, Acros Organic) (1.8 M) was added to the digested sample and diluted with deionized water with resistance less than 18 Ωcm for the determination of the fluoride content by ISE. Tooth powder was treated with the same procedure for the total fluoride analysis by ISE. A fluoride Ion Selective combination: electrode (Orion 9609BNWP) and pH/ISE/mV Meter (Orion VersaStar) was used for the determination of fluoride in LIBS calibration material and samples. Following the standard method, one part of fluoride standard or sample was mixed with three parts of total ionic strength adjustment buffer (TISAB II). The ISE was calibrated with a set of fluoride standards in the range of 0.1–10 mg L−1 and then the individual sample analysis was performed. To evaluate ISE accuracy and validity of applied methods, samples were spiked with fluoride standard solutions and recoveries were measured in the range of 96.7–98.5%.
2.2 Animal model
Timed-pregnant Long-Evans hooded rats (Charles River Laboratory, Raleigh, NC) were received on gestational day (GD) 4 and individually housed in ventilated cages (Techniplast, West Chester, PA) with autoclaved, hardwood bedding (PJ Murphy, Montville, NY) within a semi-barrier room (40–60% humidity; 12 h light/dark cycle:6![[thin space (1/6-em)]](https://www.rsc.org/images/entities/char_2009.gif) :
:![[thin space (1/6-em)]](https://www.rsc.org/images/entities/char_2009.gif) 00–18
00–18![[thin space (1/6-em)]](https://www.rsc.org/images/entities/char_2009.gif) :
:![[thin space (1/6-em)]](https://www.rsc.org/images/entities/char_2009.gif) 00; 20–24 °C). All animals were maintained on a low-fluoride chow containing a confirmed level of 3.24 ppm F− (Official Methods of Analysis Methods 944.08 and 978.03; AOAC International, Gaithersburg, MD; Covance, Madison, WI) (Teklad Custom Diet TD.16017). Dams were randomly assigned to exposure groups receiving either normal reverse osmosis treated drinking water (RO-H2O) or water supplemented with either 10 ppm F− (G3) or 20 ppm F− (G4). Dosing solutions were prepared fresh weekly with sodium fluoride (NaF; lot #X0044851; 99.9%; Materion, Milwaukee, WI). Fluoride levels in drinking water were confirmed [RO-H2O: <0.2 ppm; 10 ppm and 20 ppm F−within 5% of target] (Analytical Method: EPA 300.0; Pace Analytical, Huntersville, NC). Food and water were available ad libitum. Exposure to the dams began on GD6 and continued throughout lactation. On postnatal day 4 (PND4) with day of birth PND0, pups within each group [3.4 mg L−1 (DG2), 10 mg L−1 (DG3) and 20 mg L−1 (DG4)] were fully cross-fostered to establish litters of 10 pups. Pups were allowed free access to dose group drinking water, beginning consumption around PND14, continuing until study termination (∼PND80). Tissue used for analysis was selected to ensure a sampling of only one pup per gestational and lactational litter. Following CO2 euthanasia and decapitation, the entire head was frozen on dry ice and stored at −20 °C and shipped to Icahn School of Medicine. All animal procedures were conducted in accordance with the policies on animal welfare of the National Institutes of Health (NIH, “Guide for the Care and Use of Laboratory Animals,” Institute of Laboratory Animal Resources, National Research Council, 1996) according to protocols approved by the National Institute of Environmental Health Sciences (NIEHS) Animal Care and Use Committee within Association for Assessment and Accreditation of Laboratory Animal Care (AAALAC) approved animal facilities.
00; 20–24 °C). All animals were maintained on a low-fluoride chow containing a confirmed level of 3.24 ppm F− (Official Methods of Analysis Methods 944.08 and 978.03; AOAC International, Gaithersburg, MD; Covance, Madison, WI) (Teklad Custom Diet TD.16017). Dams were randomly assigned to exposure groups receiving either normal reverse osmosis treated drinking water (RO-H2O) or water supplemented with either 10 ppm F− (G3) or 20 ppm F− (G4). Dosing solutions were prepared fresh weekly with sodium fluoride (NaF; lot #X0044851; 99.9%; Materion, Milwaukee, WI). Fluoride levels in drinking water were confirmed [RO-H2O: <0.2 ppm; 10 ppm and 20 ppm F−within 5% of target] (Analytical Method: EPA 300.0; Pace Analytical, Huntersville, NC). Food and water were available ad libitum. Exposure to the dams began on GD6 and continued throughout lactation. On postnatal day 4 (PND4) with day of birth PND0, pups within each group [3.4 mg L−1 (DG2), 10 mg L−1 (DG3) and 20 mg L−1 (DG4)] were fully cross-fostered to establish litters of 10 pups. Pups were allowed free access to dose group drinking water, beginning consumption around PND14, continuing until study termination (∼PND80). Tissue used for analysis was selected to ensure a sampling of only one pup per gestational and lactational litter. Following CO2 euthanasia and decapitation, the entire head was frozen on dry ice and stored at −20 °C and shipped to Icahn School of Medicine. All animal procedures were conducted in accordance with the policies on animal welfare of the National Institutes of Health (NIH, “Guide for the Care and Use of Laboratory Animals,” Institute of Laboratory Animal Resources, National Research Council, 1996) according to protocols approved by the National Institute of Environmental Health Sciences (NIEHS) Animal Care and Use Committee within Association for Assessment and Accreditation of Laboratory Animal Care (AAALAC) approved animal facilities.
Soft tissue adherent to the external surface of the jaw was removed by scraping with a scalpel. Upper and lower incisors were extracted using dental forceps and washed in Milli-Q water prior to embedding in EpoxiCure 2 (Buehler) resin. The resin block was ground using CarbiMet S 600 (P1200) paper (Buehler) until the center axis of the incisor was exposed. The surface was then polished with P1500 and P2500 paper and finally 1 μm diamond paste (MetaDi Ultra Paste, Buehler). Resin blocks were finally sonicated in Milli-Q water to remove any diamond paste from the surface.
2.3 Human samples
One tooth from each of three cohorts based in Ohio, USA, Italy and Massachusetts, USA, was analyzed to demonstrate the applicability of this technique to human deciduous teeth. Details of each cohort are provided below, and all teeth were collected after natural shedding.The Communities Actively Researching Exposure Study (CARES) is an ongoing community-engaged research study to investigate the effects of environmental exposures, particularly manganese (Mn) exposure, on neurodevelopment in children.67 The cohort has expanded to include communities experiencing high levels of ambient Mn. Marietta CARES participants were recruited from 2008–2014 from Marietta, OH and Cambridge, OH and their surrounding area68 and East Liverpool CARES participants were recruited between 2013 and 2014 from East Liverpool, OH.69,70 Children were eligible to participate if they were between the ages of seven and nine years, had resided in the community for their entire lives, and had no plans to relocate in the next year. The biological mother of the child must have lived in the same community since the 16th week of pregnancy with the participating child.
A detailed description of the Public Health Impact of Manganese Exposure (PHIME) study was previously published.71 Briefly, 720 children ages 10–14 years were recruited from three demographically similar but geographically distinct sites in the province of Brescia, Italy. To be eligible for the study, all participants must have been (1) born to families living in the designated study area since the 1970s; (2) living in the study area since birth, and (3) ages 10–14 years at enrollment. Participants were excluded if they (1) had any diagnosed metabolic, neurological, hepatic or endocrine diseases, or clinically diagnosed hand/finger motor deficits; (2) took any prescription psychoactive drugs; (3) had clinically diagnosed behavioral manifestations of cognitive impairment, or (4) had inadequately corrected visual deficits.
Project Viva is an ongoing prospective pre-birth cohort of mothers and their children to study maternal and child health in relation to prenatal diet and other factors. A detailed cohort profile was previously published.72 Briefly, women living in eastern Massachusetts during 1999–2002 were recruited at their initial prenatal visit across eight urban and suburban practices of a multi-specialty group practice. Women were eligible if pregnant with a singleton at <22 weeks gestation at time of recruitment, could answer questions in English, and had no plans to move out of the area before delivery. In person visits were performed during the first and second trimesters, at delivery, infancy, early childhood, mid-childhood, early adolescence and mid/late adolescence. A total of 1279 mother–child pairs provided data at the mid-childhood visit and teeth were collected from 206 children.
Human incisors were cut along the labio–lingual plane using a low speed saw (Isomet, Buehler) with a diamond encrusted blade. One half of the tooth was then embedded in resin, ground and polished following the same procedure as for the rat incisors above.
2.4 LIBS analysis
LIBS experiments were performed using a commercially available LIBS J200 LIBS system (Applied Spectra Inc., Fremont, CA). The instrument consists of a 266 nm Nd:YAG laser (5 ns), with a shot repetition rate of 10 Hz, and variable energy and ablation spot size available. After each laser pulse the emitted radiation was collected using two different collection optics connected to optical fibers, one collection optic optimized for Visible-NIR light and a second collection optic for UV-visible light. Collected light was analyzed using either a Czerny-Turner spectrometer (Andor, Kymera193i) coupled with high performance NIR ICCD detector (Andor, iStar ICCD) with a grating turret 1800 g mm−1 for VIS and NIR coverage, and a 6-channel spectrometer covering a spectral range from 190 to 1040 nm. LIBS parameters optimized were gate delay (length of time between the laser pulse and the spectrometer detector turning on), gate width (length of time the detector remains on), laser energy and gas used in the ablation chamber. LIBS data were displayed using Axiom 2.0 software provided by the manufacturer that record the spectrum from both spectrometers for any laser shot.For the hydroxyapatite calibration material five raster lines, with a length of 2.5 mm and spaced every 0.1 mm, were measured in each HA pellet. Each raster line generated 26 single shot emission spectra, totaling 130 shots which were averaged. Data treatment was performed using the net area of the emission signal. Integration of the signal was carried out using MATLAB R2019b. For the 530 nm spectral window, intensity of the CaF molecular bands were calculated after drawing a baseline between 528 to 542 nm and integrating the signal between 528 to 532 nm, just before the Ca I emission line. For the 600 nm spectral window, the CaF molecular bands intensity was calculated after drawing a baseline between 591 to 607 nm and integrating the signal above the baseline between 591 and 607 nm. These parameters were chosen to avoid the inerference form the Na I doublet at 589.0 and 589.5 nm. For tooth analysis, sampling parameters were selected for a raster line pattern that covered the entire sample area, with a spot size of 100 μm, no gap between adjacent lines and using a raster speed of 1 mm s−1 that ensured laser spots were adjacent without overlapping.
3 Results
3.1 Spectral windows optimization
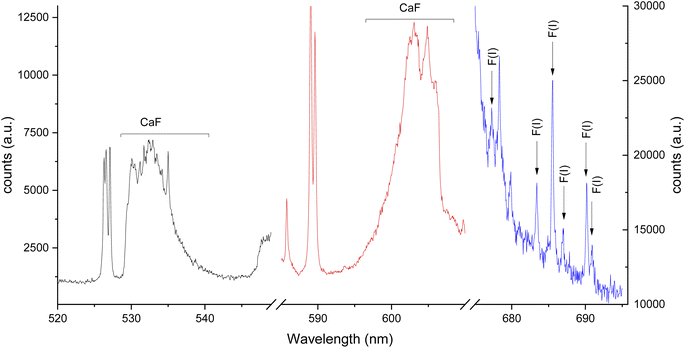
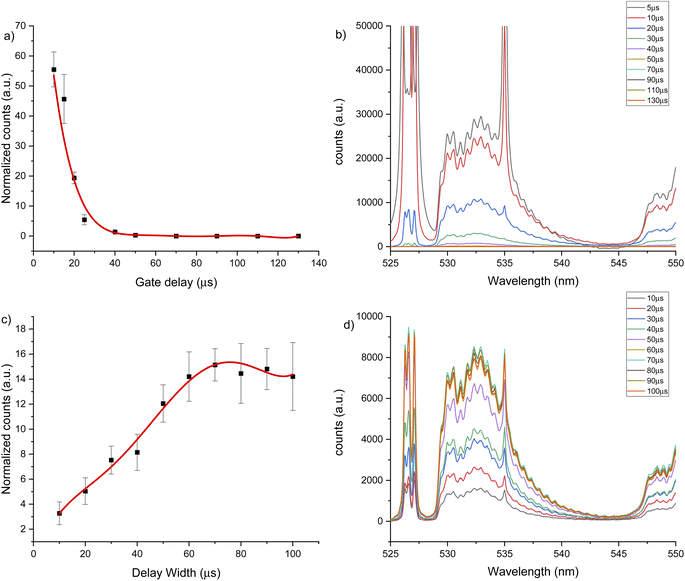
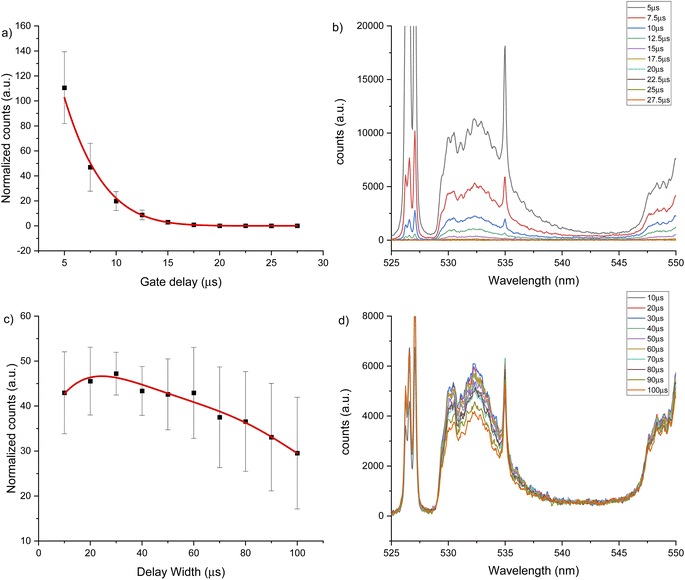
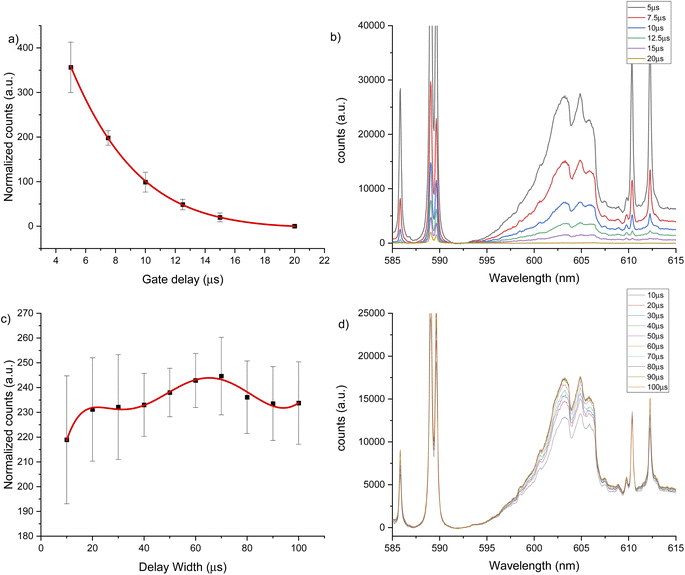
Two intense molecular systems from CaF have been identified in the visible region. A band system in the orange region of the spectrum, known as “Orange System” A2Π − X2Σ, consisting of strong emission bands between 602.43 nm to 608.69 nm (see Fig. 1a); and a band system in the green region of the spectrum known as “Green System” B2Π − X2Σ, consisting of strong emission bands between 529.10 nm to 542.19 nm41–43 (see Fig. 1b). In addition, the spectral interval of 670–710 nm present a clearly observed group of atomic emission lines from fluorine with a high peak at 685.6 nm corresponding to 2s22p4(3P)3s to 2s22p4(3P)3p transition (see Fig. 1c). Each of these transitions appears at different times during the plasma expansion and cooling process. Therefore, we evaluated the change in signal in each spectral window at different times after the plasma forms, to identify the signal maximum. The evaluation of plasma conditions was developed with two different gas flows, argon and helium. To compensate for the difference in hydroxyapatite mineralization between standards and samples, and between enamel and dentin within samples, the molecular CaF LIBS signal was normalized to the atomic phosphorus signal at 214.91 nm corresponding the 3s23P3 to 3s23P2(3P)4s transition, as an internal standard. Phosphorus is a major element in hydroxyapatite matrix with calcium. Previous studies of teeth have used calcium as an internal standard. However, calcium was precluded as an internal standard in this study because it is involved in the molecular reaction measured (formation of CaF) and therefore signal may vary in relation to fluoride content.LIBS signal intensity is dependent on the laser wavelength, matrix composition, temporal evolution of the signal intensity and gas flow. The CaF LIBS signal has been studied with different laser wavelengths, including 266,73 532 (ref. 40) and 1064.51,74 The plasma condition and its evolution in time has been studied under different gas flows; as helium, argon or air; and using different substrates.75–77 The CaF molecular formation has also been studied under helium,40,73,78 argon78 and air gas flows.51,74,78 However, the effect of using 266 nm laser and different gas flows on the CaF LIBS molecular signal from a tooth substrate has not been studied. For all LIBS optimization experiments, the laser spot size and energy were constant at 100 μm and 8 mJ. Fig. 2 shows the CaF signal change at 530 nm, under an argon flow of 1 L min−1, when maintaining constant gate width at 50 μs, while modifying the gate delay between 5 to 130 μs. In this case, the CaF signal decayed from 5 μs up 40 μs with no emission collected after that time. At 20 μs gate delay, the accumulated signal is more precise compared to earlier plasma formation times (5–10 μs). In addition, at 20 μs there is less overlap from the calcium atomic emission on the CaF region, as is show in Fig. 2b. Maintaining constant the gate delay at 20 μs was then tested, while the gate width was modified between 10 to 100 μs, as is show in Fig. 2c. The CaF signal increased, reaching a maximum at 70 μs gate width before plateauing. This experiment was repeated using a helium flow of 1 L min−1 under the same spectral window at 530 nm. Fig. 3a shows the CaF signal change when maintaining constant the gate width at 50 μs and increasing the gate delay from 5 to 27.5 μs. In this case, the CaF signal decayed from 5 μs to 17.5 μs with no emission collected after that time. The timing of 10 μs showed a considerable amount of emission signal with more precision, compared to the earlier plasma formation times. In addition, as is show in Fig. 3b, there is no overlap from the atomic Ca signal with the CaF emission over the tested range. Maintaining the gate delay constant at 10 μs, the gate width was then tested between 10 to 100 μs. Fig. 3c shows the CaF signal increasing and reaching a maximum at 30 μs.
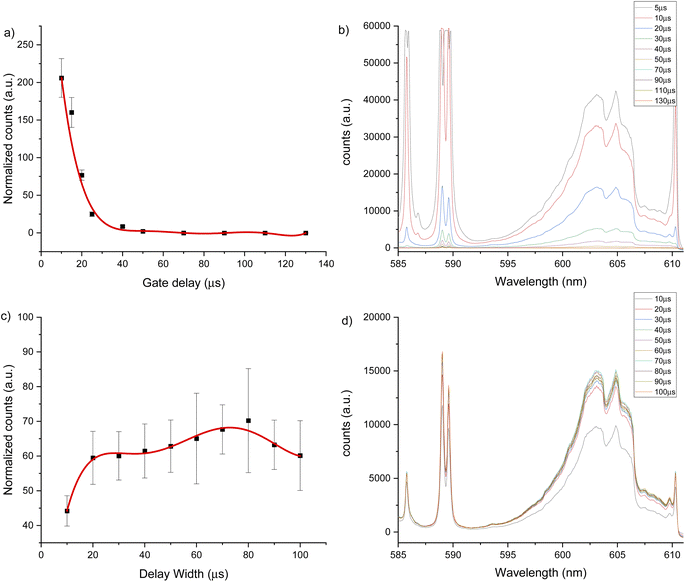
The same experiments were carried out for the 600 nm spectral window under an argon flow of 1 L min−1, optimal parameters of 10 μs gate delay and 70 μs gate width were identified (see Fig. 4). Under a helium flow of 1 L min−1, optimal parameters of 7.5 μs gate delay and 60 μs gate width were identified (Fig. 5). Overall, there was less overlap from calcium atomic emission in the 600 nm spectral window compared to the CaF emission at 530 nm. However, in this range there is a CaO band that can interfere with the CaF emission bands. For argon and helium gas flows, this band is small due the reduced oxygen content in the chamber. In addition, as Aguilera et al. studied in uranium targets,76 the faster decay of CaF signal occurs with a helium flow, and the highest and longer signal for CaF was obtained in argon at atmospheric pressure.
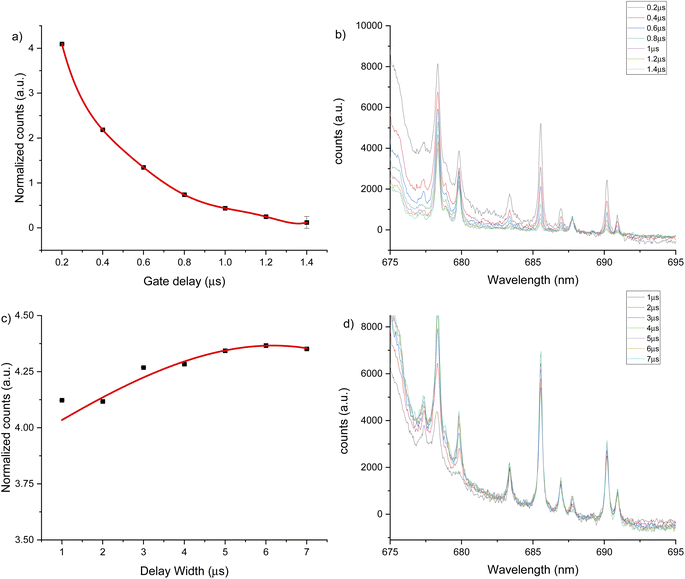
The third spectral region analyzed was around 685 nm, where the atomic emission from fluorine is observed (see Fig. 6). This emission could only be measured in helium flow of 1 L min−1, as no emission signal was observed under an argon gas flow. The optimal conditions were identified as 0.2 μs gate delay and 6 μs gate width. Fig. 6b shows a background tail for short gate delays between 675 to 690 nm. The optimized parameters for each spectral window and atmosphere are summarized in Table 1.
| Spectral window | Gas flow | Gate delay (μs) | Gate width (μs) |
|---|---|---|---|
| 530 nm | Ar | 20 | 70 |
| He | 10 | 30 | |
| 600 nm | Ar | 10 | 70 |
| He | 7.5 | 60 | |
| 685 nm | He | 0.2 | 6 |
3.2 Calibration curve and standard homogeneity
With the spectrometer conditions optimized, a calibration curve over the range of 0 to 450 μg g−1 was built for each spectral window. The laser energy was increased to 12 mJ and the ICCD gain factor adjusted to 65 for optimal recording of signal between the blank and the most concentrated standard material without signal saturation of the detector. However, this was only applied for the calibration curve under argon gas flow in 530 and 600 nm spectral windows. No signal was detected below 450 μg g−1 for the same spectral windows under helium gas flow. Fig. 7 show the calibration curves for the green and orange CaF emission, as well as for atomic fluorine emission and figures of merit are reported in Table 2. We note that the curves do not cross through the origin. This is due to residual interference from CaOH (green band) and CaO (orange band) band tailing that could not be completely removed with baseline adjustment. However, this does not affect the linear range of the calibration curve. The calibration curve with a high coefficient of determination and lowest LOD was obtained using the spectral region at 530 nm under argon gas flow (see Table 2). The LOD was obtained using the confidence limits as explained by Mermet79 as a derivation from the calibration curve and a second method using the definition based on 3σ from the blank signal. The optimal parameters for fluoride determination in a hydroxyapatite matrix were determined to be using the 530 nm spectral window under an argon gas flow. | ||
| Fig. 7 Calibration curve for CaF LIBS signal under argon gas flow for three different spectral windows, (a) 530 nm, (b) 600 nm and (c) 689 nm. | ||
| LIBS condition | R 2 | CL LODa (μg g−1) | 3σ LODb (μg g−1) | Reference LOD (μg g−1) |
|---|---|---|---|---|
| a LOD values obtained by confidence limits. b LOD values obtained by 3σ from the blank signal. | ||||
| 530 nm CaF, Ar | 0.9719 | 18 | 22 | 49 (ref. 51) |
| 120 (ref. 40) | ||||
| 600 nm CaF, Ar | 0.9422 | 48 | 44 | 65 (ref. 40) |
| 685 nm, He | 0.9878 | 31 | 80 | 135 (ref. 33) |
| 150 (ref. 40) | ||||
3.3 Rat teeth imaging application
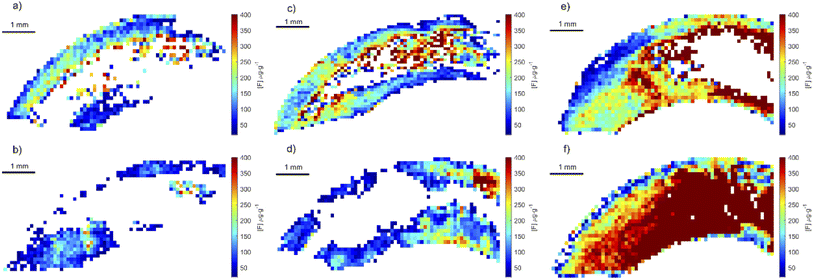
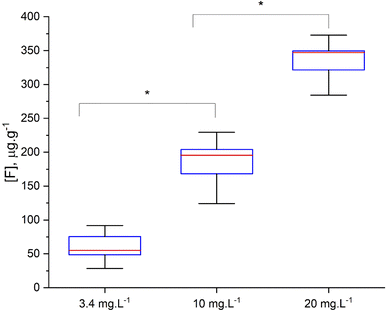
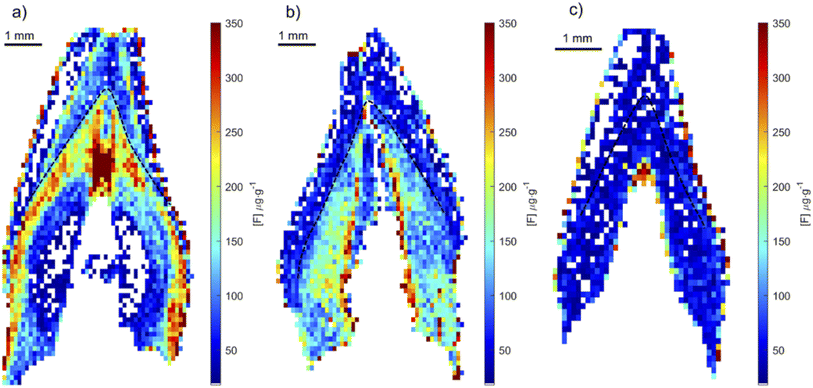
Using the optimized parameters (spectral window at 530 nm, under argon gas flow) a set of teeth from rats exposed to fluoride through water, were analyzed. The crown of upper central incisors were imaged using adjacent laser raster lines (no gap between lines) with a distance between laser shots of 100 μm. CaF signal was converted to F concentration using the calibration curve built using the doped hydroxyapatite standards. Fig. 8 includes example images of rat teeth from the different exposure groups. In each map, pixels with concentrations below 18 μg g−1 were assigned white (below LOD). Average tooth concentration was calculated from all pixels above the LOD per tooth and are presented as a box plot across exposure groups in Fig. 9. The tooth-fluoride concentration increased with animal expose dose. Median F concentrations were 55 μg g−1 for the group exposed to 3.4 mg L−1, 200 μg g−1 for the group exposed to 10 mg L−1 and 350 μg g−1 for the group exposed to 20 mg L−1. Applying a t-test found that there are statistical differences between the group exposed to 3.4 mg L−1 and the 10 mg L−1 (p < 0.05) and observing the same with the group of 10 mg L−1 and 20 mg L−1 (p < 0.05). Interestingly, the doubling of the exposure dose was directly reflected in a near doubling of tooth-fluoride. This suggests a rapid incorporation of fluoride in the hydroxyapatite tooth structure when the rat is exposed to fluoride source.3.4 Human teeth imaging application
To test whether the developed method could determine fluoride in human teeth, we applied the optimized method to teeth collected from children residing in areas with and without fluoridated water. Human teeth were analyzed using the same condition as that for the rat teeth. In each map, any pixels with concentrations below 18 μg g−1 were assigned white and not included in average calculations. Images of fluoride distribution are presented in Fig. 10. Higher fluoride concentrations were measured in teeth from CARES and VIVA samples, around 300 and 200 μg g−1 respectively. These teeth were collected from locations with fluoridated water systems, compared to a tooth from PHIME, a location without a fluorinated water system, with fluoride concentrations around 50 μg g−1. Of note, the distribution of fluoride in samples from fluoridated areas show variation in exposure that likely reflect changes in pre- and post-natal exposure sources. Fig. 10a shows the highest concentration of fluoride just after birth, and then a postnatal decline, whereas Fig. 10b shows a sustained increase in fluoride after birth. These results show that it is possible to obtain quantitative fluoride images from teeth, animal or human. Future studies will investigate the use of tooth-fluoride as a biomarker of fluoride exposure in humans. Such a biomarker could be used to study the effects of fluoride exposure and its correlation with health outcomes. These open new opportunities for future epidemiology studies.4 Conclusion
The use of CaF molecular emission bands for the quantitative imaging of fluoride in teeth by LIBS were evaluated successfully. In addition, the effect of the gas flow in the CaF formation using 266 nm laser has an important effect, showing that an Ar gas flow is the best condition for this. Using hydroxyapatite sintered pellets standard material doped with fluoride the calibration curve for the Green bands in 530 nm region show a good liner behavior and the lower LOD for fluoride in calcified material such as teeth, 18 μg g−1. Under these conditions, it was possible to obtain quantitative rat teeth maps from an animal model of fluoride exposure. Moreover, these maps reveal that the fluoride exposure has a proportional effect on the amount of fluoride in the tooth structure; that is, we showed a dose-response relationship between exposure and tooth concentrations. Finally, the same method was applied to teeth collected from children residing in areas with and without fluoridated water showing that children exposed to fluoridated water have a high accumulation of fluoride after birth and the non-fluoridated water show low levels of the halogenate ion in its structure. This presents an opportunity to evaluate how fluoride exposure could affect health in children.Conflicts of interest
There are no conflicts to declare.Acknowledgements
This work was financially supported by the National Institute of Environmental Health Sciences (P30ES023515, U2C ES026561 and R35 ES030435) and the Eunice Kennedy Shriver National Institute of Child Health and Human Development (R00 HD087523).References
- C. Chemical Rubber, CRC Handb. Chem. Phys., 1978 Search PubMed.
- F. A. Cotton and G. Wilkinson, Advanced Inorganic Chemistry, John Wiley & Sons, Inc., 1980 Search PubMed.
- J. A. Arancibia, A. Rullo, A. C. Olivieri, S. D. Nezio, M. Pistonesi, A. Lista and B. S. F. Band, Anal. Chim. Acta, 2004, 512, 157–163 CrossRef CAS.
- Z. Barghouthi and S. Amereih, Int. J. Environ. Anal. Chem., 2013, 93, 565–577 CrossRef CAS.
- WHO, Fluoride in Drinking-Water, IWA Publishing, London, 2006 Search PubMed.
- USDOHAH. Services, Toxicologial Profile for Fluorides, Hydrogen Fluoride, and Fluorine, 2003 Search PubMed.
- A. Meenakshi and R. C. Maheshwari, J. Hazard. Mater., 2006, 137, 456–463 CrossRef PubMed.
- H. Kabir, A. K. Gupta and S. Tripathy, Crit. Rev. Environ. Sci. Technol., 2019, 50, 1116–1193 CrossRef.
- S. J. Kashyap, R. Sankannavar and G. M. Madhu, J. Hazard. Mater. Lett., 2021, 2, 1–8 Search PubMed.
- CDC, Water Fluoridation Data & Statistics, Centers for Disease Control and Prevention, 2016 Search PubMed.
- D. B. Thomas, N. Basu, E. A. Martinez-Mier, B. N. Sanchez, Z. Zhang, Y. Liu, R. P. Parajuli, K. Peterson, A. Mercado-Garcia, M. Bashash, M. Hernandez-Avila, H. Hu and M. M. Tellez-Rojo, Environ. Res., 2016, 150, 489–495 CrossRef CAS PubMed.
- J. D. Ringe, in Nutrition and Bone Health, ed. M. F. Holick and B. Dawson-Hughes, Humana Press, Totowa, NJ, 2004, DOI:10.1007/978-1-59259-740-6_21, pp. 345–362.
- D. Teruel Jde, A. Alcolea, A. Hernandez and A. J. Ruiz, Arch. Oral Biol., 2015, 60, 768–775 CrossRef PubMed.
- J. A. Weatherell, C. Robinson and A. S. Hallsworth, J. Dent. Res., 1974, 53, 180–192 CrossRef CAS PubMed.
- L. C. Chow, J. Dent. Res., 1990, 69, 595–600 CrossRef CAS PubMed.
- E. Kalisinska, I. Bosiacka-Baranowska, N. Lanocha, D. Kosik-Bogacka, K. Krolaczyk, A. Wilk, K. Kavetska, H. Budis, I. Gutowska and D. Chlubek, Environ. Geochem. Health, 2014, 36, 1063–1077 CrossRef CAS PubMed.
- S. Baconnier, S. B. Lang, M. Polomska, B. Hilczer, G. Berkovic and G. Meshulam, Bioelectromagnetics, 2002, 23, 488–495 CrossRef CAS PubMed.
- A. J. Malin, C. Lesseur, S. A. Busgang, P. Curtin, R. O. Wright and A. P. Sanders, Environ. Int., 2019, 132, 105012 CrossRef CAS PubMed.
- R. W. Dharmaratne, Hum. Exp. Toxicol., 2019, 38, 269–279 CrossRef CAS PubMed.
- G. Tarsoly, M. Óvári and G. Záray, Spectrochim. Acta, Part B, 2010, 65, 287–290 CrossRef.
- A. P. G. F. Vieira, R. Hancock, H. Limeback, R. Maia and M. D. Grynpas, J. Dent. Res., 2004, 83, 76–80 CrossRef CAS PubMed.
- R. W. Dharmaratne, Environ. Health Prev. Med., 2015, 20, 237–242 CrossRef CAS PubMed.
- S. Guth, S. Huser, A. Roth, G. Degen, P. Diel, K. Edlund, G. Eisenbrand, K. H. Engel, B. Epe, T. Grune, V. Heinz, T. Henle, H. U. Humpf, H. Jager, H. G. Joost, S. E. Kulling, A. Lampen, A. Mally, R. Marchan, D. Marko, E. Muhle, M. A. Nitsche, E. Rohrdanz, R. Stadler, C. van Thriel, S. Vieths, R. F. Vogel, E. Wascher, C. Watzl, U. Nothlings and J. G. Hengstler, Arch. Toxicol., 2020, 94, 1375–1415 CrossRef CAS PubMed.
- Y. P. Reddy, S. K. Tiwari, A. P. Shaik, A. Alsaeed, A. Sultana and P. K. Reddy, Toxicol. Mech. Methods, 2014, 24, 31–36 CrossRef CAS PubMed.
- S. Zulfiqar, H. Ajaz, S. u. Rehman, S. Elahi, A. Shakeel, F. Yasmeen and S. Altaf, Open Chem., 2020, 18, 119–128 CAS.
- A. J. Malin, J. Riddell, H. McCague and C. Till, Environ. Int., 2018, 121, 667–674 CrossRef CAS PubMed.
- Z. Kheradpisheh, M. Mirzaei, A. H. Mahvi, M. Mokhtari, R. Azizi, H. Fallahzadeh and M. H. Ehrampoush, Sci. Rep., 2018, 8, 2674 CrossRef PubMed.
- ASTM-D1179-16, ASTM International, 2016, DOI:10.1520/D1179-16.
- Government-of-Canada, Page 3: Guidelines for Canadian DrinkingWater Quality: Guideline Technical Document—Fluoride. Part II. Science and Technical Considerations, https://www.canada.ca/en/health-canada/services/publications/healthy-living/guidelines-canadian-drinking-water-quality-guideline-technical-document-fluoride/page-3-guidelines-canadian-drinking-water-quality-guideline-technical-document-fluoride.html Search PubMed.
- ASTM-D4327-97, ASTM International, 1991, DOI:10.1520/D4327-97.
- Y. Zhu, K. Nakano and Y. Shikamori, Anal. Sci., 2017, 33, 1279–1284 CrossRef CAS PubMed.
- N. L. A. Jamari, J. F. Dohmann, A. Raab, E. M. Krupp and J. Feldmann, J. Anal. At. Spectrom., 2017, 32, 942–950 RSC.
- C. D. Quarles, J. J. Gonzalez, L. J. East, J. H. Yoo, M. Morey and R. E. Russo, J. Anal. At. Spectrom., 2014, 29, 1238–1242 RSC.
- G. Asimellis, S. Hamilton, A. Giannoudakos and M. Kompitsas, Spectrochim. Acta, Part B, 2005, 60, 1132–1139 CrossRef.
- M. F. Gazulla, M. Rodrigo, M. Orduña and M. J. Ventura, Glass Technol.: Eur. J. Glass Sci. Technol. A, 2015, 56, 95–101 Search PubMed.
- K. Okuyama, H. Komatsu, H. Yamamoto, P. N. R. Pereira, A. K. Bedran-Russo, M. Nomachi, T. Sato and H. Sano, Nucl. Instrum. Methods Phys. Res. B, 2011, 269, 2269–2273 CrossRef CAS.
- A. R. Borges, L. L. François, B. Welz, E. Carasek and M. G. R. Vale, J. Anal. At. Spectrom., 2014, 29, 1564–1569 RSC.
- S. Mores, G. C. Monteiro, S. Santos Fda, E. Carasek and B. Welz, Talanta, 2011, 85, 2681–2685 CrossRef CAS PubMed.
- N. Ozbek and S. Akman, Food Chem., 2016, 211, 180–184 CrossRef CAS PubMed.
- P. Pořízka, S. Kaski, A. Hrdlička, P. Modlitbová, L. Sládková, H. Häkkänen, D. Prochazka, J. Novotný, P. Gadas, L. Čelko, K. Novotný and J. Kaiser, J. Anal. At. Spectrom., 2017, 32, 1966–1974 RSC.
- S. Datta, Proc. R. Soc. London, Ser. A, 1921, 99, 436 Search PubMed.
- C. Fabry, Astrophys. J., 1905, 21, 356–367 CrossRef.
- R. C. Johnson and T. R. Merton, Proc. R. Soc. London, Ser. A, 1929, 122, 161–188 CAS.
- H. Gleisner, J. W. Einax, S. Mores, B. Welz and E. Carasek, J. Pharm. Biomed. Anal., 2011, 54, 1040–1046 CrossRef CAS PubMed.
- É. L. de Moraes Flores, J. S. Barin, É. M. de Moraes Flores and V. L. Dressler, Spectrochim. Acta, Part B, 2007, 62, 918–923 CrossRef.
- W. Boschetti, M. B. Dessuy, A. H. Pizzato and M. G. R. Vale, Microchem. J., 2017, 130, 276–280 CrossRef CAS.
- W. Q. Lei, Q. L. Ma, V. Motto-Ros, X. S. Bai, L. J. Zheng, H. P. Zeng and J. Yu, Spectrochim. Acta, Part B, 2012, 73, 7–12 CrossRef CAS.
- M. Gaft, L. Nagli, N. Eliezer, Y. Groisman and O. Forni, Spectrochim. Acta, Part B, 2014, 98, 39–47 CrossRef CAS.
- O. Forni, M. Gaft, M. J. Toplis, S. M. Clegg, S. Maurice, R. C. Wiens, N. Mangold, O. Gasnault, V. Sautter, S. Le Mouélic, P.-Y. Meslin, M. Nachon, R. E. McInroy, A. M. Ollila, A. Cousin, J. C. Bridges, N. L. Lanza and M. D. Dyar, Geophys. Res. Lett., 2015, 42, 1020–1028 CrossRef CAS.
- C. Álvarez, J. Pisonero and N. Bordel, Spectrochim. Acta, Part B, 2014, 100, 123–128 CrossRef.
- C. Alvarez-Llamas, J. Pisonero and N. Bordel, J. Anal. At. Spectrom., 2017, 32, 162–166 RSC.
- C. Neff, P. Keresztes Schmidt, P. S. Garofalo, G. Schwarz and D. Günther, J. Anal. At. Spectrom., 2020, 35, 2255–2266 RSC.
- N. Mohamed, K. Rifai, S. Selmani, M. Constantin, F. R. Doucet, L. Ç. Özcan, M. Sabsabi and F. Vidal, Geostand. Geoanal. Res., 2021, 45, 539–550 CrossRef CAS.
- C. J. Greenhalgh, O. M. Voloaca, P. Shaw, A. Donard, L. M. Cole, M. R. Clench, A. J. Managh and S. L. Haywood-Small, J. Anal. At. Spectrom., 2020, 35, 2231–2238 RSC.
- S. Weiskirchen, P. Kim and R. Weiskirchen, Ann. Transl. Med., 2018, 18, 1–17 Search PubMed.
- X. Le Guevel, M. Henry, V. Motto-Ros, E. Longo, M. I. Montanez, F. Pelascini, O. de La Rochefoucauld, P. Zeitoun, J. L. Coll, V. Josserand and L. Sancey, Nanoscale, 2018, 10, 18657–18664 RSC.
- C. Austin, C. Richardson, D. Smith and M. Arora, Environ. Res., 2017, 155, 373–379 CrossRef CAS PubMed.
- H. Morishita and M. Arora, Trends Neurosci., 2017, 40, 1–3 CrossRef CAS PubMed.
- P. Curtin, C. Austin, A. Curtin, C. Gennings, M. Arora, K. Tammimies, C. Willfors, S. Berggren, P. Siper, D. Rai, K. Meyering, A. Kolevzon, J. Mollon, A. S. David, G. Lewis, S. Zammit, L. Heilbrun, R. F. Palmer, R. O. Wright, S. Bölte and A. Reichenberg, Sci. Adv., 2018, 4, eaat1293 CrossRef PubMed.
- B. Claus Henn, C. Austin, B. A. Coull, L. Schnaas, C. Gennings, M. K. Horton, M. Hernandez-Avila, H. Hu, M. M. Tellez-Rojo, R. O. Wright and M. Arora, Environ. Res., 2018, 161, 588–598 CrossRef CAS PubMed.
- A. M. Mora, M. Arora, K. G. Harley, K. Kogut, K. Parra, D. Hernandez-Bonilla, R. B. Gunier, A. Bradman, D. R. Smith and B. Eskenazi, Environ. Int., 2015, 84, 39–54 CrossRef CAS PubMed.
- M. R. Schurr, J. Archaeol. Sci., 1989, 16, 265–270 CrossRef.
- T. T. Thuy, H. Nakagaki, N. T. Thanh Ha, I. Morita, M. Tatematsu, H. Anh Lan, H. T. Hung and C. Robinson, Arch. Oral Biol., 2003, 48, 369–376 CrossRef CAS PubMed.
- K. Takeuchi, H. Nakagaki, Y. Toyama, N. Kimata, F. Ito, C. Robinson, J. A. Weatherell, L. Stösser and W. Künzel, Caries Res., 1996, 30, 76–82 CrossRef CAS PubMed.
- H. Yamamoto, M. Nomachi, K. Yasuda, Y. Iwami, S. Ebisu, N. Yamamoto, T. Sakai and T. Kamiya, Nucl. Instrum. Methods Phys. Res. B, 2003, 210, 388–394 CrossRef CAS.
- M. Martinez, C. Bayne, D. Aiello, M. Julian, R. Gaume and M. Baudelet, Spectrochim. Acta, Part B, 2019, 159, 105650 CrossRef CAS.
- E. N. Haynes, C. Beidler, R. Wittberg, L. Meloncon, M. Parin, E. J. Kopras, P. Succop and K. N. Dietrich, Environ. Health Perspect., 2011, 119, 1364–1372 CrossRef PubMed.
- E. N. Haynes, H. Sucharew, P. Kuhnell, J. Alden, M. Barnas, R. O. Wright, P. J. Parsons, K. M. Aldous, M. L. Praamsma, C. Beidler and K. N. Dietrich, Environ. Health Perspect., 2015, 123, 1066–1071 CrossRef CAS PubMed.
- E. N. Haynes, H. Sucharew, T. J. Hilbert, P. Kuhnell, A. Spencer, N. C. Newman, R. Burns, R. Wright, P. J. Parsons and K. N. Dietrich, Neurotoxicology, 2018, 64, 94–102 CrossRef CAS PubMed.
- K. V. Martin, H. Sucharew, K. N. Dietrich, P. J. Parsons, C. D. Palmer, R. Wright, C. Amarasiriwardena, D. R. Smith and E. N. Haynes, Environ. Res., 2021, 202, 111644 CrossRef CAS PubMed.
- J. A. Bauer, R. F. White, B. A. Coull, C. Austin, M. Oppini, S. Zoni, C. Fedrighi, G. Cagna, D. Placidi, S. Guazzetti, Q. Yang, D. C. Bellinger, T. F. Webster, R. O. Wright, D. Smith, M. Horton, R. G. Lucchini, M. Arora and B. Claus Henn, Neurotoxicology, 2021, 87, 51–61 CrossRef CAS PubMed.
- E. Oken, A. A. Baccarelli, D. R. Gold, K. P. Kleinman, A. A. Litonjua, D. De Meo, J. W. Rich-Edwards, S. L. Rifas-Shiman, S. Sagiv, E. M. Taveras, S. T. Weiss, M. B. Belfort, H. H. Burris, C. A. Camargo, Jr., S. Y. Huh, C. Mantzoros, M. G. Parker and M. W. Gillman, Int. J. Epidemiol., 2015, 44, 37–48 CrossRef PubMed.
- M. Weiss, Z. Gajarska, H. Lohninger, M. Marchetti-Deschmann, G. Ramer, B. Lendl and A. Limbeck, Anal. Chim. Acta, 2022, 1195 Search PubMed.
- C. Alvarez-Llamas, J. Pisonero and N. Bordel, Spectrochim. Acta, Part B, 2016, 123, 157–162 CrossRef CAS.
- M. S. Dawood, A. Hamdan and J. Margot, AIP Adv., 2015, 5, 1–11 Search PubMed.
- D. Zhang, X. Ma, S. Wang and X. Zhu, Plasma Sci. Technol., 2015, 17, 971–974 CrossRef CAS.
- J. A. Aguilera and C. Aragón, Appl. Phys. A, 1999, 69, S475–S478 CrossRef CAS.
- N. Bordel, L. J. Fernández-Menéndez, C. Méndez-López, C. González-Gago and J. Pisonero, Plasma Phys. Controlled Fusion, 2022, 64, 1–13 Search PubMed.
- J.-M. Mermet, Spectrochim. Acta, Part B, 2008, 63, 166–182 CrossRef.
| This journal is © The Royal Society of Chemistry 2023 |

