DOI:
10.1039/D1NH00501D
(Communication)
Nanoscale Horiz., 2022,
7, 255-266
Interlink among catalyst loading, transport and performance of proton exchange membrane fuel cells: a pore-scale study
Received
21st September 2021
, Accepted 24th December 2021
First published on 17th January 2022
Abstract
An optimum balance between performance and Pt loading is critically important for the commercialization of proton exchange membrane (PEM) fuel cells. This research aims to investigate the interlink among Pt loading, reactive transport, and performance. An advanced pore-scale model is developed to describe the coupled reactive transport in the catalyst layer (CL) with the reactant gas, protons, and electrons all considered. The CL microstructure is stochastically reconstructed as a computational domain, and the physicochemical phenomena inside CLs are resolved by a multi-component lattice Boltzmann (LB) model. The results show that the electronic potential drop is not sensitive to Pt loading, while the ionic potential drop is much higher. The distributions of local overpotential and the reaction rate are similar with peak values near the membrane, indicating the importance of proton conduction. A high Pt loading could decrease the local transport loss for a shorter path to catalyst sites, but increases the overall transport resistance for a thicker structure. Although a larger electrochemical surface area (ECSA) is provided under a high Pt loading, a low Pt loading (0.1 mg cm−2) is suggested for high current conditions (2 A cm−2) where the transport loss is the main factor restricting the performance.
New concepts
A fundamental understanding of the interlink among catalyst loading, reactive transport and performance is the key for the commercialization of proton exchange membrane fuel cells. In this regard, a pore-scale model has been widely applied to resolve the physicochemical phenomena in the microstructure of the catalyst layer (CL). However, the conduction of protons and electrons has been mostly neglected in previous studies for the issue of the time-scale gap, which significantly affects the simulation reliability. In this work, a lattice-Boltzmann-based pore-scale model is proposed to comprehensively describe the coupled reactive transport in reconstructed CLs with the reactant gas, protons, and electrons all considered. The multiple-relaxation-time operator is used to ensure the model stability and solve the diffusivity gap issue. The simulation results demonstrate that the electronic potential drop is insensitive to Pt loading, while the ionic potential drop is sensitive. Distributions of local overpotential and the reaction rate are similar with peak values near the membrane, indicating the importance of proton conduction. A low Pt loading is suggested for high current conditions where the transport loss is the main factor restricting the performance. The proposed model can also be applied to find the optimum catalyst loading under different conditions for cost reduction.
|
1. Introduction
Hydrogen energy is the key for the energy transition1 and proton exchange membrane (PEM) fuel cells are recognized as the most promising hydrogen energy transition devices due to the advantages of a low operating temperature, a fast response, and a high power density.2 In the cathode catalyst layer (CL) of PEM fuel cells, the inherently sluggish electrochemical reaction must be activated by a catalyst to achieve high performance.3 Platinum (Pt)4 is currently the most popular commercial catalyst for PEM fuel cells and accounts for around 40% of the cost in the industrial production.5 For the widespread commercialization of PEM fuel cells, it is critically important to balance their performance and cost,6 which relies on a fundamental understanding of the interlink among Pt loading, reactive transport, and performance.
Many experiments have been conducted in this regard and reported in the literature.7–9 Choo et al.7 revealed that a low Pt loading will cause high local transport resistance and explored operational strategies and cathode design to mitigate the local transport resistance. Due to the poor durability under low Pt loading conditions, Yu et al.8 investigated CLs with gradient Pt loadings and found that the gradient design could improve the durability. Rao et al.9 studied the oxygen reduction activity under low Pt loadings and found that the decrease of electrochemical surface area (ECSA) significantly affects the performance. Although valuable insights have been achieved in these studies, the state-of-the-art experimental techniques are limited by spatial and temporal resolution, and can hardly observe the physical fields in the complex microstructure and many mechanisms are still unknown. To obtain an in-depth insight on the Pt loading optimization, numerical modeling has become a complementary approach to remedy these issues.
The CL is a porous medium composed of carbon aggregates, Pt particles, and an ionomer.10 Pt particles are nanostructured electrocatalysts11 embedded in a carbon support,4 and the carbon covered by the ionomer agglomerates to form the bone structure of the CL.12 The structural design of the CL is of great importance for the performance of PEM fuel cells.13 Based on the literature, CL modeling methods can be categorized into thin film models,14 homogeneous models,15 agglomerate models,16 pore-scale models17 and molecular dynamics models.18 With a focus on the structural effect on performance, the pore-scale modeling method has become a trending method to resolve the physicochemical phenomena in the complex microstructure.19–22 The mesoscale numerical tool, namely, the lattice Boltzmann method (LBM), is mostly applied to model coupled transport processes due to its advantages in implementing boundary conditions and parallel computing. Using the pore-scale model, Chen et al.23 studied the pore-scale structure and transport coefficients of CLs and found that Knudsen diffusion cannot be ignored due to its significant impact on transport resistance. Deng et al.24 analyzed the effects of the structural parameters on the catalyst activity in CLs. The results indicated that optimizing the carbon morphology could ensure more effective transport. Hou et al.25 discussed the effects of the I/C ratio and Pt/C ratio on the performance of PEM fuel cells and proposed a novel CL design to improve the performance by reducing the reactant transport loss. Mu et al.26 studied the local transport resistance of the reactant gas in CLs and extended the single-component LB model to the multi-component model by further considering the proton conduction.
In previous studies, the attention is mostly placed on the transport of the reactant gas, while the conduction of protons and electrons is mostly neglected, which could affect the distribution of overpotential and the reaction rate. In this work, an advanced pore-scale model is developed, which can give a comprehensive description of the reactive transport phenomena in stochastically reconstructed CLs. Besides the reactant transport, the conduction of electrons and protons is further addressed in this work and the potential distribution can thus be obtained. The impact of Pt loading on performance is investigated in terms of the reactant distribution, potential distribution, and local reaction rate distribution. Optimum Pt loadings under different performance conditions are also discussed.
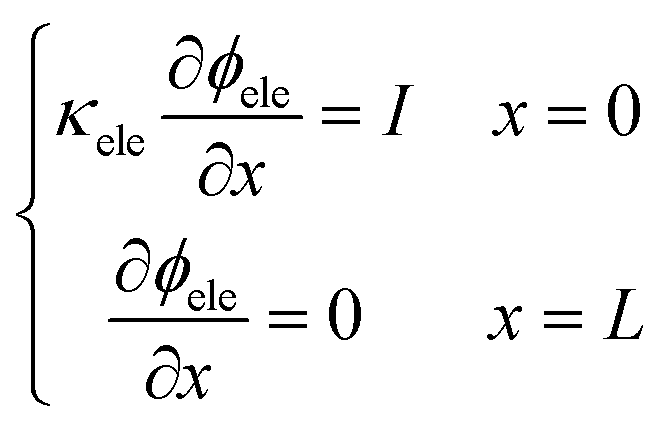
2. Model development
2.1 Catalyst layer reconstruction
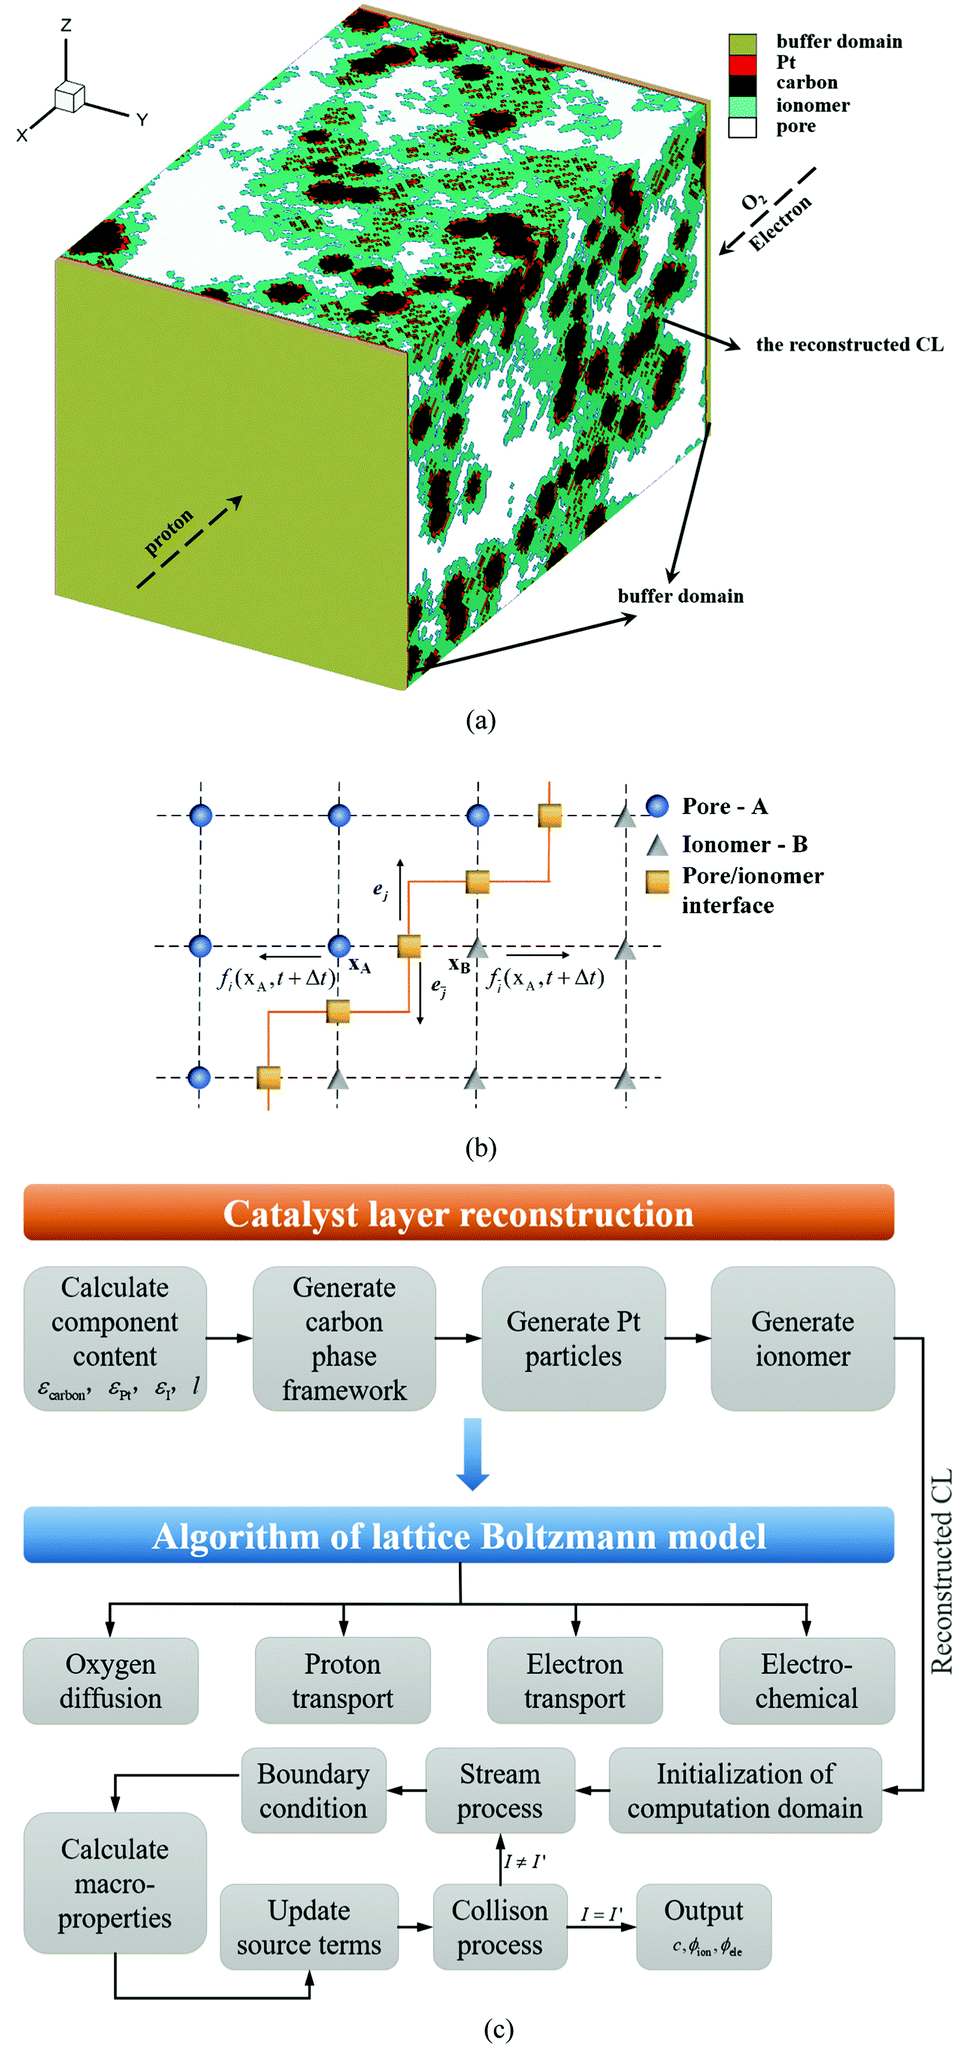
In this work, the CL microstructure is reconstructed as a complex porous medium composed of pores, a carbon support, Pt particles, and an ionomer with a process-based stochastic algorithm. As shown in Fig. 1a, the CL reconstruction algorithm includes three processes which are generating carbon aggregation, Pt, and the ionomer, respectively. With a balance between the grid number and numerical resources, the resolution of the reconstructed CL is set as 5 nm per lattice unit, and the grid volume can just fit a Pt particle. The reconstruction algorithm is similar to our previous studies,24,25 which is given as follows.
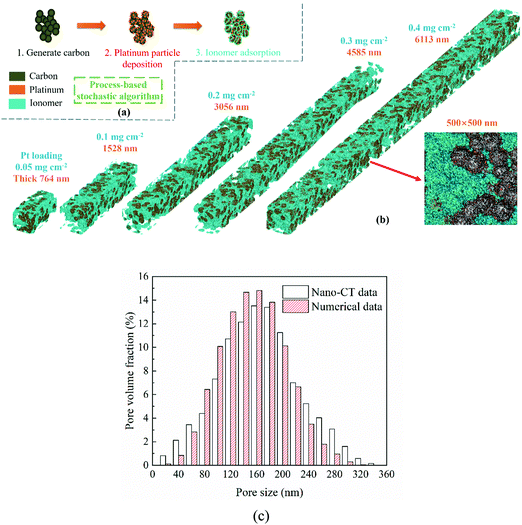 |
| | Fig. 1 (a) Schematic of catalyst layer reconstruction; (b) reconstructed catalyst layers under different Pt loadings (porosity = 0.4, Pt/C ratio = 0.6, and I/C ratio = 0.6); (c) comparison of the pore size distribution between reconstructed CCL and nano-CT data.29 | |
2.1.1 Calculation of the content of each component of the catalyst layer.
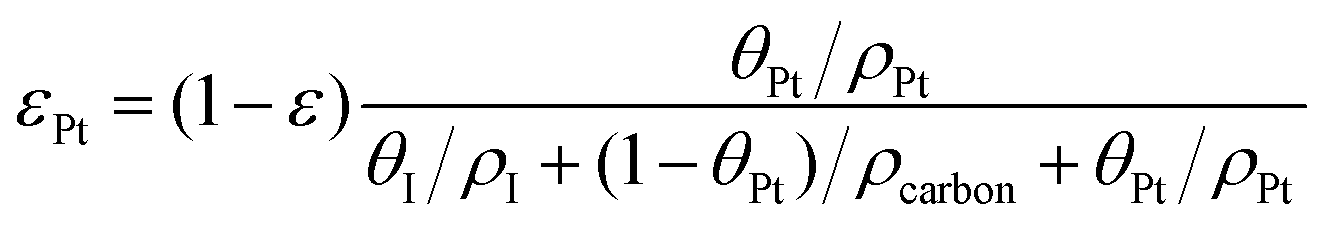
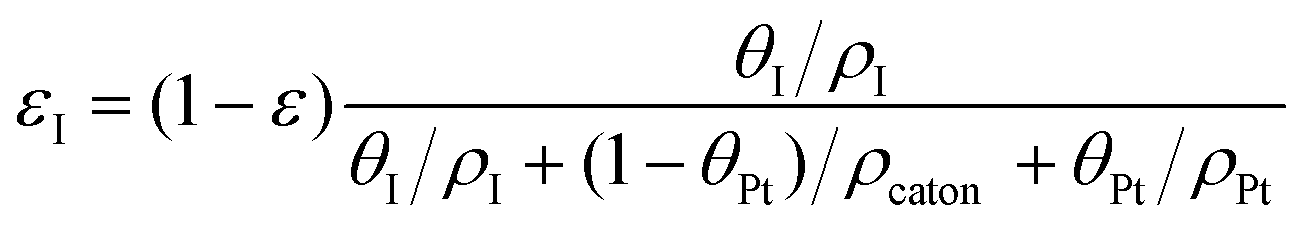
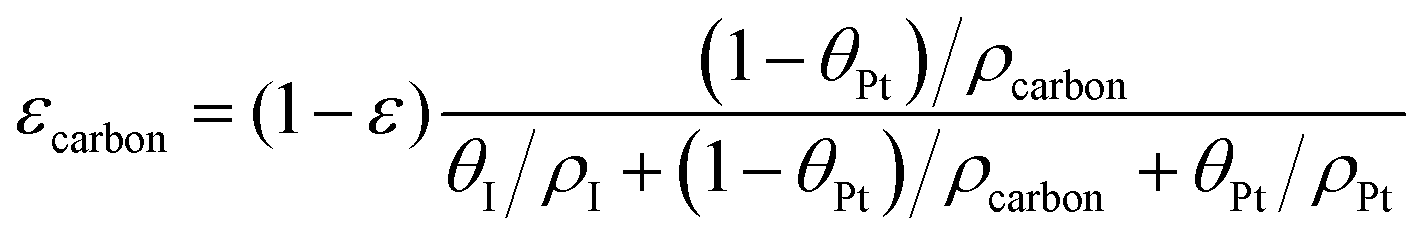
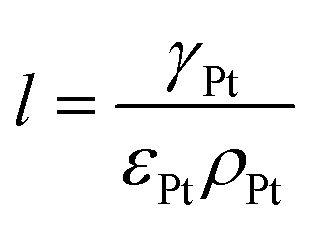
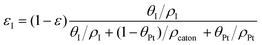
The volume fraction of each ingredient can be calculated based on the CL production parameters,27 namely the Pt/C ratio θPt and the I/C ratio θI.| | 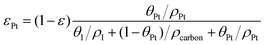 | (1) |
| |  | (2) |
| |  | (3) |
| |  | (4) |
where ρcarbon, ρPt, and ρI are the densities of carbon, Pt, and the ionomer, respectively. ε, εPt, εI, and εcarbon are the porosity and the volume fractions of Pt, the ionomer and carbon, respectively. γPt is the Pt loading and l is the thickness of the reconstructed CL. Table 1 gives the specific values of these structural parameters in this research. In this work, Pt loadings of 0.05, 0.1, 0.2, 0.3 and 0.4 mg cm−2 are applied for reconstruction.
Table 1 Parameter values in this work
| Parameter |
Symbol |
Value |
Unit |
| Carbon density |
ρ
carbon
|
1800 |
mg cm−3 |
| Pt density |
ρ
Pt
|
21![[thin space (1/6-em)]](https://www.rsc.org/images/entities/char_2009.gif) 450 450 |
mg cm−3 |
| Ionomer density |
ρ
I
|
2000 |
mg cm−3 |
| Porosity |
ε
|
0.4 |
— |
| Pt/C ratio |
θ
Pt
|
0.6 |
— |
| I/C ratio |
θ
I
|
0.6 |
— |
| Proton conductivity |
κ
ion
|
10 |
S m−1 |
| Electron conductivity |
κ
ele
|
5000 |
S m−1 |
| Temperature |
T
|
348.15 |
K |
| Pressure |
P
|
1.5 |
atm |
| Reference transfer current density |
i
0
|
0.015 |
A m−2 |
| Mesh interval |
δx
|
5 × 10⁻⁹ |
m |
| Time interval |
δt
|
1 × 10⁻¹⁰ |
s |
| Reaction coefficients |
α, β |
0.5, 0.5 |
— |
2.1.2 Generation of the carbon phase framework.
In this study, the morphology of the carbon support is considered as a solid sphere, which is a common assumption in the literature.23,25 The radius of the carbon support changes from 15 to 35 nm and the instruction is briefly explained as follows:
1. Around 25% of non-overlapped carbon spheres are randomly generated in the computational domain, the radii and coordinates of which are given by a random function.
2. Overlapped carbon spheres are placed one after another until the target carbon fraction is satisfied and must connect with previous carbon spheres for a continuous electron transport path. Note that the overlap rate is less than 10% in this work.
2.1.3 Generation of Pt particles.
The morphology of Pt particles is simplified as a cube whose side-length is 5 nm in this work. As Pt particles are embedded on the carbon support in the real CL sample, the Pt node must be attached to a carbon node. The detailed process is given as follows:
1. Each potential Pt node is given a random number, from 1 to 10000.
2. If the random value is lower than the critical value (15, adopted in the model), this potential node will be changed to a Pt node.
3. If not, repeat the above generation process until the target number of Pt node is satisfied.
2.1.4 Ionomer adsorption.
Since protons only are transported in the ionomer, the content and distribution of the ionomer significantly affect the proton conduction.26,28 In this algorithm, the ionomer is randomly generated and adsorbed around carbon and Pt. This algorithm works as follows:
1. Each pore node that touches a carbon, a Pt, or an ionomer node is given a random number, ranging from 1 to 3000, 1 to 100, or 1 to 30000, respectively. A narrower range is set for the Pt condition to ensure that most Pt surfaces are activated.
2. If the given value is lower than the critical value (25, adopted in the model), this potential node will be turned into an ionomer node.
3. If not, repeat the above generation process until the target number of ionomer node is satisfied.
2.1.5 Validation of the reconstructed catalyst layer.
Fig. 1b presents the 3D microstructure and 2D cross-section of reconstructed CLs, showing that the Pt loading affects the CL thickness as described in eqn (4). The proposed algorithm has been validated in this work, where the pore size distribution (PSD) and electrochemical surface area (ECSA) of the reconstructed CL are compared with the experimental data.29,30 As shown in Fig. 1c, the PSD is compared with the experimental data.29 It can be found that the numerical data agree well with the nano-CT data. The ECSA is also compared with the experimental data. The ECSA obtained through the experiment is 68–77 m2 g−1.30 The ECSA of the reconstructed CL is 77.01 m2 g−1, which agrees well with the experimental results.
Regarding the parameters of the reconstructed CLs, the porosity is assumed to be the same, i.e., 0.4, the Pt/C ratio is 0.6, and the I/C ratio is 0.6. CLs under 0.05, 0.1, 0.2, 0.3, and 0.4 mg cm−2 Pt loadings are reconstructed and their thicknesses are 764, 1528, 3056, 4585, and 6113 nm, respectively. As mentioned, the lattice resolution is 5 × 10⁻⁹ m and the time resolution is set as 1 × 10⁻¹¹ s to ensure the computational efficiency and accuracy. The height and width of the reconstructed CL are set as 500 nm, and the maximum grid number of the computational domain is up to 12220000.
2.2 Model description and numerical treatment
2.2.1 Governing equations.
This research focuses on the reactive transport of oxygen in pores and the ionomer, proton conduction in the ionomer, and electron conduction in carbon and Pt. The model assumptions are given below.
1. The cathode catalyst layer works under isothermal and steady conditions.
2. The influences of liquid water and vapor are neglected, and the ionic conductivity in the ionomer is constant.
3. The oxygen reduction reaction occurs at the ionomer/Pt interface.
The governing equations can be expressed as
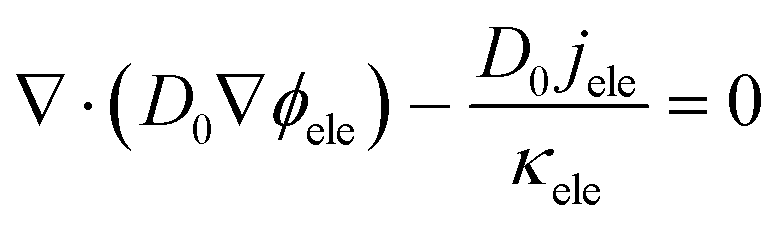
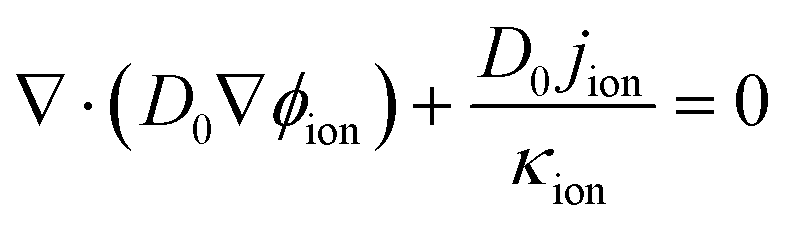
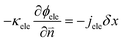
| | | ∇·(κion∇ϕion) + jion = 0 | (5) |
| | | ∇·(κele∇ϕele) − jele = 0 | (6) |
where
ϕ,
c,
κ,
Dp, and
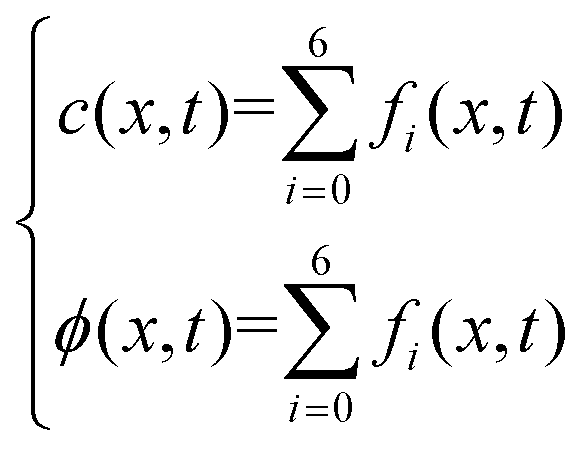
j are the potential, oxygen concentration, conductivity, oxygen diffusivity and reaction source term, respectively. The subscripts ion, ele, and oxy represent the proton, electron, and oxygen, respectively.
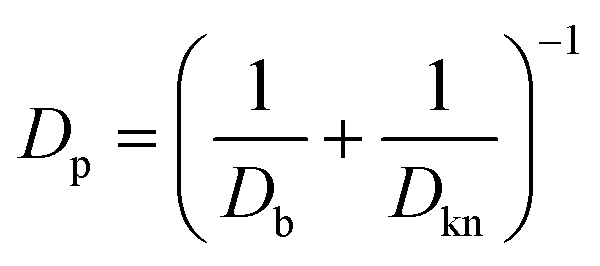
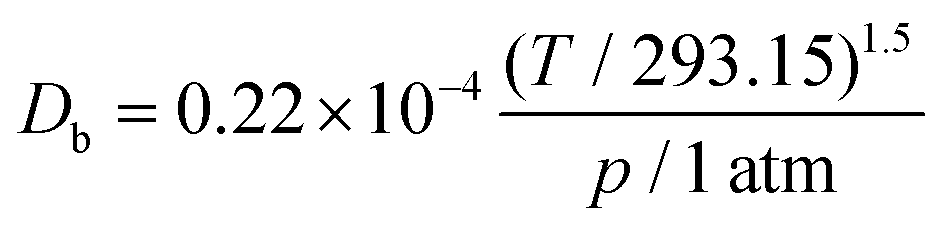
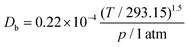
The local diffusivity of oxygen is calculated as follows; due to the nanoscale pores, Knudsen diffusion is taken into account to calculate the oxygen diffusivity Dp.
| | 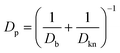 | (8) |
where
Db is the bulk diffusivity and
Dkn is Knudsen diffusivity, which are obtained by
| |  | (9) |
| | 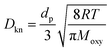 | (10) |
where
T,
p,
dp,
R, and
Moxy are the operating temperature, pressure, local pore size, universal gas constant and oxygen molecular weight, respectively. This work adopts the 13-direction averaging method to calculate the local pore size of each pore.
31
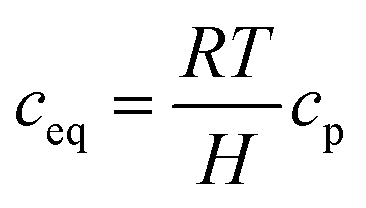
Regarding the cross-ionomer transport, oxygen is dissolved in the ionomer with the equilibrium concentration ceq obtained by Henry's law:
| |  | (11) |
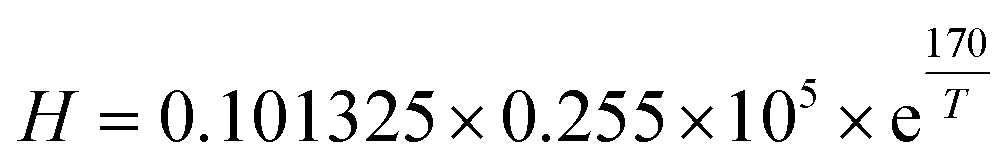
where
cp is the oxygen concentration in the pore and Henry's constant of oxygen,
H, is obtained by
32| | 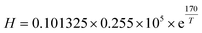 | (12) |
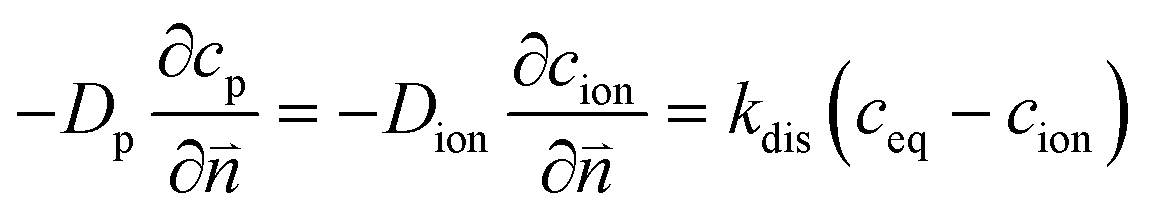
The numerical strategy for boundary conditions at the pore/ionomer interface is shown in Section 2.2.3. The dissolution rate is also considered to obtain the oxygen concentration in the ionomer,26 which is given as
| |  | (13) |
where
kdis is the oxygen dissolution rate and
Dion can be calculated as
33| | | Dion = 1.14698 × 10⁻¹⁰λ0.708 | (14) |
where
λ is the water content and simplified as a constant as explained in the assumptions. Electrochemical reactions occur at the ionomer/Pt interface and the local oxygen consumption rate can be calculated using the Butler–Volmer equation:
| | 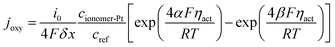 | (15) |
where
i0,
δx,
cref,
F,
ηact,
α and
β are the reference transfer current density, mesh interval, reference oxygen concentration, Faraday's constant, local overpotential of the CCL, and positive and reverse reaction coefficients, respectively. The subscript ionomer-Pt represents the reaction site and the local overpotential
ηact is obtained as
34
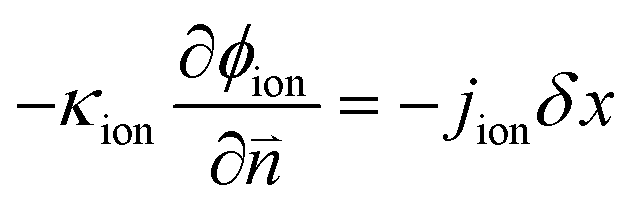
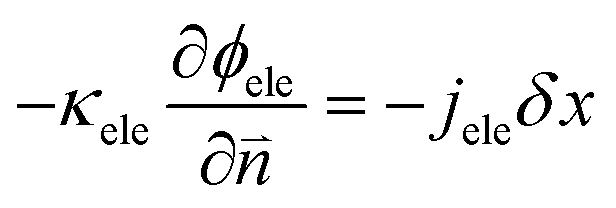
In eqn (15) and (16), cionomer-Pt, ϕion, and ϕele need to be obtained by iterative calculations. In the Pt/ionomer interfaces, the interfacial boundary conditions can be expressed as
| | 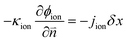 | (17) |
| |  | (18) |
The ionic and electronic consumption rates can be calculated as
Note that the electron potential is negative and when the electrons are consumed at the reaction site, the local electronic potential increases.
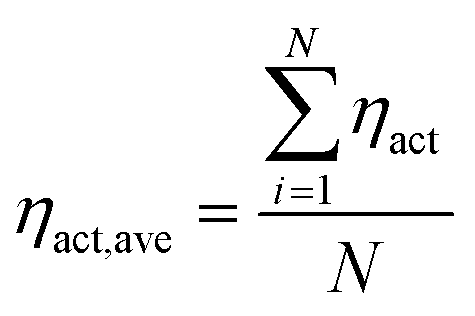
During the operation of PEM fuel cells, there are three main voltage losses including the transport loss, ohmic loss and overpotential loss. These losses determine the output voltage of the fuel cell. The local overpotential is defined as the difference between the ionic and electronic potentials. Because the local overpotential of each reaction site is different in the CL, the overall overpotential can be obtained by
| |  | (21) |
where
N is the total number of reaction sites.
2.2.2 Numerical method.
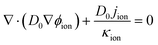
As the electron conduction is orders of magnitude faster than the reactant transport, multiple-relaxation-time (MRT) LBM is adopted to ensure the model stability. Besides, the shifting term transformation approach introduced by Mu et al.26 is also employed to mitigate the time-scale issue, which is expressed as| | 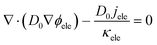 | (22) |
| |  | (23) |
where D0 is a given variable with the same order of magnitude as Dp, and its value is set as 1 × 10⁻⁵ in this work.
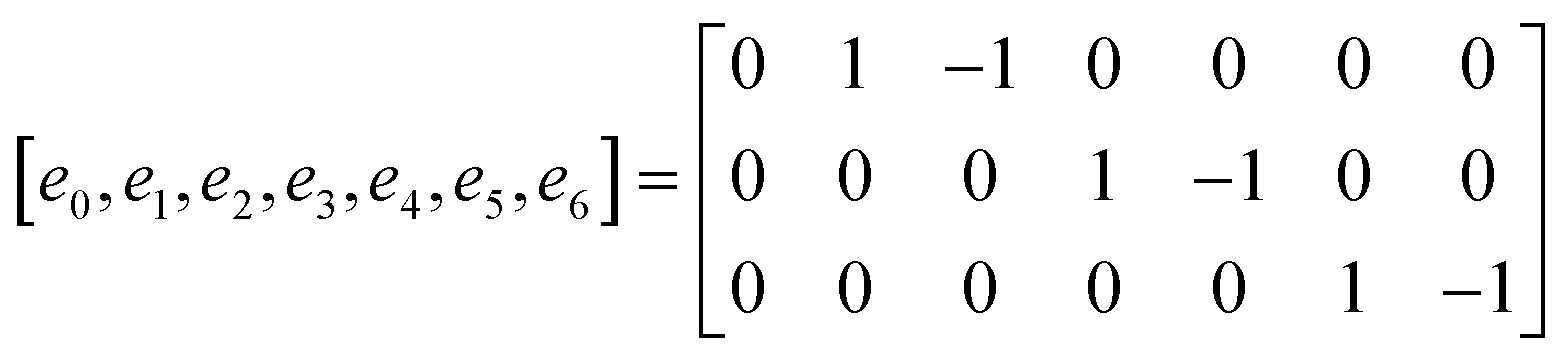
The D3Q7 (7 discrete velocities in 3 dimensions) lattice scheme is adopted due to its high computing efficiency. The evolution of the distribution function is shown as follows:35
| | | fi(x + eiΔt,t + Δt) − fi(x,t) = −M−1 SM[fi(x,y) − feqi(x,t)]Δt | (24) |
where
fi is the concentration distribution function at the lattice site
x at time
t in the
ith direction.
ei is the discretized velocity and
feqi is the equilibrium distribution function. Δ
x is the lattice spacing and Δ
t is the time step, which is generally set as 1 in the LB model.
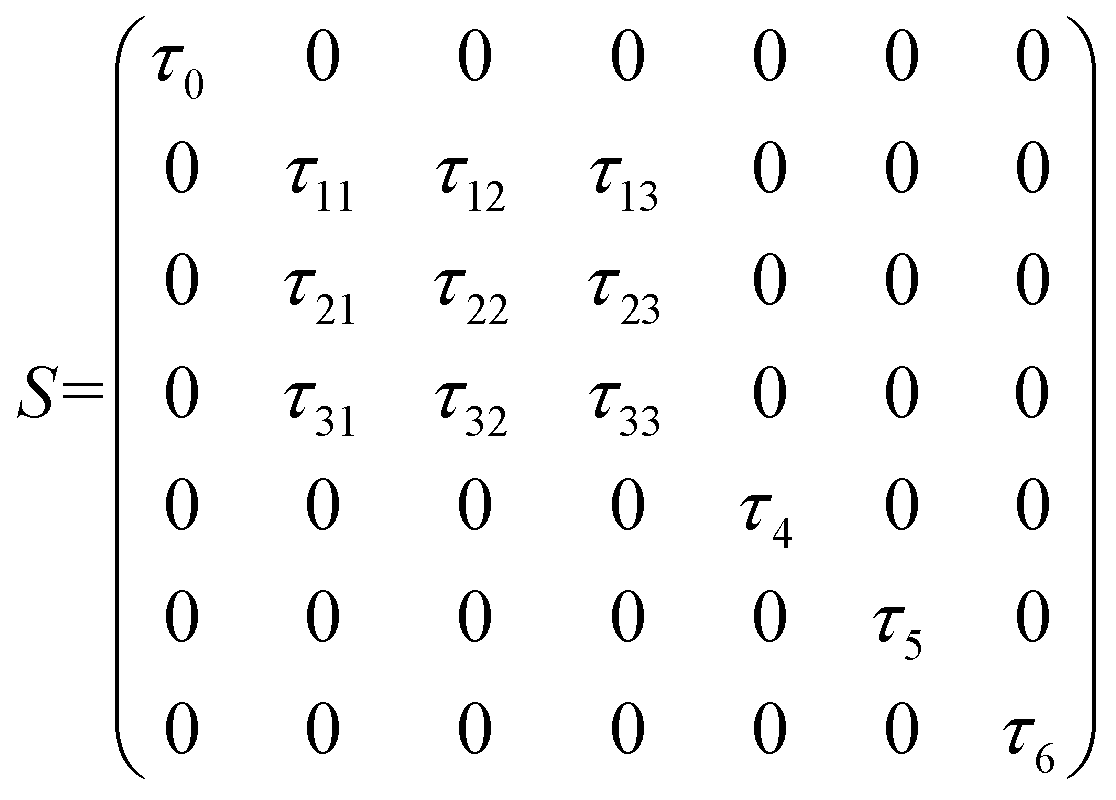
M is the transformation matrix and
S is the relaxation diagonal matrix. These parameters can be expressed as
| | 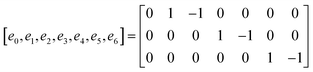 | (25) |
| | 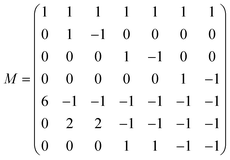 | (26) |
| | 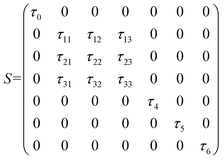 | (27) |
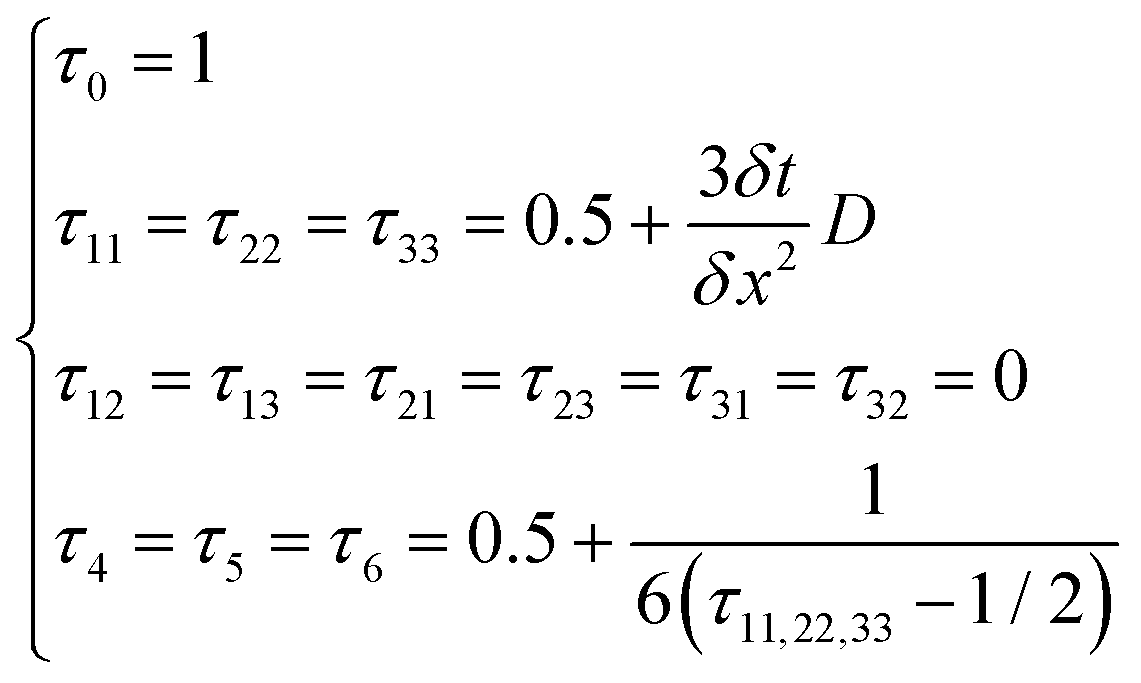
This research adopts isotropic diffusion and the relaxation coefficients are calculated using eqn (28):
| | 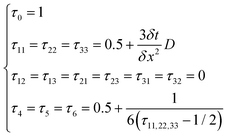 | (28) |
where
D,
δx, and
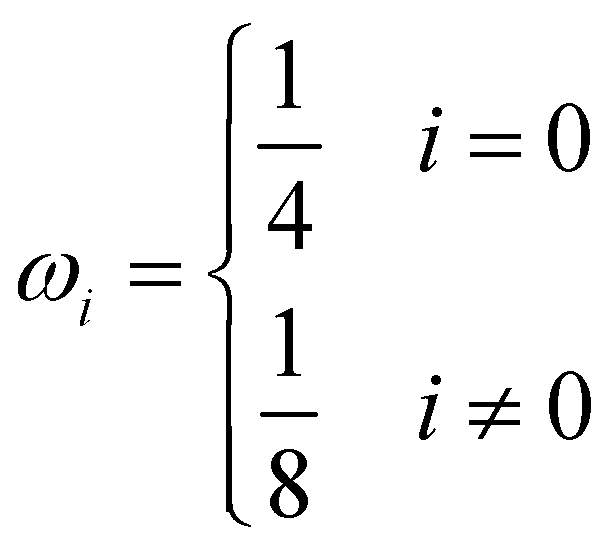
δt are the macroscopic diffusion coefficient, mesh size and time step, respectively. The weight coefficient is given as
| | 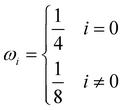 | (29) |
Through relaxation (collision) and propagation (streaming) treatments, we obtain the oxygen concentration c and potential ϕ as
| |  | (30) |
2.2.3 Boundary conditions and numerical strategy.
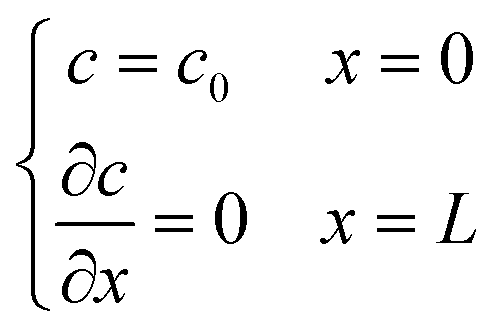
Two buffer domains are added in the reconstructed CL, as shown in Fig. 2a, to ensure the model stability. This study applies periodic boundary conditions to the y and z directions. The surface x = 0 is considered to be attached to the MPL side, while the other side is attached to the membrane. Oxygen and electrons flow from the MPL and protons flow from the membrane. For oxygen transport, the boundary conditions are defined as| |  | (31) |
 |
| | Fig. 2 (a) Schematic of computational domain and boundary conditions. (b) Schematic description of the lattice nodes and numerical treatment of the conjugated mass transfer at the pore/ionomer interface. (c) Flow chart of the present pore-scale model. The buffer zone can ensure that the reactants enter the CL smoothly. Oxygen and electrons flow from the MPL, and protons flow from the membrane. In this study, the CL microstructure is reconstructed with a process-based stochastic algorithm, and a multiple-relaxation-time lattice Boltzmann model is adopted to resolve the distribution of oxygen, protons and electrons. | |
In the LB method, it can be expressed as
| |  | (32) |
where
xb denotes a boundary node.
f1(
xb,
t) and
f2(
xb,
t) are the distribution functions in the boundary node.
After numerical tests, it is found that the model is difficult to be convergent with a constant voltage boundary. The constant voltage boundary shows its inapplicability to solve coupled potentials. The ionic and electronic potentials lack mutual restriction where the constant voltage boundary is adopted. Therefore, the constant current density method34 is adopted to set boundary conditions for proton and electron components, given as
| |  | (33) |
| | 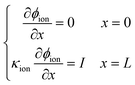 | (34) |
where
I is the cell operating current density. In this work, two operating conditions are considered: 0.2 and 2 A cm
−2. The Neumann boundary can be expressed in a discrete format as
| |  | (35) |
where
I·
n is a normal flux at a wall.
xb and
xw denote a boundary and a wall node, respectively.
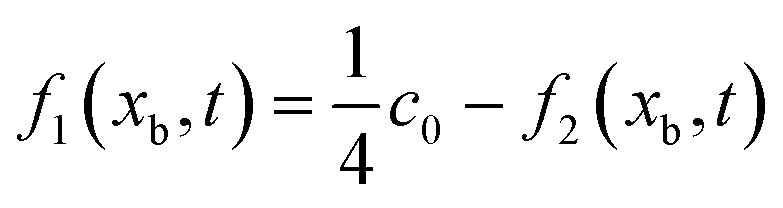
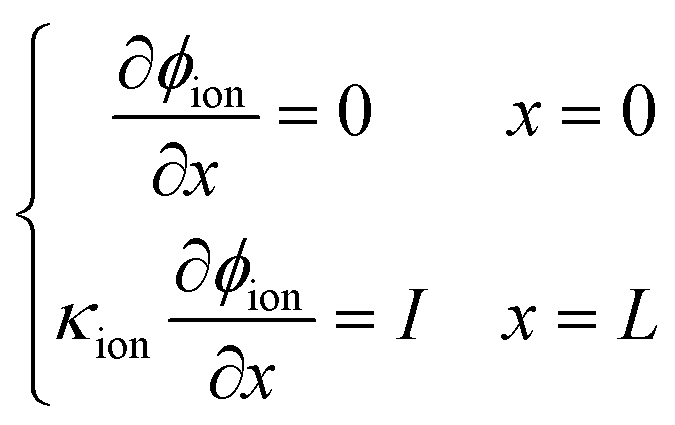
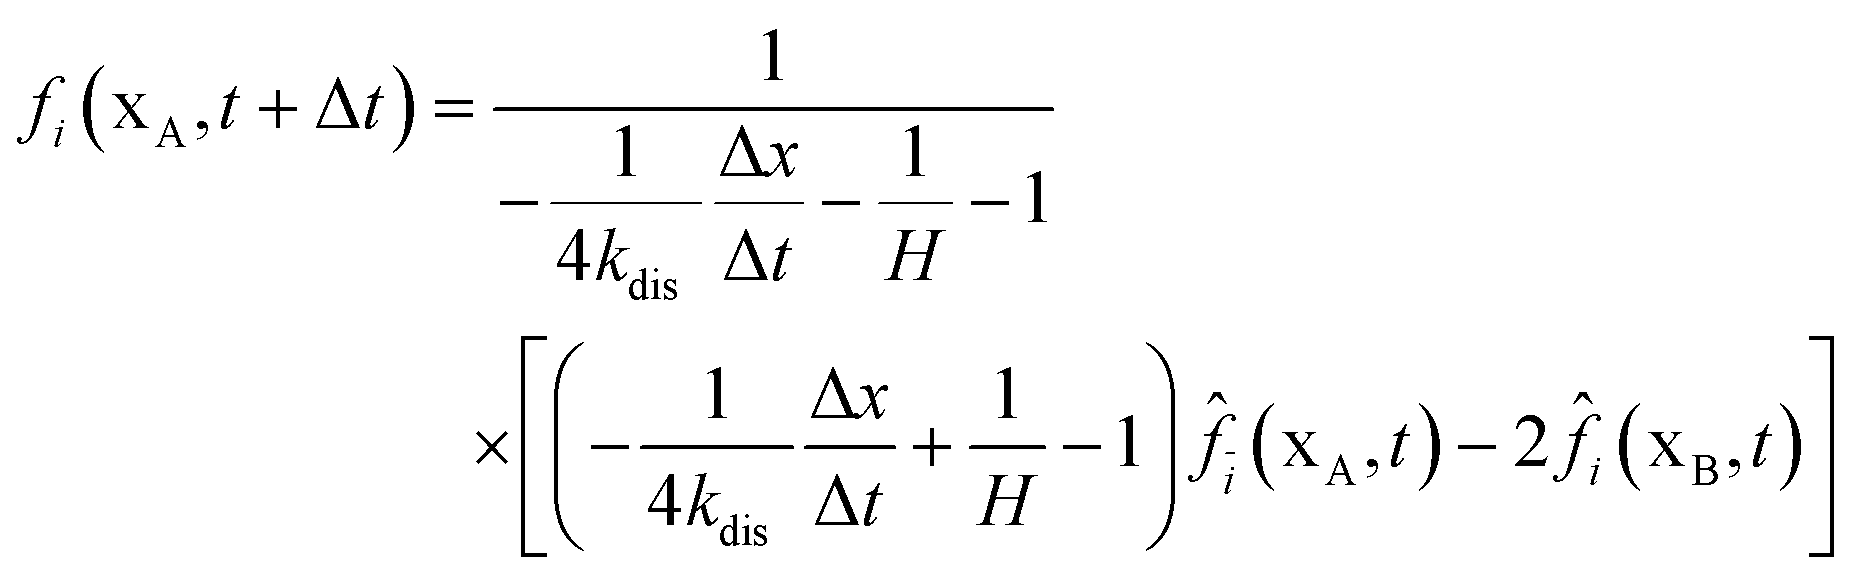
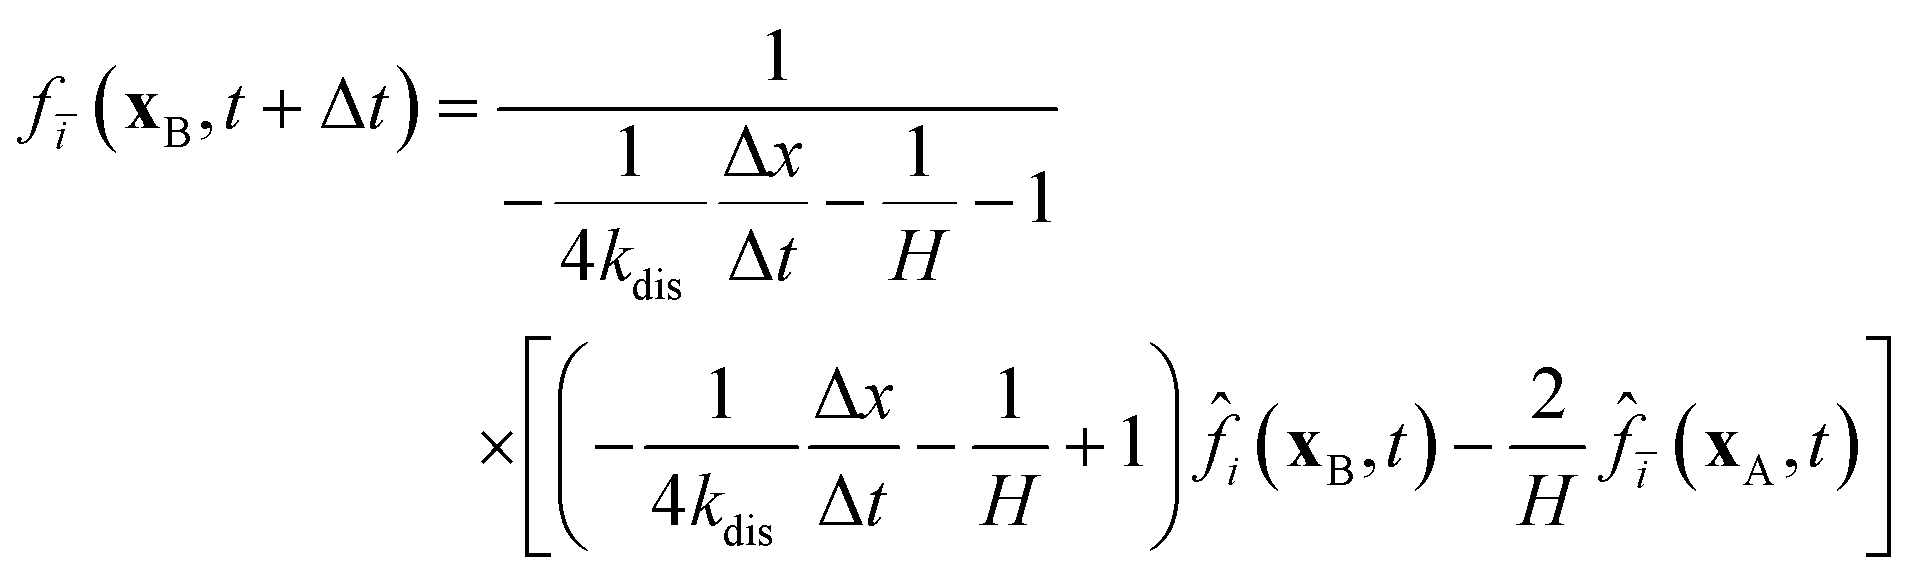
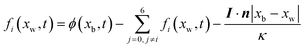
In Section 2.2.1, the oxygen concentration is discontinuous at the pore/ionomer interface due to Henry's law. The numerical strategy for boundary conditions at the pore/ionomer interface is as follows:28,36
The pore/ionomer interface is located between the pore node and ionomer node as shown in Fig. 2b. In Mu and Chen et al.'s studies,28,36 a novel scheme has been proposed for the unknown distribution functions of the pore/ionomer interface.
| | 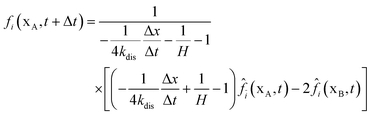 | (36) |
| |  | (37) |
where
fi(
xA,
t + Δ
t) and
fī(
xB,
t + Δ
t) are the unknown distribution functions.
![[f with combining circumflex]](https://www.rsc.org/images/entities/i_char_0066_0302.gif) ī
ī(
xA,
t) and
i(
xB,
t) are the distribution functions after collision.
H is Henry's constant of oxygen and
kdis is the oxygen dissolution rate. Moreover, Henry's constant
H and the dissolution reaction rate constant
kdis are known.
The simulation is realized using an in-house code and the implementation procedure is presented in Fig. 2c. It is computationally expensive to get the convergence results of the present multicomponent model. Therefore, the model is coded in CUDA and paralleled on the GPU workstation with 3 NVIDIA TITAN XP GPU cards.37 The physical time step is 1 × 10⁻¹¹ s, and under the 0.4 mg cm−2 condition, the convergence can be achieved after around 17500000 time steps, which is 1.75 × 10⁻⁴ s physical time.
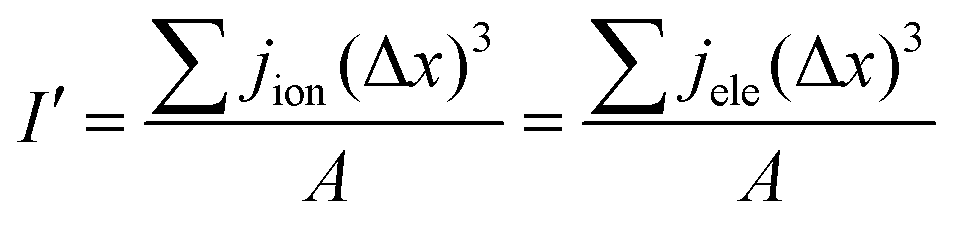
I' is the volume average current calculated and should be equal to I at the input boundary. I′ can be expressed as
| |  | (38) |
where
A denotes the total cross-sectional area of the catalyst layer.
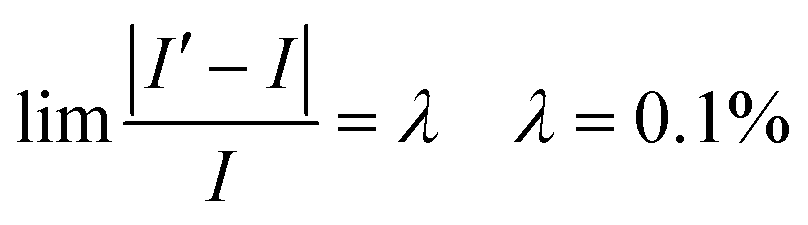
Eqn (36) is employed to check the equilibrium condition.
| |  | (39) |
2.2.4 Model validation.
The potential losses of bipolar plates, gas diffusion layers, microporous layers, and the proton exchange membrane are simplified as ohmic overpotentials. Due to the very small potential loss of the anode CL, it is also simplified as ohmic overpotential. The present pore-scale model is validated by comparing numerical polarization curves to the reference results of the experiment.38 The output voltage can be calculated by| | | V = E−ηact−ηOhm−ηtran | (40) |
where V, E, ηact, ηOhm, and ηtran are the output voltage, reversible voltage, overpotential loss, ohmic loss and transport loss, respectively.
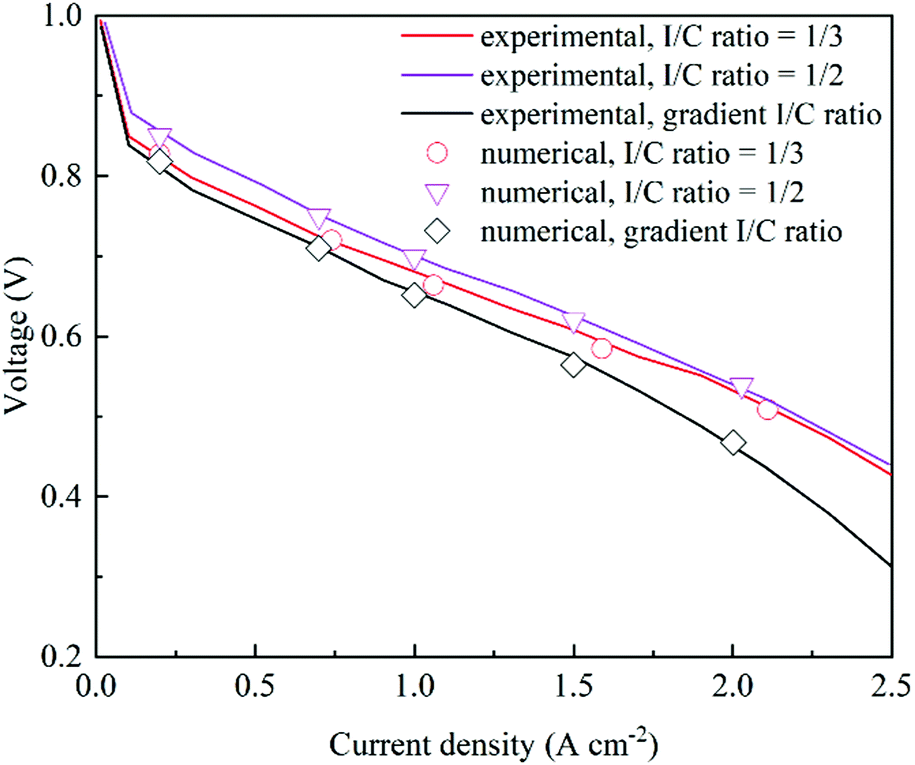
CLs are reconstructed based on the experimental parameters and three CLs with different I/C ratios are selected to compare with numerical simulation results. Table 2 shows the structural parameters in the validation tests. As shown in Fig. 3, the polarization curves from simulation results agree well with the experimental data,38 which validates the proposed model.
Table 2 Structural parameters for validation tests
| Case |
I/C |
Pt/C |
Pt loading |
|
ε
|
| 1st CL |
2nd CL |
1st CL |
2nd CL |
| Validation model 1 |
1/3.0 |
0 |
0.6 |
0.4 |
0 |
0.477 |
| Validation model 2 |
1/2.0 |
0 |
0.6 |
0.4 |
0 |
0.374 |
| Validation model 3 |
1/2.3 |
1/3.3 |
0.6 |
0.1 |
0.3 |
0.4765 |
 |
| | Fig. 3 Comparison of polarization curves under different I/C ratios between experimental and numerical data38 (Pt/C = 0.6, Pt loading = 0.4 mg cm−2, and porosity = 0.477, 0.374 and 0.4765, respectively). | |
3. Results and discussion
As shown in eqn (15), the reactant concentration and overpotential affect the electrochemical reaction rate, and the effect of Pt loading on various physical fields and performance will be discussed in the following aspects.
3.1 The distribution of oxygen concentration
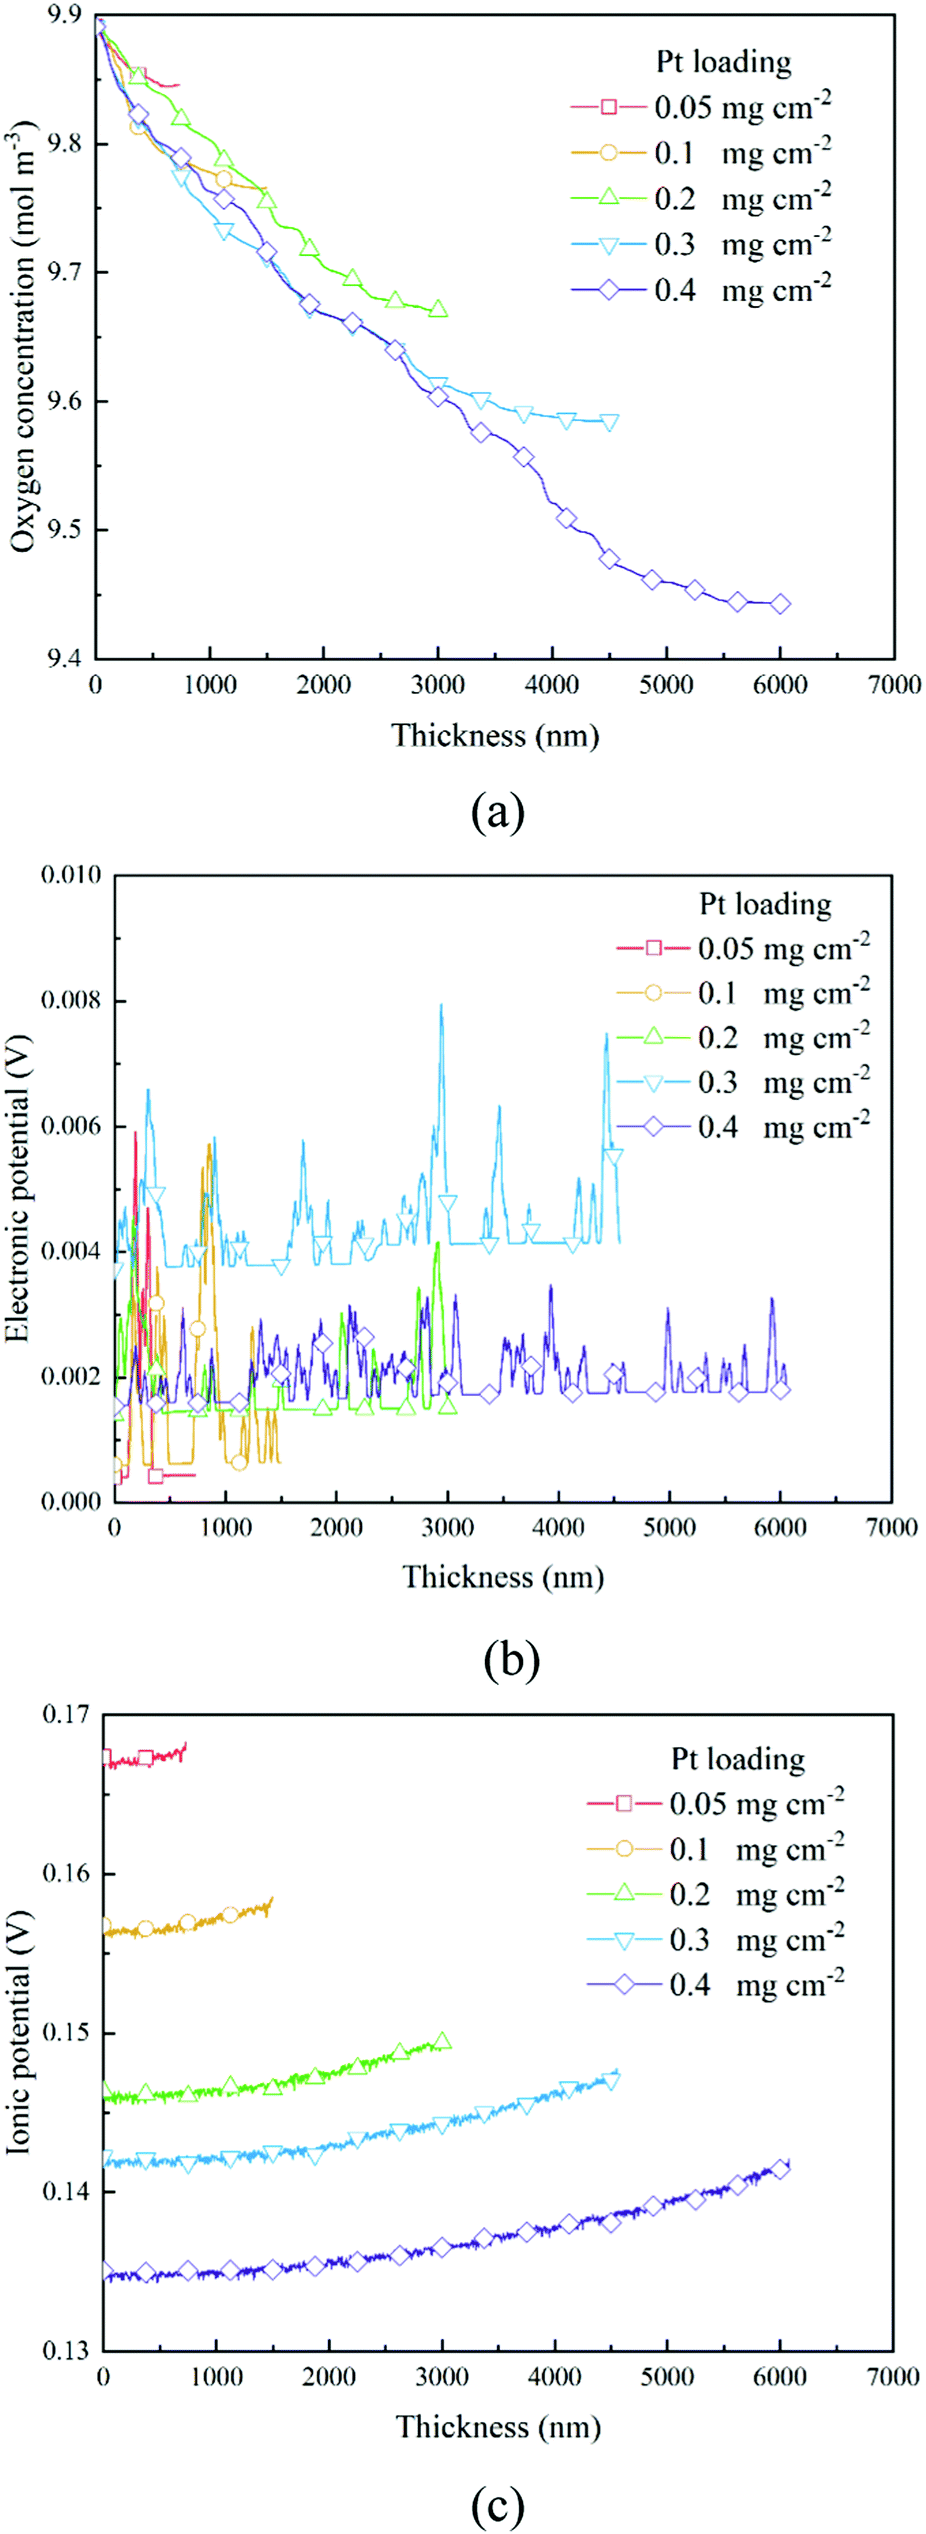
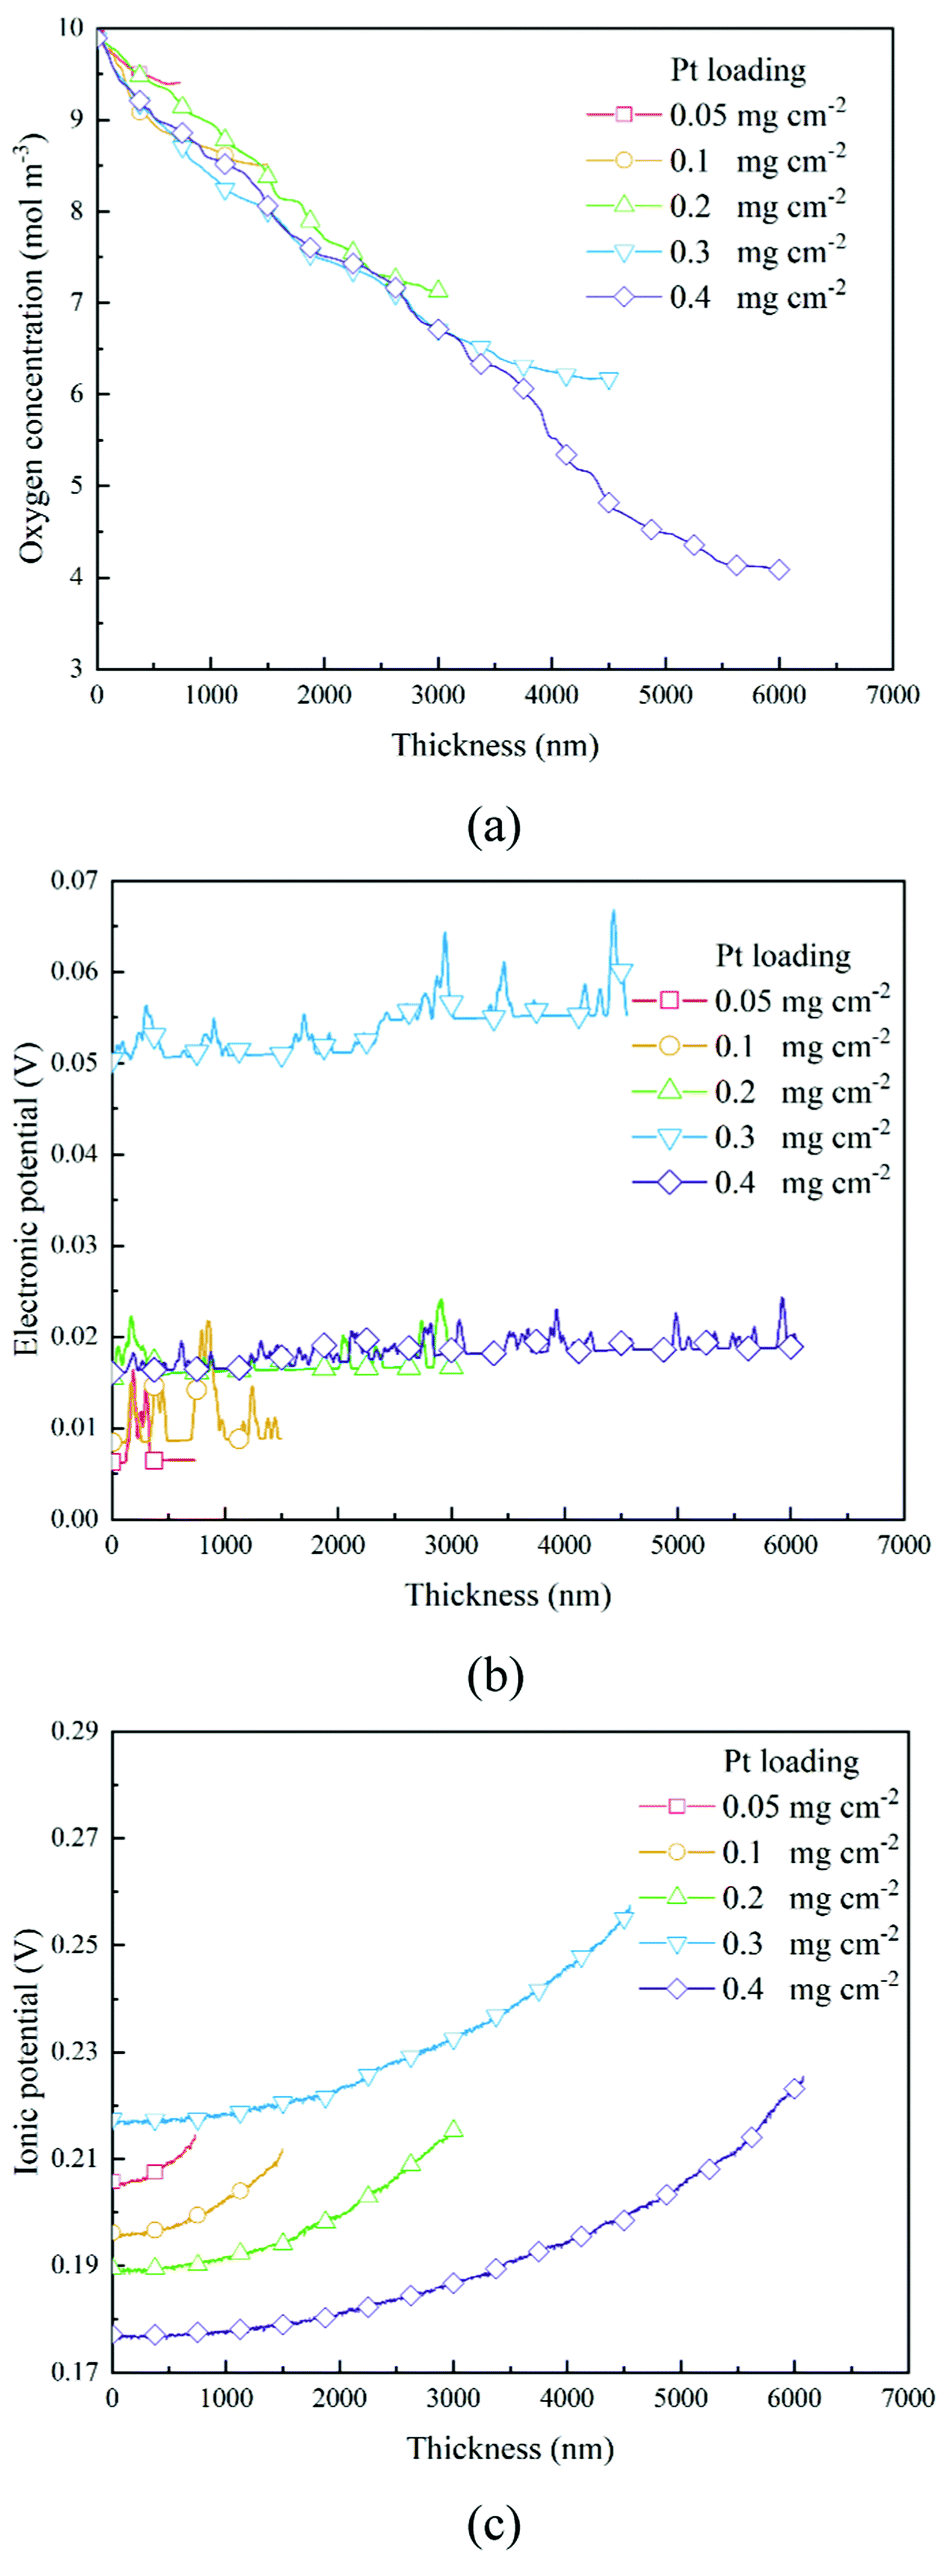
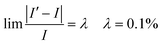
The transport of oxygen to the Pt/ionomer interface is complex, including diffusion in the pore, dissolution from the pore into the ionomer, diffusion in the ionomer to the Pt site, and finally absorption at the Pt/ionomer interface. The local oxygen concentration at a specific lattice can be obtained from the simulation. Fig. 4a and 6a show the oxygen concentration distribution along the thickness of CLs. As shown in Fig. 4a and 6a, the continuous decrease of oxygen concentration represents the transport loss and the consumption by electrochemical reactions.
 |
| | Fig. 4 Distributions of (a) oxygen concentration, (b) electronic potential, and (c) ionic potential along the thickness direction of different CLs under the 0.2 A cm−2 condition. | |
In previous work,26 a high Pt loading has been proved to reduce the local oxygen transfer resistance for a shorter transport path in the ionomer. However, as shown in Fig. 4a and 6a, a high Pt loading yields a thicker CL structure, thus causing a larger transport loss and concentration drop. Besides, the concentration drop also increases with the performance. Therefore, a high Pt loading not only yields a larger ECSA, but also brings extra transport loss, especially under high current conditions, which can degrade the performance.
3.2 The distribution of potential
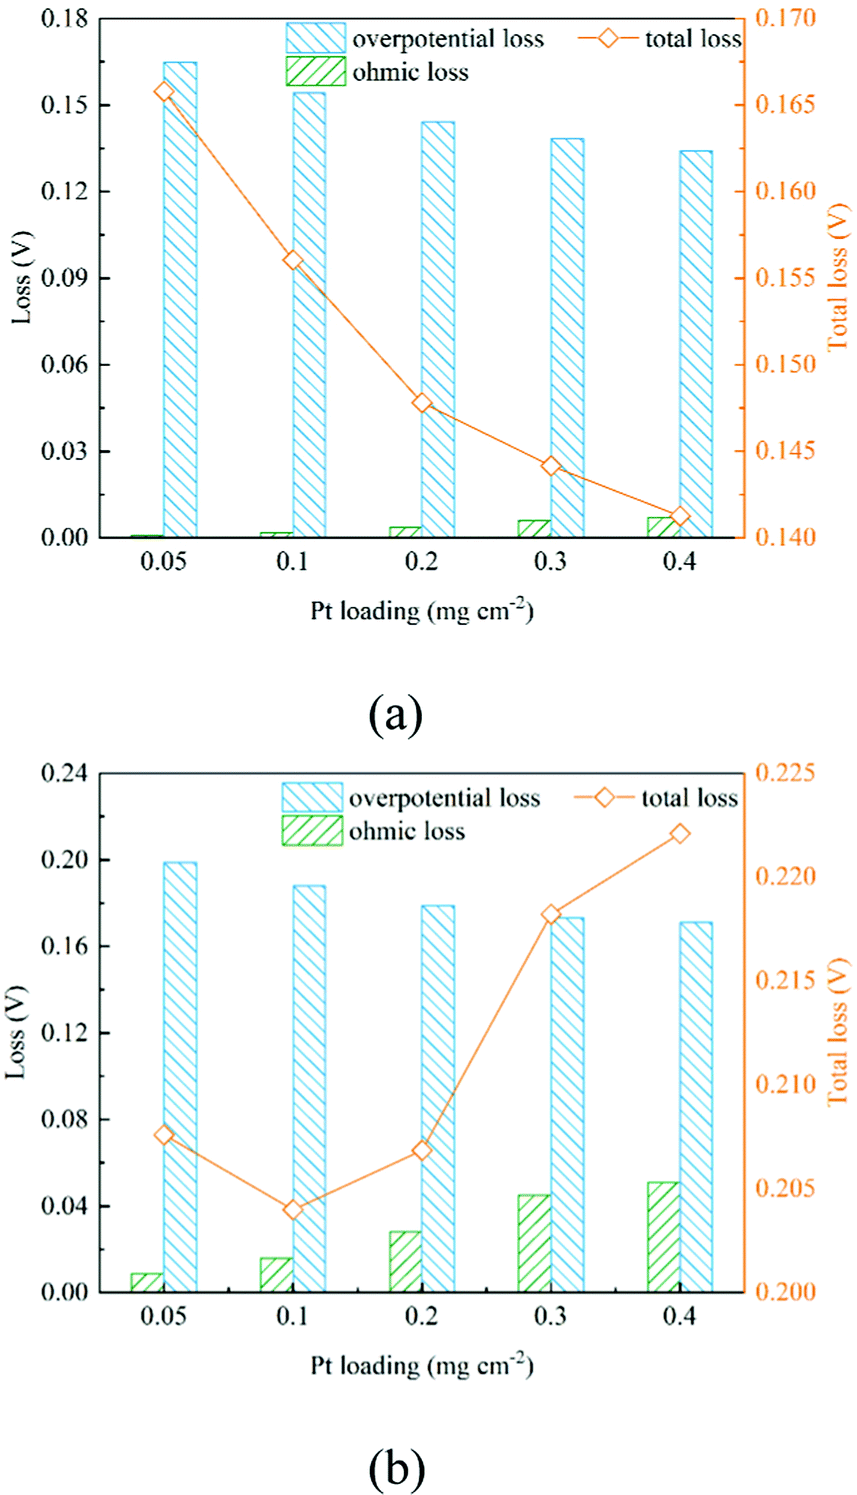
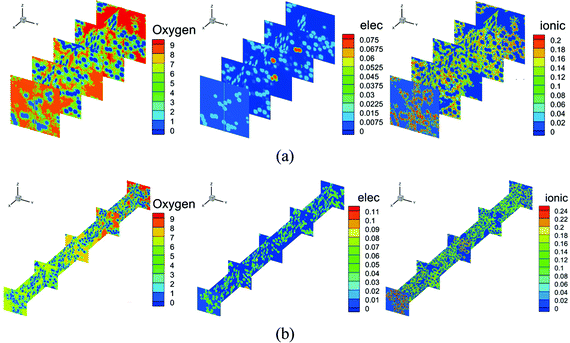
As shown in Section 2.2.3, boundary conditions for ionic and electronic components are set as constant current density in this work. Electrons flow from the MPL and protons flow from the membrane, and due to electrochemical reactions, electrons and protons are consumed during the transport process. Fig. 4b, c and Fig. 6b, c show the distributions of electronic and ionic potentials along the thickness of CLs. As shown in Fig. 4b and 6b, the distributions of electronic potentials are mostly stable, and the occasional waves represent the intense local reaction. The relatively smooth electric potential distribution shows that the electrical conduction is not a major issue restricting the performance under both low and high current conditions since the electrical conductivity is sufficiently high. Compared to electrical conduction, the ionic potential in Fig. 4c and 6c constantly decreases from the inlet to the outlet and the potential drop is also higher under a high current condition. Fig. 9 shows the performance loss with different CLs under different current conditions. The ohmic losses of protons and electrons are defined as the differences in ionic and electronic potentials from the inlet to the outlet. It can be seen that a higher Pt loading also leads to a larger ionic loss for a longer transport path. However, the electronic potential drop is not sensitive to Pt loading.
3.3 The distribution of overpotential and the reaction rate
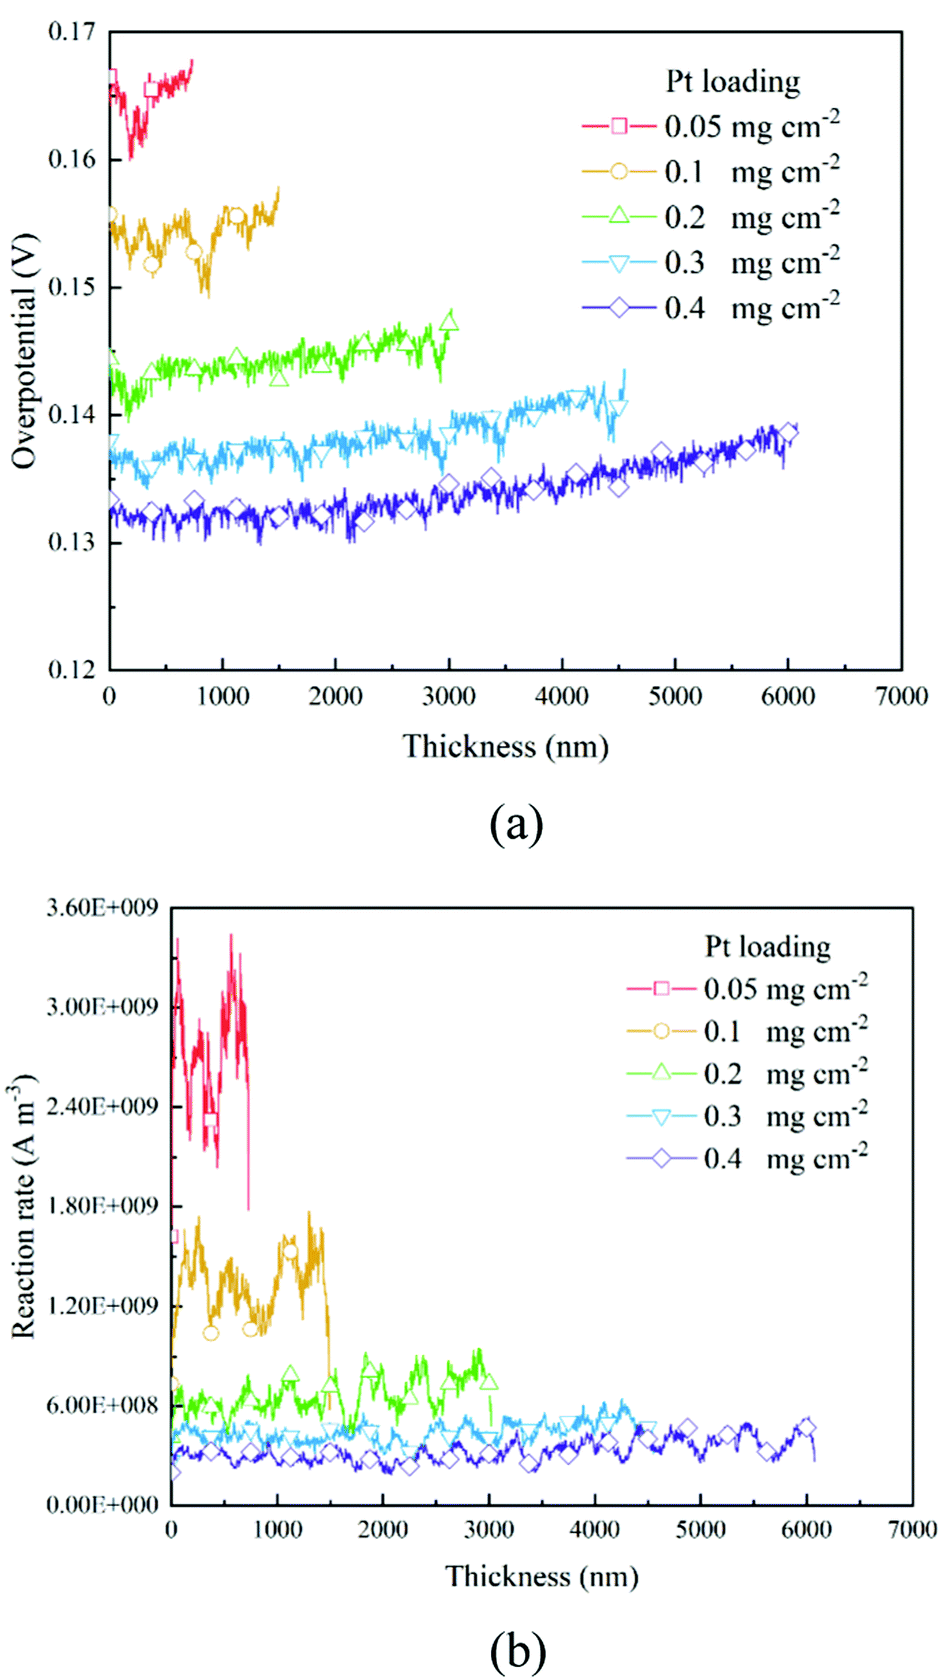
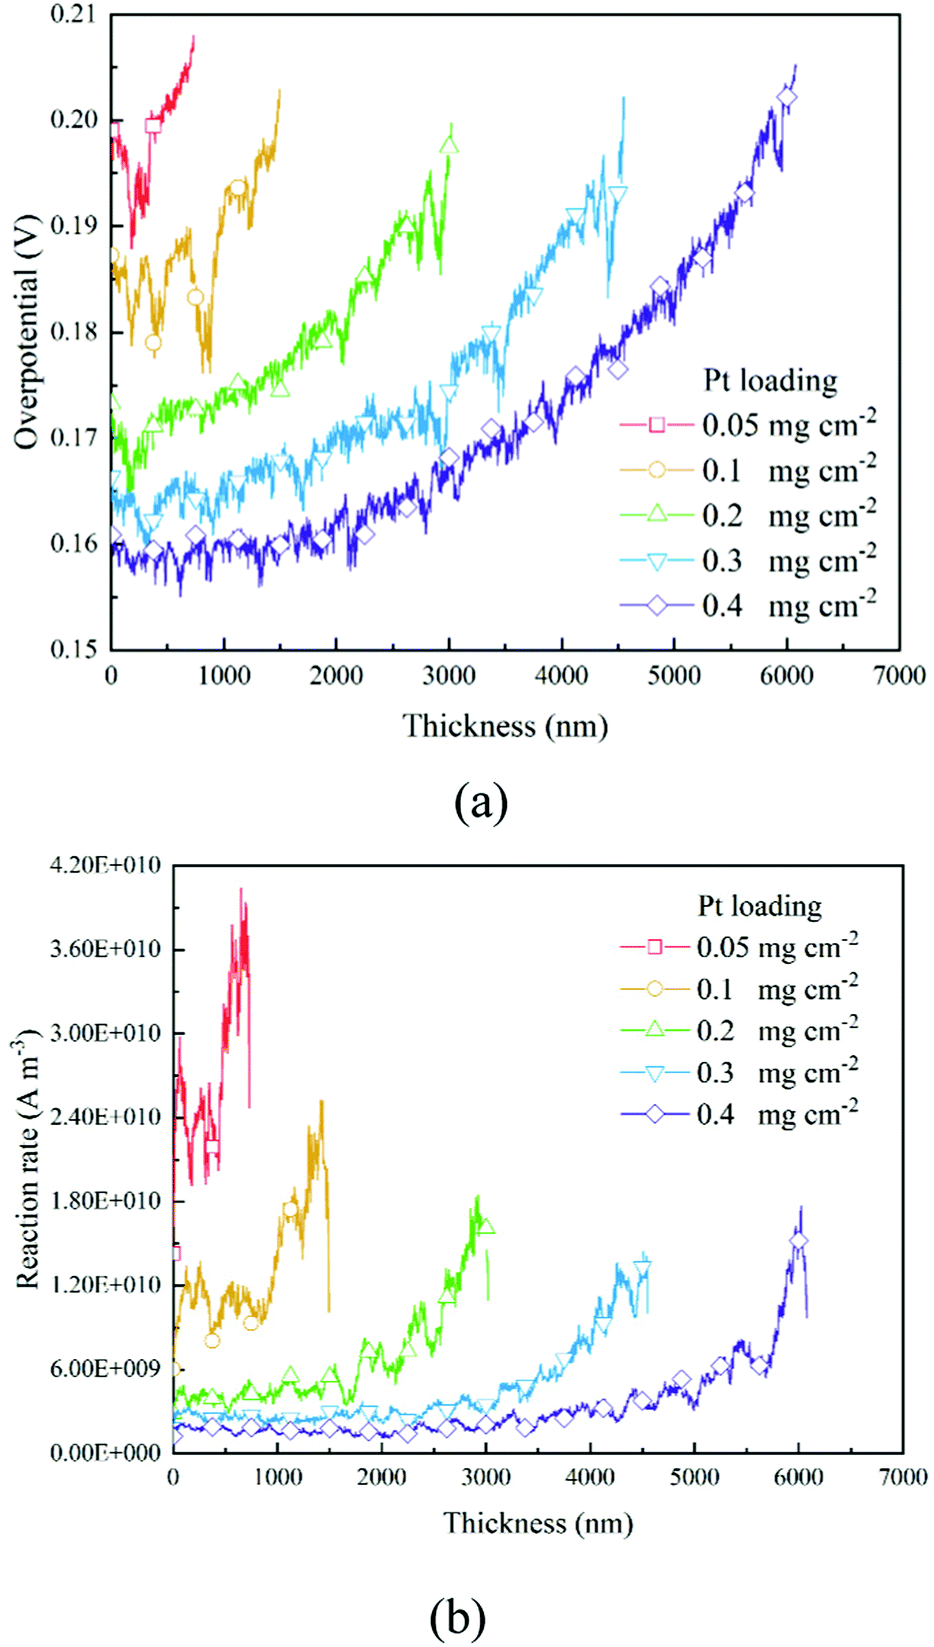
Based on the B–V equation, local overpotential ηact plays a key role in the electrochemical reaction rate and is calculated by the difference between ionic and electronic potentials at the reaction site. Fig. 5a and 8a show the distributions of local overpotentials along the thickness of the CLs. It can be seen that, whether under low or high-performance conditions, the local overpotential reaches the peak value near the membrane side, which indicates that the ionic potential significantly affects the local overpotential. Therefore, a more efficient transport of protons is critically important for the performance of PEM fuel cells. Besides, as shown in Fig. 1b, 5a, 8a and 9a, b, a high Pt loading yields more reaction sites and only needs a relatively low local overpotential to reach the target performance. Under low Pt loading conditions, the required local overpotential is greater. Fig. 5b and 8b show the distribution of reaction rate along the thickness of the CLs. It can be found that the distributions of the reaction rate and local overpotential have general similar trends, which again proves their importance in the performance. In Fig. 5b and 8b, the reaction rate also reaches the maximum performance close to the membrane where the local oxygen concentration reaches the lowest value, indicating that the complex physical fields are coupled and should be balanced to reach the optimum performance.
 |
| | Fig. 5 Distributions of (a) overpotential and (b) reaction rate along the thickness direction of different CLs under the 0.2 A cm−2 condition. | |
 |
| | Fig. 6 Distributions of (a) oxygen concentration, (b) electronic potential, and (c) ionic potential along the thickness direction of different CLs under the 2 A cm−2 condition. | |
3.4 Optimum Pt loading under different conditions
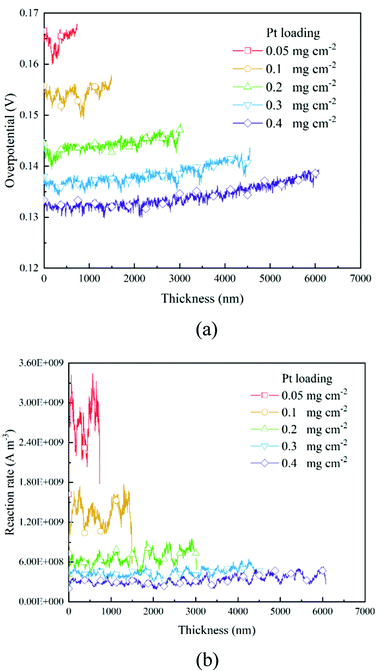
Fig. 7 shows the contours of oxygen concentration, electron potential, and ionic potential under different Pt loadings and at 2 A cm−2. As shown in Fig. 7, a high Pt loading increases the overall transport resistance for a thicker structure, where oxygen concentration and ionic potential drops increase significantly. From the above discussion, it is discovered that the Pt loading has dual effects on performance. On one hand, more reaction sites can effectively decrease the overpotential loss; on the other hand, the relatively thick structure under a high loading brings extra transport resistance for both the reactant and protons. The transport loss becomes higher with the increase of current density. As illustrated in Fig. 9, under low current density conditions, the total potential loss decreases as the Pt loading increases, indicating that this active overpotential is the most important factor influencing PEMFC effectiveness. However, as in the case of a high current density, the trend of total potential loss is complex. When the loading increases from 0.05 mg cm−2 to 0.1 mg cm−2, the potential loss decreases, indicating that a certain ECSA is required to ensure the output voltage. When the Pt loading is increased further, potential loss starts to increase as the transport loss becomes the dominant issue. Therefore, under low performance conditions where the transport loss is neglectable, a higher Pt loading is preferred, which is 0.4 mg cm−2 in this work. Regarding the high-performance conditions, a low Pt loading (0.1 mg cm−2) shows a better performance for a much lower transport loss of both the reactant and protons.
 |
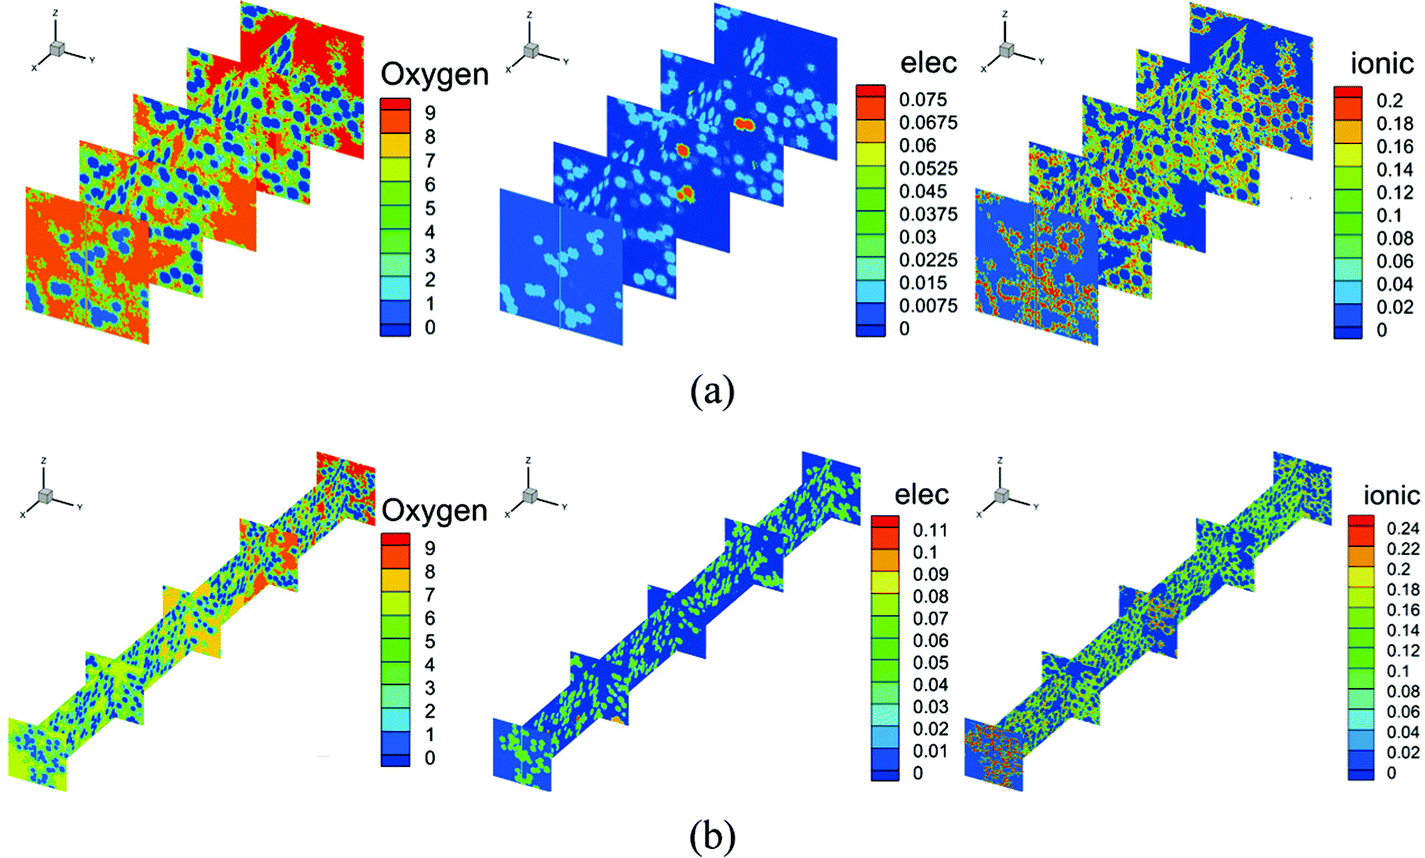
| | Fig. 7 Contours of oxygen concentration, electronic potential, and ionic potential under Pt loadings of (a) 0.1 mg cm−2 and (b) 0.3 mg cm−2 at 2 A cm−2. | |
 |
| | Fig. 8 Distributions of (a) overpotential and (b) reaction rate along the thickness direction of different CLs under the 2 A cm−2 condition. | |
 |
| | Fig. 9 Comparison of the performance loss of different CLs under (a) 0.2 A cm−2 and (b) 2 A cm−2. | |
4. Conclusion
In this study, a pore-scale model is built to model the coupled transport phenomena of oxygen, protons, and electrons in the CL with electrochemical reactions coupled. The CL microstructure is stochastically reconstructed with every ingredient considered. A multiple-relaxation-time lattice Boltzmann model is adopted to resolve the multi-component physical fields. The effects of Pt loading are discussed in terms of oxygen concentration distribution, ionic potential distribution, electronic potential distribution, overpotential distribution and reaction rate distribution. According to the modeling results, a higher Pt loading results in a thicker CL, which brings more reaction sites and a lower overpotential loss. However, due to a longer transport path, it also results in a larger transport loss, especially for the reactant and protons. The electronic potential drop is not sensitive to Pt loading, while the ionic potential drop is much higher. The local overpotential and electrochemical reaction rate reach the peak values near the membrane side, which shows that the proton conduction is the dominant issue affecting the performance. Therefore, it is crucial to study the effects of the gradient I/C ratio and novel structural design in improving the performance of PEM fuel cells in the future, which can decrease the transfer resistance of protons. The ECSA and transport resistance should be balanced to select the Pt loading and reach the optimum performance. Under low current conditions, a larger ECSA effectively decreases the overpotential, which needs to be considered. Under high-performance conditions, the transport loss becomes the major issue and thus a relatively low Pt loading is preferred.
Author contributions
Kui Jiao and Qing Du conceived the idea for the manuscript. Xing Li mainly performed the numerical simulation in this work. Xing Li and Yuze Hou reconstructed the microstructure of the catalyst layer. Yuze Hou provided the original code for the MRT lattice Boltzmann model. Xing Li and Chengru Wu improved the source term of the LB model. Xing Li used this LB model to simulate the reactive transport processes in the CL. Xing Li analyzed the interlink among catalyst loading, reactive transport and performance of the CL in the PEMFC. Kui Jiao and Yuze Hou discussed the results and commented on the manuscript at all stages. Kui Jiao led the project.
Nomenclature
|
A
| Cross sectional area, m2 |
|
c
| Oxygen concentration, mol m−3 |
|
D
| Diffusivity, m2 s−1 |
|
d
| Local pore size, m |
|
e
| Discretized velocity |
|
F
| Faraday's constant, C mol−1 |
|
f
| Distribution function |
|
H
| Henry's constant, Pa m−3 mol−1 |
|
i
0
| Reference transfer current density, A m−2 |
|
I
| Current density, A m−2 |
|
j
| Reaction source term |
|
k
dis
| Dissolution rate |
|
l
| Thickness of the catalyst layer, nm |
|
M
| Molecular weight, g mol−1 |
|
N
| Total number of reaction sites |
|
P
| Pressure, atm |
|
R
| Universal gas constant, kJ mol−1 K−1 |
|
T
| Operating temperature, K |
|
x
| Direction, lattice site |
|
y
| Direction |
|
z
| Direction |
Greek letters
|
ρ
| Density, mg cm−3 |
|
ε
| Porosity |
|
ε
Pt
| Volume fraction of platinum |
|
ε
I
| Volume fraction of the ionomer |
|
ε
Carbon
| Volume fraction of carbon |
|
γ
Pt
| Pt loading, mg cm−2 |
|
θ
Pt
| Pt/C ratio |
|
θ
I
| I/C ratio |
|
δx
| Mesh interval, m |
|
δt
| Time interval, s |
|
α
| Reaction coefficient |
|
β
| Reaction coefficient |
|
κ
| Conductivity, S m−1 |
|
ϕ
| Potential, V |
|
λ
| Water content; error value |
|
η
| Overpotential, V |
|
τ
| Relaxation time |
|
ω
| Weight coefficient |
Subscripts and superscripts
| Ave | Average |
| b | Bulk |
| ele | Electron |
| eq | Equilibrium |
| I | Ionomer |
| i | Lattice direction |
| oxy | Oxygen |
| p | Pore |
| ref | Reference |
Conflicts of interest
There are no conflicts of interest to declare.
Acknowledgements
This research was supported by the National Natural Science Foundation of China (Grant no. 51920105010) and the Natural Science Foundation of Tianjin (China) for Distinguished Young Scholars (Grant no. 18JCJQJC46700).
References
- K. Jiao, J. Xuan, Q. Du, Z. Bao, B. Xie, B. Wang, Y. Zhao, L. Fan, H. Wang, Z. Hou, S. Huo, N. P. Brandon, Y. Yin and M. D. Guiver, Nature, 2021, 595, 361–369 CrossRef CAS PubMed.
- K. Jiao and X. Li, Prog. Energy Combust. Sci., 2011, 37, 221–291 CrossRef CAS.
- T. Kawawaki, Y. Kataoka, M. Hirata, Y. Iwamatsu, S. Hossain and Y. Negishi, Nanoscale Horiz., 2021, 6, 409–448 RSC.
- A. Byeon, J. Cho, J. G. M. Kim, K. H. Chae, H. Y. Park, S. W. Hong, H. C. Ham, S. W. Lee, K. R. Yoon and J. Y. Kim, Nanoscale Horiz., 2020, 5, 832–838 RSC.
- S. T. Thompson, B. D. James, J. M. Huya-Kouadio, C. Houchins, D. A. DeSantis, R. Ahluwalia, A. R. Wilson, G. Kleen and D. Papageorgopoulos, J. Power Sources, 2018, 399, 304–313 CrossRef CAS.
- B. Wang, G. Zhang, H. Wang, J. Xuan and K. Jiao, Energy AI, 2020, 1, 100004 CrossRef.
- M. J. Choo, K. H. Oh, J. K. Park and H. T. Kim, ChemElectroChem, 2015, 2, 382–388 CrossRef CAS.
- H. Yu, A. Baricci, A. Bisello, A. Casalegno, L. Guetaz, L. Bonville and R. Maric, Electrochim. Acta, 2017, 247, 1155–1168 CrossRef CAS.
- Y. Rao, F. Zhou, K. L. Fu, W. Guo and M. Pan, Int. J. Electrochem. Sci., 2017, 12, 4630–4639 CrossRef CAS.
- S. H. Kim and H. Pitsch, J. Electrochem. Soc., 2009, 156, B673–B681 CrossRef CAS.
- H. Wan, X. H. Liu, H. D. Wang, R. Z. Ma and T. Sasaki, Nanoscale Horiz., 2019, 4, 789–808 RSC.
- S. Sharma and B. G. Pollet, J. Power Sources, 2012, 208, 96–119 CrossRef CAS.
- Y. Wang, B. Seo, B. Wang, N. Zamel, K. Jiao and X. C. Adroher, Energy AI, 2020, 1, 100014 CrossRef.
- P. Rama, Y. Liu, R. Chen, H. Ostadi, K. Jiang, Y. Gao, X. Zhang, R. Fisher and M. Jeschke, Energy Fuels, 2010, 24, 3130–3143 CrossRef CAS.
- T. Berning, D. M. Lu and N. Djilali, J. Power Sources, 2002, 106, 284–294 CrossRef CAS.
- W. Sun, B. A. Peppley and K. Karan, Electrochim. Acta, 2005, 50, 3359–3374 CrossRef CAS.
- G. Wang, P. P. Mukherjee and C.-Y. Wang, Electrochim. Acta, 2006, 51, 3139–3150 CrossRef CAS.
- L. Fan, Y. Wang and K. Jiao, ACS Nano, 2020, 14, 17487–17495 CrossRef CAS PubMed.
- W. Wu and F. Jiang, Int. J. Hydrogen Energy, 2014, 39, 15894–15906 CrossRef CAS.
- G. R. Molaeimanesh and M. H. Akbari, J. Power Sources, 2014, 258, 89–97 CrossRef CAS.
- U. R. Salomov, E. Chiavazzo, M. Fasano and P. Asinari, Int. J. Hydrogen Energy, 2017, 42, 26730–26743 CrossRef CAS.
- G. R. Molaeimanesh, M. A. Bamdezh and M. Nazemian, Int. J. Hydrogen Energy, 2018, 43, 20959–20975 CrossRef CAS.
- L. Chen, G. Wu, E. F. Holby, P. Zelenay, W.-Q. Tao and Q. Kang, Electrochim. Acta, 2015, 158, 175–186 CrossRef CAS.
- H. Deng, Y. Z. Hou, W. M. Chen, F. W. Pan and K. Jiao, Int. J. Heat Mass Transfer, 2019, 143, 118538 CrossRef CAS.
- Y. Z. Hou, H. Deng, F. W. Pan, W. M. Chen, Q. Du and K. Jiao, Appl. Energy, 2019, 253, 113561 CrossRef CAS.
- Y. T. Mu, A. Z. Weber, Z. L. Gu and W. Q. Tao, Appl. Energy, 2019, 255, 113895 CrossRef CAS.
- Y. Z. Hou, S. Prass, X. Li, Q. Du, K. Jiao and N. Zamel, Electrocatalysis, 2021, 12, 403–414 CrossRef CAS.
- L. Chen, R. Y. Zhang, Q. J. Kang and W. Q. Tao, Chem. Eng. J., 2020, 391, 123590 CrossRef CAS.
- F. C. Cetinbas, R. K. Ahluwalia, N. Kariuki, V. De Andrade, D. Fongalland, L. Smith, J. Sharman, P. Ferreira, S. Rasouli and D. J. Myers, J. Power Sources, 2017, 344, 62–73 CrossRef CAS.
- E. Brightman, G. Hinds and R. O'Malley, J. Power Sources, 2013, 242, 244–254 CrossRef CAS.
- K. J. Lange, P.-C. Sui and N. Djilali, J. Electrochem. Soc., 2010, 157, B1434 CrossRef CAS.
- R. F. Mann, J. C. Amphlett, B. A. Peppley and C. P. Thurgood, J. Power Sources, 2006, 161, 768–774 CrossRef CAS.
- T. Suzuki, K. Kudo and Y. Morimoto, J. Power Sources, 2013, 222, 379–389 CrossRef CAS.
- H. Wu, X. Li and P. Berg, Electrochim. Acta, 2009, 54, 6913–6927 CrossRef CAS.
- H. Yoshida and M. Nagaoka, J. Comput. Phys., 2010, 229, 7774–7795 CrossRef CAS.
- Y.-T. Mu, Z.-L. Gu, P. He and W.-Q. Tao, Phys. Rev. E, 2018, 98, 043309 CrossRef CAS.
- C. Obrecht, F. Kuznik, B. Tourancheau and J.-J. Roux, Comp. Math. Appl., 2013, 65, 252–261 CrossRef.
- S. Shahgaldi, A. Ozden, X. G. Li and F. Hamdullahpur, Energy Conv. Manag., 2018, 171, 1476–1486 CrossRef CAS.
|
| This journal is © The Royal Society of Chemistry 2022 |
Click here to see how this site uses Cookies. View our privacy policy here. 
 *
*