
A novel hydrosoluble near-infrared fluorescent probe for specifically monitoring tyrosinase and application in a mouse model†
Jiahang
Zhang
,
Zhao
Li
 *,
Xinwei
Tian
and
Ning
Ding
*,
Xinwei
Tian
and
Ning
Ding
Shaanxi Engineering Laboratory for Food Green Processing and Safety Control, College of Food Engineering and Nutritional Science, Shaanxi Normal University, Xi’an 710062, China. E-mail: lizhao0309@snnu.edu.cn
First published on 12th July 2019
Abstract
A novel hydrosoluble near-infrared (NIR) fluorescent probe that could specifically identify tyrosinase has been successfully constructed and applied for imaging of tyrosinase in living cells and zebrafish. Notably, the probe has been successfully applied to the diagnosis of melanoma in a xenogeneic mouse model.
Melanoma, an aggressive cutaneous malignancy, is the most deadly skin cancer, and its morbidity has increased rapidly in the past decades.1 Tyrosinase (TYR, EC 1.14.18.1), a copper-containing monooxygenase, can catalyze the oxidation of tyramine or tyrosine into quinones which triggers melanin formation.2 Melanin plays a key role in the development of melanoma.3 What's more, excessive expression of TYR in melanoma cancer cells is used as an independent biomarker for the diagnosis and prognosis of melanoma.4 Consequently, it is of profound significance to detect TYR simply and accurately for both fundamental research in biological systems and practical applications in clinical diagnosis of melanoma.
To date, there have been numerous traditional detection methods for TYR, such as colorimetric and electrochemical assays.5,6 Fluorescent probes are definitely a better choice for more convenient, effective, and accurate detection of TYR.7 For in vivo imaging studies, near-infrared (NIR) fluorescent probes are more desired because they show excellent tissue penetration and less biological and autofluorescence damage.8 In particular, the combination of an NIR fluorescent probe and confocal imaging has attracted widespread attention for monitoring TYR in living biological systems. Nevertheless, most of the current fluorescent probes are affected by interference from some reactive oxygen species (ROS) such as HOCl, H2O2 and ONOO−, to generate a fluorescence response similar to the TYR reaction.9 In order to solve this problem, we have adopted a new TYR recognition fragment, 3-hydroxybenzyloxy, which can specifically identify TYR instead of ROS.10 The decomposed product of the unstable precursor cyanine dyes not only exhibits high stability but also preserves the characteristics of near-infrared fluorescence emission of cyanine dyes.11 In view of this, we chose IR-783 that has excellent near-infrared spectroscopic features and good water solubility due to the existence of the sulfonic acid group.
In this paper, we report the successful design and synthesis of a hydrosoluble, selective, sensitive and reliable NIR fluorescent probe, (E)-2-(2-(6-((3-hydroxybenzyl)oxy)-2,3-dihydro-1H-xanthen-4-yl)vinyl)3,3-dimethyl-1-(4-sulfobutyl)-3H-indol-1-ium (1), for the detection of TYR activity. The presence of TYR will cut off the bonds that connect the fluorophore with a recognition moiety in the probe, resulting in the release of the fluorophore, which achieves the purpose of detecting TYR (Scheme 1). The probe 1 indeed exhibits excellent properties, which applies to the detection of endogenous TYR in living cells and zebrafish. Notably, the probe has been successfully applied to the diagnosis of melanoma in a xenogeneic mouse model. Detailed characterization of fluorophore 2 and probe 1 is described in Fig. S1–S4 (ESI†).
 | ||
| Scheme 1 Synthesis of probe 1 and its reaction with TYR. | ||
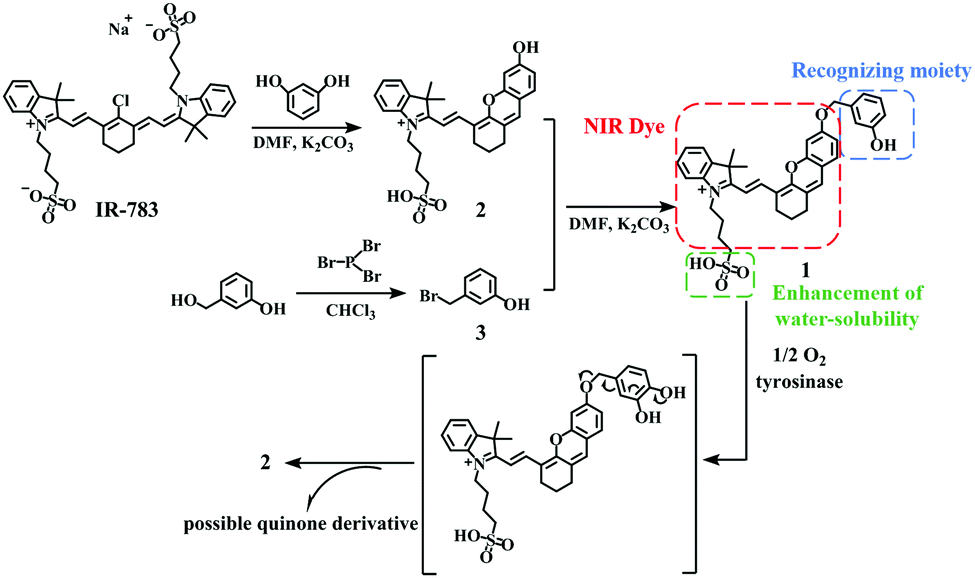
The probe 1 was successfully synthesized and characterized by 1H NMR, 13C NMR and ESI-MS, which demonstrated the successful synthesis of the probe 1. The UV-visible absorption and fluorescence spectra of probe 1 in the absence and presence of TYR are shown in Fig. 1A and B. Initially, probe 1 had an absorption maximum at 600 nm. After reaction with TYR, the maximum absorption peak was around 670 nm (Fig. 1A). As shown in Fig. 1B, with the added amount of TYR being increased, probe 1 showed a gradually enhanced fluorescence signal with a peak at 708 nm. It is worth noting that the absorption and fluorescence spectra of the reaction system are similar to those of fluorophore 2, with a quantum yield of 0.18, indicating that the free fluorophore 2 is caused by the cleavage reaction triggered by TYR (Scheme 1). The formation of fluorophore 2 was further verified by electrospray ionization mass spectral analysis (m/z 506.19 [M]+; Fig. S5, ESI†).
 | ||
| Fig. 1 (A) Absorption spectra of probe 1 (10 μM) (a) before and (b) after the reaction with TYR (80 μg mL−1). (B) Fluorescence spectra of probe 1 (10 μM) reacting with TYR at different concentrations (0, 2, 5, 8, 10, 20, 30, 40, 50, 60, 70 and 80 μg mL−1). The linear fitting curve of ΔF towards the concentration of TYR between 10 and 70 μg mL−1. ΔF is the fluorescence enhancement of probe 1 at 708 nm with and without TYR. The reaction was performed in 10 mM PBS at 37 °C for 3 h. λex/em = 670/708 nm. | ||
To optimize the detection conditions, a series of experiments related to factors such as the reaction incubation time, pH and temperature were carried out. The incubation time had a remarkable influence on the fluorescence intensity, and this parameter should be determined at the beginning of the reaction. Kinetic curves are shown clearly in Fig. S6 (ESI†), and the fluorescence intensity of the reaction solution increased rapidly and almost reached a plateau in about 3 h. This indicated that the reaction was completed after 3 h. Hence, we chose 3 h as the optimal response time. In addition, the fluorescence of the probe 1 (control) did not change significantly during the same period of time, which fully reflected the high stability of the probe in the detection system.
It was observed in Fig. S7 (ESI†) that the fluorescence intensities of probe 1 remained almost constant in the pH range from 5.0 to 8.0 and at temperatures from 25 to 42 °C, indicating its high stability. After reaction with TYR, the fluorescence intensities of probe 1 changed significantly with the increase of pH from 5.0 to 8.0. Similarly, the fluorescence of the reaction solution reached its maximum at a temperature of 37 °C (Fig. S8, ESI†). According to the results, we preferred pH = 7.4 and 37 °C as the best conditions. Together, these in vitro results indicated that probe 1 exhibits great stability in the absence of TYR and also has the potential to be employed to monitor TYR under normal physiological conditions (pH = 7.4, 37 °C).
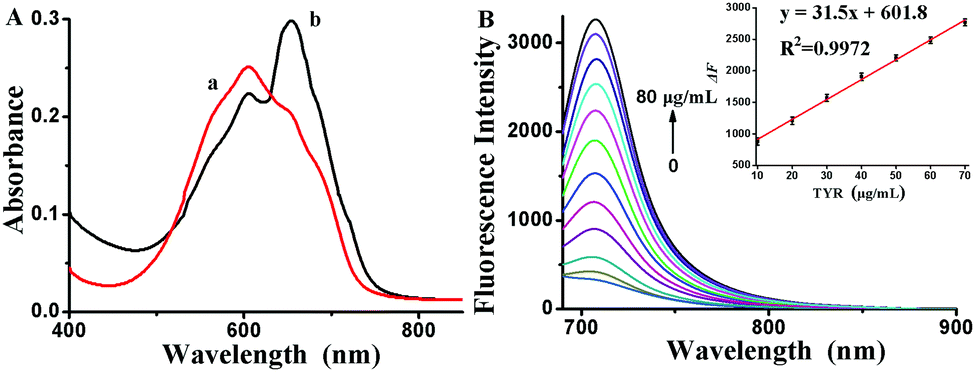
To evaluate whether other substances can interfere with the detection of TYR under the optimal conditions, we next investigated the selectivity of probe 1 which was treated with various interfering substances, such as inorganic salts (KCl, MgCl2, CaCl2, and FeCl3), sugars (glucose), vitamins (VB6, VC), glycine, glutamic acid, cysteine, creatinine, urea, lipase, trypsin, catalase, and biologically relevant ROS (H2O2, TBHP, ONOO−, ClO−, ˙OH, 1O2, NO, and NO2−).12 The results presented in Fig. S9 (ESI†) indicate that the signal of the probe which reacted with TYR was dramatically increased whereas biological substances including ROS did not produce obvious fluorescence responses either. The data indicated that the probe 1 exhibited high selectivity to detect TYR without interference from other substances and excellent reliability in a complex biological environment. In addition, the binding ability of TYR with probe 1 was studied by a docking study. The docking score (−log![[thin space (1/6-em)]](https://www.rsc.org/images/entities/char_2009.gif) Kd) was found to be 8.54, indicating a strong binding affinity between probe 1 and TYR. This is supported by the result of the ribbon model created by Pymol. Fig. 2B shows the details of the binding of 1 to TYR domains with five potential hydrogen bonds shown in yellow dotted lines.
Kd) was found to be 8.54, indicating a strong binding affinity between probe 1 and TYR. This is supported by the result of the ribbon model created by Pymol. Fig. 2B shows the details of the binding of 1 to TYR domains with five potential hydrogen bonds shown in yellow dotted lines.
 | ||
| Fig. 2 (A) The docked conformer of probe 1 at the binding cleft of TYR (generated via Surflex docking-scoring combinations) and (B) the details of the binding of probe 1 to TYR. | ||
Based on the above optimization conditions, we carefully evaluated the sensitivity of the fluorescent response of the probe at different concentrations of TYR, as it is a key parameter for probe performance. Fig. 1B shows an excellent linear correlation (R2 = 0.9972) in the range from 10 to 70 μg mL−1 with a regression equation of ΔF = 31.5 [TYR] (μg mL−1) + 601.8. The detection limit for TYR was 0.11 μg mL−1 based on the signal-to-noise ratio (S/N = 3). Furthermore, we compared probe 1 with some known TYR fluorescent probes in the ESI† (Table S1).
To verify that the fluorescence enhancement was triggered by the reaction of the probe and TYR, Kojic acid, as a standard inhibitor of TYR, was added to the reaction system, which revealed that 100 and 200 μM kojic acid can inhibit the TYR activity, respectively.13 As shown in Fig. S10 (ESI†), when kojic acid was added to the solution containing TYR and probe 1, compared with the control group, the existence of kojic acid led to a dramatic decrease in the fluorescence intensity, and the fluorescence intensity decreased with the increase in the kojic acid concentration. At the same time, kojic acid had little effect on the fluorescence of both the fluorophore and probe 1 when TYR was absent. Therefore, the results indicate that the TYR activity is inhibited by kojic acid, and the fluorescence change of probe 1 and the TYR reaction are indeed caused by the cleavage reaction of the enzyme.
Before cell imaging, the biocompatibility of the probe was evaluated by the standard MTT assay, because cytotoxicity is an important aspect of biological imaging. The results are shown in Fig. S11 (ESI†), which indicate that the probe and the fluorophore exhibited no significant toxicity to B16 cells at 37 °C for 24 h. Thus, the probe 1 has potential applications in living cell systems.
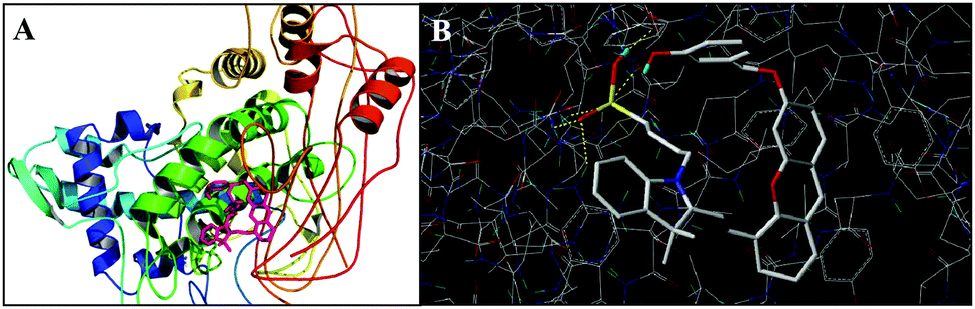
The combination of laser confocal microscopy and fluorescent probes makes it easier and more intuitive to detect TYR in biological systems. In view of the biopermeability and low cytotoxicity of probe 1, we evaluated the response time of probe 1 to TYR in living B16 cells. The fluorescence intensity of B16 cells incubated with probe 1 (10 μM) was observed by confocal laser microscopy at 0 h, 0.5 h, 1 h, 2 h, 3 h, and 4 h, respectively. The morphologies of the cells can be clearly observed in Fig. 3, and the B16 cells treated with probe 1 for 0.5 h exhibited weak fluorescence. However, the fluorescence intensity of the cells gradually increased with time until the maximum intensity was achieved at 3 h, and no significant fluorescence increase was observed at 4 h. As shown in Fig. S12 (ESI†), the fluorescence intensity of the B16 cells treated with 10 μM probe 1 for 0.5 h, 1 h, 2 h, and 4 h decreased to ca. 45%, ca. 65% and ca. 82%, and ca. 97% respectively, with respect to those treated with probe 1 for 3 h defined as 1.0. The observations indicate that the probe 1 can be applied for effective monitoring of intracellular TYR in living B16 cells.
 | ||
| Fig. 3 Confocal fluorescence images of TYR in B16 cells at different times. (a) B16 cells only (control). Then the B16 cells were incubated with 10 μM probe 1 for (b) 0.5 h, (c) 1 h, (d) 2 h, (e) 3 h, and (f) 4 h. The differential interference contrast (DIC) images of the corresponding samples are shown below (panels g–l). Scale bar: 20 μm. | ||
In order to verify whether the fluorescence came from the reaction of probe 1 with TYR, we conducted the following kojic-acid-involved experiments. As displayed in Fig. S13 (ESI†), the cells treated with probe 1 exhibit fluorescence that comes from endogenous TYR in B16 cells. Fluorescence imaging of TYR in HepG2 cells (non-melanoma cell lines) was performed, and almost no fluorescence was observed in HepG2 cells treated with probe 1, because it was reported that TYR expression was mainly limited to melanocytes and was low in HepG2 cells.14 As expected, the fluorescence of cells pre-treated with kojic acid was significantly decreased. The relative pixel intensity measurements obtained from the images of the cells were examined (Fig. S14, ESI†). The fluorescence intensity of the B16 cells treated with 10 μM probe 1 and 200 μM kojic acid decreased to ca. 27%, and that of the HepG2 cells treated with 10 μM probe 1 for 3 h decreased to ca. 28%, with respect to that of the B16 cells treated with probe 1 for 3 h defined as 1.0. We can conclude that the fluorescence does come from the reaction of the probe with TYR.
After proving the feasibility of probe 1 to track TYR in living cells, we further paid more attention to whether probe 1 could be used for monitoring endogenous TYR in zebrafish. According to previous reports, zebrafish express high levels of TYR during the embryonic period, after which TYR is dispersed throughout the body as the zebrafish grows.15 As can be seen from Fig. 4, a 3-day-old zebrafish without any treatment showed no fluorescence. However, after treatment with 10 μM probe 1, strong fluorescence was observed in the body of the zebrafish. This implies that the probe is organism permeable and that the zebrafish contain detectable levels of TYR. Then we performed inhibitor experiments which further proved that the fluorescence came from the reaction between the probe 1 and TYR. The fluorescence intensity of zebrafish treated with kojic acid decreased obviously. The DIC images of the corresponding zebrafish and the relative pixel intensity measurements obtained from the images of zebrafish were examined (Fig. S15 and S16, ESI†). The fluorescence intensity of the living 3-day-old zebrafish treated with 10 μM probe 1 and 100 μM kojic acid decreased to ca. 48%, and that of the zebrafish treated with 10 μM probe 1 and 200 μM kojic acid decreased to ca. 27%, with respect to that of the zebrafish treated with probe 1 for 3 h (defined as 1.0). The results indicate that the probe 1 is capable of monitoring endogenous TYR in zebrafish.
 | ||
| Fig. 4 Fluorescence images of TYR in a living 3-day-old zebrafish (yolk sac and tail): (a and e) zebrafish only (control); (b and f) zebrafish treated with probe 1 (10 μM) for 3 h; (c and g) zebrafish were pre-incubated with 100 μM kojic acid for 1 h and treated with probe 1 (10 μM) for 3 h; (d and h) zebrafish were pre-incubated with 200 μM kojic acid for 1 h and treated with probe 1 (10 μM) for 3 h. Scale bar = 200 μm. | ||
To verify the ability of the probe 1 to detect melanoma in mice, a tumor model was established by subcutaneous injection of melanoma cells (B16) in the right thigh of a BALB/c nude mouse at the age of 5 weeks. The mice were kept for about 2 weeks and then divided into two groups. Then live imaging of the mice was performed using a small animal optical imaging system. We obtained images of the mice after injection of the probe at 0, 60, 90, 120, and 180 min, that are given in Fig. 5.
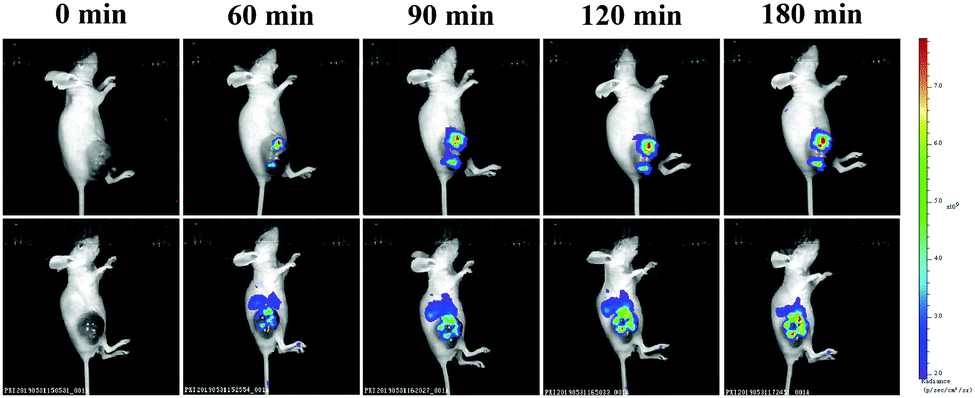 | ||
| Fig. 5 Representative fluorescence images of BALB/c mice (pseudocolor). The mice received an intravenous injection of probe 1 (1 mM, 100 μL) at different times (0, 60, 90, 120, and 180 min). The second group of mice was pre-treated with kojic acid (1 mM, 100 μL) for 60 min, followed by injection of probe 1 (1 mM, 100 μL) into the same region at different times (0, 60, 90, 120, and 180 min). | ||
We can observe weak fluorescence at the tumor site after 60 min of probe injection, indicating that the probe exhibits good tissue permeability and high sensitivity. Within 180 min of monitoring, the fluorescence signal at tumor sites in the mice became more and more obvious over time. The relative pixel intensity measurements obtained from the images of the mice were examined (Fig. S17, ESI†). The fluorescence intensity of the mice treated with probe 1 for 60 min, 90 min, and 120 min decreased to ca. 71%, ca. 83%, and ca. 89%, with respect to that of the mice treated with probe 1 for 180 min (defined as 1.0). The fluorescence intensity of the second group of mice pre-treated with kojic acid (1 mM, 100 μL) for 60 min, followed by injection of probe 1 (1 mM, 100 μL) for 60 min, 90 min, 120 min, and 180 min decreased to ca. 47%, ca. 53%, ca. 69%, and ca. 82%, with respect to that of the mice treated with probe 1 for 180 min (defined as 1.0). A similar time course of the fluorescence signal but 1.3-fold lower in intensity was observed for the mice pre-treated with kojic acid. Compared with the mice injected with probe 1 only, the fluorescence intensity of the mice pre-treated with kojic acid and then injected with probe 1 was significantly weak, indicating that kojic acid effectively inhibited TYR. In vivo TYR imaging may be a promising method for early detection of malignant melanoma.
In summary, this paper reviews the synthesis of near-infrared fluorescent probes and their excellent properties, as well as their application in zebrafish in vivo and in vitro living cell imaging. The probe connected a new water-soluble fluorophore with a recognition group that could avoid ROS interference and specifically recognize TYR. The probe is highly stable over physiological temperature and pH ranges and is capable of accurately detecting TYR in biological systems without interference from ubiquitous entities. In particular, the probe has been successfully applied to the diagnosis of melanoma in a xenogeneic mouse model. It demonstrates favorable characteristics in terms of low toxicity, high specificity, high sensitivity, and stable photo-stability. The superior properties of the probe give it great potential in other biosystems and in vivo imaging studies.
We are grateful for the financial support from the National Natural Science Foundation of China (No. 21605099), the Fundamental Research Funds for the Central Universities, China (GK201802019), and the Shaanxi Province Agricultural Science and Technology Innovation and Key Project (2018NY-099). Financial support from the Young Talent Fund of University Association for Science and Technology in Shaanxi, China (20180207) is also greatly appreciated.
Conflicts of interest
There are no conflicts to declare.Notes and references
- (a) M. U. A. Prathap, C. I. Rodriguez, O. Sadak, J. Guan, V. Setaluri and S. Gunasekaran, Chem. Commun., 2018, 54, 710–714 RSC; (b) C. Zhan, J. Cheng, B. Li, S. Huang, F. Zeng and S. Wu, Anal. Chem., 2018, 90, 8807–8815 CrossRef CAS PubMed; (c) R. Seenivasan, N. Maddodi, V. Setaluri and S. Gunasekaran, Biosens. Bioelectron., 2015, 68, 508–515 CrossRef CAS PubMed.
- (a) X. Wu, X. Li, H. Li, W. Shi and H. Ma, Chem. Commun., 2017, 53, 2443–2446 RSC; (b) H. Li, W. Liu, F. Zhang, X. Zhu, L. Huang and H. Zhang, Anal. Chem., 2018, 90, 855–858 CrossRef CAS PubMed; (c) E. Solem, F. Tuczek and H. Decker, Angew. Chem., Int. Ed., 2016, 55, 2884–2888 CrossRef CAS PubMed; (d) C. Bochot, A. Gouron, L. Bubacco, A. Milet, C. Philouze, M. Reglier, G. Serratrice, H. Jamet and C. Belle, Chem. Commun., 2014, 50, 308–310 RSC.
- (a) X. Li, W. Shi, S. Chen, J. Jia, H. Ma and O. S. Wolfbeis, Chem. Commun., 2010, 46, 2560–2562 RSC; (b) H. Ao, Z. Qian, Y. Zhu, M. Zhao, C. Tang, Y. Huang, H. Feng and A. Wang, Biosens. Bioelectron., 2016, 86, 542–547 CrossRef CAS PubMed; (c) J. Zhou, W. Shi, L. Li, Q. Gong, X. Wu, X. Li and H. Ma, Anal. Chem., 2016, 88, 4557–4564 CrossRef CAS PubMed.
- (a) Z. Li, Y. F. Wang, X. Zhang, C. Zeng, L. Hu and X. J. Liang, Biosens. Bioelectron., 2017, 242, 189–194 CrossRef CAS PubMed; (b) X. Yan, H. Li, W. Zheng and X. Su, Anal. Chem., 2015, 87, 8904–8909 CrossRef CAS PubMed; (c) T. I. Kim, J. Park, S. Park, Y. Choi and Y. Kim, Chem. Commun., 2011, 47, 12640–12642 RSC.
- (a) H. B. Yildiz, R. Freeman, R. Gill and I. Willner, Anal. Chem., 2008, 80, 2811–2816 CrossRef CAS PubMed; (b) R. F. Boyer, J. Chem. Educ., 1977, 54, 585–586 CrossRef CAS PubMed; (c) J. C. Espin, M. Morales, R. Varón, J. Tudela and F. Garcia-Canovas, J. Food Sci., 1996, 61, 1177–1182 CrossRef CAS; (d) J. Wei, J. Qiu, L. Li, L. Ren, X. Zhang, J. Chaudhuri and S. Wang, Nanotechnology, 2012, 23, 335707 CrossRef PubMed; (e) S. Li, L. Mao, Y. Tian, J. Wang and N. Zhou, Analyst, 2012, 137, 823–825 RSC; (f) R. Freeman, J. Elbaz, R. Gill, M. Zayats and I. Willner, Chem. – Eur. J., 2007, 13, 7288–7293 CrossRef CAS PubMed.
- (a) D. Li, R. Gill, R. Freeman and I. Willner, Chem. Commun., 2006, 5027–5029 RSC; (b) R. Baron, M. Zayats and I. Willner, Anal. Chem., 2005, 77, 1566–1571 CrossRef CAS PubMed.
- (a) Y. Teng, X. Jia, J. Li and E. Wang, Anal. Chem., 2015, 87, 4897–4902 CrossRef CAS PubMed; (b) J. Sun, H. Mei, S. Wang and F. Gao, Anal. Chem., 2016, 88, 7372–7377 CrossRef CAS PubMed; (c) S. Li, R. Hu, S. Wang, X. Guo, Y. Zeng, Y. Li and G. Yang, Anal. Chem., 2018, 90, 9296–9300 CrossRef CAS PubMed.
- (a) W. Chen, S. Xu, J. J. Day, D. Wang and M. Xian, Angew. Chem., Int. Ed., 2017, 56, 16611–16615 CrossRef CAS PubMed; (b) Y. Fang, W. Chen, W. Shi, H. Li, M. Xian and H. Ma, Chem. Commun., 2017, 53, 8759–8762 RSC; (c) J. Zhang, X. Zhen, J. Zeng and K. Pu, Anal. Chem., 2018, 90, 9301–9307 CrossRef CAS PubMed; (d) M. Peng, Y. Wang, Q. Fu, F. Sun, N. Na and J. Ouyang, Anal. Chem., 2018, 90, 6206–6213 CrossRef CAS PubMed; (e) X. W. Tian, Z. Li, Y. Sun, P. Wang and H. M. Ma, Anal. Chem., 2018, 90, 13759–13766 CrossRef CAS PubMed.
- (a) J. Kim and Y. Kim, Analyst, 2014, 139, 2986–2989 RSC; (b) W. Zhang, P. Li, F. Yang, X. Hu, C. Sun, W. Zhang, D. Chen and B. Tang, J. Am. Chem. Soc., 2013, 135, 14956–14959 CrossRef CAS PubMed; (c) H. Zhang, J. Liu, Y. Q. Sun, Y. Huo, Y. Li, W. Liu, X. Wu, N. Zhu, Y. Shi and W. Guo, Chem. Commun., 2015, 51, 2721–2724 RSC.
- X. Wu, L. Li, W. Shi, Q. Gong and H. Ma, Angew. Chem., Int. Ed., 2016, 55, 14728–14732 CrossRef CAS PubMed.
- (a) D. Li, Z. Li, W. Chen and X. Yang, J. Agric. Food Chem., 2017, 65, 4209–4215 CrossRef CAS PubMed; (b) K. Liu, H. Shang, X. Kong, M. Ren, J. Y. Wang, Y. Liu and W. Lin, Biomaterials, 2016, 100, 162–171 CrossRef CAS PubMed; (c) J. Hou, M. Qian, H. Zhao, Y. Li, Y. Liao, G. Han, Z. Xu, F. Wang, Y. Song and Y. Liu, Anal. Chim. Acta, 2018, 1024, 169–176 CrossRef CAS PubMed; (d) X. Liu, H. Tian, L. Yang, Y. Su, M. Guo and X. Song, Biosens. Bioelectron., 2018, 255, 1160–1165 CAS.
- W. Chen, A. Pacheco, Y. Takano, J. J. Day, K. Hanaoka and M. Xian, Angew. Chem., Int. Ed., 2016, 55, 9993–9996 CrossRef CAS PubMed.
- T. S. Chang, Int. J. Mol. Sci., 2009, 10, 2440–2475 CrossRef CAS PubMed.
- A. M. Jordan, T. H. Khan, H. Malkin and H. M. I. Osborn, Bioorg. Med. Chem., 2002, 10, 2625–2633 CrossRef CAS PubMed.
- E. Camp and M. Lardelli, Dev. Genes Evol., 2001, 211, 150–153 CrossRef CAS PubMed.
Footnote |
| † Electronic supplementary information (ESI) available: Apparatus and reagents, and other supporting data. See DOI: 10.1039/c9cc04714j |
| This journal is © The Royal Society of Chemistry 2019 |