Target induced aggregation of modified Au@Ag nanoparticles for surface enhanced Raman scattering and its ultrasensitive detection of arsenic(III) in aqueous solution†
Bo Yangabc,
Xiaochun Chenab,
Renyong Liuac,
Bianhua Liuabc and
Changlong Jiang*abc
aInstitute of Intelligent Machines, Chinese Academy of Sciences, Hefei, Anhui 230031, China. E-mail: cljiang@iim.ac.cn
bDepartment of Chemistry, University of Science & Technology of China, Hefei, Anhui 230026, China
cState Key Laboratory of Transducer Technology Chinese Academy of Sciences, Hefei, Anhui 230031, China
First published on 9th September 2015
Abstract
A highly sensitive surface-enhanced Raman scattering (SERS) approach for the selective detection of trace arsenic ions was reported based on cationic polymer (PDDA) and 4-mercaptopyridine (4-MPY)-modified Au@Ag nanoparticles (Au@AgNPs) as the effective enhanced substrate, in which 4-MPY was used the Raman reporter. When As(III) ions were added to the system, As(III) specifically interacts with the Ars-3 aptamer to form an As(III)–aptamer complex, so that the PDDA can aggregate 4-MPY-modified Au@AgNPs and cause the dramatically enhancement of the Raman signals. Under optimal assay conditions, the limit of detection (LOD) was estimated to be as low as 59 ppt, which is lower than the WHO defined limit (10 ppb). The determination of As(III) in real water samples was also carried out to confirm the practicability of our method. Therefore, the target induced aggregation of modified Au@AgNPs enhanced Raman spectroscopic technique offers great potential practical applications for the on-site and ultrasensitive detection of As(III) in environments.
1. Introduction
Arsenic is a toxic substance and it may cause various cancers and other serious diseases after long-term exposure to arsenic.1 Arsenic contamination in drinking water and groundwater is becoming a threat to global health, and as many as 140 million people worldwide may have been exposed to drinking water with arsenic contamination levels higher than the World Health Organization's (WHO) guideline of 10 ppb.2,3 Although arsenic exists in many different chemical forms in nature, we all known that the major arsenic species found in environment samples are inorganic arsenite (As(III) as H3AsO3) and arsenate (As(V) as H3AsO4) in water, organic forms of arsenic, for example, dithioarsenate (DTA), dimethylarsenic acid (DMA) and monomethylarsenic acid (MMA).4–6 As(III) is one of the most harmful substances in water to human health, and its toxicity is at least as 60 times as of As(V) or organic arsenic compounds.7 Very recently, kinds of analytical techniques for the detection of As(III) at the trace level have been developed, such as high-performance liquid chromatography (HPLC),8,9 atomic fluorescence spectrometry (AFS),10–12 inductively coupled plasma-mass spectrometry (ICP-MS),13–15 etc. Although these analytic methods can achieve low detection limits, they still have some limitations such as being costly, being time consuming and having high skill requirements for operation. Thus, there is still a necessity to develop a simple, fast and highly sensitive analytic method for the detection of As(III) in environments.Surface-enhanced Raman scattering (SERS) technique, which can provide higher detection sensitivity, has been applied in many fields due to its incomparable advantages. It is well known that the mechanisms to account for the origin of SERS are electromagnetic (EM) and chemical or charge transfer (CT) mechanisms.16,17 It is commonly regarded that SERS enhancement mainly based on the giant EM enhancement caused by nanostructured noble metal surfaces and associated to their localized plasmon resonance (LPR).16,18 Therefore, an excellent substrate in SERS research is very important.19 It is well documented that the Raman enhanced ability of Au@AgNPs is stronger than other metal substrates such as Au and AgNPs.20 In recent years, some applications of SERS analysis methods based on metal nanoparticles have been reported. Chen and coworkers have respectively detected trypsin, heparin and As3+ ions by using 4-mercaptopyridine (4-MPY) functionalized AgNPs.21–23 Wang et al. reported nanomaterial-assisted aptamers for optical sensing.24 In this paper we demonstrated a highly sensitive SERS platform for As(III) detection based on the linear enhancement of SERS due to target induced aggregation of 4-MPY-modified Au@AgNPs, which is controlled by a cationic polymer and an Ars-3 aptamer. In the absence of As(III), the Ars-3 aptamers will be free and to form a “duplex” structure with poly(diallyldimethylammonium) (PDDA) by hybridizing, so that the subsequent 4-MPY-modified Au@AgNPs will be dispersed owing to the lack of PDDA,25 and the SERS signal will be very low. When the As(III) concentration increased, the Ars-3 aptamer will firstly form an aptamer/As(III) complex with As(III).25 Electrosteric stabilization is the major factor for 4-MPY-modified Au@AgNPs to remain dispersed in aqueous solution. Generally, the positively charged material, such as cationic polymer and high concentration of sodium, can disturb the charge balance of the 4-MPY-modified Au@AgNPs and cause them aggregate. Thus the subsequent PDDA can aggregate 4-MPY-modified Au@AgNPs, which leads to the linear enhancement of SERS signal. The enhancement of SERS signal of solution depends on the concentration of PDDA, which is in turn conditioned directly by the content of As(III). Therefore, this experimental scheme makes it possible to detect As(III) by SERS assay. Under optimal assay conditions, the limit of detection (LOD) of our SERS assay was estimated to be as low as 59 ppt. The simple, rapid and ultrasensitive Raman detection strategy using target induced aggregation of NPs shows great practical potential for the on-site and the ultrasensitive detection of trace As(III) in environments.
2. Experimental section
2.1 Materials
Sodium citrate (Na3C6H5O7·2H2O, 99.8%), chloroauric acid (HAuCl4·4H2O, 99.9%), silver nitrate (AgNO3, 99%), and ascorbic acid (99%) were purchased from Sinopharm Chemical Reagent Co., Ltd. (Shanghai, China). The sequence of Ars-3 aptamer is reference to previous literatures and was synthesized by Sangon Biotechnology Co., Ltd. (Shanghai, China). Its sequence are showed in Fig. S1(a).† Poly(diallyldimethylammonium chloride) (PDDA) Sigma-Aldrich (Milwaukee, Wl, USA). 4-Mercaptopyridine (4-MPY, 95%) were obtained from Sigma-Aldrich (USA). The concentration of As(III) stock solution was 100 ppm, the As(III) and other metal salts were obtained from our laboratory. The chemical structure of them are displayed in Fig. S1(b)–(d).† All glassware will be cleaned in a bath of freshly prepared 3![[thin space (1/6-em)]](https://www.rsc.org/images/entities/char_2009.gif) :
:![[thin space (1/6-em)]](https://www.rsc.org/images/entities/char_2009.gif) 1 (v/v) HNO3–HCl, then rinsed thoroughly in ultrapure water and dried in air prior to use. Ultrapure water (18.2 MΩ cm) was produced using Millipore water purification system.
1 (v/v) HNO3–HCl, then rinsed thoroughly in ultrapure water and dried in air prior to use. Ultrapure water (18.2 MΩ cm) was produced using Millipore water purification system.
2.2 Synthesis of Au nanoparticles (Au NPs)
100 mL of ultrapure water was heated to 80–90 °C under magnetic stirring and then added 0.25 mL of 0.1 M HAuCl4. Quickly injecting 1.5 mL of 1% trisodium citrate after the above solution boiled. The mixed solution was refluxed for ∼0.5 h and then the colour of mixed solution became wine red. Finally, the above solution was gradually cooled to room temperature under stirring.2.3 Synthesis of Au@AgNPs
Typically, 12 mL of 0.1 M ascorbic acid was added into the above solution under magnetic stirring. Then 15 mL of 2 mM AgNO3 was dropwise added into the above solution at a rate of one drop per 30 s. The ascorbic acid reduced silver nitrate and the resultant silver grew at the surface of Au seeds. In the meanwhile, the solution changed from the wine red into orange yellow. The solution was stirred until all of the AgNO3 was added and the Au@AgNPs were obtained.2.4 Functionalization of Au@AgNPs with 4-MPY
The Au@AgNP surfaces were modified by addition of 10 μL 4-MPY to a solution of 2 mL of Au@AgNPs with stirring for 2 h. The mixture was subsequently left for overnight without disturbance at room temperature.2.5 SERS detection of As(III)
An appropriate volume of 50 nM Ars-3 aptamer solution and 5 μL various concentration NaAsO2 solution were mixed thoroughly in a 2 mL plastic tube, and then diluted to 390 μL with ultrapure water and incubated at 25 °C for 30 min. The blank sample was added 5 μL ultrapure water instead As(III) solution. Subsequently, 10 μL PDDA was added into the above mixed solutions and incubated at 25 °C for another 30 min. Finally, 100 μL 4-MPY-modified Au@AgNPs stock solution was added to give a final volume of 500 μL. After incubation at 25 °C for 5 min, about 5 μL of the above solution in the capillary tube was detected by laser Raman spectrometer.2.6 Instrument
UV-vis absorption spectra were recorded with a Shimadzu UV-2550 spectrometer. SEM images were taken by field-emission scanning microscopy (FE-SEM, Sirion 200). Raman measurements were conducted with a Thermo Fisher DXR Raman microscope equipped with a CCD detector with an excitation wavelength of 532 nm. The laser beam was focused to a spot of about 1 μm2 by a 50 × microscope objective. The Raman spectra were recorded using 532 nm laser with 0.2 mW power and a 50 × objective (1 μm2 spot). The integral time was 2 s and the slit aperture was 25 μm.3. Results and discussion
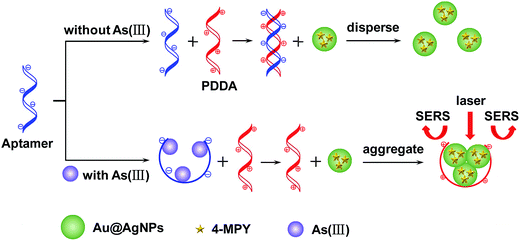
Fig. 1 demonstrates the schematic illustration of SERS detection of trace As(III) based on the target induced aggregation of functionalized Au@AgNPs which are mediated by PDDA and Ars-3 aptamer. PDDA, a water-soluble cationic polymer, has two functions in the sensing strategy: (1) it leads the 4-MPY-modified Au@AgNPs to aggregate, and (2) hybridizes the aptamer through the electrostatic interaction. In the absence of As(III), the Ars-3 aptamers will be free and can hybridize with PDDA to form a “duplex” structure, so that the subsequent 4-MPY-modified Au@AgNPs will disperse due to the lack of PDDA. On adding As(III) into the solution, the Ars-3 aptamer is exhausted firstly owing to the formation of an aptamer/As(III) complex, thus 4-MPY-modified Au@AgNPs will be aggregated because of the PDDA, which induces the enhancement of the Raman signals. The enhancement of the Raman signals depends on the concentration of PDDA, which is in turn conditioned directly by the content of As(III). Therefore, this strategy makes it possible to detect As(III) by SERS. | ||
| Fig. 1 Schematic description of SERS detection of As(III) based on the aggregation of 4-MPY-modified Au@AgNPs that is mediated by PDDA and Ars-3 aptamer. | ||
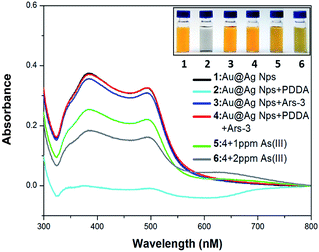
The UV-vis spectra measurement was utilized to confirm the interaction of the Ars-3 aptamer to As(III) and PDDA. As displayed Fig. 2, in case of 5.2 × 10⁻⁷ g mL−1 of PDDA, the UV-vis absorption spectra of solutions changed and the A392 value decreased to the lowest point and the color of the solutions changed instantly from orange to transparent color, which demonstrated that the Au@AgNPs was aggregated absolutely by PDDA. On adding 11.5 nM of aptamer or the mixture of 11.5 nM of aptamer and 5.2 × 10⁻⁷ g mL−1 of PDDA, the UV-vis absorption spectra of solutions have no change and the color of the solutions still keeps orange. It revealed that aptamer hybridized with PDDA through the electrostatic interaction and aptamer had no interaction with Au@AgNPs. When injecting 1 ppm or 2 ppm As(III) into the solution of Au@AgNPs, 11.5 nM of aptamer and 5.2 × 10⁻⁷ g mL−1 of PDDA, the UV-vis absorption spectra of solutions decreased and the color of the solutions changed gradually from orange to light gray. Based on above analysis, we can know that this strategy of detection As(III) is feasible. Fig. S2† further illustrates that the aggregation of 4-MPY-modified Au@AgNPs was controlled by the interaction among PDDA, aptamer and As(III). Pure 4-MPY-modified Au@AgNPs dispersed with an average particle diameter of 45 nm (sample 1). The 4-MPY-modified Au@AgNPs gathered thoroughly in the presence of 5.2 × 10⁻⁷ g mL−1 of PDDA (sample 2), but the introduction of an aptamer did not aggregate 4-MPY-modified Au@AgNPs (sample 3). When PDDA was added into Ars-3 aptamer solution, all of them would exhaust because of the hybridization with DNAs. Thus, the following 4-MPY-modified Au@AgNPs dispersed in the absence of PDDA (sample 4). Afterwards, the biosensor was used to detect As(III), and the results reveal that 4-MPY-modified Au@AgNPs aggregated gradually (samples 5 and 6), which leads to considerable changes in the color and absorption spectra of solutions.
The concentration of PDDA, Ars-3 aptamer and 4-MPY are critical to the performance of biosensor. To obtain the optimum sensing conditions, the various concentrations of PDDA were injected into the constant Au@AgNPs solutions. The absorption spectra and absorbance values of Au@AgNPs solutions are presented in Fig. S2.† The results exhibit that 5.2 × 10⁻⁷ g mL−1 of PDDA is sufficient to aggregate all of Au@AgNPs. The effect of Ars-3 aptamer is showed in Fig. S3.† And the result reveals that 11.5 nM of aptamer is suitable for the biosensor. In this study, the 4-MPY was chosen as the Raman reporter. The effect of the concentration of the reporter on SERS signal intensity was investigated, and the corresponding Raman spectra were shown in Fig. S4(a) and (b).† It was found that the Raman signal was enhanced with the increasing of the concentration of 4-MPY. When the concentration of 4-MPY was 5 μM, the Raman signal was the lowest. Thus, a concentration of 5 μM was selected for 4-MPY throughout the study. Unless otherwise mention, the following experiments were done at the optimized conditions.
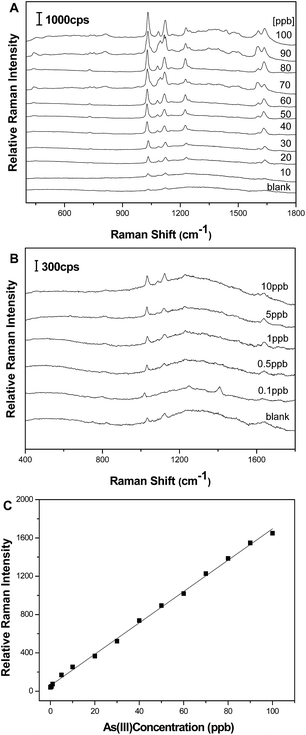
SERS spectra of 4-MPY modified Au@AgNPs with different As(III) concentrations were displayed in Fig. 3A and B. There are many characteristic peaks of 4-MPY which can be used for indirect quantitative determination of As(III), such as those at 712, 1018, 1067, 1100, 1280, 1599, and 1614 cm−1. According to the spectra, the peak around 1018 cm−1 corresponding to the ring breathing/C–S stretching mode indicates that 4-MPY was bound to the surface of the Au@AgNPs through the sulfur atom, and its intensity was very sensitive to the concentration of As(III). Therefore the SERS peak at 1018 cm−1 was selected as an instructive peak for the quantitative detection of the As(III). This relationship is displayed in Fig. 3C where the variation of the intensity of the 1018 cm−1 4-MPY peak is plotted as a function of As(III) concentration. Under the optimal conditions, it can be seen that the detection linear range was obtained from 0.1 to 100 ppb (R2 = 0.998). Additionally, the limit of detection (LOD) (based on a minimum signal-to-noise ratio of 3) of the As(III) was determined to be 59 ppt which is lower than the WHO defined limit (10 ppb).
To confirm the sability of the sensing system, we investigate the effect of the time on the Raman signal intensity. As shown in Fig. S6,† it can be seen that our sensing system is stable and reliable.
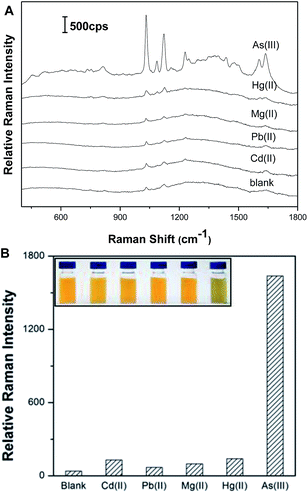
Under optimized conditions, we investigated the selectivity of our approach toward 100 ppb As(III) (1.34 μM) against other metal ions (Cd2+, Hg2+, Mg2+, Pb2+, at a concentration of 1.34 μM). As shown in Fig. 4, only the addition of As(III) could induce the significant increase of the SERS signals. Contrarily, there was slight and negligible SERS signal for any other metal ions. These results demonstrate that our system has the excellent selectivity of the biosensor for As(III) detection.
To test the practicality of our method, we investigate samples of local drinking water by spiking different concentrations of As(III) ions to tap water without any treatment. As shown in Table 1, excellent recoveries were obtained, including 101.6, 101.2, and 99.6% for the spiked drinking water samples with 10, 20, 30 ppb As(III) standard solution respectively. It indicated this method could serve as a practical and convenient method for the primary screening of As(III) ions pollution.
| Sample | Added (ppb) | Found (ppb) | Recovery (%) |
|---|---|---|---|
| 1 | 10 | 10.16 ± 0.87 | 101.6 |
| 2 | 20 | 20.23 ± 0.48 | 101.2 |
| 3 | 30 | 29.88 ± 0.56 | 99.6 |
4. Conclusion
In conclusion, we have demonstrated a highly sensitive and selective method for the detection of As(III) in aqueous media via SERS technique. The design is based on the aggregation of 4-MPY-modified Au@AgNPs that is controlled by the interaction among PDDA, aptamer and As(III). In the presence of As(III), the aptamer is exhausted firstly because of the formation of an aptamer/As(III) complex, so that the following PDDA aggregates 4-MPY-modified Au@AgNPs, which leads to the significant increase of the SERS signals. The experimental results showed that As(III) in aqueous solution can be detected as low as 59 ppt with high selectivity against other metal ions. This simple, rapid, cost-effective, sensitive, and selective sensing system holds great potential for practical application.Acknowledgements
This work was supported by The National Basic Research Program of China (No. 2015CB932002), Natural Science Foundation of China (No. 21371174, 21175137, 21275145, 21277145, 21375131, 21475135, 61205152), and the National Science &Technology Pillar Program (Grant 2012BAJ24B02).Notes and references
- D. Mohan and C. U. Pittman Jr, J. Hazard. Mater., 2007, 142, 1–53 CrossRef CAS PubMed.
- W. R. Cullen and K. J. Reimer, Chem. Rev., 1989, 89, 713–764 CrossRef CAS.
- J. R. Kalluri, T. Arbneshi, S. A. Khan, A. Neely, P. Candice, B. Varisli, M. Washington, S. McAfee, B. Robinson, S. Banerjee, A. K. Singh, D. Senapati and P. C. Ray, Angew. Chem., Int. Ed., 2009, 48, 9668–9671 CrossRef CAS PubMed.
- A. A. Ensafi, A. C. Ring and I. Fritsch, Electroanalysis, 2010, 22, 1175–1185 CrossRef CAS PubMed.
- M. M. Moriarty, I. Koch, R. A. Gordon and K. J. Reimer, Environ. Sci. Technol., 2009, 43, 4818–4823 CrossRef CAS.
- W. R. Cullen and K. J. Reimer, Chem. Rev., 1989, 89, 713–764 CrossRef CAS.
- B. K. Jena and C. R. Raj, Anal. Chem., 2008, 80, 4836–4844 CrossRef CAS PubMed.
- K. H. Al-Assaf, J. F. Tyson and P. C. Uden, J. Anal. At. Spectrom., 2009, 24, 376–384 RSC.
- C. M. Perez, J. M. Pineiro, P. L. Mahia, S. M. Lorenzo, E. F. Fernandez and D. P. Rodriguez, J. Chromatogr. A, 2008, 1215, 15–20 CrossRef PubMed.
- N. Zhang, N. Fu, Z. Fang, Y. Feng and L. Ke, Food Chem., 2011, 124, 1185–1188 CrossRef CAS PubMed.
- L. Liu, Q. Zhou, C. Zheng, X. Hou and L. Wu, At. Spectrosc., 2009, 30, 59–64 CAS.
- K. Ito, C. D. Palmer, W. T. Corns and P. J. Parsons, J. Anal. At. Spectrom., 2010, 25, 822–830 RSC.
- J. Kritsana, O. Mitsuko and M. Shoji, Talanta, 2005, 66, 529–533 CrossRef PubMed.
- R. A. Gil, N. Ferrua, J. A. Salonia and L. D. Martinez, J. Hazard. Mater., 2007, 143, 431–436 CrossRef CAS PubMed.
- V. Dufailly, L. Noel and T. Guerin, Anal. Chim. Acta, 2008, 611, 134–142 CrossRef CAS PubMed.
- M. Moskovits, Rev. Mod. Phys., 1985, 57, 783–826 CrossRef CAS.
- A. Otto, I. Mrozek, H. Grabhorn and W. Akemann, J. Phys.: Condens. Matter, 1992, 4, 1143–1212 CrossRef CAS.
- Y. B. Han, S. J. Liu, B. H. Liu, C. L. Jiang and Z. P. Zhang, RSC Adv., 2014, 4, 2776–2782 RSC.
- Y. Q. Wang, B. Yan and L. X. Chen, Chem. Rev., 2013, 113, 1391–1428 CrossRef CAS PubMed.
- B. H. Liu, G. M. Han, Z. P. Zhang, R. Y. Liu, C. L. Jang, S. H. Wang and M. Y. Han, Anal. Chem., 2012, 84, 255–261 CrossRef CAS PubMed.
- L. Q. Chen, X. L. Fu and J. H. Li, Nanoscale, 2013, 5, 5905–5911 RSC.
- X. K. Wang, L. Chen, X. L. Fu, L. X. Chen and Y. J. Ding, ACS Appl. Mater. Interfaces, 2013, 5, 11059–11065 CAS.
- J. L. Li, L. G. Chen, T. T. Lou and Y. Q. Wang, ACS Appl. Mater. Interfaces, 2011, 3, 3936–3941 CAS.
- G. Q. Wang, Y. Q. Wang, L. X. Chen and J. B. Choo, Biosens. Bioelectron., 2010, 25, 1859–1868 CrossRef CAS PubMed.
- Y. G. Wu, S. S. Zhan, F. Z. Wang, L. He, W. T. Zhi and P. Zhou, Chem. Commun., 2012, 48, 4459–4461 RSC.
Footnote |
| † Electronic supplementary information (ESI) available. See DOI: 10.1039/c5ra15954g |
| This journal is © The Royal Society of Chemistry 2015 |


