Conductive silver inks and their applications in printed and flexible electronics
Venkata Krishna Rao R.
a,
Venkata Abhinav K.
a,
Karthik P. S.
a and
Surya Prakash Singh
*ab
aInorganic and Physical Chemistry Division, CSIR-Indian Institute of Chemical Technology, Uppal Road, Tarnaka, Hyderabad-500007, India
bNetwork Institute of Solar Energy (CSIR-NISE) and Academy of Scientific and Innovative Research (AcSIR), New Delhi, India. E-mail: spsingh@iict.res.in
First published on 25th August 2015
Abstract
Conductive inks have been widely investigated in recent years due to their popularity in printed electronics (PE) and flexible electronics (FE). They comprise specific and unique applications that belong to a whole new level of future technology. In this context, silver is a keenly researched material for its promising application in conductive inks. In printing technology, silver conductive inks have a major role in electronic applications. The emerging integration of different technologies is in the form of silver nanoinks. In recent years, the printed electronics market has been dominated by expensive materials such as gold, platinum, etc., which result in costly and complex instruments. To overcome these drawbacks, silver conductive inks can serve as alternative to the current technology. Presently, printed circuit boards (PCBs) use complex and expensive techniques to fabricate the circuit boards, which in turn increases the overall cost. Solvent-based silver conductive inks are capable of substituting PCB technology while reducing the cost of manufacturing. Due to their stellar reputation, investors are looking forward to applying this technology in printed electronics industries.
1. Introduction
Any technology is adopted commercially when it has the potential for sustained, long-term significance in diverse applications. The development of conductive ink is worthy of such attention. Silver conductive ink has its own prominence among various conductive inks. This prominence is due to its novelty in being applied to diverse fields of technology. Inherently, silver itself is an incredible material and abundantly available on our planet. Silver conductive inks have silver in nanoform, which is extensively engaging the nanotechnology community.Silver in the nanometer range has predominantly occupied the interest of researchers since the beginning of the nanotechnology era. Silver was and is considered a prominent material; and even historically silver has its own importance. This material has been prospering in its applications ever since researchers focused on its study in the nanoscale, which has led to promising applications in many fields of science and technology. The properties that make silver suitable are that it is rare, strong, corrosion resistant, and unaffected by moisture. Silver is also resonant, moldable, malleable, and possesses the highest thermal and electric conductivity of any substance. Silver is one of the strongest oxidants; it is an essential catalyst for the chemical process industry.
Metal nanoparticles act as a key element in conductive inks. In nano range, silver has gained so much prominence that it does not require any special introduction about its enhanced properties possessed in the nanometer range. Silver nanoparticles (Ag NPs) have been synthesized using different types of approaches, and each type of synthesis has its own advantages and disadvantages. Silver has unique and enhanced properties in the nanometer range by possessing the highest electrical conductivity per unit volume when compared to any other metal, so it is expected to be used extensively in printed electronics technology. In this review, we try to highlight the methods that were successful in the synthesis of conductive ink derived from silver nanomaterial. This work is an attempt to understand the significance of silver-based conductive inks and to motivate researchers who opt to bring about change in future electronics. We focused this review on gathering a brief preface of all the possible methods of synthesis, the chemicals used, the process followed, and the broad applications of silver-based conductive ink.
Silver ink has been studied and formulated for the past three decades.1 Since then, many improvements have been applied to bring it to its current advanced state.2–9 Conductive silver ink is being investigated for a wide variety of applications10–16 and also blended with other composites.17–21
1.1 Why is conductive ink a chief priority in the scientific community?
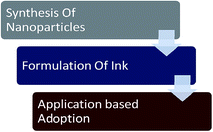
Technology is advancing day by day, and in this advancement race we need material that will support and encourage further advancement. Conductive inks mark one of the top places on the list. The reach of conductive inks lies in the application of the next level of technological advancement, such as flexible and printable electronics, which comprise a major area of application of conductive inks. There is great necessitate in the present market as well as serious competition between technological giants in producing such type of appliances, which not only simplify lifestyle but also fetch major attention. Thus, in this regard, silver ink stands as the best option in hand for researchers worldwide. It should also be noted that a few other conductive inks have also been synthesized using other conductive metals such as copper,22–26 platinum,27 gold,28,29 tin,30 and iron.8 A few carbon allotropes,31 which are known for their outstanding properties, have also been used for formulating inks such as CNT32,33 and graphene.35–38 Other than these polymers,39,40 hybrid inks41–44 are also being successfully used for conductive inks. However, their applications are limited in comparison to silver ink; their applications do not cover as wide an area as silver. The fascinating fact is that not all the conductive metal elements can be easily synthesised to formulate an ink—the consequences in ink formulation are high and have a negative impact on the properties, which in turn makes the products fall behind silver ink. Fundamentally, there are three challenges involved in synthesizing conductive silver ink (Scheme 1).These three challenges are further classified and discussed below, with focus on each aspect and its prominence.
2. Techniques to synthesise Ag NPs
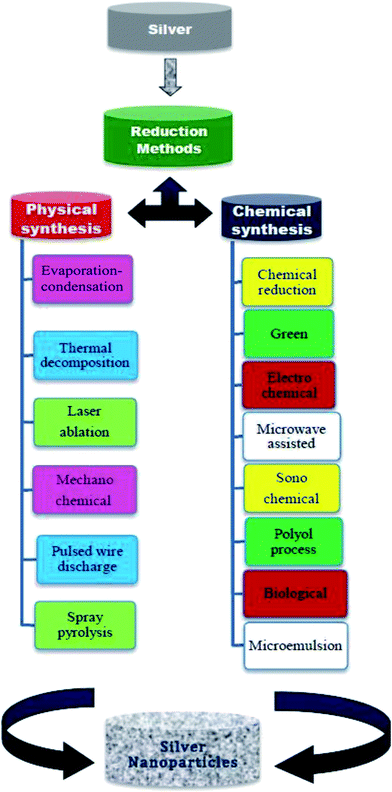
Many methods have been reported for the synthesis of Ag NPs by using chemical, physical, and electrochemical reduction routes. Each method has its own advantage and disadvantage primarily with cost and particle size. Among the methods, cost-wise, the chemical reduction method is the best process for the synthesis of Ag NPs. Chemical methods provide an easy way to synthesize Ag NPs in solution. Achieving the best result by following the best method of synthesizing Ag NPs is our second priority, the first being the best formulation of ink. We have mentioned in brief each method for the synthesis of Ag NPs. Although not all Ag NPs synthesized by different methods have been used to synthesize silver ink, our interest is to put all the possible methods of synthesis in one paper for a better understanding. In order to fully understand the formulation and challenges faced in synthesizing the conductive silver ink, the first analysis should be done on the synthesis of Ag NPs. Close observation is needed, as there is a very wide range of synthesis techniques, chemicals, and challenges. Acquiring the perfect Ag NPs will solve the first and foremost challenge in synthesizing the conductive silver ink. Hence, it is very important to master the synthesis of Ag NPs (Scheme 2).2.1 Different methods for synthesis of Ag NPs
A wide variety of chemicals and methods have been adopted in the synthesis of Ag NPs in the past decade. Each method and chemical plays its own part in the factors affecting the synthesis of Ag NPs. A brief introduction and comparison on two major types, i.e., physical and chemical, are discussed below:2.2 Physical methods
The physical approach is the top-down approach, and it is also called a high-energy method. Top down is a process in which microsized particles are broken down to nanosized particles, either by mechanical force or evaporation/condensation.48 The evaporation is done by thermal heating or plasma excitation of the solid, microsized particles, powders, plates or wires. The vapour or plasma is transferred onto a substrate by inert gas media. Silver synthesized by physical methods has particle sizes ranging from 4–10 nm.50 The benefit of the physical method of synthesis is that it results in dry nanoparticles, i.e., the resultant nanoparticles are not in liquid medium; hence it is suitable for dry applications. The other prominent approach is laser ablation, in which the bulk particles are dispersed in aqueous media and irradiated with powerful lasers. The irradiation causes the reduction in size by providing enough energy to break down the bulk material into smaller particles.51,52 The physical method has less chemicals involved compared to chemical methods, which is an added benefit. The drawback of the physical method is that it involves sophisticated instruments, and the total cost involved in synthesis is very high compared to the bottom-up approach.Makitalo et al.56 synthesized Ag NPs by evaporation–condensation. It is also called the inert gas condensation technique. In this method, the sacrificial metallic source is resistively heated inside a high vacuum chamber. The silver atoms inside the chamber collide with the gas atoms and lose their kinetic energy, thus condensing to form small-sized particles. A liquid nitrogen-filled cold finger is placed inside the chamber, on which metallic particles deposit. This technique can be used to prepare metallic nanoparticle alloys as well as oxides, nitrides, carbides, etc.
Laser ablation is the ejection of a particular material from a surface by laser irradiation. It is useful for non-equilibrium vapour/plasma conditions created at the surface by intense laser pulse. The two essential components in a laser ablation instrument are the pulse laser and the ablation chamber.
A high-power laser beam is induced on the target material, which rapidly increases in temperature and vaporizes into a laser plume. The vaporized material condensates into clusters and is collected on a glass fibre mesh. The collected nanoparticles can be used for further applications.51 The synthesis of silver nanoparticle colloid by laser ablation technique in aqueous medium was attained by Zamiri et al., who provide detailed descriptions.57 The average size of obtained silver particles was found to be less than 100 nm with uniform shape.
Mechano-chemistry is an extension of science alluding to the chemical and physico-chemical responses of substances produced from the impact of mechanical force. In mechano-chemical synthesis, the mechanical and chemical phenomena are combined in molecular scale.58 The best example of mechano-chemical synthesis is ball milling. Ball milling is one of the most widely used techniques for synthesizing nanosized metals, metallic alloys, oxides, sulphates, etc. In a typical synthesis carried out by Khayati et al.,59 silver nanostructured powders were synthesized by mechano-chemical reduction of silver oxide precursor.
Pulsed wire discharge is one of the physicochemical methods for the synthesis of nanoparticles using plasma/vapour. This method has the advantages of high energy conversion efficiency and high production rate of nanoparticle preparation. The factors affecting the nanoparticle growth rate are ambient gas pressure (P) and relative energy (K). In a typical synthesis process, Tokoi et al.60 synthesized Ag NPs by pulsed wire discharge in liquid medium. The size of nanoparticles obtained through this process was below 100 nm. Pulsed wire discharge of nanoparticles in liquid media was chosen due to the fact that the particles formed in liquid media are more highly dispersive than the nanoparticles formed in air.
Spray pyrolysis technique is mainly used for thin film coating; however, nanoparticles can be synthesized through spray pyrolysis. Generally, metal oxide nanoparticles are synthesized by spray pyrolysis. This technique was first used in 1966 for the growth of cadmium sulphide thin films for photovoltaic applications. In the recent past, FTO (fluorine doped tin oxide) and ITO (indium doped tin oxide) were synthesized by spray pyrolysis for photovoltaic applications. This technique is cost effective, and complex geometries can be coated. The advantage of spray pyrolysis is that uniform and high quality coating can be deposited. Monodisperse Ag NPs were synthesized on a polymer matrix using this method by Kim et al.61
Generally, thermal decomposition of nanoparticles is an endothermic process. In this technique, the heat generated by the equipment breaks the chemical bonds undergoing decomposition. This technique is very rarely used due to its disadvantages such as high energy consumption and the large amount of time required to initialize the system, etc. Single crystalline silver nanostructure has been synthesized by Viswanathan et al.62 using this method, employing silver oxalate as the source of silver.
For bulk production of nanoparticles, physical methods present a good option in hand. But for cost effectiveness, chemical methods prove to be the better alternative.
2.3 Chemical reduction methods
The chemical reduction method has been the most followed and predominantly researched method in the synthesis of any metal nanoparticle in the past few decades. This approach is the bottom-up approach, where the nanoparticles are formed by precursors. The precursor supplies the ions and molecules, which are built up into nanoparticles by the influence of a suitable reducing agent. This is a very cost-effective method for the synthesis of metal nanoparticles. The nanoparticles synthesized by this method hold good stability and have numerous applications. There are many types of synthesis techniques providing different paths for different applications. Green and biological syntheses of Ag NPs have great demand, as they are eco-friendly and biocompatible.532.4 Electrochemical synthesis of silver nanoparticles
Electrochemical synthesis72 is a process where electrical energy is converted to chemical energy. In electrochemical synthesis, electrons act as a source through which the reaction is accomplished. In electrochemical synthesis, the electrolyte acts as the carrier of metal ions coming from the sacrificial electrode. Metallic gold nanowires were synthesized electrochemically on a polycarbonate membrane with pore diameter of 100 nm.Rashid et al.73 synthesized Ag NPs by electrochemical method without using any stabilizing agents. The process was performed in three stages. At stage one, oxygen gas is released due to the electrolysis of water; the silver is deposited on the anode. The silver ions are attracted towards the cathode during this process. Formation of Ag NPs occur during nucleation. Fig. 1 shows the comparison of nanoparticle growth with respect to different temperatures and variation in current.
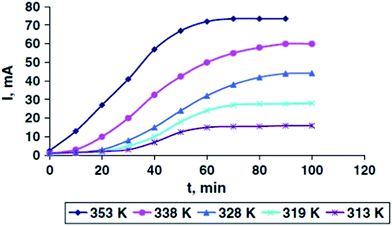 | ||
| Fig. 1 Different temperatures vs. current (reprinted with permission from ref. 73). | ||
In order to obtain stable Ag NPs, the reaction should be run for a long time. To ensure particle size stability, the concentration of solution should be in range of 20–40 mg L−1. The reaction time should be restricted to 50 to 70 min at a temperature of 50 to 80 °C. At stage two, filtration is done to avoid agglomerated particles and to enhance reduction of silver ions. In Fig. 2(a), the TEM image shows that the average particle size is 7 nm. The stability of Ag NPs was tested, and as a result the Ag NPs exhibited the same properties for more than 7 years at atmospheric conditions. AFM measurement shows that the diameter of Ag NPs ranges between 100 and 150 nm (Fig. 2(b)).
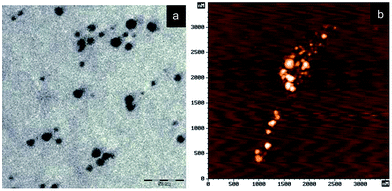 | ||
| Fig. 2 (a) TEM image of silver nanoparticles, (b) AFM image of Ag NPs (reprinted with permission from ref. 73). | ||
The Ag NPs that were deposited on the cathode have weak adhesion towards the substrate, and hence they are easy to remove by mechanical exfoliation. Particles obtained with a large diameter and nearly spherical and polyhedral shape can be seen in Fig. 3. In the FE-SEM image, it can be understood that some particles are 40 nm in diameter (Fig. 3).
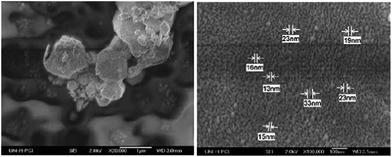 | ||
| Fig. 3 FE-SEM image of silver nanoparticles with different sizes of Ag NPs (reprinted with permission from ref. 73). | ||
Ibrahim et al.74 synthesized Ag NPs by electrochemical technique, using two pure silver electrodes (99.2%) with a 20 V voltage pass and 0.4 A current pass through the solution. The Ag NPs were characterized by XRD and AFM. The Ag NPs exhibited diffraction at 38°, 44°, and 64°, corresponding to the [111], [200], and [220] planes, respectively, confirming the FCC (face-centered cubic) structure, as shown in Fig. 4.
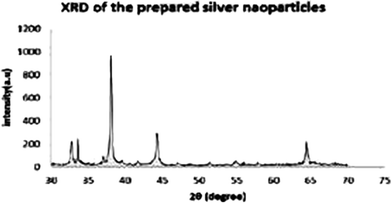 | ||
| Fig. 4 XRD pattern of Ag NPs (reprinted with permission from ref. 74). | ||
The morphology of the Ag NPs was characterized by AFM (atomic force microscopy), and the measured particle size was calculated to be 72.14 nm, in a clustered form shown in Fig. 5.
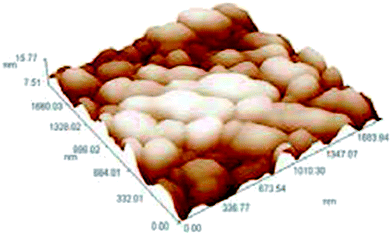 | ||
| Fig. 5 AFM structural image (reprinted with permission from ref. 74). | ||
The nanoparticle size was measured at 11.4 nm with high purity. This type of Ag NPs synthesis is less expensive, does not use any type of chemical stabilizing agents, and can be used in various applications such as antibacterial, optoelectronics, printed electronics, and flexible electronics.
Roldán et al.75 prepared Ag NPs successfully by using polyethylene glycol (PEG) as a stabilizing agent and silver nitrate as a silver precursor. The whole process was done in an ultrasonic bath. In a typical synthesis process, 2.5 mM silver nitrate solution was prepared by dissolving it in 2% w/v PEG. The whole setup was carried out in nitrogen atmosphere for 30 min. A current (7 mA, 10 mA, or 3 mA) was used with an adjustable applied potential. The optical response was measured by UV-vis spectroscopy using Ag NPs stabilized by 1% w/v PEG-2000 by applying 10 mA current with a wavelength near 300 nm, and another spectrum was observed at 392 nm with the intensity increased up to 425 nm after 30 min of reaction (Fig. 6).
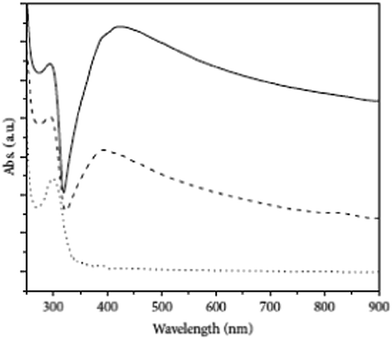 | ||
| Fig. 6 UV-visible spectrum of Ag NPs (reprinted with permission from ref. 75). | ||
The characterization of particle size and crystal structure was done by XRD. The diffraction was observed at 38.13°, 44.31°, and 64.47°, corresponding to the planes at (111), (200), and (220), respectively, shown in Fig. 7, thus confirming the cubic crystal structure. The average crystalline size was measured to be 45.85 nm from the Debye–Scherrer formula.
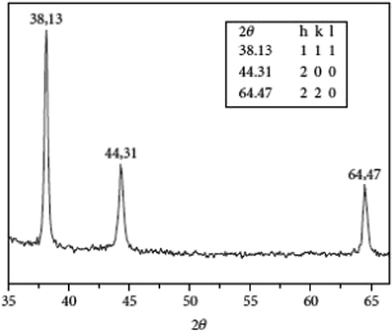 | ||
| Fig. 7 XRD pattern of Ag NPs exhibiting three different peaks (reprinted with permission from ref. 75). | ||
To determine the size and shape of the silver particle, AFM was used. It can be seen that the shape is near-spherical with an average diameter of 30.36 nm. The average particle size is in close relation to XRD calculations. The AFM scale bar of 85 nm is shown in Fig. 8.
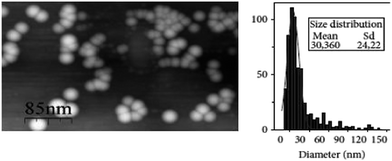 | ||
| Fig. 8 AFM image of Ag NPs with size distribution analysis (reprinted with permission from ref. 75). | ||
TEM images show that the spherical-shaped particles are between 10 and 30 nm in size, and some of them are in bigger sizes, with diameters up to approximately 200 nm (Fig. 9).
 | ||
| Fig. 9 TEM image of PEG-based Ag NPs at different nanoscales (reprinted with permission from ref. 75). | ||
Yin et al.76 reported an electrochemical method to prepare Ag clusters using poly(N-vinylpyrrolidone) (PVP) as a stabilizing agent. KNO3 (0.1 mol dm−3) was used as electrolyte and mixed with AgNO3 (5.0 × 10⁻³ mol dm−3) to control the size and shape; PVP plays a key role as a stabilizer. Two types of PVPs were used, PVPK30 and PVPK17, to stabilize the length and size of Ag NPs synthesized at room temperature (∼22 °C) under mechanical stirring with an applied potential. UV-vis spectroscopy analysis of the Ag NPs stabilized by the two different PVPs was performed. The maximum absorbance occurred at 420 nm, confirming the presence of Ag NPs (Fig. 10).
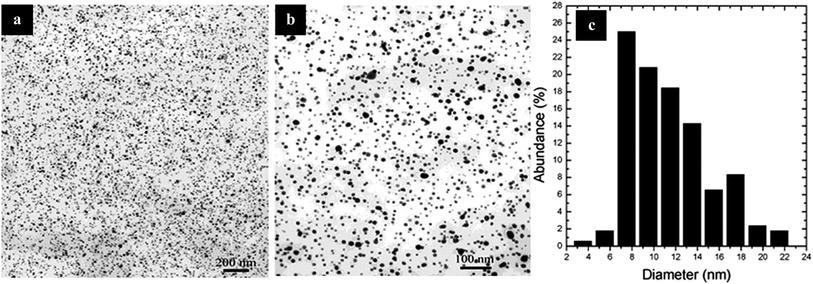 | ||
| Fig. 10 TEM images of PVP and SBS under mechanical stirring: (a) distribution of PVP and SDS, (b) at high magnification, (c) particle size distribution chart of PVP under mechanical stirring (reprinted with permission from ref. 76). | ||
The average diameter of particles was found to be 16.6 nm, with a standard deviation (SD) of 6.22. The formation of nanoparticles small in size was due to ultrasonic agitation; mechanical stirring can result in significant prevention of silver clusters and ensure uniform distribution. Here PVP is assisted in the formation of dispersed nanoparticle deposits on the electrode.
The SEM image of the Ag NPs doped on tin substrate is shown in Fig. 11(a). The crystal grain structure with different shapes is shown in Fig. 11(b).
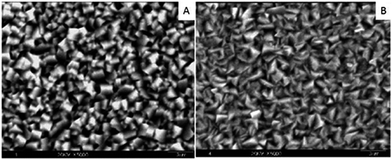 | ||
| Fig. 11 SEM image of (a) tin coating and (b) complex coating of tin and Ag NPs (reprinted with permission from ref. 76). | ||
Sanchez et al.77 have synthesized Ag NPs by using H2SO4 (sulphuric acid), tetrabutylammonium bromide (TBABr), tetrabutylammonium acetate (TBAAcO), and aluminium oxide as precursors. The processing temperature was maintained at 25 ± 0.1 °C by a thermostatic bath. In a typical synthesis process, Ag/AgCl was used as a reference electrode, a sacrificial silver sheet was used as anode, and the same-sized platinum sheet was used as cathode. The electrodes were placed inside the electrochemical cell, where the platinum electrode was polished with alumina powder. Triangular potential cycling between the range of 1.35 V and −0.15 V at a scan rate of 500 mV s−1 was performed for 5 min. The electrolyte consists of TBABr dissolved in acetonitrile and de-aerated with nitrogen for 15 min in an inert atmosphere.
Fig. 12 presents SEM images with scale sizes of 1 μm, 2 μm, and 100 μm. SEM micrographs for Ag NPs with different current densities are shown in Fig. 12(A)–(C). Surface plasmon resonance of the silver particles was observed at 420–444 nm, which is dependent on the average particle size. Fig. 13 shows the TEM images of Ag NPs as well as their corresponding size distributions.
 | ||
| Fig. 12 SEM micrograph of Ag NPs deposited on platinum sheet: (A) low current density, (B) high current density, and (C) magnified image of (B) (reprinted with permission from ref. 77). | ||
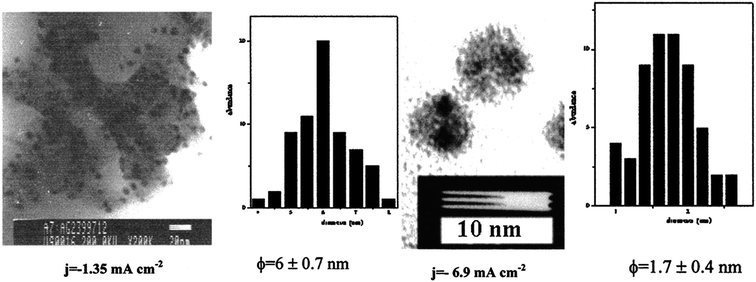 | ||
| Fig. 13 TEM images with the size distribution of silver particles synthesized in TBAACO at various current densities (1.35 mA cm−2 and 6.9 mA cm−2) (reprinted with permission from ref. 77). | ||
2.5 Green synthesis
Similar to other chemical methods, the use of various plant extracts has been taken into consideration to prepare Ag NPs of diverse sizes. Ag NPs are synthesized by using various plant extracts, which act as reducing as well as stabilizing agents. Bar et al.78 have reported a green synthesis method using an eco-friendly process to prepare Ag NPs with the stem of the Jatropha curcas plant. The milky white latex (1 mL) was diluted in 300 mL triple-distilled de-ionized water to make it 0.3%, and 20 mL of latex solution was added to 20 mL of 5 × 10⁻³ M silver nitrate solution. The solution was refluxed constantly at 85 °C in an oil bath under constant stirring for 4 h.Fig. 14 shows the HRTEM image of the unevenly shaped nanoparticles with the 50 nm scale, along with the size distribution of the particles, which have a diameter of 20–30 nm.
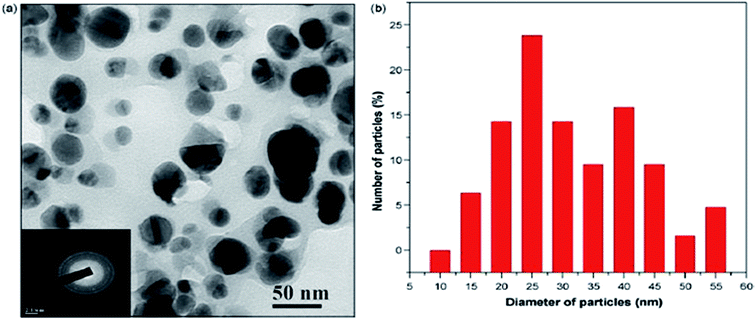 | ||
| Fig. 14 (a) HRTEM micrograph of Ag NPs with SAED pattern of polycrystalline particles, (b) histogram of HRTEM showing the particle size distribution of silver nanoparticles (reprinted with permission from ref. 78). | ||
The XRD spectrum shown in Fig. 15 shows peaks representing the diffraction obtained at 38.03°, 46.18°, 63.43°, and 77.18°, corresponding to the planes at (111), (200), (220), and (311), respectively.
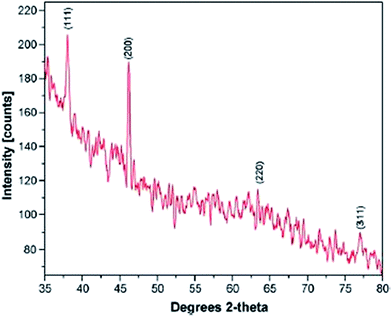 | ||
| Fig. 15 X-ray diffraction pattern of Ag NPs obtained by AgNO3 treated with 0.3% latex of Jatropha with 5 × 10⁻³ M AgNO3 solution (reprinted with permission from ref. 78). | ||
Erusan et al.79 have reported the preparation of Ag NPs with coconut water (Cocos nucifera) as a reducing agent. The reduction is accomplished by adding 10 mL of coconut water and 90 mL of 1 mM AgNO3 solution to a beaker, maintained at 80 °C for 15 to 20 min in a steam bath until the color changes to reddish. After observing the color change, the solution was centrifuged at 18![[thin space (1/6-em)]](https://www.rsc.org/images/entities/char_2009.gif) 000 rpm for 20 min to obtain nanosized Ag particles.
000 rpm for 20 min to obtain nanosized Ag particles.
Fig. 16(a) displays the UV-vis absorption spectrum of Ag NPs synthesized from coconut water (C. nucifera) at 1 mM concentration of silver nitrate. The green-coloured peak in the UV-vis spectrum represents the absorption of Ag colloidal particles. The XRD peak shows the Ag NPs prepared from C. nucifera (Fig. 16(b)). The diffraction peaks were obtained at 38.12°, 44.27°, 64.27°, and 76.23°, corresponding to (111), (200), (220), and (311) planes, respectively (Fig. 17).
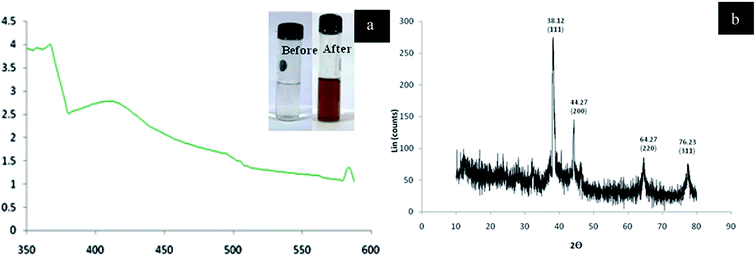 | ||
| Fig. 16 (a) UV-vis absorption spectrum. (b) XRD analysis showing the diffraction at 38.12°, 44.27°, 64.27°, and 76.23° (reprinted with permission from ref. 79). | ||
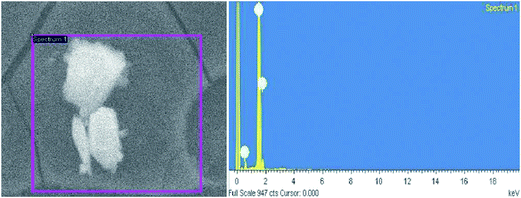 | ||
| Fig. 17 (a) SEM image of Ag NPs, (b) EDAX analysis (reprinted with permission from ref. 79). | ||
Pai et al.80 reported the synthesis of Ag NPs with fresh tulasi leaves. 25 g of tulasi leaves were added to 100 mL deionised water, heated 95 °C for 1 h, and filtered to collect 15 mL of leaf extract. The extract was added to 85 mL of 0.001 M AgNO3 and heated for 80 seconds using microwave (power of 1.2 kW at the frequency of 2450 MHz). The obtained particles were characterized by SEM and UV-vis spectrometry. The UV analysis showed silver surface plasmon resonance at 441 nm, which lies in the spectrophotometric range as shown in Fig. 18(c).
 | ||
| Fig. 18 Optical image of silver nitrate and tulasi reaction mixture: (a) yellow, (b) brown. (c) UV-vis spectrum graph showing silver nitrate solution absorption peak at 414 nm (reprinted with permission from ref. 80). | ||
SEM analysis was performed at high and low magnifications to confirm the spherical shape and size (20 to 40 nm), as shown in Fig. 19(a) and (b).
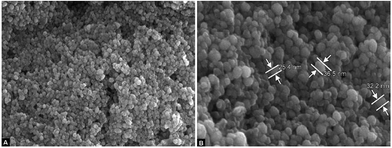 | ||
| Fig. 19 SEM images showing (a) spherical Ag NPs (b) with 20 to 40 nm size (reprinted with permission from ref. 80). | ||
2.6 Microwave irradiation synthesis
Microwave irradiation is an electromagnetic irradiation in the frequency range of 0.3 to 30 GHz. All the ‘kitchen’ microwave ovens as well as the dedicated microwave reactors are suitable for chemical synthesis, operating at a frequency of 2.45 GHz49 with the corresponding wavelength of 12.24 cm to avoid interference with telecommunications and cellular phone frequency. The energy of the microwave (0.0016 eV) is too low to break chemical bonds and is also lower than Brownian motion energy.81 Microwave synthesis is a one-step synthesis method in aqueous media with the advantage of energy efficiency. It works using the efficient heating of materials by the “microwave dielectric heating” effect. The heating process is dependent on the type of material (solvent or reagent) that absorbs the microwave energy and converts it to heat. The electrical component83 of electromagnetic field heating depends on two mechanisms, namely dipole polarization and ionic conduction.The microwave preparation of Ag NPs84 was done using PVPK30, silver nitrate, and PEG. In a typical synthesis process, aqueous silver nitrate was mixed with PVP solution and PEG in a 100 mL round bottom flask and heated under magnetic stirring in a microwave heating instrument. The solution changes its colour from transparent to yellow colloid, indicating the growth of Ag NPs. The same method was carried out by replacing microwave heating with oil heating. PEG and other impurities were separated by centrifugation of the reaction mixture at 8000 rpm and dispersed in ethanol for further characterization.
Fig. 20(a) and (b) show TEM images with various size distributions of Ag NPs synthesized by microwave irradiation. When 700 W of microwave power is applied, the total reaction time is 30 min with a uniform particle size of 50 nm (Fig. 21).
 | ||
| Fig. 20 TEM images with size distribution histogram: (a) particle size of 50 nm of Ag NPs obtained by microwave heating and (b) the corresponding particle size distribution; (c) silver particles synthesized by oil heating and (d) the corresponding particle size distribution (reprinted with permission from ref. 84). | ||
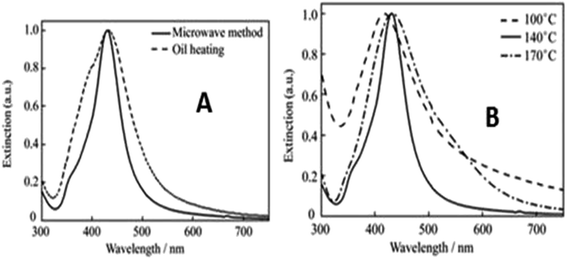 | ||
| Fig. 21 (a) UV-visible spectra of silver synthesized by microwave and oil heating methods, (b) UV-visible spectra of silver particles synthesized at different temperatures using microwave heating (reprinted with permission from ref. 84). | ||
Ag NPs were also prepared using starch solution by adding 5 mL of silver nitrate to 1% starch and stirring for 30 min. The transparent solution was heated to a temperature range of 45–75°. The reaction was carried out under microwave irradiation, in which the formation of silver particles was confirmed by the change in colour from yellowish brown to greyish black. The obtained particles have been stored at room temperature for a period of 2 months, which proves that starch is a good reducing agent as well as stabilizing agent under microwave irradiation (Fig. 22).
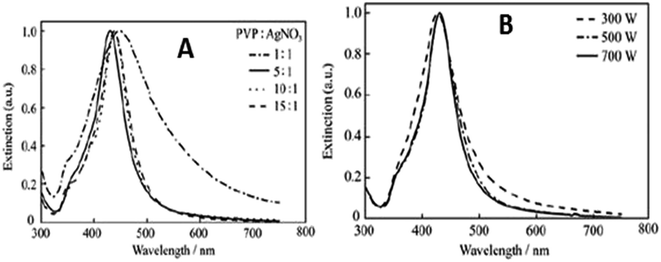 | ||
| Fig. 22 (a) UV-visible absorption spectra at different molar ratios of PVP to silver under 700 W microwave heating, (b) UV-visible extinction spectra at different amounts of microwave power (reprinted with permission from ref. 84). | ||
The size of the obtained Ag NPs was analyzed by TEM. The average diameters of the silver particles are recorded to be 12 nm. UV-vis spectra of silver particles synthesized at different temperatures with time variation confirm that Ag NPs are sustainable when synthesized by microwave irradiation (Fig. 23).
 | ||
| Fig. 23 TEM images of Ag NPs (a) with an average diameter of 30 nm, (b) refluxed under 75 °C, and (c) with an average diameter of 12 nm. (d) HR-TEM image of a single silver nanoparticle. (e) SAED pattern for silver (reprinted with permission from ref. 85). | ||
Fig. 24 shows the UV-vis absorption spectra of starch-stabilized Ag NPs prepared at different time intervals (10–60 min) at 80 °C. As the temperature increases, the surface plasmon resonance of the silver particles appears at 420 nm.
 | ||
| Fig. 24 Absorption spectra of Ag NPs under different heating conditions: (a) 55°, (b) 65°, and (c) 75° (reprinted with permission from ref. 85). | ||
Another method to synthesize Ag NPs was reported,86 in which silver nitrate (AgNO3) was used as Ag precursor; hexamine and sodium borohydride (NaBH4) were used as reducing agents. The typical synthesis process starts with pectin powder (extracted from citrus peels) dissolved in 90 mL of hot water. The solution was placed under microwave power of 800 W at a frequency of 2459 MHz for 5 min. Upon microwave irradiation, the colourless solution turned yellowish-brown, indicating Ag particle formation.
The UV-visible absorption spectrum of pectin shows the absorption from 200 to 600 nm. The peak observed at 416 nm after microwave irradiation (MI) for 3 min is shown in Fig. 25(a). Fig. 25(b) shows the UV-visible spectrum showing two different peaks with increased intensity, 4-nitrophenolate at 317 nm and 4-nitrophenol at 400 nm.
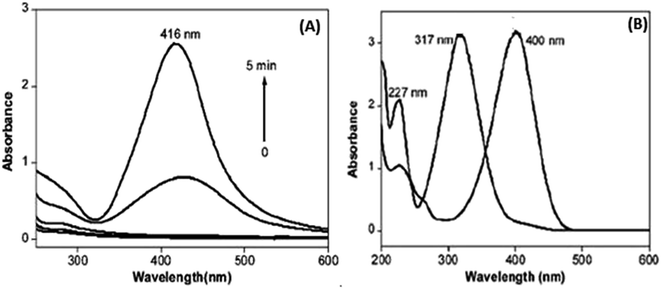 | ||
| Fig. 25 (a) UV-visible absorption (MI (microwave irradiation)) time, (b) UV with two ion peaks at 317 nm and 400 nm (reprinted with permission from ref. 86). | ||
The crystalline structure was confirmed by the XRD pattern shown in Fig. 26. Four distant peaks were observed at 37.86°, 43.94°, 64.17°, and 77.12°. These peaks correspond to the planes at (111), (200), (220), and (311), respectively, confirming that the crystal structure is face-centered cubic (FCC), which is in close relation with JCPDS file no. 04-0783.
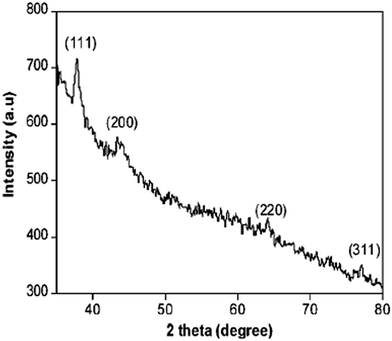 | ||
| Fig. 26 XRD pattern for Ag NPs (reprinted with permission from ref. 86). | ||
Using energy dispersive X-ray spectra (EDX), the element description of the sample was obtained, with peaks located at 2 keV and 4 keV directly related to the K and L lines of silver. The smallest peak is observed at 0.3 keV. This is due to carbon, and another peak at 0.5 keV is due to oxygen, as shown in Fig. 27.
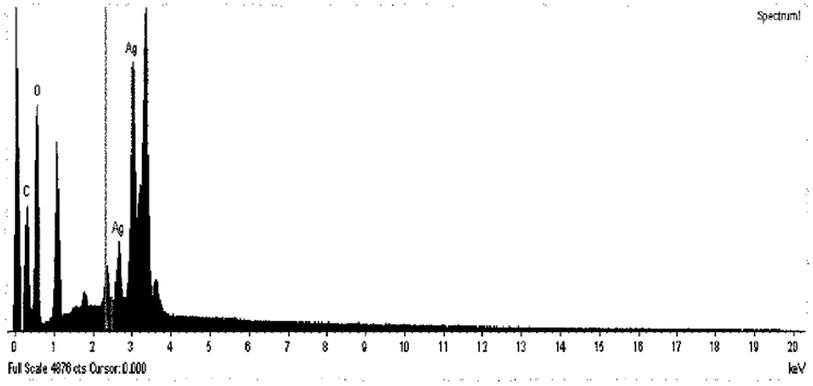 | ||
| Fig. 27 EDX spectrum of Ag NPs (pectin) (reprinted with permission from ref. 86). | ||
TEM was employed to determine the size, shape, and morphology of Ag particles. Fig. 28(a) presents less uniformly distributed particles with spherical shape and highly crystalline structure. The particle size was found to be 18.84 nm ± 0.9 (Fig. 28(b)). The diameters of particles were about 16–20 nm, with size distribution of symmetrical nanoparticles at the range of 14–24 nm. The HR-TEM image in Fig. 28(c) shows the crystalline lattice growth of silver nanoparticles. The SAED in Fig. 28(d) shows four planes, (111), (200), (220), and (311), which are a reflection of high-quality FCC structure.
 | ||
| Fig. 28 (a) TEM image of Ag NPs, (b) particle size histogram, (c) HRTEM image of Ag NPs, (d) SAED pattern of silver-pectin (reprinted with permission from ref. 86). | ||
Another preparation of Ag NPs by microwave irradiation was accomplished by silver nitrate (AgNO3) and benzo-18-crown-6 as reducing and stabilizing agents.87 1 mL of 0.2 M benzo-18-crown-6 and 10 mL of 0.0001 M AgNO3 were taken in a conical flask and placed in a microwave oven under 300 W for 3 min. The colorless solution slowly turned to pale yellow color, indicating the formation of Ag NPs.
The presence of Ag NPs was confirmed by TEM image as shown in Fig. 29(a). The particle size distribution shows that the particles ranging from 6–11 nm formed under optimum experimental conditions shown in Fig. 29(b).
 | ||
| Fig. 29 (a) TEM image of Ag NPs, (b) size distribution for Ag NPs (reprinted with permission from ref. 87). | ||
The UV-visible spectrum of the silver colloidal solution exhibits a strong absorption at 420 nm as shown in Fig. 30(a) and (b). The UV-visible spectra of Ag NPs synthesized with different time intervals and constant power of 300 W are shown. Fig. 30(c) shows the UV-visible spectra of Ag synthesized at a constant time interval (3 min) with variation in microwave power from 450 W to 180 W. The silver particles were kept for 5 months in the refrigerator, and optical absorption was characterized by UV-visible spectra, as shown in Fig. 30(d).
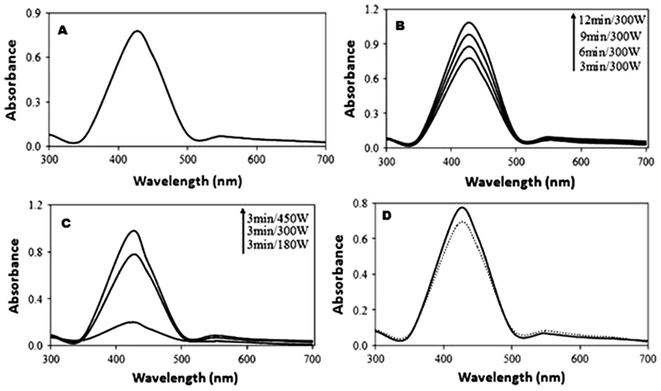 | ||
| Fig. 30 (a)–(d) UV-visible spectra of Ag under different time intervals and temperature conditions (reprinted with permission from ref. 87). | ||
2.7 Synthesis of Ag NPs by polyol process
The polyol process is widely practiced for large-scale synthesis, and hence it is one of the best methods available. Many studies on the polyol process have been reported, and the process has its own impact on nanotechnology.Cheng et al. reported88 the successful one-step synthesis of silver nanowires with a diameter of 40 nm and length > 10 μm, which has been tested for applications in conductive ink. Ag nanowires were prepared by dissolving silver nitrate (100 mg) and PVP (100 mg) in 30 mL ethylene glycol with 1 M HCl. The solution was refluxed at 140 °C for 2 h; the colour turned orange; then the temperature was raised to 160 °C for 30 min. The solution was centrifuged for some cycles, which resulted in Ag nanowires. SEM, XRD, and HR-TEM were employed in the investigation of the Ag nanowires. The TEM images confirmed that the size and shape of the Ag nanowires were about 40 nm in diameter and greater than 10 μm in length. The XRD result estimated the interplanar distances at ∼0.24 nm for (111) and ∼0.14 nm for (110) planes, as shown in Fig. 31(d). The obtained Ag nanowires were tested for conductivity and their application in ink by fabricating a circuit on PET substrate and lighting an LED, as shown in Fig. 32.
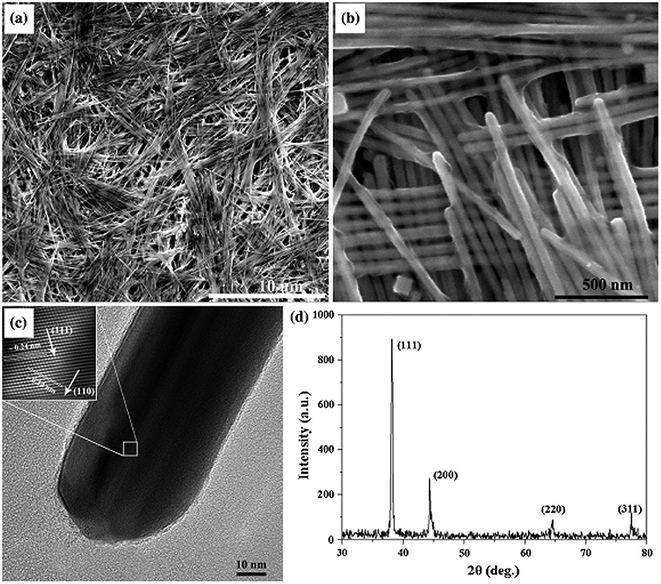 | ||
| Fig. 31 (a) and (b) SEM images of Ag nano-wires, (c) HRTEM image of a particular Ag nanowire, (d) XRD pattern for Ag nanowires (reprinted with permission from ref. 88). | ||
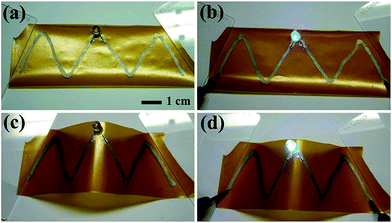 | ||
| Fig. 32 (a) Silver lines patterned on PET substrate, (b) LED glows, (c) PET substrate twisted to check for conductivity, (d) LED glows perfectly after twisting the substrate (reprinted with permission from ref. 88). | ||
Similarly, Dang et al. synthesized Ag NPs using the same polyol process,11 changing a few parameters, and obtained an average diameter of 10 nm. Firstly, PVP was dissolved in ethylene glycol (20 mL), then silver nitrate was added. Instead of refluxing the solution as in the previously mentioned process, the solution was ultrasonicated for 3 min, and colour change was observed as an indication of the growth of silver particles. The silver particles were formulated into silver ink by dissolving them in organic solvents. The conductive ink was then printed onto different substrates using an inkjet printer. The obtained particles were characterized by TEM, and a size distribution chart was produced. The particle sizes ranged from 4 to 16 nm, which was sufficient for ejection from the nozzle of the inkjet printer (Fig. 33).
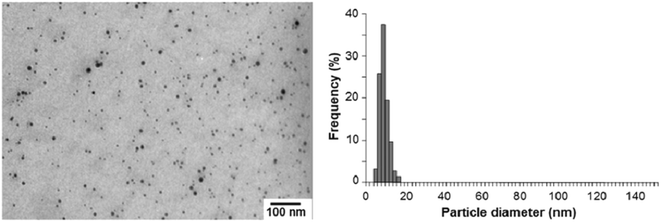 | ||
| Fig. 33 TEM image of Ag NPs and their size distributions (reprinted with permission from ref. 11). | ||
In the ink formulation, Ag NPs (20% wt) were mixed with ethanol (32% wt), ethylene glycol (32% wt), 11.2% wt of 2-iso-popoxyethanol, and 4.8% glycerine and filtered though a syringe of 0.2 μm pore size. The formulated ink was then applied on PET, glass, and silicon wafer. Among the three substrates, PET and glass had less contact angle, but the contact angle was high for silicon wafer. The adhesion was good for silicon wafer substrate, but was wavy and formed droplets in the case of glass and PET substrate. The adhesion was improved by changing the concentrations in the ink formulation to H2O (31% wt), ethanol (15% wt), ethylene glycol (1.5% wt), glycerine (15% wt), 2-isopropoxyethanol (1.5% wt), ethyl acetate (15.6% wt), SDS (0.3% wt), ethyl glycolate (0.05% wt), and ethyl formate (0.05% wt) (Fig. 34).
 | ||
| Fig. 34 Optical images of printed patterns on (a) PET, (b) glass, and (c) silicon substrates (reprinted with permission from ref. 11). | ||
Barkey et al.89 synthesized an Ag nano-wire suspension for printable conductive media. In a typical synthesis process, ethylene glycol was refluxed at 150 °C for 1 h under continuous stirring. An aqueous solution of copper(II) chloride was introduced into the ethylene glycol solution; an aqueous solution of PVP was added further, along with aqueous silver nitrate, to the reaction mixture. During the synthesis process, the reaction flask was purged with argon gas. The change in colour of the solution from yellow to red, then olive green, clear peach, and finally to opaque grey indicates the formation of nanoparticles. The obtained solution was centrifuged for 20 min at 3000 rpm once in the presence of acetone, and three times in the presence of deionised water. Characterization of the synthesized Ag nanoparticles was performed using SEM, which shows the morphology of silver nanowires formed in Fig. 35. The average diameter of the synthesized nanowires was found to be 90–100 nm.
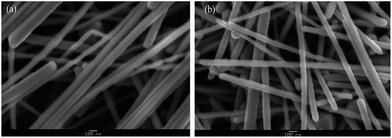 | ||
| Fig. 35 SEM images of nanowires prepared by the polyol process at different volumes of “ethylene glycol” (a) 160 mL, (b) 25 mL (reprinted with permission from ref. 89). | ||
Conductive ink was formulated by dispersing silver nanowires in water acting as a solvent, carboxymethyl cellulose (CMC) as binder, and Dispex® Ultra FA 4416 (Old Hydropalat 216, BASF) as a dispersive agent. The synthesized conductive ink was printed with the help of a screen printer, as shown in Fig. 36.
 | ||
| Fig. 36 Silver pattern screen printed using nanowire ink (reprinted with permission from ref. 89). | ||
The conductive ink pattern was characterized by SEM and rheometer. Fig. 37(a) displays the SEM micrograph of the silver pattern printed on polycarbonate substrate. Fig. 37(b) shows the viscosity versus time plot for the ink prepared using nanowire and nanoparticle suspensions. The rheology of the nano-ink was measured as a function of time, and it is found that the nanowire ink was more viscous than the nanoparticle ink.
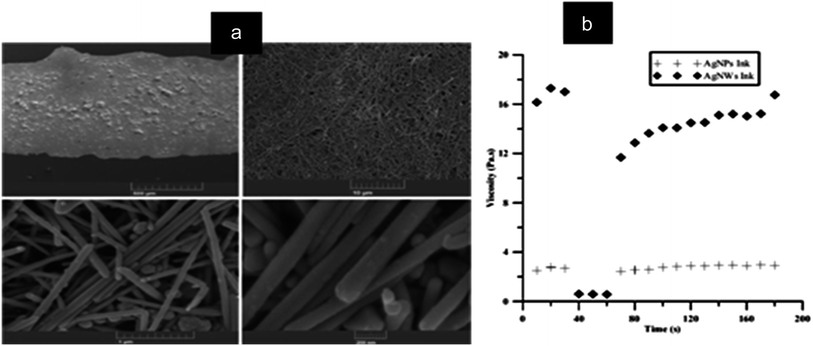 | ||
| Fig. 37 (a) SEM image of printed ink at different magnifications, (b) rheology measurement comparing Ag NP ink and Ag NW ink as a function of time (reprinted with permission from ref. 89). | ||
Chiang et al.90 synthesized Ag NPs with silver nitrate, tripropylene glycol, 3-ethyl-3-oxetanemethanol, polycaprolactone triol, and PVP as the precursors. Firstly, various amounts of PVP with different molecular weights (Mw = 10![[thin space (1/6-em)]](https://www.rsc.org/images/entities/char_2009.gif) 000; 55
000; 55![[thin space (1/6-em)]](https://www.rsc.org/images/entities/char_2009.gif) 000; 1
000; 1![[thin space (1/6-em)]](https://www.rsc.org/images/entities/char_2009.gif) 300
300![[thin space (1/6-em)]](https://www.rsc.org/images/entities/char_2009.gif) 000) were used in three different solutions. To these solutions, the required amount of AgNO3 was added in the ratio of 1
000) were used in three different solutions. To these solutions, the required amount of AgNO3 was added in the ratio of 1![[thin space (1/6-em)]](https://www.rsc.org/images/entities/char_2009.gif) :
:![[thin space (1/6-em)]](https://www.rsc.org/images/entities/char_2009.gif) 100 (AgNO3
100 (AgNO3![[thin space (1/6-em)]](https://www.rsc.org/images/entities/char_2009.gif) :
:![[thin space (1/6-em)]](https://www.rsc.org/images/entities/char_2009.gif) reducing agent). All the prepared solutions were refluxed at 120 °C at a rate of 4 °C min−1 for 3 to 24 h. Silver nanoparticle growth was observed when 3-ethyl-3-oxetanemethanol was added to the reaction mixture and sonicated for 10 min. The obtained solution was centrifuged to separate the Ag NPs, which were washed 5 times to remove the capping agents.
reducing agent). All the prepared solutions were refluxed at 120 °C at a rate of 4 °C min−1 for 3 to 24 h. Silver nanoparticle growth was observed when 3-ethyl-3-oxetanemethanol was added to the reaction mixture and sonicated for 10 min. The obtained solution was centrifuged to separate the Ag NPs, which were washed 5 times to remove the capping agents.
Characterization of the Ag NPs was accomplished by XRD, UV-vis spectroscopy, FTIR, and TEM. XRD pattern of the Ag NPs produced by reduction with tripropylene glycol is shown in Fig. 38(a). It shows that the produced nanoparticles are FCC in structure, which is in close relation to JCPDS no. 26-0339. UV-vis spectra of nanoparticles synthesized using PVP with molecular weights (Mw = 10![[thin space (1/6-em)]](https://www.rsc.org/images/entities/char_2009.gif) 000, 55
000, 55![[thin space (1/6-em)]](https://www.rsc.org/images/entities/char_2009.gif) 000, 1
000, 1![[thin space (1/6-em)]](https://www.rsc.org/images/entities/char_2009.gif) 300
300![[thin space (1/6-em)]](https://www.rsc.org/images/entities/char_2009.gif) 000) are shown in Fig. 38(b). From the figure it can be clearly understood that silver particles stabilized by PVP with Mw = 10
000) are shown in Fig. 38(b). From the figure it can be clearly understood that silver particles stabilized by PVP with Mw = 10![[thin space (1/6-em)]](https://www.rsc.org/images/entities/char_2009.gif) 000 shows very good absorption compared to the others, whereas the SPR band of silver particles stabilized with PVP of Mw = 55
000 shows very good absorption compared to the others, whereas the SPR band of silver particles stabilized with PVP of Mw = 55![[thin space (1/6-em)]](https://www.rsc.org/images/entities/char_2009.gif) 000 exhibits a wider band at 470 nm, implying that the prepared nanoparticles are smaller in size.
000 exhibits a wider band at 470 nm, implying that the prepared nanoparticles are smaller in size.
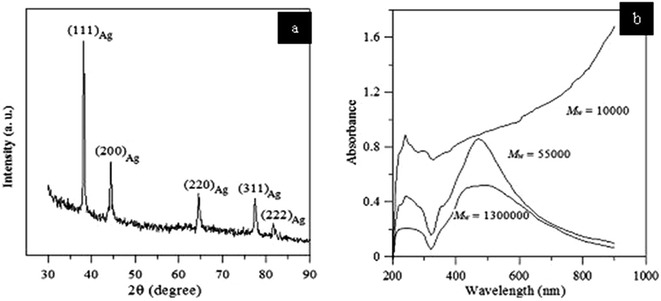 | ||
Fig. 38 (a) XRD pattern of Ag nanoparticles obtained by reducing AgNO3 with tripropylene glycol and PVP of Mw = 10![[thin space (1/6-em)]](https://www.rsc.org/images/entities/char_2009.gif) 000; 55 000; 55![[thin space (1/6-em)]](https://www.rsc.org/images/entities/char_2009.gif) 000; and 1 000; and 1![[thin space (1/6-em)]](https://www.rsc.org/images/entities/char_2009.gif) 300 300![[thin space (1/6-em)]](https://www.rsc.org/images/entities/char_2009.gif) 000. (b) UV-vis spectra of Ag stabilized with PVP (reprinted with permission from ref. 90). 000. (b) UV-vis spectra of Ag stabilized with PVP (reprinted with permission from ref. 90). | ||
FTIR spectrum of AG NPs reduced by tripropylene glycol was compared with Ag NPs reduced by tripropylene glycol + AgNO3, as shown in Fig. 39(a). The interactions between tripropylene glycol and Ag NPs can be analyzed from the FTIR peaks. TEM micrographs of Ag NPs prepared by reducing it with tripropylene glycol are shown in Fig. 39(b). Ag NPs were also stabilized in PVP of Mw = 10![[thin space (1/6-em)]](https://www.rsc.org/images/entities/char_2009.gif) 000 and 1
000 and 1![[thin space (1/6-em)]](https://www.rsc.org/images/entities/char_2009.gif) 300
300![[thin space (1/6-em)]](https://www.rsc.org/images/entities/char_2009.gif) 000, but the particles obtained using Mw = 55
000, but the particles obtained using Mw = 55![[thin space (1/6-em)]](https://www.rsc.org/images/entities/char_2009.gif) 000 are preferable in size.
000 are preferable in size.
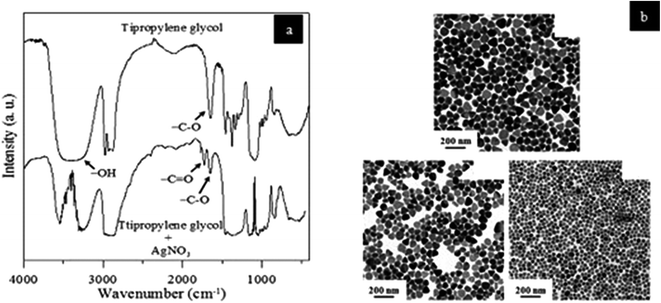 | ||
Fig. 39 (a) FT-IR spectra comparison of tripropylene glycol nanoparticles and tripropylene glycol + AgNO3, (b) TEM micrographs of silver synthesized by heating at 120 °C with tripropylene glycol as a reducing agent and stabilized in PVP of Mw = 55![[thin space (1/6-em)]](https://www.rsc.org/images/entities/char_2009.gif) 000 (reprinted with permission from ref. 90). 000 (reprinted with permission from ref. 90). | ||
In another report, the precursors for synthesizing Ag NPs include AgNO3, PVP of Mw = 10![[thin space (1/6-em)]](https://www.rsc.org/images/entities/char_2009.gif) 000 and 40
000 and 40![[thin space (1/6-em)]](https://www.rsc.org/images/entities/char_2009.gif) 000, and ethylene glycol (EG).91 Firstly, two separate dispersions of AgNO3 in PVP (Mw = 10
000, and ethylene glycol (EG).91 Firstly, two separate dispersions of AgNO3 in PVP (Mw = 10![[thin space (1/6-em)]](https://www.rsc.org/images/entities/char_2009.gif) 000 and 40
000 and 40![[thin space (1/6-em)]](https://www.rsc.org/images/entities/char_2009.gif) 000) were prepared under reflux conditions at room temperature and 70 °C, sonicated, and stirred. The reactants were added into the reactor system at a rate of 1.5 mL min−1. The temperature was raised to 120 and 150 °C, respectively, for 12 min. The growth of silver sol was observed; it was decanted further (Fig. 40).
000) were prepared under reflux conditions at room temperature and 70 °C, sonicated, and stirred. The reactants were added into the reactor system at a rate of 1.5 mL min−1. The temperature was raised to 120 and 150 °C, respectively, for 12 min. The growth of silver sol was observed; it was decanted further (Fig. 40).
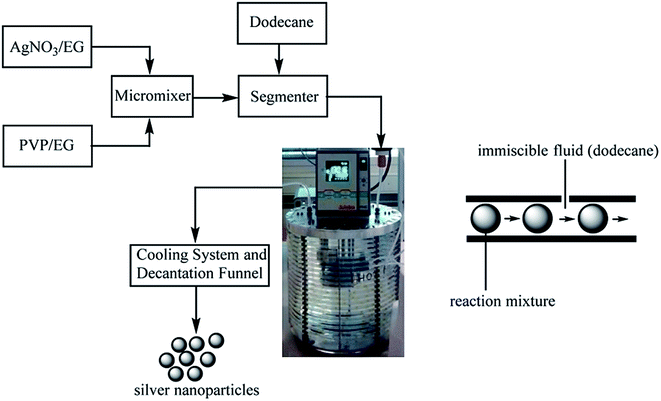 | ||
| Fig. 40 Schematic of processing in the segmented flow tubular reactor (SFTR) system for the multi-gram synthesis of Ag NPs (reprinted with permission from ref. 91). | ||
The obtained Ag NPs were characterized by TEM as shown in Fig. 41(a) to (d) for G0, G1, G2, and G3. The average particle size obtained is in the range of 23–58 nm by various samples as shown in (Table 1). Fig. 42 shows the TEM of G4, G5, and G7 samples with mean diameter of 9–123 nm. The XRD patterns of the four samples (G3, G4, G5 and G7) prepared by varying the reaction parameters are shown in Fig. 43(b).
 | ||
| Fig. 41 TEM micrographs of Ag NPs: (a) G0, (b) G1, (c) G2, and (d) G3 (reprinted with permission from ref. 91). | ||
 | ||
| Fig. 42 TEM micrographs of Ag NPs: (a) G4, (b) G5, and (c) G7 (reprinted with permission from ref. 91). | ||
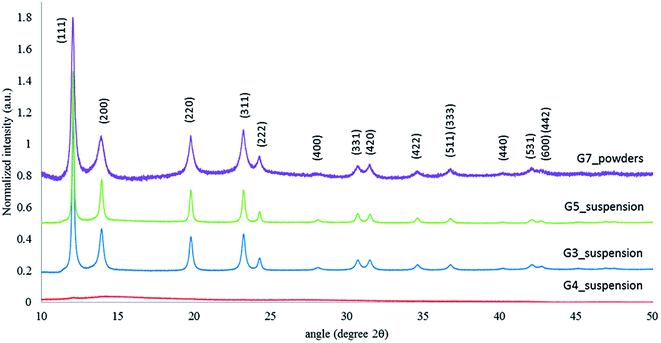 | ||
| Fig. 43 XRD peaks of G3, G4, G5, and G7 samples (reprinted with permission from ref. 91). | ||
| Sample name | Temperature (°C) | PVP Mw (g mol−1) | TEM size (nm) | Mean diameter (nm) |
|---|---|---|---|---|
| G0 | 120 | 10k | 23 (4) | 14 (4) |
| G1 | 130 | 10k | 25 (4) | 20 (8) |
| G2 | 140 | 10k | 47 (8) | 33 (12) |
| G3 | 150 | 10k | 58 (7) | 56 (17) |
| G5 | 140 | 40k | 7 (2) | 9 (2) |
| G5 | 140 | 40k | 79 (15) | 107 (30) |
| G7 | 150 | 40k | 104 (20) | 123 (32) |
3. Silver ink formulation by chemical reduction
The chemical reduction method is one of the common methods used for obtaining Ag NPs. This process requires a reduction agent to reduce the silver nanoparticles. Lewis et al.92 described a typical process to synthesize silver ink; the silver particles were suspended in a viscosifying solution, which were obtained by reducing silver nitrate in the presence of poly acrylic acid (PAA) by stabilizing them in diethanolamine and stirring for 22 h to yield Ag NPs with an average diameter of 5 nm (Scheme 4).The Ag particles were sonicated at the refluxing condition of 65 °C for 1.5 h, which results in the formation of agglomerated silver particles with a mean size of 400 ± 120 nm, shown in Fig. 44(a). After the formation of particles, ethanol was added to the silver particles to remove impurities by centrifugation with a high speed of 9000 rpm. The obtained silver particles were re-dispersed in distilled water to remove excess PAA. The same process was repeated three times to yield pure Ag NPs, which were dispersed in a solution of hydroxy ethyl cellulose (HEC) dissolved in ethanol and water in the ratio of 1![[thin space (1/6-em)]](https://www.rsc.org/images/entities/char_2009.gif) :
:![[thin space (1/6-em)]](https://www.rsc.org/images/entities/char_2009.gif) 1. The mixture was homogenized at 2000 rpm for 3 min and dried until ink was obtained. Fig. 44(b) shows the viscosity measurement of the synthesized ink. The shaded pattern indicates the preferred viscosity range for using the ink in inkjet printing. The acquired viscosity was measured at a shear rate of 1 s−1 for silver ink synthesized with HEC. For the synthesized inks with different concentrations of silver, the HEC ratio is stable for months when stored in sealed ink pens.
1. The mixture was homogenized at 2000 rpm for 3 min and dried until ink was obtained. Fig. 44(b) shows the viscosity measurement of the synthesized ink. The shaded pattern indicates the preferred viscosity range for using the ink in inkjet printing. The acquired viscosity was measured at a shear rate of 1 s−1 for silver ink synthesized with HEC. For the synthesized inks with different concentrations of silver, the HEC ratio is stable for months when stored in sealed ink pens.
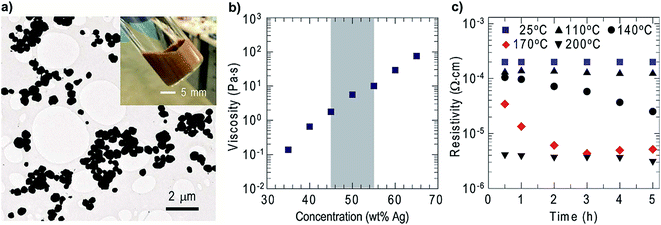 | ||
| Fig. 44 (a) TEM image of the Ag-NPs and optical image of the ink (inset); (b) ink viscosity (η), the shaded part indicating the ink viscosity required for printing; (c) specific resistivity of silver ink measured with respect to time (reprinted with permission from ref. 92). | ||
The electrical resistivity of silver ink was measured by heating and drying the ink at room temperature as a function of rise in temperature and time. Silver films (1 cm × 1 cm wide, 12 μm in height) were fabricated by doctor blade technique on glass substrate. The synthesized ink exhibited good conductivity after drying at room temperature for 30 min, with a resistivity of 1.99 × 10⁻⁴ Ω cm. The increased annealing temperature of 110 °C shows a reduction in resistivity of the synthesized ink. Fig. 44(c) shows that a further increase in temperature (140 °C, 170 °C, and 200 °C) results in a further decrease in resistivity.
To characterize the mechanical flexibility of the silver ink printed on paper, an array of 5 lines was printed with a roller ball point pen and dried at room temperature for 24 h. The pattern coated on the xerox paper was actuated between flat and bent states at a bending rate of 2 cm s−1 using a customized mechanical micropositioning system shown in Fig. 45(e).
 | ||
Fig. 45 (a) Optical images of silver electrodes with an array pattern, flat (top) and bent; (b) SEM images of silver electrodes in straight position; (c) SEM images of silver electrodes after 10![[thin space (1/6-em)]](https://www.rsc.org/images/entities/char_2009.gif) 000 bend cycles; (d) electrical resistance as a function of the bend cycle of the printed silver electrodes of various bend radii; and (e) customized machine used to characterize mechanical flexibility (reprinted with permission from ref. 92). 000 bend cycles; (d) electrical resistance as a function of the bend cycle of the printed silver electrodes of various bend radii; and (e) customized machine used to characterize mechanical flexibility (reprinted with permission from ref. 92). | ||
In Fig. 45(a), the silver electrode is shown in flat and bent states. SEM image confirms that no cracks were found in the first bent stage shown in Fig. 45(b) and (d) shows the bend radius and the bend cycles with respect to electrical resistance (R) with a silver pattern radius of 2.9 mm and 1.6 mm. Fig. 45(c) shows that silver electrodes exhibit good response even after 10![[thin space (1/6-em)]](https://www.rsc.org/images/entities/char_2009.gif) 000 bending cycles. The ink was applied in an electronic art displaying a surface-mounted LED placed on the roof of a house (Fig. 46(a)). A multi-coloured LED pattern created by the roller pen is displayed in Fig. 46(b). A 3D antenna is patterned using conductive ink as shown in Fig. 46(c).
000 bending cycles. The ink was applied in an electronic art displaying a surface-mounted LED placed on the roof of a house (Fig. 46(a)). A multi-coloured LED pattern created by the roller pen is displayed in Fig. 46(b). A 3D antenna is patterned using conductive ink as shown in Fig. 46(c).
 | ||
| Fig. 46 (a) Optical image of conductive electronic art drawn by silver inks with glowing LED, (b) optical image of a flexible paper display with an LED array on paper, (c) optical image of a 3D antenna, with electronic silver ink art patterned on a hemispherical hollow glass substrate (reprinted with permission from ref. 92). | ||
Song et al.67 reported a method for the preparation of Ag NPs and formulation of silver nanoink using silver nitrate as a source of silver. Monoethanolamine (MEA) acts as a reducing agent; PAA acts as stabilizing agent. Firstly, MEA, PAA and AgNO3 were sequentially dissolved in deionized water under vigorous stirring at room temperature for 1 h. The reaction was considered complete when the colour changed first to yellow and further to a transparent color as shown in Fig. 47(a). The next step is heating the solution to 65 °C and stirring for 1 h, by which brown, orange, and dark reddish colours were observed as shown in Fig. 47(b)–(d), depicting that nucleation of Ag NPs has been started. The supernatant was removed, and the silver particles were washed several times with ethanol. After washing, the pure Ag NPs were let dry.
 | ||
| Fig. 47 Schematic process of synthesizing Ag NPs (reprinted with permission from ref. 67). | ||
Silver ink was prepared by adding Ag NPs to deionized water and ethylene glycol, and then ultrasonicating for 20 min. The processed solution appears to be brown in colour and ready for making conductive patterns.
The XRD pattern shows three major peaks, which can be observed at 38.2°, 44.4°, and 64.5°, as shown in Fig. 48(a), with the corresponding planes at (111), (200), and (220), respectively, which are in close relation to the JCPDS File no. 04-0783. The advantage of making PAA-stabilized silver particles is that they can be stored at room temperature.
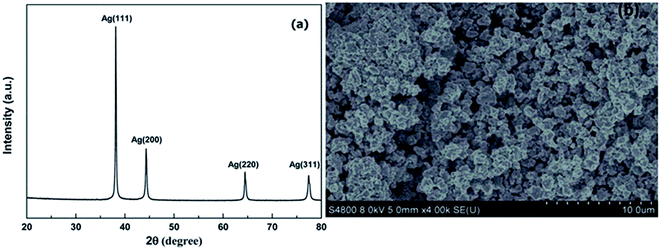 | ||
| Fig. 48 (a) XRD pattern Ag NPs, (b) SEM micrograph of Ag NPs (reprinted with permission from ref. 67). | ||
The particle sizes of silver are in the range of 20–230 nm, and the mean size varied between 30 to 50 nm, as shown in Fig. 49(a). The particle size analysis (Fig. 49(b)) shows the viscosity measurement of the formulated silver ink. The figure also depicts the comparison of surface tension and viscosity. Table 2 describes the parameters of the ink synthesized using five different percentages of Ag NPs. Physical parameters of the Ag NPs synthesized using various concentrations of silver are described below (Fig. 50).
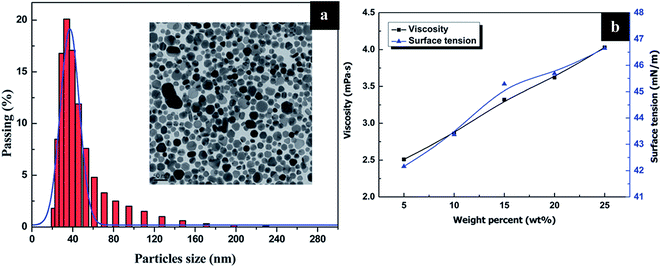 | ||
| Fig. 49 (a) Particle size distribution of Ag NPs (PDA) with TEM image, (b) graph of viscosity and surface tension as a function of wt% (reprinted with permission from ref. 67). | ||
| Ag NPs | Viscosity (mPa s) | Density (×103 kg m3) | Surface tension γ (mN m−1) | Z (1/Oh) |
|---|---|---|---|---|
| 5 wt% | 2.51 | 1.056 | 42.16 | 9.94 |
| 10 wt% | 2.86 | 1.074 | 43.37 | 8.93 |
| 15 wt% | 3.32 | 1.123 | 45.29 | 8.04 |
| 20 wt% | 3.62 | 1.158 | 45.69 | 7.52 |
| 25 wt% | 4.03 | 1.218 | 46.65 | 7.00 |
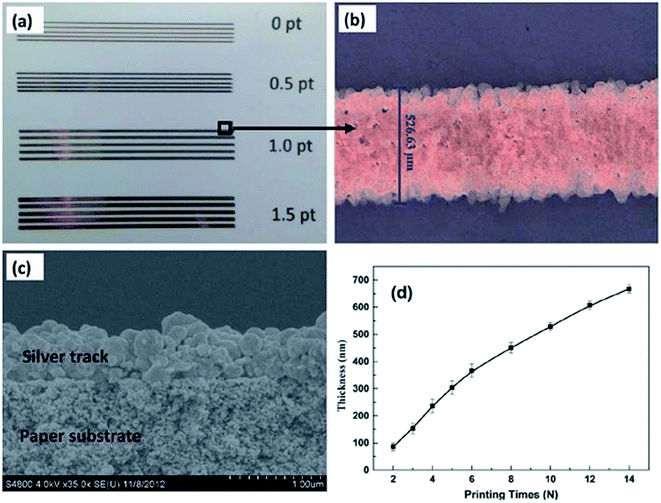 | ||
| Fig. 50 (a) Optical images of silver patterns with different widths, (b) optical image of silver pattern with 1.0 pt width, (c) SEM image of printed silver pattern after heat-curing at 50 °C, (d) thickness of the printed silver pattern measured by profilometer (reprinted with permission from ref. 67). | ||
Reactive transparent silver ink was synthesized using Tollen's process by Lewis et al.71 In this method, silver acetate is mixed in aqueous ammonium hydroxide solution. Formic acid is added dropwise to the reaction mixture. The colour change of the reaction mixture from light orange to brown and further to greyish was observed by the rapid reduction of silver ions to silver particles, and they are filtered by a 200 nm syringe filter.
The optical image of synthesized silver ink is shown in Fig. 51(a). Conductive lines drawn on silicon substrate by a glass nozzle (100 mm diameter) with a 90 °C bend and with contact on substrate are shown in Fig. 51(b). UV-vis absorption spectrum characterized by a standard reference with a background calibration of deionised water is shown in Fig. 51(c). TGA (thermogravimetric analysis) was performed in 79%![[thin space (1/6-em)]](https://www.rsc.org/images/entities/char_2009.gif) :
:![[thin space (1/6-em)]](https://www.rsc.org/images/entities/char_2009.gif) 21% ratio of nitrogen
21% ratio of nitrogen![[thin space (1/6-em)]](https://www.rsc.org/images/entities/char_2009.gif) :
:![[thin space (1/6-em)]](https://www.rsc.org/images/entities/char_2009.gif) oxygen environment at a rate of 100 mL min−1 under 23 °C for 48 h, and another sample was characterized at 10 °C min−1 to 90 °C for 30 min in Fig. 51(d). XRD pattern shows the silver ink's peaks at 39 °C, 45 °C, 65 °C, and 78 °C, with the corresponding planes at (111), (200), (220), and (311), respectively, as shown in Fig. 51(e).
oxygen environment at a rate of 100 mL min−1 under 23 °C for 48 h, and another sample was characterized at 10 °C min−1 to 90 °C for 30 min in Fig. 51(d). XRD pattern shows the silver ink's peaks at 39 °C, 45 °C, 65 °C, and 78 °C, with the corresponding planes at (111), (200), (220), and (311), respectively, as shown in Fig. 51(e).
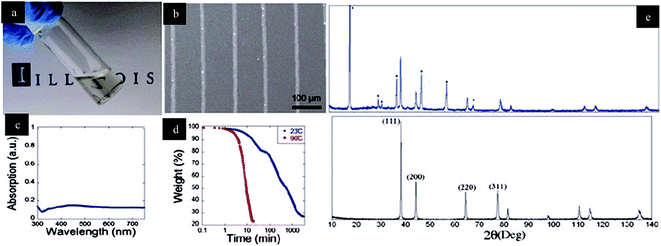 | ||
| Fig. 51 (a) Optical image of transparent silver ink, (b) silver conductive pattern drawn by 100 nm nozzle printed on silicon substrate, (c) UV-visible spectrum, (d) TGA curve measured at 23 to 90 °C in air, (e) XRD pattern of two different conditions at 23 °C for 24 h (on blue pattern) and annealed at 90 °C for 15 min (red patterned graph) (reprinted with permission from ref. 71). | ||
The conductive ink patterns were annealed at different temperatures (40 °C, 80 °C, 90 °C) for 15 min. The patterned silver being dried at 23 °C with a size of 92 ± 12 nm, 84 ± 8 nm, 61 ± 7 nm, and 50 ± 5 nm can be observed in Fig. 52.
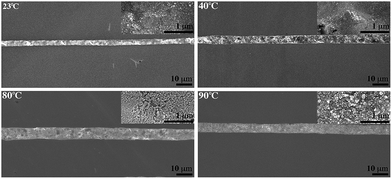 | ||
| Fig. 52 SEM image of silver ink written through a 100 nm nozzle (reprinted with permission from ref. 71). | ||
Using hydrazine hydrate, Guzmán93 synthesized Ag NPs using two stabilizing agents, sodium dodecyl sulphate (SDS) and sodium citrate. The combination of silver nitrate solution and SDS with different concentrations is shown in Fig. 53: (a) hydrazine with SDS, (b) with hydrazine and citrate sodium, (c) hydrazine hydrate citrate sodium and SDS used as a metal salt precursor and stabilizing agent, respectively. Hydrazine hydrate concentration is (2.0 mM to 12 mM and 1.0 mM) and sodium citrate concentration is (1.0 mM to 2.0 mM). Firstly, silver nitrate solution was dissolved in an aqueous solution of SDS and sodium citrate. After change in colour to pale yellow and to pale red, the obtained particles were washed with the help of a centrifuge at least three times under a stream of nitrogen.
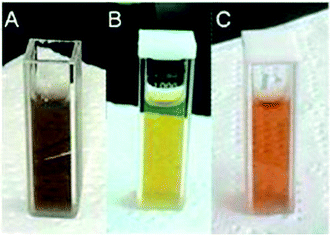 | ||
| Fig. 53 Optical images of obtained Ag NPs: (a) pale brown, (b) pale yellow, and (c) pale red (reprinted with permission from ref. 93). | ||
The structural characterization of Ag NPs was performed by TEM, which shows the NPs have spherical shape with 100 nm scale. Particle size distribution is 8 to 50 nm, with the mean diameter of 24 nm. UV-vis absorption analysis was performed with surface plasmon resonance (SPR) at 418–420 nm (Fig. 54).
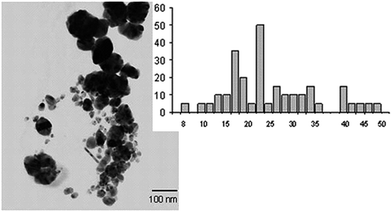 | ||
| Fig. 54 TEM images of Ag NPs and the particle size distribution (reprinted with permission from ref. 93). | ||
3.1 Ag NP synthesis with various reducing agents and stabilizing agents in detail
As discussed above, Ag NPs have been synthesized through various techniques such as physical, chemical, electrochemical, and microwave synthesis. Among all the synthesis techniques, the chemical reduction technique is the most widely followed and researched method for the synthesis of conductive silver ink. Table 3 shows the detailed approach of chemical reduction of Ag salts with different reducing agents for making conductive inks.| S. no. | Metal source | Reducing agent | Stabilizing agent | Size | Ref. |
|---|---|---|---|---|---|
| 1 | Silver nitrate | EG (ethylene glycol) | PVP | 40–380 nm | 94 |
| 2 | Silver nitrate | Sodium hydroxide | PVP | 19 nm | 95 and 96 |
| 3 | Silver nitrate | Trisodium citrate | PVP | 3–10 nm | 97 |
| 4 | Silver nitrate | Ultrasonication | PVP | 10 nm | 11 |
| 5 | Silver nitrate | DEA | PAA | 200–600 nm | 3 and 92 |
| 6 | Silver nitrate | MEA | PAA | 30–50 nm | 67 |
| 7 | Silver nitrate | Hydrazine hydrate | DDA | 5 nm | 98 |
| 8 | Silver nitrate | Hydrazine hydrate | SDS and citrate of sodium | 9–30 nm | 93 |
| 9 | Silver nitrate | Sodium borohydrate | SDS | 30–40 nm | 99 |
| 10 | Silver nitrate | Ascorbic acid | CTAB | 4 nm | 100 |
| 11 | Silver nitrate | — | Sodium oleate | 7–12 nm | 101 |
| 12 | Silver acetate | Formic acid | — | <100 nm | 68 and 71 |
| 13 | Silver acetate | Tin acetate | Oleic acid | 5 nm | 6 |
| 14 | Silver nitrate | Tripropylene glycol, 3-ethyl-3-oxetanemethonal | PVP | 34.4 nm, 100 nm | 90 |
4. Conductive ink formulation
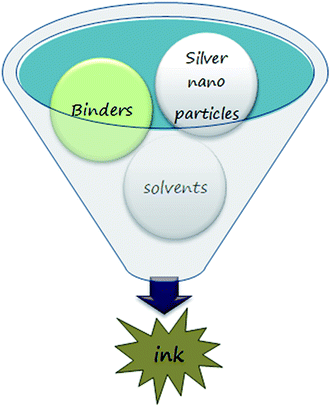
Silver-based conductive ink is highly conductive, and silver possesses a conductive oxide; hence, its permanence is for a longer period compared to copper oxide. Conductive silver inks require elevated temperatures for curing, which opposes its adherence to different types of substrates. Due to the high sintering temperatures, the stabilizing agents, binders, and solvents evaporate, damaging its conductivity and connectivity (Scheme 5).The quality of ink formulation mainly depends on the following factors:
• Reducing agents70–90 are most important to reduce Ag. By using reducing agents, the electron is lost or donated to the acceptor in the chemical reaction (upon which the reducing agent is said to be oxidised). As we discussed above, Table 3 lists some of the best reported reducing agents for producing Ag NPs using various silver salts. Depending upon the reducing agents, the particle size also varies.
• Capping agents/stabilizing agents11,70 are used to prevent the agglomeration of Ag NPs, hence improving the life of the ink. Table 3 lists some of the best capping agents that are available to prepare the Ag NP ink. The most commonly known capping agents include PVP, PEG, and CTAB.
• Viscosity of the ink plays a major role in conductive printing technology. The viscosity of the ink or paste can be measured by the rheometer or viscometer. The conductive ink viscosity varies depending on the application. Inkjet printing on flexible electronics requires less viscous ink with a viscosity range of 2.51 to 4.03 mPa s (ref. 92) and a complex mixture of solvents for both high and low boiling points. As a result, suitable concentration of the solvents is needed to prevent clogging at the nozzle. Screen printing and flexographic printing requires high-viscosity ink between the ranges of 0.05 to 5 Pa s,102 and in this type of printing, the ink should dry quickly. Table 4 illustrates the different viscosities of conductive silver ink based on its application.
| Sl no. | Application | Printing substrate | Ink viscosity | Sintering | Reference |
|---|---|---|---|---|---|
| 1 | Pen | Paper | 0.3 Pa s | 25 °C | 92 |
| 2 | Printing | Paper | 2 Pa s | 23 °C | 67 |
| 3 | PCB | PET, Si, glass substrate | 9.5 cp | 120–150 °C | 71 |
| 4 | Pen | Paper | 1–20 cp | 10–300 °C | 11 |
| 5 | PET | Plastic, glass | ∼7 cp | 425 °C | 98 |
| 6 | Printed electrons, circuits | Silicon (Si), krypton, mica | 7000–7500 cps | 60 °C | 103 |
| 7 | Ink-jet printing | Glass, plastic | 2 Pa s | 50 °C | 104 |
| 8 | Ink-jet printing | PET | 13.8 mPa s | 120 °C | 68 |
| 9 | Ink-jet printing | Polyimide (PI) | 13.8 mPa s | 150 °C | 69 |
| 10 | Gravure printing | Paper, polymer, flexible substrates | 7 Pa s | 120 °C | 105 |
| 11 | Ink-jet printing | Silicon nitride substrate | 1–20 mPa s | 300–500 °C | 2 |
| 12 | Ink-jet printing | Low-temperature co-fired ceramic (LTCC) | 2 mPa s | 25 °C | 65 |
| 13 | Ink-jet printing | Polyimide, kapton | 1.55–11.3 cps | 200 °C | 70 |
| 14 | Ink-jet printing | Plastic, polymeric | ∼10 mPa s | 70–400 °C | 66 |
| 15 | Ink-jet printing | Si, plastic, paper | 2 mPa s | <100 °C | 71 |
| 16 | Screen printing | Office paper | — | 70 °C | 5 |
4.1 Complex composition of nanoparticles and chemicals
Solvents are essential liquid material for the conductive ink to maintain the desired viscosity for each type of printing. The choice of solvents for conductive ink mainly depends on the application and printing surface. In the present trend, many types of solvents are available, such as the liquid-based solvents glycerol, ethylene glycol, ethanol, acetone, ethyl acetate, etc. Particularly, silver ink should be synthesized with precaution. Viscosity is one of the most important parameters in conductive ink formulation. It can be achieved by using a suitable solvent, which gives the conductive ink better adhesion and efficient drying on all types of substrates (paper, glass, PET, etc.). To enhance the conductivity of nanoparticles, a medium is required that can sustain and be dispersed without any change in its properties. Table 3 lists the types of reducing agent materials that are used in conductive silver ink, and it can be observed that ethylene glycol is the most suitable reducing agent that binds the Ag NPs without change in its properties.• Binder is a necessary component for the formulation of conductive ink. Binders are used to bind the particles in the synthesis of conductive inks. A suitable binder is very important for the formulation of inks, and the best-known binder is HEC (hydroxyethyl cellulose).92 Other binders used to obtain the best results of ink synthesis are also reported.67,93 Not only chemical binders, but also natural binders can be used, which are environmentally friendly. Here, the role of binders is to bind the nanoparticles together and help in the prevention of cracks after the patterning process.
• Sintering is a post-treatment process carried out after the printing of conductive ink onto a particular substrate. Sintering is the last process in the application of the conductive ink. Sintering helps the particles to acquire a conductive path. Also, the adhesion of the conductive ink on the substrate is a very important factor, as it improves its life and performance. A conductive ink that requires no sintering can be regarded as a good conductive ink. The sintering process depends on many factors, such as size of the particles, type of binders, solvents, and the substrate on which the conductive ink is being printed or applied. The different sintering temperatures are shown in Table 4.
Recently, researchers have progressed in successfully developing silver inks using low-temperature71,112 sintering and room-temperature sintering.103,113 This can be credited as an outstanding achievement, as it reduces one step in the process when considering the application point of view. A few other sintering techniques that have proved significant in silver inks are photonic sintering,106 plasma sintering,116,117 laser sintering, microwave sintering,114,115 and electric sintering.118,119
5. Adaptive applications of conductive silver ink
6. Printing techniques for conductive inks
The silver inks can be printed by various techniques; some of the popular techniques are discussed below.• Nano imprint lithography120
• Inkjet printing121
• Screen printing122,125
• Embedded 3D printing123
• Flexographic printing124
Wang et al. synthesized a UV-curable resin prepared by mixing nanosized Ag particles grown on modified multi-walled carbon nanotubes (MMWNT).120 These particles were patterned by nano imprint lithography (NIL) with the help of a polydimethylsiloxane (PDMS) stamp. The Ag/MMWNT nanocomposite was doped on a PET substrate by drop casting. PDMS stamp was used as a mask, and the patterned nanocomposite was exposed to UV illumination for 120 s to obtain the solidified film patterns as shown in the SEM and AFM images in Fig. 55.
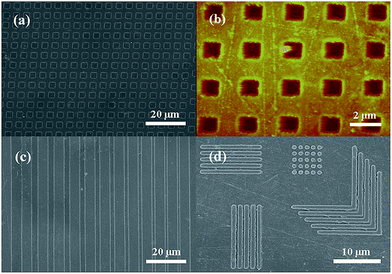 | ||
| Fig. 55 NIL patterns: (a) SEM image of Ag particles with MMWNTs, (b) AFM image of patterned grid, (c) SEM patterned image of 4 to 1 μm, (d) various patterns of Ag nanoparticles/MMWNTs (reprinted with permission from ref. 120). | ||
Inkjet printing121 has become an interesting tool due to its accurately controlled deposition on different substrates, such as paper, glass, PET, and polymer substrates. The advantage of inkjet printing is that it is a low-cost technique to produce electronic printing on large-scale substrates in less time. The particular advantage of inkjet printing is that it has a controllable nozzle to spray ink from the tip of the inkjet printer. There are mainly two types of droplet formations in inkjet printings, which are shown in Fig. 56.
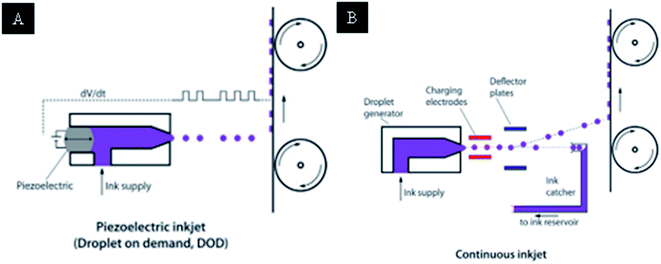 | ||
| Fig. 56 (a) Piezoelectric inkjet principle behind the DOD (drop on demand), (b) continuous-flow inkjet printer (reprinted with permission from ref. 121). | ||
Fig. 56(a) shows the drop on demand (DOD) piezoelectric inkjet. In DOD, the ink will eject from the nozzle to the substrate. The speed of the inkjet printer can be adjustable due to presence of a single nozzle. Fig. 56(b) shows the continuous drop type of inkjet printer, with the flow of ink capable of printing at high speed for the industrial point of view. Inkjet printing with conductive inks is a new processing method with some speed limitations. Conductive inkjet technologies are particularly leading in printing electronics such as PCBs, gadgets, OLEDs, and organic photovoltaic devices. The design of complex patterns with an accurate print can be done by inkjet printer.
Screen printing is a simple, low-cost printing technique that can be adapted to different fabrication processes. It allows printing of a wide variety of materials on a large range of substrates such as glass, silicon, paper, PET, etc. It can be used for printing electronic circuits, sensors, and fuel cells. Screen printing allows the deposition of a wide range of thicknesses, from 10 μm to several hundreds of micrometers. Li et al.122 reported polyaniline/silver NPs using MWCNTs, which were prepared by chemical reduction method using ternary composites of polyaniline (PANI) with the combination of Ag NPs and MWCNT using dodecyl benzene sulfonic acid. Sodium lauryl benzene sulfate (SDBS)/PVP/Ag was used in 1![[thin space (1/6-em)]](https://www.rsc.org/images/entities/char_2009.gif) :
:![[thin space (1/6-em)]](https://www.rsc.org/images/entities/char_2009.gif) 1
1![[thin space (1/6-em)]](https://www.rsc.org/images/entities/char_2009.gif) :
:![[thin space (1/6-em)]](https://www.rsc.org/images/entities/char_2009.gif) 1 ratio under the ultrasonication method at 2–3 h time intervals to obtain MWCNTs with Ag NPs. The ink was used to print the composites of PANI/Ag/MWCNT. Then, the final ink was used to print the conductive line using the screen printing technique. Different conductive ink materials can be printed125 with low cost, such as PET, paper, and PI substrates122 as shown in Fig. 57.
1 ratio under the ultrasonication method at 2–3 h time intervals to obtain MWCNTs with Ag NPs. The ink was used to print the composites of PANI/Ag/MWCNT. Then, the final ink was used to print the conductive line using the screen printing technique. Different conductive ink materials can be printed125 with low cost, such as PET, paper, and PI substrates122 as shown in Fig. 57.
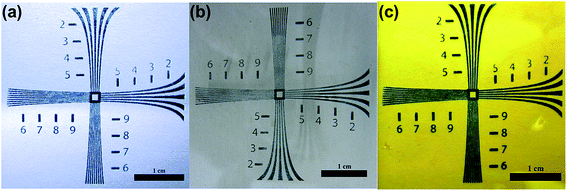 | ||
| Fig. 57 Optical images of different substrates: (a) paper, (b) PET, (c) PI film (reprinted with permission from ref. 122). | ||
Joseph et al.123 reported embedded 3D printing (e-3DP) fabrication of strain sensors with highly conformal, stretchable eco-flex materials. In this process, the conductive ink was prepared by homogenizing with carbon conductive grease followed by mixing with an ARE-310 planetary mixer at 2200 rpm and then loading into 3 cm3 syringes for e-3DP. The (U-shaped) strain sensor was designed using CAD software; the printing speed could be controlled and the nozzle size adjusted; the diameter of the nozzle is 410 μm. Each sensor was printed by varying the speed from 0.5 mm s−1 to 4 mm s−1, as shown in Fig. 58(a) and (b).
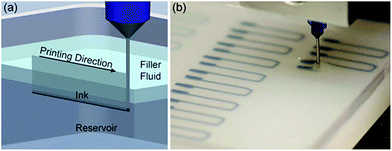 | ||
| Fig. 58 (a) Optical image of e-3DP patterning, (b) a planar array of soft strain sensors (reprinted with permission from ref. 123). | ||
The ink was dropped directly with the help of the nozzle from ink reservoirs through the tip to the elastomeric material. The patterned strain sensors were printed by e-3DP; they have good stretchability, and the adhesion was observed to be compatible for sensitive surfaces such as skin, as shown in Fig. 59.
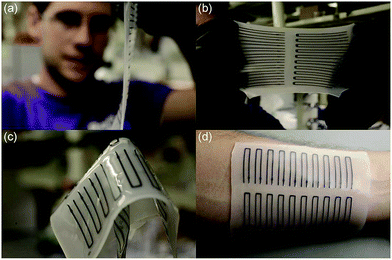 | ||
| Fig. 59 Images of the soft sensors produced by e-3DP. (a) Printed thickness of sheet was ∼1 mm; (b) the sheets are highly extensible and (c) foldable. (d) The sheet is suitable for adhesion to skin (reprinted with permission from ref. 123). | ||
Flexographic printing124 is a faster technique than both screen printing and inkjet printing, and it works better with conductive inks. For large-scale printing in industries, flexographic printing is capable of high-level printing with a high resolution used in the applications of flexible electronics, such as thin film transistors and OLED. The flexible printing technique is similar to gravure printing, a rotational printing method. This technique is mostly used in roll-to-roll packing prints for paper, PET, glass, etc. Fig. 60 presents the flexographic printing metallic Ag ink patterned line on thin silicon wafer.
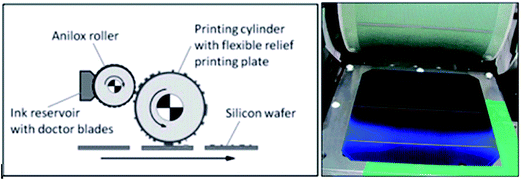 | ||
| Fig. 60 (a) Flexography printing roller schematic on silicon wafer, (b) conductive pattern printed on silicon wafer using flexography technique (reprinted with permission from ref. 124). | ||
7. Applications
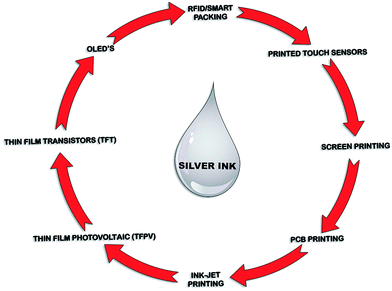
Silver nanoconductive inks are used to fabricate low-voltage circuitry, especially on flexible PCBs, flexible substrates, conductive traces, capacitor and resistor elements, biosensors, and dielectric and encapsulating layers that are compatible with many substrate surfaces including polyester, glass, and ceramic. Silver ink is suitable for screen, flexographic, gravure, photo pattern, and pad printing, as well as other processing techniques (Scheme 6).Conductive inks have a very good market in printed electronics, which is a rapidly developing technology. Due to the presence of extremely small-sized metal nanoparticles (10–100 nm) and the change in chemical and physical properties, conductive inks are considered to be most suitable for printed as well as flexible electronics. Compared to bulk silver, the chemically synthesized Ag NPs have better electrical properties such as electron mobility, low resistivity, work function compatibility, etc. Therefore, the preparation of Ag NPs for a novel application should have the parameters of controlled shape and size to the nanometre level.104 Silver ink has many applications in different fields such as:
• RFID (radio frequency identification) is used in modern transit tickets for smart packing. The printing technology using silver ink has more advantages in this application, which uses RF signals for automatic identification of objects, for example, in logistics and access control. The communication and coupling in the RFID system is based on electromagnetic fields and waves, and it has many advantages compared to other identification systems. Also, conductive ink applied by means of screen printing is suitable for RFID.105,106
• Automotive industries utilise conductive inks in automobile accessories. Windshield defrosters have resistive traces placed on glass, which are patterned by conductive ink and used for safety and control. Automotive sensors include air bag, engine failure, fuel, parking, and brake sensors; some of the internal connections of the head and tail lights are printed or patterned by conductive inks.107,108
• Inkjet printing using silver ink is widely used in printing technology for the printing of circuits with fine line width.106 This inkjet technology has more accurate printing, compared to photolithography. Inkjet has more advantage without masking. The silver ink is usually selected in the inkjet printing process because of its excellent conductivity and better viscosity. It can be printed on photopaper and used for mini projects in academics, which are easy to print by inkjet printer.
• Silver conductive inks have major uses in screen printing,109 for PCB interconnections present inside the keyboard can be replaced by screen printing of conductive inks. Inks can be printed on ITO substrates, Teflon, and silicon substrate, and they can be used to print on solar cell electrode substrates.
• Touch screens generally use transparent conductive oxide, but have some limitations such as low transmittance (<80%), work function incompatibility, etc. These limitations can be overcome by printing transparent conductive patterns using conductive inks.110
• Membrane touch switch (MTS) is a well-known application in the field of printed electronics. Silver conductive ink can be printed on flexible substrates,111 which are separated by PTF (polymer thick film) substrates on digital systems like computer keyboards, mobiles, LCDs, etc.
• Thin film photovoltaic (TFPV) solar cells have vast use of silver inks for the formation of electrical contacts between the silicon-based circuits of the solar cells. Organic TFT is used in display technology. Conductive inks have been used as a replacement for expensive conductive patterns in TFT-based displays.110,111 Apart from the abovementioned applications, silver ink can also be used in the area of printed batteries, flexible displays, OLEDs, smart textiles, and self-regulating heaters.
8. Future perspectives
The silver inks reported to date have been used for decades in a variety of electronic applications. A positive side is that the silver nanoinks are used in photovoltaics. In particular, silver has one of the best electrical and thermal stabilities, and the printed electronics field has the major advantage of using silver nano ink in day-to-day electronic industries. Silver-based ink has the added advantages that no other metal-based ink does: high conductivity, tunable uniform particle size, and a low sintering temperature. Silver inks have recently been used in applications like ITO and FTO replacement, and PV cells are patterned with tunable materials for cathodes in OLEDs and solar cells. Currently, researchers are focusing on hybrid combinations inks with silver and copper,82 CNTs,34 and graphene to improve conductivity, and also on the modification of silver nanoinks in the aspect of its colour. All the commercially available conductive inks have a uniform colour of silver (grey). Further research is needed in the synthesis of silver particles to use additives and create different colour combinations of the silver hybrid ink.45–47 Silver ink has huge demand in the future printed electronics industry, and its special features make it an unbeatable material.9. Conclusion
Silver is one of the most desired materials widely used in conductive inks. The present conductive ink applications on printed electronics have a very bright market. Researchers are focusing on silver ink due to its effective properties compared to other materials such as copper. Conductive ink patterns can be utilized in flexible electronics and optoelectronics applications. Silver has been considered to be a better pigment material in conductive inks due to its high electrical and thermal properties. In this review, we provided a comprehensive understanding of the synthesis of Ag NPs by various chemical methods for conductive ink formulation. From the cost point of view, chemical methods are best for the synthesis of Ag ink. It is actually quite easy to prepare Ag NPs and then process them into ink. We believe that we have discussed all the possibilities for preparing silver conductive ink with the help of some reported articles. We trust that this review may help in better understanding the preparation and applications of conductive ink.Acknowledgements
Authors are thankful to CSIR-TAPSUN-NWP-0054 for financial support. We also gratefully acknowledge DST-UK (‘APEX’) for their support. Authors show their gratitude to all the researchers who contributed to the work cited in this article.Notes and references
- H. C. Lin, D. P. Spittlehouse and Y. W. Hsueh, 13th Photovoltaic Specialists Conference, Washington, 1978, p. 593 Search PubMed
.
- Q. Huang, W. Shen and W. Song, Appl. Surf. Sci., 2012, 258, 7384 CrossRef CAS PubMed
.
- B. Y. Ahn and J. A. Lewis, Mater. Chem. Phys., 2014, 148, 686–691 CrossRef CAS PubMed
.
- M. Layani, M. Grouchko, S. Shemesh and S. Magdassi, J. Mater. Chem., 2012, 22, 14349 RSC
.
- W. R. De Araujo and T. R. L. C. Paix, Analyst, 2014, 139, 2742 RSC
.
- K. J. Lee, B. H. Jun, J. Choi, Y. I. Lee, J. Joung and Y. S. Oh, Nanotechnology, 2007, 18, 335601 CrossRef
.
- S. A. Odom, S. Chayanupatkul, B. J. Blaiszik, O. Zhao, A. C. Jackson, P. V. Braun, N. R. Sottos, S. R. White and J. S. Moore, Adv. Mater., 2012, 24, 2578 CrossRef CAS PubMed
.
- S. Seefeld, M. Limpinsel, Y. Liu, N. Farhi, A. Weber, Y. Zhang, N. Berry, Y. J. Kwon, C. L. Perkins, J. C. Hemminger, R. Wu and M. Law, J. Am. Chem. Soc., 2013, 135, 4412 CrossRef CAS PubMed
.
- S. Magdassi, M. Grouchko, D. Toker, A. Kamyshny, I. Balberg and O. Millo, Langmuir, 2005, 21, 10264 CrossRef CAS PubMed
.
- S. J. Chen, Y. Y. Feng and S. Y. Li, 28th IEEE International conference on MEMS, Portugal, 2015, p. 1075 Search PubMed
.
- M. C. Dang, T. M. D. Dang and E. Fribourg-Blanc, Adv. Nat. Sci.: Nanosci. Nanotechnol., 2015, 6, 015003–0150012 CrossRef CAS
.
- S. Kim and H. J. Sung, J. Micromech. Microeng., 2015, 25, 04 Search PubMed
.
- G. Mckerricher, J. G. Perez and A. Shamim, IEEE Trans. Electron Devices, 2015, 62, 3 CrossRef
.
- J. Wu, R. Wang, H. Yu, G. Li, K. Xu, N. C. Tien, R. C. Roberts and D. Li, Lab Chip, 2015, 15, 690 RSC
.
- V. S. Romaguera, S. Wünscher, B. M. Turki, R. Abbel, S. Barbosa, D. J. Tate, D. Oyeka, J. C. Batchelor, E. A. Parker, U. S. Schubert and S. G. Yeates, J. Mater. Chem. C, 2015, 3, 2132 RSC
.
- J. H. Choi, K. Ryu, K. Park and S. J. Moon, Int. J. Heat Mass Transfer, 2015, 85, 904 CrossRef CAS PubMed
.
- D. Y. Wang, Y. Chang, Q. S. Lu and Z. G. Yang, Adv. Perform. Mater., 2015, 30, 54 Search PubMed
.
- A. Kalio, M. Leibinger, A. Filipovic, K. Krüger, M. Glatthaar and J. Wilde, Sol. Energy Mater. Sol. Cells, 2012, 106, 51 CrossRef CAS PubMed
.
- G. Wang, Z. Wanga, Z. Liu, J. Xue, G. Xin, Q. Yu, J. Lian and M. Y. Chen, Chem. Eng. J., 2015, 260, 582–589 CrossRef CAS PubMed
.
- M. Grouchko, A. Kamyshny, K. Ben-Ami and S. Magdassi, J. Nanopart. Res., 2009, 11, 713–716 CrossRef CAS
.
- S. Fujii and H. Watanabe, US Patent No. 5174925A, Dec 29, 1992
.
- S. J. Joo, H. J. Hwang and H. S. Kim, Nanotechnology, 2014, 25, 265601 CrossRef PubMed
.
- S. J. Joo, S. H. Park, C. J. Moon and H. S. Kim, ACS Appl. Mater. Interfaces, 2015, 7, 5674 CAS
.
- D. H. Shin, S. Woo, H. Yem, M. Cha, S. Cho, M. Kang, S. Jeong, Y. Kim, K. Kang and Y. Piao, ACS Appl. Mater. Interfaces, 2014, 6, 3312 CAS
.
- T. Zhang, X. Wang, T. Li, Q. Guo and J. Yang, J. Mater. Chem. C, 2014, 2, 286 RSC
.
- J. H. Yu, K. T. Kang, J. Y. Hwang, S. H. Lee and H. Kang, Int. J. Precis. Eng. Manuf., 2014, 15, 1051 CrossRef
.
- S. H. Kim and C. W. Park, Bull. Korean Chem. Soc., 2013, 34, 831 CrossRef CAS
.
- W. Cui, W. Lu, Y. Zhang, G. Lin, T. Wei and L. Jiang, Colloids Surf., A, 2010, 358, 35 CrossRef CAS PubMed
.
- H. M. Nur and J. H. Song, J. Mater. Sci.: Mater. Electron., 2002, 13, 213 CrossRef CAS
.
- Y. H. Jo, I. Jung, C. S. Choi, I. Kim and H. M. Lee, Nanotechnology, 2011, 22, 225701 CrossRef PubMed
.
- P. S. Karthik, A. L. Himaja and S. P. Singh, Carbon Lett., 2014, 15, 219 CrossRef
.
- M. Dragoman, E. Flahaut, D. Dragoman, M. Al Ahmad and R. Plana, Nanotechnology, 2009, 37, 375203 CrossRef PubMed
.
- J. Wang and M. Musameh, Analyst, 2004, 129, 1 RSC
.
- N. Rouhi, D. Jain and P. J. Burke, ACS Nano, 2011, 5, 8471 CrossRef CAS PubMed
.
- E. B. Secor, P. L. Prabhumirashi, K. Puntambekar, M. L. Geier and M. C. Hersam, J. Phys. Chem. Lett., 2013, 4, 1347–1351 CrossRef CAS PubMed
.
- F. J. Tölle, M. Fabritius and R. Mülhaupt, Adv. Funct. Mater., 2012, 22, 1136 CrossRef PubMed
.
- Y. Gao, W. Shi, W. Wang, Y. Leng and Y. Zhao, Ind. Eng. Chem. Res., 2014, 53, 16777–16784 CrossRef CAS
.
- X. Han, Y. Chen, H. Zhu, C. Preston, J. Wan, Z. Fang and L. Hu, Nanotechnology, 2013, 24, 205304 CrossRef CAS PubMed
.
- A. Knobloch, A. Manuelli, A. Bernds and W. Clemens, J. Appl. Phys., 2004, 96, 2286 CrossRef CAS PubMed
.
- D. Hohnholz, H. Okuzaki and A. G. Macdiarmid, Adv. Funct. Mater., 2005, 15, 51 CrossRef CAS PubMed
.
- A. Denneulin, J. Bras, A. Blayo, B. Khelifi, F. R. Dherbey and C. Neuman, Nanotechnology, 2009, 20, 385701 CrossRef PubMed
.
- K. Woo, D. Kim, J. S. Kim, S. Lim and J. Moon, Langmuir, 2009, 25, 429–433 CrossRef CAS PubMed
.
- L. Y. Xu, G. Y. Yang, H. Y. Jing, J. Wei and Y. D. Han, Nanotechnology, 2014, 25, 055201 CrossRef CAS PubMed
.
- J. W. Liu, W. R. Huang, M. Gong, M. Zhang, J. L. Wang, J. Zheng and S. H. Yu, Adv. Mater., 2013, 25, 5910 CrossRef CAS PubMed
.
- C. N. Hoth, S. A. Choulis, P. Schilinsky and C. J. Brabec, Adv. Mater., 2007, 19, 3973 CrossRef CAS PubMed
.
- Q. Guo, H. W. Hillhouse and R. Agrawal, J. Am. Chem. Soc., 2009, 131, 11672 CrossRef CAS PubMed
.
- Z. Liu, K. Parvez, R. Li, R. Dong, X. Feng and K. Müllen, Adv. Mater., 2015, 27, 669 CrossRef CAS PubMed
.
- Y. D. Tretyakov, A. V. Lukashin and A. A. Eliseev, Russ. Chem. Rev., 2004, 73, 899 CrossRef CAS PubMed
.
- D. Yoshitakmasuv, K. Baba, H. Kasai, K. Nishida and H. Nakanishi, Functional Organic Nanocrystals, Nanocrystals, ISBN: 978-953-307-199-2, 2011, p. 401, http://www.intechopen.com/books/nanocrystal/functional-organic-nanocrystals Search PubMed
.
- S. A. Harfenist, Z. L. Wang, R. L. Whetten, I. Vezmar and M. M. Alvarez, Adv. Mater., 1997, 9, 817 CrossRef CAS PubMed
.
- F. Mafune, J. Kohno, Y. Takeda, T. Kondow and H. Sawabe, J. Phys. Chem. B, 2000, 104, 9111 CrossRef CAS
.
- Y.-H. Chen and C.-S. Yeh, Colloids Surf., A, 2000, 197, 133–139 CrossRef
.
- M. C. Moulton, L. K. Braydich-Stolle, M. N. Nadagouda, S. Kunzelman, S. M. Hussaina and R. S. Varma, Nanoscale, 2012, 2, 763–770 RSC
.
- R. S. Jawaad, K. F. Sultan and A. H. Al-Hamadani, Asian Research Publishing Network, 2014, 9, 586 CAS
.
- S. Iravani, H. Korbekandi, S. V. Mirmohammadi and B. Zolfaghari, Res. Pharm. Sci., 2014, 9, 385 CAS
.
- J. Harra, J. Makitalo, R. Siikanen, M. Virkki, G. Genty, T. Kobayashi, M. Kauranen and J. M. Makela, J. Nanopart. Res., 2012, 14, 870 CrossRef PubMed
.
- R. Zamiri, B. Z. Azmi, H. A. Ahangar, G. Zamiri, M. Shahril Husin and Z. A. Wahab, Bull. Mater. Sci., 2012, 356, 727 CrossRef
.
- F. H. Froes and B. Trindade, J. Mater. Process. Technol., 2014, 153–154, 472 Search PubMed
.
- G. R. Khayati and K. Janghorban, Trans. Nonferrous Met. Soc. China, 2013, 23, 1520 CrossRef CAS
.
- Y. Tokoi, K. Josho, Y. M. Izuari, T. Suzuki, T. Nakayama, H. Suematsu, S. W. Lee, Z. Fu and K. Niihara, International Symposium on Multifunctional Ceramic Materials Based on Nanotechnology, 2011, vol. 20, 012008.
- H. S. Kim, K. H. Lee and S. G. Kim, Aerosol Sci. Technol., 2006, 40, 536 CrossRef CAS PubMed
.
- S. Navaladian, B. Viswanathan, R. P. Viswanath and T. K. Varadarajan, Nanoscale Res. Lett., 2007, 2, 44 CrossRef CAS PubMed
.
- Y. Li, Y. Wu and B. S. Ong, J. Am. Chem. Soc., 2005, 127, 3266 CrossRef CAS PubMed
.
- Z. Li, R. Zhang, K. S. Moon, Y. Liu, K. Hansen, T. Le and C. P. Wong, Adv. Funct. Mater., 2013, 23, 1459 CrossRef CAS PubMed
.
- A. Kosmala, R. Wright, Q. Zhang and P. Kirby, Mater. Chem. Phys., 2011, 129, 1075 CrossRef CAS PubMed
.
- D. Kim and J. Moonz, Electrochem. Solid-State Lett., 2005, 8, J30 CrossRef CAS PubMed
.
- W. Shen, X. Zhang, Q. Huang, Q. Xu and W. Song, Nanoscale, 2014, 6, 1622 RSC
.
- Y. Tao, Y. Tao, B. Wang, L. Wang and Y. Tai, Nanoscale Res. Lett., 2013, 8, 296 CrossRef PubMed
.
- C. Yu, D. Y. Wang, Y. L. Tai and Z. G. Yang, J. Mater. Chem., 2012, 22, 25296 RSC
.
- J. T. Wu, S. L. C. Hsu, M. H. Tsai and W. S. Hwang, J. Phys. Chem. C, 2010, 114, 4659 CAS
.
- W. S. Brett and A. L. Jennifer, J. Am. Chem. Soc., 2012, 134, 1419 CrossRef PubMed
.
- S. Valizadeh, A. Jan and K. Schweitz, Proc. SPIE, 2006, 1134 CAS
.
- A. K. Rashid, R. R. Khaydarov, O. Gapurova, Y. Estrin and T. Scheper, J. Nanopart. Res., 2009, 11, 1193 CrossRef
.
- R. K. Ibrahim, S. S. Ahmed, A. N. Naje and A. M. Suhail, Indian J. Appl. Res., 2013, 3, 5 Search PubMed
.
- M. Virginia Roldán, N. Pellegri and O. de Sanctis, J. Nanopart., 2013, 7, 524150 Search PubMed
.
- B. Yin, H. Ma, S. Wang and S. Chen, J. Phys. Chem. B, 2003, 107, 8898 CrossRef CAS
.
- L. Rodrıguez-Sanchez, M. C. Blanco and M. A. Lopez-Quintela, J. Phys. Chem. B, 2000, 104, 9683 CrossRef
.
- H. Bar, D. K. Bhui, G. P. Sahoo, S. Priyanka, P. D. Sankar and A. Misra, Colloids Surf., A, 2009, 339, 134 CrossRef CAS PubMed
.
- E. K. Elumalai, K. Kayalvizhi and S. Silvan, J. Pharm. BioAllied Sci., 2014, 6, 241 CrossRef CAS PubMed
.
- G. Pai, N. Dayal, C. D. Shettigar, P. Patail and M. Thakur, MGM Journal of Medical Sciences, 2014, 1, 117 CrossRef
.
- D. Stuerga and M. Delmotte, Microwaves in Organic Synthesis, ed. A. Loupy, Wiley-VCH, Weinheim, 2002, pp. 1–34 Search PubMed
.
- K. V. Abhinav, R. V. Krishna Rao, P. S. Karthik and S. P. Singh, RSC Adv., 2015, 5, 63985 RSC
.
- D. V. Stass, J. R. Woodward, C. R. Timmel, P. J. Hore and K. A. McLauchlan, Chem. Phys. Lett., 2000, 329, 22 CrossRef
.
- Z. Jie, S. Junjun, P. Yueyue, L. Xiaoli and Z. Li, Synthesis of uniform silver nanoparticles by a microwave method in polyethylene glycol with the assistant of polyvinylpyrrolidone, Wuhan University and Springer-Verlag Berlin, Heidelberg, 2013, vol. 6, p. 530 Search PubMed
.
- K. J. Sreeram, M. Nidhin and B. U. Nair, Bull. Mater. Sci., 2008, 31, 7 CrossRef
.
- S. Joseph and B. Mathew, Res. J. Recent Sci., 2014, 3, 185 CAS
.
- J. P. Manas, K. Deb and D. K. Deshmukh, Appl. Nanosci., 2014, 4, 507 CrossRef
.
- Y. Tang, W. He, S. W. Z. Tao and L. Cheng, J. Mater. Sci.: Mater. Electron., 2014, 25, 2929 CrossRef CAS
.
- S. Hemmati, D. P. Barkey, N. Gupta and R. Banfield, ECS J. Solid State Sci. Technol., 2015, 4, P3075 CrossRef CAS PubMed
.
- T. H. Chiang, K. D. Wu and T. E. Hsieh, IEEE Trans. Nanotechnol., 2014, 13, 116 CrossRef CAS
.
- J. E. Q. Quinsaat, A. Testino, S. Pin, T. Huthwelker, F. A. Nuesch, P. Bowen, H. Hofmann, C. Ludwig and D. M. Opris, J. Phys. Chem. C, 2014, 118, 11093–11103 CAS
.
- A. Russo, B. Y. Ahn, J. J. Adams, E. B. Duoss, J. T. Bernhard and J. A. Lewis, Adv. Mater., 2011, 23, 3426 CrossRef CAS PubMed
.
- M. G. Guzmán, J. Dille and S. Godet, Int. J. Chem. Biomol. Eng., 2009, 2, 104 Search PubMed
.
- J. J. Zhu, C. X. Kan, J. G. Wan, M. Han and G. H. Wang, J. Nanomater., 2011, 982547, 7 Search PubMed
.
- I. Alghoraibi and A. Alahmad, Int. J. ChemTech Res., 2014, 6, 871 CAS
: IJCRGG ISSN, 0974–4290.
- Y. C. Lu and K. S. Chou, J. Chin. Inst. Chem. Eng., 2008, 39, 673 CrossRef CAS PubMed
.
- J. S. G. Cynthia, V. Joseph, V. Kannappan and D. Roopsingh, J. Nanomater., 2011, 825637, 5 Search PubMed
.
- W. Yang, C. Liu, Z. Zhang, Y. Liu and S. Nie, J. Mater. Sci.: Mater. Electron., 2013, 24, 628 CrossRef CAS
.
- K. C. Song, S. M. Lee, T. S. Park and B. S. Lee, Korean J. Chem. Eng., 2009, 26, 153 CrossRef CAS
.
- N. R. Jana, L. Gearheart and C. J. Murphy, Chem. Commun., 2001, 7, 617 RSC
.
- D. K. Lee and Y. S. Kang, ETRI Journal, 2004, 26, 3 Search PubMed
.
- Y. Aleeva and B. Pignataro, J. Mater. Chem. C, 2014, 2, 6436 RSC
.
- M. Layani and S. Magdassi, J. Mater. Chem., 2011, 21, 15378 RSC
.
- S. C. Hung, O. A. Nafday, J. R. Haaheim, F. Ren, G. C. Chi and S. J. Pearton, J. Phys. Chem. C, 2010, 114, 9672 CAS
.
- E. Hrehorova, M. Rebros, A. Pekarovicova, B. Bazuin, A. Ranganathan, S. Garner, G. Merz, J. Tosch and R. Boudreau, J. Disp. Technol., 2011, 7, 6 Search PubMed
.
- J. Perelaer, B. Jan de Gans and U. S. Schubert, Adv. Mater., 2006, 18, 2101 CrossRef CAS PubMed
.
- W. J. Fleming, IEEE Sens. J., 2001, 1, 4 CrossRef
.
- W. J. Fleming, IEEE Sens. J., 2008, 8, 11 CrossRef
.
- F. C. Krebs, Sol. Energy Mater. Sol. Cells, 2009, 93, 484 CrossRef CAS PubMed
.
- http://www.atmel.com/products/TouchSolutions/touch_sensors/default.aspx.
- http://www.dupont.com/products-and-services/electronic-electrical%20materials/printed-electronics/products/membrane-touch-swith-materials.html.
- A. L. Dearden, P. J. Smith, D. Y. Shin, N. Reis, B. Derby and P. O'Brien, Macromol. Rapid Commun., 2005, 26, 315 CrossRef CAS PubMed
.
- M. Grouchko, A. Kamyshny, C. F. Mihailescu, D. F. Anghel and S. Magdassi, ACS Nano, 2011, 5, 3354 CrossRef CAS PubMed
.
- J. Perelaer, M. Klokkenburg, C. E. Hendriks and U. S. Schubert, Adv. Mater., 2009, 21, 4830 CrossRef CAS PubMed
.
- J. Perelaer, R. Abbel, S. Wünscher, R. Jani, T. V. Lammeren and U. S. Schubert, Adv. Mater., 2012, 24, 2625 Search PubMed
.
- I. Reinhold, C. E. Hendriks, R. Eckardt, J. M. Kranenburg, J. Perelaer, R. R. Baumannbd and U. S. Schubert, J. Mater. Chem., 2009, 19, 3384 RSC
.
- S. Wünscher, S. Stumpf, A. Teichler, O. Pabst, J. Perelaer, E. Beckertd and U. S. Schubert, J. Mater. Chem., 2012, 22, 24569 RSC
.
- M. Allen, A. Alastalo, M. Suhonen, T. Mattila, J. Leppäniemi and H. Seppä, IEEE Trans. Microwave Theory Tech., 2011, 59, 1419 CrossRef
.
- M. Hummelgård, R. Zhang, H. E. Nilsson and H. Olin, PLoS One, 2011, 2, e17209 Search PubMed
.
- P. Wang, J. Guo, H. Wang, Y. Zhang and J. Wei, J. Phys. Chem. C, 2009, 113, 8118 CAS
.
- R. S. Øndergaard, M. Hösel, D. Angmo, T. T. Lrsen-Olsen and F. C. Krebs, Mater. Today, 2012, 15, 36 CrossRef
.
- J. Li, L. Liu, D. Zhang, D. Yang, J. Guo and J. Wei, Synth. Met., 2014, 192, 15 CrossRef CAS PubMed
.
- T. M. Joseph, D. M. Vogt, R. L. Truby, Y. Menguc, D. B. Kolesky, R. J. Wood and J. A. Lewis, Adv. Mater., 2014, 26, 6307 CrossRef PubMed
.
- A. Lorenz, A. kalio, G. T. Hofmeister, S. Nold, L. Fridrich, A. Kraft, J. Bartsch, D. Wolf, M. Dreher, F. Clement and D. Biro, European PV solar Energy Conference and Exhibition, 2013 Search PubMed
.
- H. Wang, J. Guo, J. Li and J. Wei, Carbon, 2011, 49, 779 CrossRef CAS PubMed
.
| This journal is © The Royal Society of Chemistry 2015 |


