A stabilized lamellar liquid crystalline phase with aggregation-induced emission features based on pyrrolopyrrole derivatives†
Shuangxiong
Dai
a,
Zhengxu
Cai
 a,
Zhe
Peng
a,
Zhi
Wang
a,
Bin
Tong
a,
Zhe
Peng
a,
Zhi
Wang
a,
Bin
Tong
 *a,
Jianbing
Shi
 a,
Shenglong
Gan
b,
Qiming
He
c,
Wei
Chen
 bc and
Yuping
Dong
 *a
*a
aBeijing Key Laboratory of Construction Tailorable Advanced Functional Materials and Green Applications, School of Material Science & Engineering, Beijing Institute of Technology, 5 South Zhongguancun Street, Beijing, 100081, China. E-mail: tongbin@bit.edu.cn; chdongyp@bit.edu.cn
bMaterials Science Division, Argonne National Laboratory, 9700 Cass Avenue, Lemont, Illinois 60439, USA
cInstitute for Molecular Engineering, The University of Chicago, 5640 South Ellis Avenue, Chicago, Illinois 60637, USA
First published on 2nd April 2019
Abstract
Aggregation-induced emission (AIE) overcoming the drawback of aggregation-caused quenching (ACQ) makes it possible to access the fluorescence emission of chromophores in the solid state. The development of AIE-active liquid crystals has attracted extensive attention in recent years. Herein, a series of novel (A–D–A)-type AIE-active dyes with different lengths of flexible alkyl chains based on pyrrolopyrrole cores were prepared. Among these compounds, TPPP-C1,2,3 with shorter alkyl chains possessed a more excellent AIE performance; however, they were unable to form a liquid crystalline (LC) phase. Upon increasing the length of alkyl chains, TPPP-C4,5,6,7,8,12 exhibited declining fluorescence emission efficiency in the aggregation states, and only TPPP-C6,7,8,12 with even longer alkyl chains exhibited the LC properties. Thus, all the nine TPPP compounds were AIE-active dyes, whereas TPPP-C6,7,8,12 were AIE-active liquid crystals. Polarized optical microscopy and differential scanning calorimetry experimental results indicated that the LC phases of the four AIE-active liquid crystals were only formed during the cooling process. However, once formed, the LC phases were very stable and could be retained for several months. This might be due to the freezing of intertwined alkyl chains during the cooling process; this was supported by grazing incidence wide-angle X-ray scattering measurements. The models of molecular organization in the LC states were built, and they showed well-organized lamellar structures.
1. Introduction
The development and utilization of liquid crystals (LCs) has made significant advances.1,2 In recent years, luminescent display materials, such as light-emitting liquid crystalline (LC) displays,3–9 organic light-emitting diodes,10,11 organic optoelectronics,12,13 and sensors,14–17 have attracted researchers’ interests due to their growing applications and requirements. However, many luminescent molecules are highly emissive in solution but quenched in aggregate states. This phenomenon has been documented as aggregation-caused quenching (ACQ).18 There remain challenges to obtain high-efficiency luminous materials.In 2001, Tang and co-workers reported a novel phenomenon of the aggregation-induced emission (AIE) of some propeller-shaped molecules.18–20 Owing to the twisted configuration, AIE molecules show opposite features with the ACQ phenomenon: highly emissive in the aggregate states but quenched in pure solutions. This twisted structure greatly restricts the strong intermolecular π–π interactions; thus, the emission efficiency is significantly increased.21–24 The utilization of the AIE phenomenon to synthesize luminescent LCs is attracting extensive attention from researchers.
To date, researchers have synthesized some luminescent LCs. Wang and Lai et al. reported the preparation of AIE-LCs based on 2,3,4,5-tetraphenylsilole functionalized with long-chain alkoxydiacylamido.25 They used silole as the AIE core and benzene–amide–benzene as LC units. The two derivatives were self-assembled into a LC phase over a wide temperature range, and these were affected by the length of alkyl chains. Tang et al. described the preparation of TPE4Mes,26 which took tetraphenylethylene (TPE) as the AIE core linked with four peripheral mesogenic substituents. TPE4Mes combined both AIE and LC features. Two different smectic phases, respectively, emerged at 194.2 °C and 140.8 °C upon cooling from the isotropic state. Wang et al. prepared two kinds of AIE-LCs,10 which took TPE as the emissive core and a 4-cynobiphenyl moiety as the mesogenic unit. The LC phases of the two AIE-LCs were observed in the heating process, and they were self-assembled into smectic and oblique phases, respectively. The published AIE-LC research works mainly focused on employing TPE as AIE-active cores.5,6,9,11,27–31 Fewer other kinds of AIE units have been adopted to synthesize AIE-LC compounds.14,32–35
In this paper, we constructed AIE-LCs based on the AIEgens of 1,2,4,5-tetraphenyl-1,4-dihydropyrrolo[3,2-b]-pyrrole (TPPP) developed by our groups.36,37 As shown in Scheme 1, a series of TPPP derivatives (TPPP-Cn) were synthesized. TPPP with typical propeller-like structures served as the AIE activity units, then different lengths of flexible chains were linked to this TPPP core through ester groups on benzene rings in the 1,4-position. The research results showed that all the compounds (TPPP-C1–8,12) were AIE-active dyes, while TPPP-C6,7,8,12 also exhibited LC properties and were proved to be AIE-active LCs. TPPP was first reported as a functional unit exhibiting both AIE and LC properties, which could lead to the development of new functional materials.
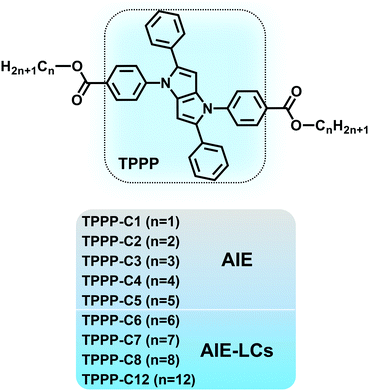 | ||
| Scheme 1 Molecular structures of the nine TPPP derivatives. TPPP-C1,2,3,4,5 with AIE properties and TPPP-C6,7,8,12 with both AIE and LC properties. | ||
2. Experimental
2.1 Synthesis of TPPP derivatives
The synthetic routes for the TPPP derivatives are shown in Scheme S1 in the ESI,† and the preparation method is available as reported in the literature.38,39 Despite the low yields (10–14%), these TPPP derivatives could be easily obtained using only one synthetic step. All the TPPP derivatives were characterized by 1H NMR and 13C NMR spectroscopy and MALDI-MS to confirm their structures.2.2 Grazing incidence wide-angle X-ray scattering measurements
Grazing incidence wide-angle X-ray scattering (GIWAXS) measurements were performed using Beamline 8ID-E at the Advanced Photon Source (APS), Argonne National Laboratory, using X-rays with a wavelength of λ = 1.136 Å and a beam size of ∼200 μm (horizontal) and 20 μm (vertical). The molecular organization of TPPP-C6 and TPPP-C12 in the LC phase were investigated by GIWAXS. The samples of LC phase thin film were obtained by cooling from the isotropic liquid phase at a very slow rate of 0.5 °C min−1 on Si substrates. A two-dimensional (2D) area detector was used to capture the scattering patterns from the prepared samples for the GIWAXS measurements. qy and qz scans are the horizontal and vertical linecuts of the 2D GIWAXS patterns, which represent the information related to the parallel and perpendicular wave vector transfers with respect to the substrate surface, respectively. The scattering vector q is expressed by 4π![[thin space (1/6-em)]](https://www.rsc.org/images/entities/char_2009.gif) sin
sin![[thin space (1/6-em)]](https://www.rsc.org/images/entities/char_2009.gif) θ/λ and the d-spacing of a peak is expressed by 2π/q (q = 4π
θ/λ and the d-spacing of a peak is expressed by 2π/q (q = 4π![[thin space (1/6-em)]](https://www.rsc.org/images/entities/char_2009.gif) sin
sin![[thin space (1/6-em)]](https://www.rsc.org/images/entities/char_2009.gif) θ/λ, d = 2π/q), where θ is the half scattering angle.
θ/λ, d = 2π/q), where θ is the half scattering angle.
2.3 Materials and measurement
Aniline derivatives were commercially obtained from Energy Chemical Company Ltd and J&K Chemical Company. Other chemicals were purchased from Aladdin and Beijing Chemical Reagent companies. 1H NMR and 13C NMR spectra were measured on a Bruker AV 400 instrument using CDCl3 as a solvent. Mass spectra (MS) were collected using a Bruker Autoflex III MALDI-TOF instrument. UV-vis spectra were recorded on a TU-1901 double beam UV-vis spectrophotometer. Fluorescence spectra were measured on a Hitachi F-7000 fluorescence spectrophotometer. The absolute fluorescence quantum yield and fluorescence lifetime measurements were acquired using an Edinburgh FLS980 lifetime and steady state spectrometer. The temperature-dependent fluorescence spectra were also recorded on the Edinburgh FLS980 lifetime and steady state spectrometer using an Oxford Optistat DN2 heating unit, and the temperature was controlled by ITC 503 Version 4.01 (c) software. Thermogravimetric analysis (TGA) was carried out on a Shimadzu DTG-60H at a heating rate of 10 °C min−1 under a nitrogen flow. A differential scanning calorimeter (DSC) was measured on a TA DSC Q2000. Polarized optical microscopy (POM) was carried out using a Nikon LV100N Polar Microscope equipped with a heating stage. Density functional theory (DFT) calculations were performed using the Gaussian 09 package. The crystallographic structures were analyzed on a Rigaku CCD Saturn 724+ X-ray single crystal diffractometer with an X-ray beam wavelength of 0.71073 nm.3. Results and discussion
3.1 Photophysical properties
The UV-vis absorption spectra of the TPPP derivatives were measured in THF solution at room temperature (Fig. 1), and the relevant data are shown in Table 1. The nine TPPP derivatives exhibited almost similar absorption peaks. The higher peaks at ∼322 nm are attributed to π–π* transition of the conjugated molecules, and the weaker peaks at ∼274 nm ascribed to π–π* transition of the benzene rings. The additional weaker shoulder peaks at ∼370 nm represent intramolecular charge transfer (ICT) absorption between the ester groups and pyrrolo[3,2-b]pyrrole core. These nine TPPP derivatives are acceptor–donor–acceptor (A–D–A)-type compounds with a pyrrolo[3,2-b]pyrrole core as the donor,39 and ester groups on both sides as the acceptors. So they showed typical ICT absorption peaks.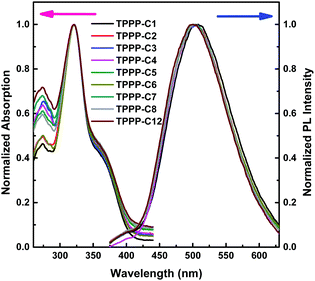 | ||
| Fig. 1 Normalized UV-vis absorption (left) and fluorescence (right) spectra of TPPP derivatives in THF solution. Concentration: 1 × 10⁻⁵ M, excitation wavelength: 322 nm. | ||
| Comps | Abs/THF (nm) | Em/THF (nm) | Stoke's shift (nm) | Em/solid (nm) | Φ F/THF (%) | Φ F/solid (%) | τ/THF (ns) | τ/solid (ns) | HOMO (eV) | LUMO (eV) | E g (eV) |
|---|---|---|---|---|---|---|---|---|---|---|---|
| TPPP-C1 | 274, 321, 372 | 505 | 133 | 476 | 1.11 | 29.37 | 2.95 | 15.4 | −5.18 | −1.80 | 3.38 |
| TPPP-C2 | 273, 321, 368 | 510 | 142 | 465 | 1.27 | 24.28 | 3.09 | 8.86 | −5.16 | −1.76 | 3.40 |
| TPPP-C3 | 276, 321, 373 | 510 | 137 | 450 | 1.30 | 20.26 | 3.21 | 7.67 | −5.15 | −1.74 | 3.41 |
| TPPP-C4 | 274, 321, 374 | 512 | 138 | 461 | 1.24 | 14.81 | 3.24 | 15.39 | −5.15 | −1.74 | 3.41 |
| TPPP-C5 | 274, 321, 367 | 512 | 145 | 462 | 1.38 | 13.87 | 3.28 | 14.09 | −5.15 | −1.74 | 3.41 |
| TPPP-C6 | 275, 321, 371 | 507 | 136 | 466 | 1.27 | 16.56 | 3.27 | 9.29 | −5.15 | −1.75 | 3.40 |
| TPPP-C7 | 274, 321, 368 | 508 | 140 | 468 | 1.35 | 14.44 | 3.28 | 4.23 | −5.15 | −1.75 | 3.40 |
| TPPP-C8 | 274, 321, 372 | 508 | 136 | 468 | 1.41 | 10.10 | 3.27 | 10.15 | −5.15 | −1.75 | 3.40 |
| TPPP-C12 | 274, 321, 372 | 506 | 134 | 468 | 1.48 | 14.25 | 3.30 | 8.37 | −5.15 | −1.75 | 3.40 |
The emission spectra of the TPPP derivatives in THF also showed similar emission peaks at ∼510 nm, which indicate the length of alkyl chain has no significant impact on either absorption or emission spectra. Additionally, all these compounds had large Stokes shift over 130 nm (Table 1), which means these TPPP derivatives had little self-quenching effect between the emission and excitation.40 Therefore, these compounds have potential application in biochemistry, such as fluorescent bio-probes and in cell imaging.41 Their UV-vis absorption and PL emission spectra in the solid states are presented in Fig. S1 (ESI†).
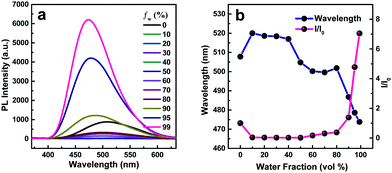
The AIE characteristics were investigated in THF/H2O mixtures since water is a poor solvent for the TPPP derivatives. TPPP-C6 is taken as an example to discuss, and its fluorescence spectra in THF/H2O mixtures with different water fractions are shown in Fig. 2a. In pure THF solution, a weak emission peak at 508 nm was observed. After the addition of water into the THF solution, the emission intensities decreased and were further red-shifted with the water fraction (fw) increasing from 10% to 40% (Fig. 2b). This decreased emission intensity and a red-shifted emission wavelength with an increase in the polarity of the solvent, which is known as intramolecular charge transfer (ICT), are typical photophysical phenomena for D–A type fluorophores.42–44 When fw increased from 50% to 99%, a blue-shift in emission was observed and the emission intensity was gradually intensified. Finally, a 7.0-fold enhancement was obtained with fw = 99%. As shown in Fig. 3 and Fig. S3 (ESI†), other TPPP compounds had the same emission characteristics in THF/H2O mixtures. Furthermore, the fluorescence quantum yield (FQY) of TPPP-C6 in THF and solid powder was 1.27% and 16.56%, respectively. These results indicated that TPPP-C6 as well as the other TPPP derivatives possessed AIE characteristics.
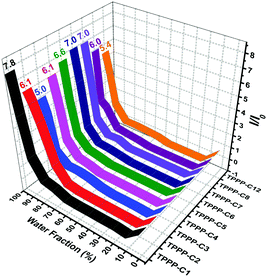 | ||
| Fig. 3 Plot of the ratio of the maximum fluorescence intensity (I/I0) of the nine TPPP derivatives vs. the water fraction. | ||
In order to investigate the relationship between AIE behaviors and the length of peripheral alkyl chains, the enhancement of PL intensity in the THF/water mixtures (Fig. 3) and the FQY (Table 1) of TPPP derivatives are discussed. Increasing the length of peripheral alkyl chains, the FQY exhibited a rising tendency in THF solutions and a declining trend in the solid states. The I/I0 values of the nine compounds also showed a decreasing tendency with a 99% water fraction. These results imply that the nine TPPP derivatives with shorter alkyl chains possess better AIE performance. Thus, increasing the length of alkyl chains is unfavorable to enhance the emission efficiency in aggregation states.
3.2 DSC and POM measurements
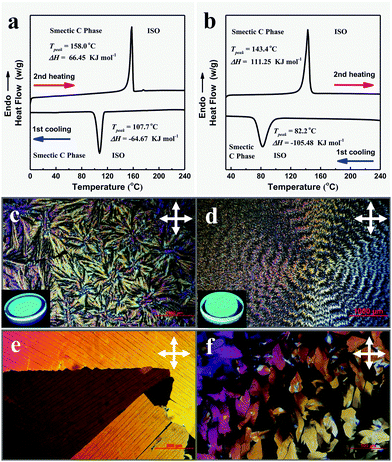
Thermal treatment is the main method to realize the mesophase of thermotropic liquid crystals. The mesophase features of the nine compounds were checked by TGA, DSC, POM, and GIWAXS. Results showed that TPPP-C1,2,3,4,5 with shorter alkyl chains were not LC compounds, while TPPP-C6,7,8,12 with longer alkyl chains exhibited LC phase features. Therefore, TPPP-C6,7,8,12 were AIE-active liquid crystals.The DSC measurements were performed during the first cooling and second heating processes with a rate of 5 °C min−1. For TPPP-C6 (Fig. 4a), there was only one exothermic peak at 107.7 °C upon cooling from the isotropic liquid phase, and a single transition peak at 158 °C from the second heating process. TPPP-C12 (Fig. 4b) and TPPP-C7,8 (Fig. S8, ESI†) showed similar DSC thermograms, where only one transition peak was found both from the first cooling and second heating process.
The LC phase textures of TPPP-C6,12 (Fig. 4c and d) and TPPP-C7,8 (Fig. S7, ESI†) investigated by POM were observed only upon the cooling process occurring at a very slow rate of 0.5 °C min−1 from the isotropic liquid phase, indicating that they were monotropic LCs. The POM images of TPPP-C6,7,8 revealed focal-conic fan-shaped textures, while TPPP-C12 showed banded textures. These belong to smectic textures, which was further confirmed by GIWAXS. We also noted that the crystalline phase of TPPP-C6,12 (Fig. 4e and f) were observable when the cooling rate was over 5 °C min−1. Therefore, a slow cooling rate led to the formation of LC phase, while rapid cooling generated the crystalline phase.
This phenomenon also occurred for the normal LC compounds. Hegmann et al. reported a bent-core liquid crystal,45 and that different LC phases were obtained by cooling slowly from the isotropic liquid state (at rates of 0.5, 2, or 5 °C min−1). In addition, Alaasar et al. described a type of azobenzene liquid crystal.46 Upon cooling from the isotropic liquid phase with a low rate of ≤2 °C min−1, the LC phase was formed. However, a crystalline phase occurred upon cooling with a faster rate of ≥5 °C min−1.
Once the LC phases (TPPP-C6,7,8,12) were formed, they were stable and no other phase transformation were observed during the further cooling to room temperature. The kinds of LC phases could be immobilized and made stable to be retained at room temperature for several months. Because of there being no additional phase transformations during the further cooling process, the DSC curves showed only one transition peak.
3.3 GIWAXS measurements
To characterize the structures of the LC phase, we performed 2D GIWAXS measurements using a synchrotron X-ray radiation source and built models of the molecular organization in the LC phase (Fig. 5). In the low-q region, TPPP-C6 exhibited distinct peaks in the direction of qy = 0.30, 0.60, 0.91 Å−1 (Fig. 5b) and qz = 0.31, 0.62, 0.91 Å−1 (Fig. 5c), which arose from the (100), (200), (300) Bragg diffraction peaks. The scattering peaks in low-q region indicated well-organized lamellar structures in the LC states. In the high-q region, several diffractions were partially overlapped, especially in the qy direction, which can be identified with the ordered arrangement of the peripheral alkyl chains (Fig. 5b and c). In addition, a diffraction peak appeared at 1.73 Å−1, both in the qy and qz direction, and can be ascribed to the (010) peak, which is associated with the intermolecular π–π stacking distance (d010 = 3.63 Å, d = 2π/q). It is noteworthy that the diffraction peaks in the qz direction were much stronger than in the qy direction, which suggests that the molecules stacking was primarily perpendicular to the substrate and the π-faces were approximately parallel to the substrate.47–50In order to build a model for the molecular organization in the LC phase of TPPP-C6, the molecular size was measured using the Gaussian 09 software. As shown in Fig. 5g, the molecular length of TPPP-C6 was evaluated to be 30.56 Å. Moreover, the d-spacing of the primary diffraction peaks (d100) were 20.93 Å in the qy direction and 20.26 Å in the qz direction, which are close to the lamellar unit (20.19 Å) we calculated in Fig. 5g. So we can conclude that when TPPP-C6 self-assembled into a layer structure in the LC state, the peripheral alkyl chains were intertwined with each other and the molecules of TPPP-C6 adopted an overlapped head-to-tail configuration. According to the distance of lamellar stacking (d100) and π–π stacking (d010), a model of TPPP-C6 in the stabilized LC phase was built and is shown in Fig. 5i. The LC phase structures of TPPP-C12 were also characterized by GIWAXS. As shown in Fig. 5e and f, TPPP-C12 exhibited distinct peaks in the direction of qy = 0.23, 0.47, 0.70 Å−1 and qz = 0.24, 0.48, 0.72 Å−1 in the low-q region, which could be indexed as the (100), (200), (300) diffraction peaks. In the high-q region, the partially overlapped peaks could be identified with the peripheral alkyl chains. The diffraction peaks at 1.76 Å−1 in the qy direction and 1.75 Å−1 in the qz direction could be ascribed to the (010) peaks, which are associated with the π–π stacking distance (qy: d010 = 3.57 Å; qz: d010 = 3.59 Å). Similar to the TPPP-C6, TPPP-C12 also exhibited a well-organized lamellar structure in the LC states (Fig. 5j). With the increasing alkyl chain length, the distances (d100) between two layers increased. Additionally, the value of d100 is smaller than the single molecular length (Lmol) and obviously larger than Lmol/2, indicating a tilted layer structure in the LC phases. The ratio of d100/Lmol was ∼0.68 for TPPP-C6 and 0.60 for TPPP-C12. According to d/Lmol = cos![[thin space (1/6-em)]](https://www.rsc.org/images/entities/char_2009.gif) β, the tilt angle was around 47° and 53° for the two compounds. So the LC states of TPPP-C6 and TPPP-C12 are assigned as smectic C phase.
β, the tilt angle was around 47° and 53° for the two compounds. So the LC states of TPPP-C6 and TPPP-C12 are assigned as smectic C phase.
3.4 Temperature-dependent fluorescence measurements
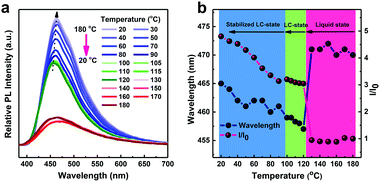
To investigate the photophysical properties in the LC state, we performed temperature-dependent fluorescence spectroscopy of TPPP-C6 during the temperature decreasing from 180 °C to 20 °C (Fig. 6a). Fig. 6b shows the changes in the maximum wavelengths and relative PL intensities during the cooling process. The first region is associated with liquid states in the higher temperature range (180–120 °C), where both the maximum wavelengths and the PL intensities had no obvious change with the temperature decrease. The weak emission intensity in the first region was caused by a non-radiative decay process and the relaxation of excited energy was primarily via the thermal motion of the molecules. The second region is the LC-state (120–100 °C), where an evident blue-shift of PL maximum wavelength with the increasing PL intensity was observed with the formation of highly ordered structures in the LC state leading to AIE properties. In the third region, the LC state was formed. The maximum wavelength exhibited a tendency to red-shift, but the changes were minor. The PL intensity continuously increased with the temperature decreasing to 20 °C, originating from the further restriction of molecular motions and the enhancement of the molecular radiative channels at low temperature.3.5 Crystal structure analysis
The accurate structure of a single crystal helps us to understand the relationship of the molecular stacking style with the relevant photophysical properties. The single crystal of TPPP-C6 was obtained and characterized by X-ray single crystal diffractometry. Its crystal structure was a triclinic crystal system and the relevant crystal data are summarized in Table S1 (ESI†). The dihedral angles between the central pyrrolo[3,2-b]pyrrole core and its substitutes of benzene were 52.25° and 41.91°, respectively (Fig. 7a). In addition, the longer distances (4.62–6.33 Å) between the benzene rings and pyrrolo[3,2-b]pyrrole cores manifested the lack of intermolecular π–π stacking interactions (Fig. 7b). On the other hand, several kinds of inter- and intramolecular C–H⋯π as well as C–H⋯O interactions existed between the adjacent TPPP-C6 molecules, as shown in Fig. 7c. Such kinds of non-covalent interactions work together to help the formation of stabilized crystal packing, and restrict the rotational motions of the phenyl rings. Therefore, the non-radiative channel is restrained, while the radiative pathway is opened, leading to TPPP-C6 being an AIE molecule. The peripheral alkyl chains overlapped with each other (Fig. 7d), which is similar to the models we suggested in the LC phase. | ||
| Fig. 7 The crystal structure (a), intermolecular interactions (b and c), and packing patterns (d) of TPPP-C6. Green and red lines represent the inter- and intramolecular C–H⋯π interactions, respectively, and yellow lines represent the C–H⋯O interactions in Fig. 8(c). | ||
3.6 Theory calculations
To further investigate the relationship between the molecular structure and photophysical properties of the TPPP derivatives, density functional theory (DFT) calculations were performed using the Gaussian 09 program. The highest occupied molecular orbitals (HOMOs) and the lowest unoccupied molecular orbitals (LUMOs) of TPPP-C6 and TPPP-C12 were calculated at the B3LYP/6-31G(d) level after structural optimization (Fig. 8). The two compounds had similar HOMOs and LUMOs, indicating that the alkyl chains had no effects on the distributions of electrons. That is why TPPP-C6 and TPPP-C12 exhibited similar UV and PL spectra. The electron cloud distributions in their HOMOs of the two compounds were localized on the pyrrolo[3,2-b]pyrrole core and the phenyl groups in the 2,5-positions, while the electron cloud distributions in their LUMOs were primarily distributed on benzene rings in the 1,4-positions. We noted that the electron cloud distributions in HOMOs and LUMOs were spatially separated, implying that there was a charge-transfer process when illuminated by UV. The ICT transition absorption peak at around 370 nm (Fig. 1) is consistent with the theoretical calculations. | ||
| Fig. 8 Calculated electron distributions of HOMOs–LUMOs and the energy levels of TPPP-C6 (left) and TPPP-C12 (right). | ||
4. Conclusions
We synthesized nine TPPP derivatives with different lengths of alkyl chains, and the nine derivatives were all AIE-active. The emission efficiency in the aggregation states exhibited a decreased tendency with increasing the alkyl chain length. TPPP-C6,7,8,12 with longer alkyl chains possessed LC characteristics. The four AIE-active LCs were monotropic liquid crystals, which were formed during the cooling process and assembled into a type of very stabilized LC phase. They could be kept for several months at room temperature and emitted blue-green fluorescence. To the best of our knowledge, this kind of stabilized LC phase with AIE features has not been reported before, and could have significant applications, such as in polarized light emission. Our experimental results showed that the twisted TPPP structure and the planar structure of the pyrrolo[3,2-b]pyrrole core work together to construct AIE-active LCs.Conflicts of interest
There are no conflicts to declare.Acknowledgements
We are grateful for the support from the National Natural Scientific Foundation of China (Grants 21490574, 51673024, and 21474009) and the National Basic Research Program of China (973 Program; Grant 2013CB834704). W. C. gratefully acknowledges the financial support from the U.S. Department of Energy, Office of Science, Materials Sciences and Engineering Division. We also thank Dr Joseph Strzalka and Dr Zhang Jiang for the assistance with GIWAXS measurements. Use of the Advanced Photon Source (APS) at the Argonne National Laboratory was supported by the U.S. Department of Energy, Office of Science, Office of Basic Energy Sciences, under contract no. DE-AC02-06CH11357.Notes and references
- T. Kato, J. Uchida, T. Ichikawa and T. Sakamoto, Angew. Chem., Int. Ed., 2018, 57, 4355–4371 CrossRef CAS PubMed.
- T. Wöhrle, I. Wurzbach, J. Kirres, A. Kostidou, N. Kapernaum, J. Litterscheidt, J. C. Haenle, P. Staffeld, A. Baro, F. Giesselmann and S. Laschat, Chem. Rev., 2016, 116, 1139–1241 CrossRef PubMed.
- H. K. Bisoyi and Q. Li, Acc. Chem. Res., 2014, 47, 3184–3195 CrossRef CAS PubMed.
- L. Wang, H. Dong, Y. Li, R. Liu, Y. F. Wang, H. K. Bisoyi, L. D. Sun, C. H. Yan and Q. Li, Adv. Mater., 2015, 27, 2065–2069 CrossRef CAS PubMed.
- D. Zhao, F. Fan, J. Cheng, Y. Zhang, K. S. Wong, V. G. Chigrinov, H. S. Kwok, L. Guo and B. Z. Tang, Adv. Opt. Mater., 2015, 3, 199–202 CrossRef CAS.
- D. Zhao, H. He, X. Gu, L. Guo, K. S. Wong, J. W. Y. Lam and B. Z. Tang, Adv. Opt. Mater., 2016, 4, 534–539 CrossRef CAS.
- B. A. S. Jose, J. Yan and K. Akagi, Angew. Chem., Int. Ed., 2015, 126, 10817–10820 CrossRef.
- L. Wang, H. Dong, Y. Li, C. Xue, L. D. Sun, C. H. Yan and Q. Li, J. Am. Chem. Soc., 2014, 136, 4480–4483 CrossRef CAS PubMed.
- D. Zhao, F. Fan, V. G. Chigrinov, H. S. Kwok and B. Z. Tang, J. Soc. Inf. Disp., 2015, 23, 218–222 CrossRef CAS.
- Y. Wang, Y. Liao, C. P. Cabry, D. Zhou, G. Xie, Z. Qu, D. W. Bruce and W. Zhu, J. Mater. Chem. C, 2017, 5, 3999–4008 RSC.
- H. T. Bui, J. Kim, H. J. Kim, B. K. Cho and S. Cho, J. Phys. Chem. C, 2016, 120, 26695–26702 CrossRef CAS.
- A. S. Matharu, S. Jeeva and P. S. Ramanujam, Chem. Soc. Rev., 2007, 36, 1868–1880 RSC.
- J. Sha, H. Lu, M. Zhou, G. Xia, Y. Fang, G. Zhang, L. Qiu, J. Yang and Y. Ding, Org. Electron., 2017, 50, 177–183 CrossRef CAS.
- S. J. Yoon, J. H. Kim, K. S. Kim, J. W. Chung, B. Heinrich, F. Mathevet, P. Kim, B. Donnio, A. J. Attiaset, D. Kim and S. Y. Park, Adv. Funct. Mater., 2012, 22, 61–69 CrossRef CAS.
- J. A. H. P. Sol, V. Dehm, R. Hecht, F. Würthner, A. P. H. J. Schenning and M. G. Debije, Angew. Chem., Int. Ed., 2018, 57, 1030–1033 CrossRef CAS PubMed.
- Y. Sagara, C. Weder and N. Tamaoki, Chem. Mater., 2017, 29, 6145–6152 CrossRef CAS.
- H. K. Bisoyi and Q. Li, Chem. Rev., 2016, 116, 15089–15166 CrossRef CAS PubMed.
- J. Mei, N. L. C. Leung, R. T. K. Kwok, J. W. Y. Lam and B. Z. Tang, Chem. Rev., 2015, 115, 11718–11940 CrossRef CAS PubMed.
- J. Luo, Z. Xie, J. W. Y. Lam, L. Cheng, H. Chen, C. Qiu, H. S. Kwok, X. Zhan, Y. Liu, D. Zhu and B. Z. Tang, Chem. Commun., 2001, 1740–1741 RSC.
- Y. Hong, J. W. Y. Lam and B. Z. Tang, Chem. Soc. Rev., 2011, 40, 5361–5388 RSC.
- Q. Li and Z. Li, Adv. Sci., 2017, 4, 1600484 CrossRef PubMed.
- J. Yang, L. Li, Y. Yu, Z. Ren, Q. Peng, S. Ye, Q. Li and Z. Li, Mater. Chem. Front., 2017, 1, 91–99 RSC.
- C. Wang and Z. Li, Mater. Chem. Front., 2017, 1, 2174–2194 RSC.
- X. Zhan, J. Zhang, Y. Gong, S. Tang, J. Tu, Y. Xie, Q. Peng, G. Yu and Z. Li, Mater. Chem. Front., 2017, 1, 2341–2348 RSC.
- J. H. Wan, L. Y. Mao, Y. B. Li, Z. F. Li, H. Y. Qiu, C. Wang and G. Q. Lai, Soft Matter, 2010, 6, 3195–3201 RSC.
- W. Z. Yuan, Z. Q. Yu, P. Lu, C. Deng, J. W. Y. Lam, Z. Wang, E. Q. Chen, Y. Ma and B. Z. Tang, J. Mater. Chem., 2012, 22, 3323–3326 RSC.
- J. Kim, S. Cho and B. K. Cho, Chem. – Eur. J., 2014, 20, 12734–12739 CrossRef CAS PubMed.
- H. Jing, L. Lu, Y. Feng, J. F. Zheng, L. Deng, E. Q. Chen and X. K. Ren, J. Phys. Chem. C, 2016, 120, 27577–27586 CrossRef CAS.
- W. Z. Yuan, Z. Q. Yu, Y. Tang, J. W. Y. Lam, N. Xie, P. Lu, E. Q. Chen and B. Z. Tang, Macromolecules, 2011, 44, 9618–9628 CrossRef CAS.
- Y. Guo, D. Shi, Z. W. Luo, J. R. Xu, M. L. Li, L. H. Yang, Z. Q. Yu, E. Q. Chen and H. L. Xie, Macromolecules, 2017, 50, 9607–9616 CrossRef CAS.
- L. Liu, M. Wang, L. X. Guo, Y. Sun, X. Q. Zhang, B. P. Lin and H. Yang, Macromolecules, 2018, 51, 4516–4524 CrossRef CAS.
- M. Zhu, Y. Zhuo, K. Cai, H. Guo and F. Yang, Dyes Pigm., 2017, 147, 343–349 CrossRef CAS.
- J. W. Park, S. Nagano, S. J. Yoon, T. Dohi, J. Seo, T. Seki and S. Y. Park, Adv. Mater., 2014, 26, 1354–1359 CrossRef CAS PubMed.
- H. Lu, L. Qiu, G. Zhang, A. Ding, W. Xu, G. Zhang, X. Wang, L. Kong, Y. Tian and J. Yang, J. Mater. Chem. C, 2014, 2, 1386–1389 RSC.
- Y. Ren, R. Zhang, C. Yan, T. Wang, H. Cheng and X. Cheng, Tetrahedron, 2017, 73, 5253–5259 CrossRef CAS.
- Y. Ji, Z. Peng, B. Tong, J. Shi, J. Zhi and Y. Dong, Dyes Pigm., 2017, 139, 664–671 CrossRef CAS.
- Z. Peng, Y. Ji, Z. Huang, B. Tong, J. Shi and Y. Dong, Mater. Chem. Front., 2018, 2, 1175–1183 RSC.
- M. Krzeszewski, B. Thorsted, J. Brewer and D. T. Gryko, J. Org. Chem., 2014, 79, 3119–3128 CrossRef CAS PubMed.
- M. Krzeszewski, D. Gryko and D. T. Gryko, Acc. Chem. Res., 2017, 50, 2334–2345 CrossRef CAS PubMed.
- H. Lu, Y. Zheng, X. Zhao, L. Wang, S. Ma, X. Han, B. Xu, W. Tian and H. Gao, Angew. Chem., Int. Ed., 2016, 55, 155–159 CrossRef CAS PubMed.
- H. Qian, M. E. Cousins, E. H. Horak, A. Wakefield, M. D. Liptak and I. Aprahamian, Nat. Chem., 2017, 9, 83–87 CrossRef CAS PubMed.
- W. Qin, K. Li, G. Feng, M. Li, Z. Yang, B. Liu and B. Z. Tang, Adv. Funct. Mater., 2014, 24, 635–643 CrossRef CAS.
- J. Mei, Y. Hong, J. W. Y. Lam, A. Qin, Y. Tang and B. Z. Tang, Adv. Mater., 2014, 26, 5429–5479 CrossRef CAS PubMed.
- X. Y. Shen, Y. J. Wang, H. Zhang, A. Qin, J. Z. Sun and B. Z. Tang, Chem. Commun., 2014, 50, 8747–8750 RSC.
- L. Li, M. Salamończyk, S. Shadpour, C. Zhu, A. Jákli and T. Hegmann, Nat. Commun., 2018, 9, 714–721 CrossRef PubMed.
- M. Alaasar, M. Prehm, M. Brautzsch and C. Tschierske, J. Mater. Chem. C, 2014, 2, 5487–5501 RSC.
- W. Chen, T. Xu, F. He, W. Wang, C. Wang, J. Strzalka, Y. Liu, J. Wen, D. J. Miller, J. Chen, K. Hong, L. Yu and S. B. Darling, Nano Lett., 2011, 11, 3707–3713 CrossRef CAS PubMed.
- M. Shao, J. Keum, J. Chen, Y. He, W. Chen, J. F. Browning, J. Jakowski, B. G. Sumpter, I. N. Ivanov, Y. Ma, C. M. Rouleau, S. C. Smith, D. B. Geohegan, K. Hong and K. Xiao, Nat. Commun., 2014, 5, 3180–3181 CrossRef PubMed.
- Y. Yang, W. Chen, L. Dou, W. Chang, H. Duan, B. Bob, G. Li and Y. Yang, Nat. Photonics, 2015, 9, 190–198 CrossRef CAS.
- L. Lu, T. Xu, W. Chen, E. S. Landry and L. Yu, Nat. Photonics, 2014, 8, 716–722 CrossRef CAS.
Footnote |
| † Electronic supplementary information (ESI) available: Details of synthesis and characterization, UV-vis absorption and PL emission spectra, time-resolved PL decays spectra, TGA, XRD, POM, DSC, and single crystal data. CCDC 1882581 (TPPP-C6). For ESI and crystallographic data in CIF or other electronic format see DOI: 10.1039/c9qm00124g |
| This journal is © the Partner Organisations 2019 |

