 Open Access Article
Distribution and toxicity of dihydroxybenzenes in drinking water sources in Nigeria†
Oluwaferanmi B. Otitojuab,
Moses O. Alfred *ab,
Chidinma G. Olorunnisola
 a,
Francis T. Aderinolac,
Olumuyiwa O. Ogunlaja
 ad,
Olumide D. Olukanniae,
Aemere Ogunlajaaf,
Martins O. Omorogie
 ab and
Emmanuel I. Unuabonah
 *ab
*ab
aAfrican Centre of Excellence for Water and Environmental Research (ACEWATER), Redeemer's University, PMB 230, Ede, Osun State, Nigeria. E-mail: unuabonahe@run.edu.ng; alfredm@run.edu.ng; Tel: +234 805 317 5971 Tel: +234 903 878 7959
bDepartment of Chemical Sciences, Redeemer's University, PMB 230, Ede, Osun State, Nigeria
cDepartment of Civil Engineering, Redeemer's University, PMB 230, Ede, Osun State, Nigeria
dDepartment of Chemical Sciences, Faculty of Natural and Applied Sciences, Lead City University, Ibadan, Nigeria
eDepartment of Biochemistry, Redeemer's University, PMB 230, Ede, Osun State, Nigeria
fDepartment of Biological Sciences, Redeemer's University, PMB 230, Ede, Osun State, Nigeria
First published on 2nd January 2024
Abstract
This study provides, for the first time, data on the distribution and toxicity of catechol (CAT) and hydroquinone (HQ) in drinking water sources from Africa. Groundwater (boreholes and hand-dug wells) and surface water in three Southwestern States in Nigeria served as sampling sites. The concentrations of CAT and HQ in groundwater and surface water were determined throughout a period of 12 months, evaluating the effects of seasonal variation (rainy and dry seasons). Mean concentrations of CAT in water samples were higher than those of HQ. In this study, CAT was more frequently detected, with its mean concentration in groundwater samples higher in the rainy season (430 μg L−1) than in the dry season (175 μg L−1). Multivariate analysis using the Principal Component Analysis Software suggests that in most sample sites, CAT and HQ in water samples were from entirely different anthropogenic sources. The most impacted population groups were the toddlers and infants. Similarly, maximum and median concentrations of CAT in water samples pose serious risks to Daphnia at both acute and chronic levels. The results from this study suggest the need for further control of these dihydroxybenzenes through regular monitoring and removal from drinking water during treatment.
1 Introduction
The resultant effects of urbanization, industrialization and increased population have led to increased concentrations of pollutants in water bodies globally and the spotlight is now on the adverse effects of these pollutants on both aquatic and human lives.1 Catechol (CAT) (1,2-dihydroxybenzene) and hydroquinone (HQ) (1,4-dihydroxybenzene) are dihydroxybenzene compounds that are vastly utilized in pharmaceuticals and personal care products (PPCPs).2 HQ is a phenolic compound widely used in topical skin creams for skin-toning or skin lightening,3 a developing agent in photography, an antioxidant for fats and oils, a polymerization inhibitor, a stabilizer in paints, varnishes, motor fuels and oils, and an intermediate for rubber processing chemicals in the production of mono and dialkyl ethers.4 The hydroxyl functionalities and solubilities of HQ allow for its easy transportation and movement into surface water and systems. On the other hand, (CAT) is employed as an antiseptic agent, antifungal preservative, photographic agent, dye developer, and as an antioxidant. It is released during the natural decomposition of the humic and lignocellulosic substances.5 Due to the several uses of HQ and CAT in many PPCPs and their low bio-degradabilities,6,7 they persist in water bodies and possess the ability to bio-accumulate.One of the major adverse effect attributed to the bioaccumulation of HQ is exogenous ochronosis, which is a medical condition that is easily identified by reticulated, ripple-like, and sooty pigmentation majorly on the forehead, cheeks and other areas of HQ-product application on the human skin (Fig. S1†). In addition, the presence of HQ in the human system is reported to cause toxicity of several organs, notably the kidney and fore-stomach,8 hemolysis,9 degeneration of the renal tubes, depletion of the liver functions,10 cancers, and neurodegenerative diseases.11 In spite of its useful applications, HQ is claimed to be the plausible cause of mutagenicity and nephrocarcinogenity in animals.12 On the other hand, CAT is reported to be an irritant to the eyes, skin, and respiratory tract. It also causes DNA damage, vascular collapse, coma, and even death13 in certain cases. The toxicities of these compounds (CAT and HQ) even at low concentrations (ng L−1 to μg L−1) emanate from their low bio-degradability. Hence, there is the need for the monitoring and quantification of these pollutants in water bodies to help provide a database that can be used to alert the public about any potential health threat from their ingestion and to also help water treatment professionals develop effective strategies for their removal in water.
While there is a permissible limit of 2% for HQ in cosmetics,14 nothing is said about its permissible limit in water despite the level of its toxicity as previously described. The focus is rather on the removal of HQ and CAT from water using techniques such as electrochemical,15–18 activated carbon electrode19–22 as well as the use of adsorption,23 membrane filtration,24 and biodegradation.25 There is therefore, a huge scarcity of information on the distribution and potential health risk assessment of HQ and CAT in environmental matrices like in water bodies globally, and particularly, in Nigeria. Although, it is known that the use of personal care products containing HQ and CAT have the potential to cause various health challenges,26–28 long exposure to these contaminants (hydroquinone and catechol) via ingestion of polluted water also have the ability to create the health challenges previously mentioned.
To provide permissible limits for this pair of pollutants in water (which is currently lacking), it is imperative that a database on their occurrence and quantity in groundwater and surface water as wells as their risks assessment (ecological and health) is developed. It is on this basis and the dearth of information on these pollutants in water, that water samples from drinking water sources: groundwater (borehole, hand-dug well) and river water, in three South-western States in Nigeria (Osun, Oyo and Lagos) were collected and analyzed for the presence of HQ and CAT.
Osun State is mainly an agricultural State with a lot of its populace engaged in farming activities, while the populace in Oyo State are largely made up of government workers with several more urban centers in this State than in Osun State. Lagos State is one of the highly industrialized States in Nigeria and is regarded as a metropolitan city. Both Osun and Oyo States are closest to Lagos State in the Southwest of Nigeria. To the best of our knowledge, this is the first report on the presence of dihydroxybenzenes in water in West Africa. Principal Component Analysis (PCA) was used to explain the association between the sources of HQ and CAT in the water samples. To further understand the implication of the quantity of HQ and CAT found in the water samples, ecological and human risks assessment evaluations were carried from the data generated analysis of water samples.
2 Materials and methods
2.1. Chemicals
Hydroquinone (HQ) and catechol (CAT), methanol, ethyl acetate, dichloromethane and acetonitrile were purchased from Sigma Aldrich (St. Louis, MO, USA). These chemicals were 99.9% pure (High Performance Liquid Chromatography standards). Analytical grade of concentrated hydrochloric acid was also purchased from Sigma Aldrich while ultrapure water was obtained from Milli-Q Direct 8/16 System. The standard stock solutions of each HQ and CAT (200 mg L−1) were prepared singly in ultrapure water and stored at 4 °C. Working solutions (200 μg L−1) of mixed phenolic compounds were freshly prepared by dilution of stock solution with ultrapure water.2.2. Description of study area
Osun, Oyo and Lagos States are located in the tropical rainforest biome in South-Western Nigeria, and they lie between Lat. 06° 30′ N and Long. 04° 30′ E, Lat. 7° 51′ N and Long. 3° 55′ E and Lat. 6° 27′ N and 3° 24′ 23′ E, encompassing areas of approximately 14![[thin space (1/6-em)]](https://www.rsc.org/images/entities/char_2009.gif) 875 sq. km, 28
875 sq. km, 28![[thin space (1/6-em)]](https://www.rsc.org/images/entities/char_2009.gif) 454 sq. km and 3577 sq. km respectively. The details of the sampling sites as well as the sampling codes are presented in the ESI† document (Fig. S1–S3, ESI† document).
454 sq. km and 3577 sq. km respectively. The details of the sampling sites as well as the sampling codes are presented in the ESI† document (Fig. S1–S3, ESI† document).
2.3. Sample collection
Groundwater samples (from hand-dug wells and boreholes) were taken from 34 locations directly into sample bottles from the study areas, for a duration of 12 months, covering both the wet and dry seasons in Nigeria. Furthermore, surface water samples were collected at random from 31 locations which included major rivers in Lagos and Osun (Epe and Osun rivers respectively) as well as a major water dam (Asejire dam) in Oyo State. The sampling periods were between April 2021 to April 2022, and water samples were collected in triplicates. Three sampling campaigns were executed (one for each State) in the wet season (April to September 2021) and in the dry season (December to April 2022).At each sampling site, groundwater samples (n = 3) were collected and made into composite samples. However, for surface water, grab samples (n = 3) were collected from all the sampling sites in Osun, Oyo and Lagos State but were not made into composites. Water samples (500 mL) were collected in amber glass bottles (pre-washed with methanol and ultrapure water) and kept in ice packs to maintain the integrity of the samples. The samples were transported to the laboratory, stored at 4 °C. Analyte extraction was done within 24 h of returning from the field campaign.
2.4. Pretreatment and sample extraction
Water samples (200 mL) spiked with a known concentration of a combination of HQ and CAT, were adjusted to pH 3.0 using 0.1 M HCl, and filtered using membrane filters (0.4 μm) under vacuum. A blank sample of ultrapure water was adjusted to pH 3.0 using 0.1 M HCl. Extraction of the HQ and CAT was carried out using solid phase extraction cartridges (Supel-select HLB SPE tube, 500 mg, 6 mL, Waters, MA, USA). These cartridges were initially pre-conditioned with 5 mL methanol and 5 mL of Millipore water, and subsequently adjusted to pH 3.0. Samples were loaded on the cartridges at a flow rate of 5 mL min−1. Then, HQ and CAT were eluted from the cartridges using 3 mL of acetonitrile, dichloromethane and ethyl acetate (volume ratio of 1![[thin space (1/6-em)]](https://www.rsc.org/images/entities/char_2009.gif) :
:![[thin space (1/6-em)]](https://www.rsc.org/images/entities/char_2009.gif) 1
1![[thin space (1/6-em)]](https://www.rsc.org/images/entities/char_2009.gif) :
:![[thin space (1/6-em)]](https://www.rsc.org/images/entities/char_2009.gif) 1) and the eluents were dried in a vacuum oven at 50 °C. The eluents were reconstituted with 0.5 mL acetonitrile.
1) and the eluents were dried in a vacuum oven at 50 °C. The eluents were reconstituted with 0.5 mL acetonitrile.
2.5. Instrumental analysis
The quantification of HQ and CAT was done using High Performance Liquid Chromatography (HPLC)-UV system, Agilent Series 1100 LC system. Analytes were separated using on LC C18 column (5 μm particle size, 250 × 4.6 mm i.d.) and all injections were done automatically by an autosampler. Methanol was used as the mobile phase at a flow rate of 0.5 mL min−1 [isocratic elution of water/methanol (30/70, v/v)]. The injection volume was 20 μL with a total run program of 6 min, and the detector wavelengths for the analytes were 220 nm.2.6. Quality assurance and quality control (QA/QC)
To scrutinize for possible contamination and interferences from the solvents and materials used during extraction, procedural blanks were analysed with every extraction batch and the concentration obtained from the procedural blank samples were deducted from the known concentration of the environmental samples. Methanol blank and midpoint calibration were injected after each batch analysis to check for differences in instrumental response and also for carry-over of the analytes of interests from prior injections. Quantification of analytes was carried out using standards, and a standard calibration curve was obtained by analysing aqueous solutions containing the analytes of interest ranging from concentration of 10 to 1000 μg L−1.The relative standard deviations (RSD) were <5% for all the water samples collected (Table 1). The instrumental quantification limit was determined as three times the signal to noise ratio using the standard deviation of the seven-point calibration intercepts divided by the slope, and the limit of quantification (LOQ) was calculated as ten times the ratio. The LOD ranged from 2.9 and 24 μg L−1 and coefficients of determination (r2) of calibration curves were >0.999. The coefficients of determination, LOD and LOQ are presented in Table 1.
| Analyte | Linear range (μg L−1) | r2 | LOD (μg L−1) | LOQ (μg L−1) | Spiked conc. (μg L−1) | Recovery (%) ± SD | RSD (%) n = 3 |
|---|---|---|---|---|---|---|---|
| 100 | 95.2 ± 1.34 | 1.78 | |||||
| Hydroquinone | 10–1000 | 0.9999 | 2.9 | 10 | 200 | 92.5 ± 2.28 | 2.68 |
| 500 | 92.1 ± 0.62 | 1.26 | |||||
| 100 | 104.1 ± 2.41 | 2.70 | |||||
| Catechol | 10–1000 | 0.9999 | 26 | 88 | 200 | 101.3 ± 3.54 | 4.21 |
| 500 | 94.6 ± 2.62 | 3.02 |
2.7. Risk assessment
The basis for the ecological risk assessment of phenolic compounds in this study is obtained from the US EPA ecological risk assessment framework.29 The risk quotient (RQ) method was used to determine the toxicity levels of HQ and CAT. The RQ was determined as follows:
 | (1) |
The PNEC was calculated for both acute and chronic tests using the EC50/LC50 and NOEC respectively, divided by an assessment factor (AF).30
| PNECacute = (LC50 of three acute toxicity tests)/AFacute | (2) |
| PNECchronic = NOEC in chronic tests/AFchronic | (3) |
The acute toxicity data (LC50 or EC50) and chronic toxicity data (NOEC, LOEC, EC10) used in the current study for ecological risk assessment of HQ and CAT in three South-western States in Nigeria were obtained from existing literature for three aquatic organisms (algae, invertebrates and vertebrates). The ecological risk levels were grouped into three levels according to the RQ values. RQ > 1 indicates a high ecological risk, RQ values between 0.1 < RQ < 1 mean a median risk, and RQ < 0.1 suggests a minimal environmental risk.31
2.8. Statistical analysis
Statistical analyses were carried out using the Statistical Package for The Social Sciences (SPSS Statistics23; IBM Corporation, Cornell, NY, USA) and Origin (Origin lab 9.1). The variation in the concentrations between the urban and rural sampling sites in Osun, Oyo and Lagos States was determined by Kruskal–Wallis test. Furthermore, nonparametric Spearman correlation informed us about the relationship between the concentrations of the phenolic compounds. Statistical significance was set at p < 0.05. Multivariate statistical analysis was carried out using the Principal Component Analysis (PCA) software, which further interrogated the significant association between the phenolic compounds in the environment. The PCA is a common tool in the determination of multivariate statistical method of analysis in environmental studies.32,33 It has been established as an instrument for the identification of contamination sources and also used substantially to confirm the association between diverse environmental variables and/or total variability of a data set.32,34,353 Results and discussions
3.1. Occurrence of hydroquinone and catechol in surface and ground water
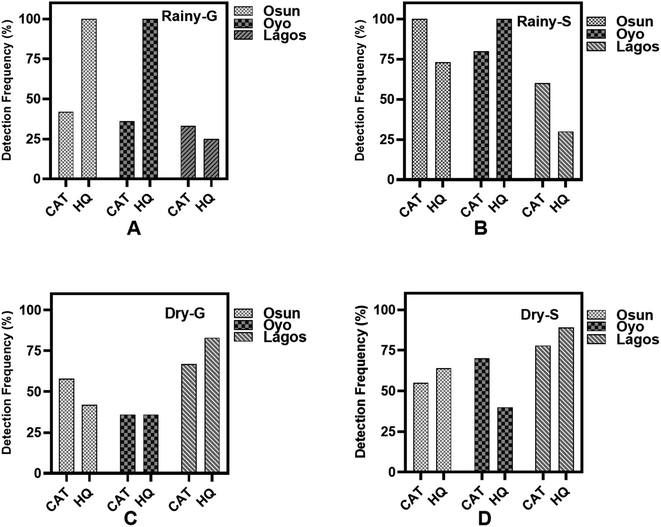
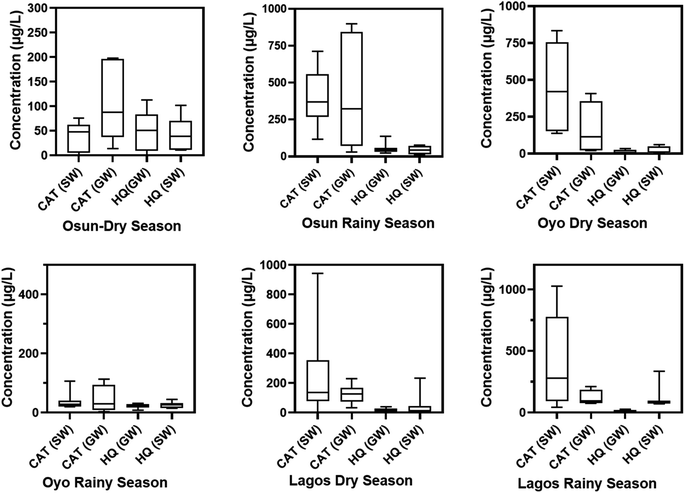
From Fig. 1A–D, the general trend of occurrence for HQ and CAT show that the frequency of detection for these pollutants are higher in the rainy season than in the dry season for both groundwater and surface water samples. However, HQ is the most detected in Osun and Oyo ground water samples with as much as a 100% detection frequency during the rainy season, with Lagos State being the least. However, during the dry season, Lagos State has the highest detection frequency of HQ and CAT in both groundwater and surface water samples.The box plots for the median, maximum, and minimum concentrations of HQ and CAT in water samples collected are summarized in Table S1† and Fig. 2. It is inferred from Fig. 2 that the median, maximum and minimum concentrations for HQ in both groundwater and surface water samples in Osun State are in close range for rainy and dry seasons.
Although, the detection frequency of HQ is significantly higher than CAT in both seasons in groundwater and surface water from Osun State (Fig. 1), yet, its concentrations in water samples from this same State are not as high as those for CAT. Besides, the concentrations of CAT both in the groundwater and surface water samples are higher during the rainy season than in the dry season in Osun State. A similar trend is observed for water samples from Oyo State. However, in contrast to what is obtained in Osun State, the concentrations of CAT from water samples in Oyo State are significantly higher during the dry season compared to the rainy season. In anycase, surface water samples have the highest median and maximum concentrations in the State.
For water samples from Lagos State, the median, maximum and minimum concentrations of HQ and CAT are significantly higher in surface water samples than in groundwater samples both in rainy and dry seasons. However, CAT has the highest concentrations both in the dry season and the rainy season than HQ (Fig. 2).
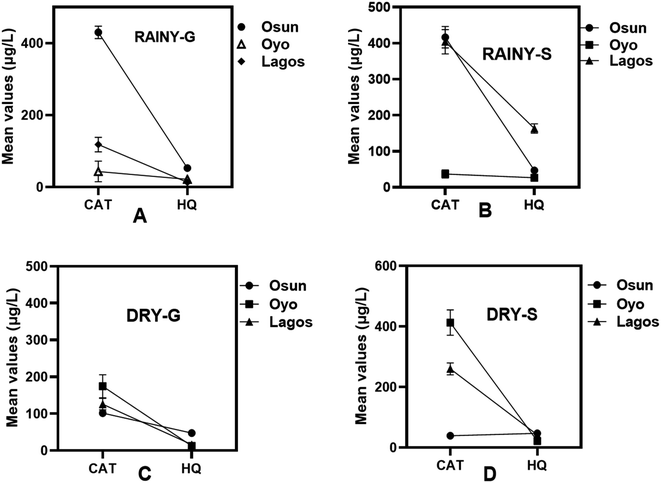
The mean concentration values of HQ and CAT in water samples from the three States are provided in Table S1.† During the rainy season, the mean concentrations for HQ in Osun State are 53 μg L−1 and 47 μg L−1 for groundwater and surface water samples respectively, while the mean concentration is 47 μg L−1 for both groundwater and surface water samples during the dry season (Fig. 3A–D). Furthermore, the mean concentration for CAT is 430 μg L−1 in both groundwater and surface water during the rainy season while during the dry season, the mean concentrations are 102 μg L−1 for groundwater samples and 39 μg L−1 for surface water samples (Fig. 3B and D).
In Oyo State, the mean concentrations for HQ are 22 μg L−1 and 26 μg L−1 for groundwater and surface water samples respectively during the rainy season and an average of 5 μg L−1 and 9 μg L−1 for groundwater and surface water samples respectively during the dry season (Fig. 3A–D). The concentration of CAT during the rainy season is 43 μg L−1 in both groundwater and surface water samples. There is an increase in the concentration of CAT during the dry season as the mean concentrations are 175 μg L−1 in the groundwater samples and 412 μg L−1 in the surface water samples. This is a reverse trend to what was observed in Osun State (Fig. 3A–D).
In Lagos State, the mean concentration values obtained during the rainy season for HQ are 13 μg L−1 and 43 μg L−1 for groundwater and surface water samples respectively, and an average concentrations of 12 μg L−1 and 13 μg L−1 for groundwater and surface water samples respectively during the dry season (Fig. 3A–D). The mean concentration values for CAT during the rainy season are 126 μg L−1 and 123 μg L−1 for groundwater and surface water samples respectively. During the dry season however, the mean concentration values are 126 μg L−1 and 260 μg L−1 for groundwater and surface water samples respectively (Fig. 3A–D).
From these mean concentrations, it can be seen that CAT is the most prevalent in water samples and has the highest mean concentrations in all three States, with water samples from Lagos State having the least mean concentrations of this pollutant. However, during the dry season, water samples from Oyo State had the highest mean concentrations for CAT in both groundwater and surface water samples (Fig. 3C and D). In anycase, all of these could be as a result of the abuse of pharmaceuticals and the improper disposal of these drugs by the people in these States as CAT is a potent ingredient in the manufacture of pharmaceuticals.36,37 Pharmaceuticals can get into the waterbodies as run offs.38 Also, CAT is vastly used in the agro-chemical industry as an intermediate for the synthesis of molecules for the production of pesticides,39 and this could explain its high concentrations in Osun water samples especially during the rainy season since Osun State is an agricultural State and the use of pesticides increases during this season by farmers throughout the State.40 It is, thus, expected that residues such as CAT from the usage of pesticides would wash off into water bodies.
3.2. Multivariate statistics: principal component analysis
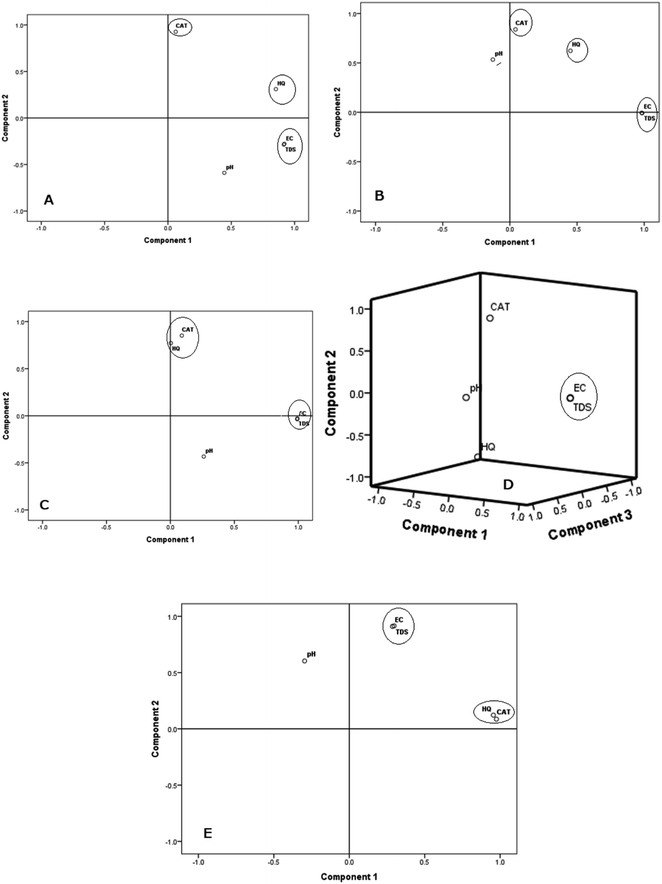
Data obtained from principal component analysis (PCA) for the studied parameters in surface and groundwater samples from Osun, Oyo, and Lagos States are summarized in Table 2 while the 2D plots are shown in Fig. 4. The suitability of the data for PCA is validated by the results of the Kaiser–Meyer–Olkin (≥0.5) and Barlett sphericity (p < 0.001) tests respectively. For both groundwater and surface water samples from Osun State, two principal components (PCs) dominates the PCA analysis, accounting for 81.5% and 70.6% of the total variance respectively. Consequently, the PC 1 for the groundwater samples explains 55.4% of the total variance and is dominated by EC & TDS, with a very high loading of 0.92 each and a third significant high loading of 0.85 for HQ. This strong association between these parameters (EC, TDS and HQ) suggests a common source of contamination. Nonetheless, the PC 2 is singly dominated by CAT with a high loading of 0.93 accounting for 26.0% of the total variance. This suggests that it (CAT) has a different anthropogenic source from that of HQ. Possible anthropogenic sources of CAT include effluent from photographic wastes, plastic production industry, and pharmaceutical industry.| OSUN GW | OSUN SW | OYO GW | OYO SW | LAGOS SW | |||||||
|---|---|---|---|---|---|---|---|---|---|---|---|
| 1 | 2 | 1 | 2 | 1 | 2 | 1 | 2 | 3 | 1 | 2 | |
| a Extraction method: principal component analysis. Rotation method: varimax with Kaise (bold figures indicate values ≥0.5). | |||||||||||
| CAT | 0.06 | 0.93 | 0.04 | 0.84 | 0.09 | 0.85 | −0.02 | 0.88 | 0.25 | 0.98 | 0.09 |
| HQ | 0.85 | 0.31 | 0.45 | 0.62 | 0.003 | 0.77 | −0.03 | −0.75 | 0.48 | 0.96 | 0.12 |
| pH | 0.45 | −0.59 | −0.13 | 0.53 | 0.26 | −0.43 | 0.11 | 0.04 | 0.93 | −0.3 | 0.6 |
| EC | 0.92 | −0.28 | 0.98 | −0.01 | 0.99 | −0.04 | 0.99 | −0.001 | 0.07 | 0.29 | 0.91 |
| TDS | 0.92 | −0.29 | 0.98 | −0.01 | 0.99 | −0.03 | 0.99 | 0.01 | 0.07 | 0.3 | 0.92 |
| Eigen values | 2.77 | 1.30 | 2.22 | 1.31 | 2.06 | 1.49 | 2.06 | 1.37 | 1.07 | 2.64 | 1.53 |
| Total variance% | 55.44 | 26.04 | 44.38 | 26.21 | 41.22 | 29.86 | 41.19 | 27.31 | 21.38 | 52.85 | 30.65 |
| Cumulative% | 55.44 | 81.45 | 44.38 | 70.60 | 41.22 | 71.09 | 41.19 | 35.15 | 89.88 | 52.85 | 83.50 |
The PCA results for surface water data from Osun State were also dominated by two principal components (PC 1 and PC 2) accounting for 44.4 and 26.2% respectively. Similar to the groundwater, PC 1 was dominated by EC and TDS with very high loadings of 0.98 each for EC and TDS, indicating similarity in source and factors responsible for EC and TDS. However, PC 2 showed a significant association between CAT, HQ and pH with a high loading of 0.84, 0.62, and 0.53 respectively (Fig. 4B). These loadings of 0.62 and 0.53 for HQ and pH denote a quasi-independent behaviour, which may suggest the influence of different anthropogenic sources within the same component. Basically, HQ and CAT are two coexisting phenolic isomers significantly used as primary raw materials and synthetic intermediates in the pharmaceutical, cosmetics and dyes industries.6,41 This also suggests that pH is a significant factor responsible for the observed levels of CAT and HQ in water samples from Osun State.
Likewise, Oyo State groundwater samples data were dominated by two principal components (PC 1 and PC 2), accounting for a total of 71.1% of the total variance. The PC 1 followed the same trend like that for Osun State, with a high loading of 0.99 for both EC and TDS accounting for 41.2% of the total variance (Table 2, Fig. 4A and B). This suggests a very strong association between EC and TDS. This association further validates the source of EC and TDS to be similar. The PC 2 was also dominated by CAT and HQ accounting for 29.9% of the total variance with significant loadings of 0.85 and 0.77 respectively.
Oyo State surface water was dominated by three PCs (PC 1, PC 2 and PC 3) responsible for 89.9% of the overall variance. Similar to what was obtained in Osun State, EC and TDS dominated PC 1 accounting for 41.2% of the total variance with high loadings of 0.99 each for EC and TDS (Fig. 4C). However, a significantly high negative loading of −0.75 was observed for HQ (PC 2), strongly depicting that CAT and HQ have different origins in Oyo State surface water samples (Fig. 4D). The PC 3 was singly dominated by pH, accounting for 21.4% of the total variance (Fig. 4D).
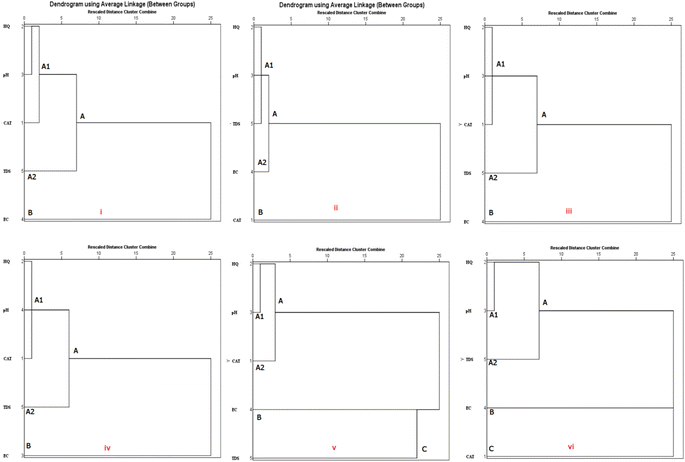
Furthermore, the Lagos State surface water samples were dominated by two PCs (PC 1 and PC 2) accounting for 83.5% of the total variance, suggesting the influence of two major anthropogenic sources of contamination of the surface water. PC 1 was dominated by CAT and HQ accounting for 52.9% of the total variance with high loadings of 0.98 and 0.96 respectively (Table 2). This strong association indicates that both pollutants (CAT and HQ) are likely from the same anthropogenic source. As isomers, CAT and HQ often coexist and are identified together in most samples.2 Just like other samples from Osun and Oyo States, PC 2 was dominated by EC and TDS in surface water accounting for 30.7% of the total variance with high loadings of 0.91 and 0.92 respectively. The dendrograms from the hierarchical cluster analysis (Fig. 5) further corroborates the results of the PCA.
Osun groundwater and surface water samples were grouped into two main clusters (A and B). Cluster A contains two lower clusters, A1 (HQ, pH and CAT) and (HQ, pH and TDS), and A2 (pH and TDS) and (pH and EC) for the groundwater and surface water samples respectively. pH and HQ are joined together at a close distance, suggesting a common source of influence for pH and HQ in both groundwater and surface water samples for A1, while HQ and CAT are joined together at a farther distance for groundwater samples. HQ and TDS are joined together at a farther distance for surface water samples indicating that different factors influence the presence of HQ and TDS in the water samples. Furthermore, A2 (pH and TDS) is joined together at another relatively higher level than A1 (HQ, pH and CAT) for groundwater samples. For the surface water samples, A2 (pH and EC) is joined together at another relatively higher level than A1 (HQ, pH and TDS) indicating they might have same origin. Also, the cluster analysis (CA) result show a stand-alone cluster B (EC) that join cluster A at a higher distance for groundwater samples and a stand-alone cluster B (CAT) that joined cluster A at a higher distance for surface water samples, respectively (Fig. 5(i and ii)).
Fig. 5(iii and iv) show the results of the CA for data from Oyo groundwater and surface water samples which follow the same trend with CA got Osun State groundwater and surface water samples. The samples are classified into two main clusters (A and B). Cluster A contains two lower clusters, A1 (HQ, pH and CAT) and A2 (pH and TDS) for both groundwater and surface water samples. pH and HQ are joined together at a close distance, indicative of a similar source in the water samples in A1. Furthermore, the CA result showed a stand-alone cluster B (EC) that joined cluster A at a higher distance for groundwater samples. It is observed that the proximity in the dendrogram between EC and TDS in Fig. 5(iii and iv) suggests a form of similarity in distribution patterns in water samples and corroborated the PCA results.
The results of the CA for water samples from Lagos State showed that groundwater and surface water samples from this State are classified into three main clusters (A, B and C). The cluster A and B followed the same trend for Osun groundwater and surface water samples (Fig. 5(v and vi)). The cluster C (TDS) is a stand-alone cluster that joined with cluster B at a shorter distance and cluster A at a farther distance for groundwater samples. The same can be seen for the surface water samples. This indicates the influence of an entirely different anthropogenic source for the physicochemical property and CAT.
3.3 Ecological risk assessment
Based on the minimum and maximum measured environmental concentrations for surface water and groundwater samples from the three States, the ecological risk assessment for HQ and CAT was calculated. Results are presented in Tables S2 and S3 (ESI document†).The ecological risk to three taxonomic group: algae, Daphnia, and fish from both the minimum and maximum concentrations of HQ and CAT in groundwater and surface water from the three States is high and even higher during the rainy season than in the dry season for Osun State. Generally, CAT pose the highest toxicity risk to the three taxonomic group. Furthermore, from the acute and chronic scale of ecological risk (RQacute & RQchronic), Daphnia in these water samples appears to be more at risk than either Algae or Fish (Tables S2 and S3†) in both dry and rainy seasons.
Generally, the ecological risk from the presence of HQ and CAT in these water samples is more in the rainy season than in the dry season. However, samples from Oyo showed a reverse trend. Groundwater samples from Osun and Lagos States showed more toxicity to Algae, Daphnia, and Fish during the rainy season than during the dry season judging from their higher maximum concentrations obtained.
3.4. Human exposure and cancer risk assessments
One of the major sources of drinking water for people living in Nigeria is the groundwater either from boreholes or hand-dug wells. A large percentage of people living in rural parts of the country also depend on surface water as a source of drinking water. Hence, it is of absolute importance to determine the level of human exposure to these compounds when ingesting water from these sources. The human exposure to phenolic compounds in this study was assessed using the estimated daily intake (EDI; μg per kg bw per day) based on the United States Exposure Factors Handbook (USEPA, 2011). The population was grouped into infants (<1 year old), toddlers (1–3 years old), children (4–11 years old), teenagers (12–21 years old) and adults (≥21 years old).| EDI water (μg per kg bw per day) = (C × D)/BW | (4) |
The median, minimum, and maximum concentrations for HQ and CAT in groundwater and surface water samples collected from the different States are provided in Table S1.†
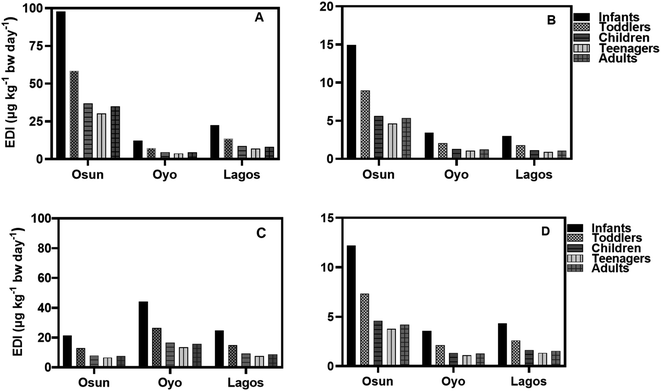
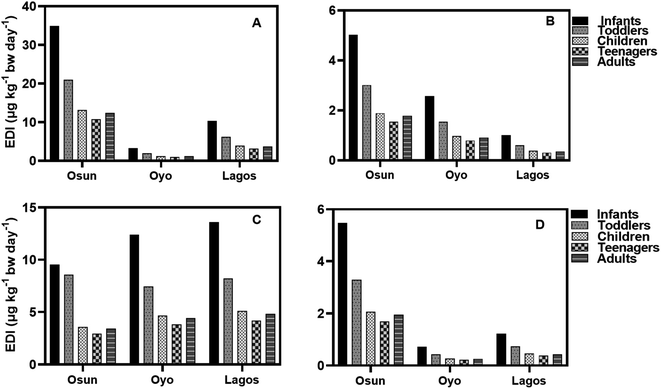
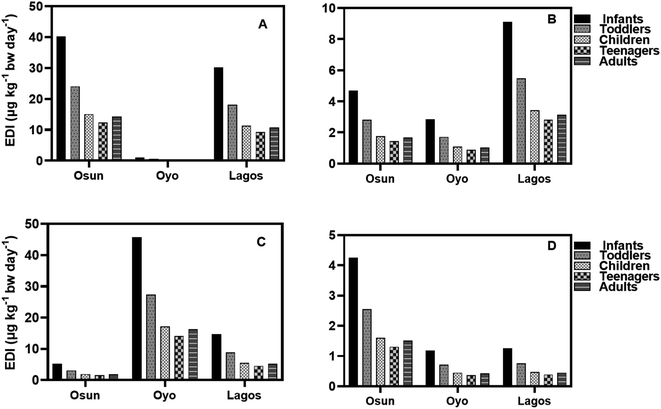
The EDI values of HQ in groundwater and surface water samples for all three States in both seasons using minimum, median, and concentrations of HQ, are lower than the NOAEL value provided by the USEPA while EDI values for teenagers were the lowest (Fig. 6–9). It is observed that EDI values decreased with the increasing age of the exposure group, with infants and toddlers having most of the highest EDI values. In Osun State, the EDI values are higher during the rainy season than in the dry season when minimum values are used of calculation (Fig. 6A–D). The same is true when median concentrations are used for EDI calculations (Fig. 7A–D).
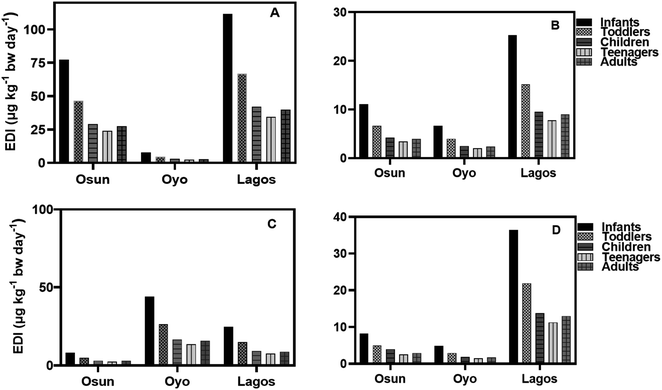
According to the results, the EDI values for HQ and CAT in surface water increased in the dry season than in the rainy season (Fig. 8A–D) using the maximum concentration. The reverse is the case with median concentrations of HQ and CAT in surface water.
Using the median concentration values, the EDI values are slightly higher in the rainy season than in the dry season (Fig. 9A–D). It is observed that EDI values decreased with the increasing age of the exposure group. The EDI values were highest for infants and lowest for teenagers across the three States. However, there is no statistical difference between EDI values for Children, Teenagers, and Adults.
4 Conclusion
After a comprehensive monitoring of water bodies in three south-western States in Nigeria, CAT and HQ were found in most of the water samples (groundwater and surface water), which are the major sources of drinking water for the populace inhabiting these States. Judging from the average concentrations obtained from these contaminants, it can be seen that the concentrations are higher than expected and that the most frequently detected dihydroxybenzene compound was CAT (100%) in water samples. However, the high detection frequency of these compounds are potentially from wash-offs, improper disposal of pharmaceuticals, excessive use of pesticides and an increased use of these dihydroxybenzenes for making several household and agricultural products. Expectedly, there was a significant decrease in the concentration of these contaminants during the dry season except for Oyo State which gave a reverse trend because of the aforementioned reason. This is clearly a pointer to the effect of climate change in the environment. Algae, Daphnia and fish are more susceptible to CAT in both surface water and groundwater samples from the three States. The human risk assessment showed high non-carcinogenic risks to humans, especially CAT, when ingested orally at concentrations found in this study. Drawing inference from the PCA analysis, the surface water samples in the three states have similar sources of contamination and influencing factors. There was a strong association between the concentrations of HQ and CAT which suggests that these two compounds are from similar sources and drawing inferences from the statistical results, the similar factors aforementioned are responsible for the presence of HQ and CAT in the water samples. There is a need for determining, monitoring, and recommending guidelines and permissible limits for these contaminants in water bodies as there are limited resources on the monitoring and the presence of these contaminants in water. There is a need for awareness on how toxic these dihydroxybenzene compounds are in our water bodies and further develop strategies for their abatement in our water bodies.There should be recommendations to policy makers and governing bodies about the creation of guidelines and limits for these contaminants found specifically in drinking water especially for HQ. Safe practices such as controlled and proper disposal of pharmaceuticals and the proper dicharge of industrial effluents should be worked upon.
Author contributions
Oluwaferanmi B. Otitoju: conceptualization, investigation, writing – original draft, formal analysis, writing – review & editing, methodology. Moses O. Alfred: conceptualization, supervision, resources, formal analysis, validation, writing – review & editing, methodology, formal analysis. Chidinma G. Olorunnisola: resources, formal analysis, validation, writing – review & editing. Francis T. Aderinola: formal analysis, writing – review & editing. Olumuyiwa O. Ogunlaja: funding acquisition, investigation, writing – review & editing, methodology, formal analysis. Olumide D. Olukanni: funding acquisition, resources, writing – review & editing. Aemere Ogunlaja: funding acquisition, resources, writing – review & editing. Martins O. Omorogie: funding acquisition, writing – review & editing, supervision, resources. Emmanuel I. Unuabonah: funding acquisition, conceptualization, investigation, resources, project administration, methodology, writing – review & editing.Conflicts of interest
The authors declare that there is no conflict of interest of any kind in this manuscript.Acknowledgements
The authors acknowledge, with much thanks, funding from The World Academy of Sciences-Islamic Development Bank (TWAS-IsDB) collaborative research grant (Grant number: 4500420197) to carry out this study.References
- N. Khatri and S. Tyagi, Front. Life Sci., 2015, 8, 23–39 CrossRef CAS.
- D.-M. Zhao, X.-H. Zhang, L.-J. Feng, L. Jia and S.-F. Wang, Colloids Surf., B, 2009, 74, 317–321 CrossRef CAS PubMed.
- W. Westerhof and T. Kooyers, J. Cosmet. Dermatol., 2005, 4, 55–59 CrossRef CAS PubMed.
- M. I. Bhanger, A. Niaz, A. Shah and A. J. T. Rauf, Talanta, 2007, 72, 546–553 CrossRef PubMed.
- C.-H. Yu, N.-X. Cui, Y. Wang, Y. Wang, W.-J. Liu, M. Gong, X. Zhao, L. Rong and Z.-C. Yi, Toxicol. In Vitro, 2017, 43, 21–28 CrossRef CAS PubMed.
- Q. Saleem, S. Shahid, M. Javed, S. Iqbal, A. Rahim, S. Mansoor, A. Bahadur, N. S. Awwad, H. A. Ibrahium and R. S. Almufarij, RSC Adv., 2023, 13, 10017–10028 RSC.
- P. Pereira, F. J. Enguita, J. Ferreira and A. L. Leitão, Toxicol Rep., 2014, 1, 1096–1105 CrossRef CAS PubMed.
- H. Bahadar, F. Maqbool, S. Mostafalou, M. Baeeri, M. Gholami and E. Ghafour-Boroujerdi, Toxicol. Mech. Methods, 2015, 25, 628–636 CrossRef CAS PubMed.
- B. Bukowska and S. J. T. l. Kowalska, Toxicol. Lett., 2004, 152, 73–84 CrossRef CAS PubMed.
- S. Suresh, V. C. Srivastava and I. M. Mishra, Int. J. Energy Environ. Eng., 2012, 3, 1–19 CrossRef.
- D. McGregor, Crit. Rev. Toxicol., 2007, 37, 887–914 CrossRef CAS PubMed.
- P. Gimeno, A.-F. Maggio, M. Bancilhon, N. Lassu, H. Gornes and C. Brenier, J. Chromatogr. Sci., 2016, 54, 343–352 CAS.
- M. B. van Duursen, J. T. Sanderson, P. C. de Jong, M. Kraaij and M. van den Berg, Toxicol. Sci., 2004, 81, 316–324 CrossRef CAS PubMed.
- M. Irfan, A. Shafeeq, U. Siddiq, F. Bashir, T. Ahmad, M. Athar, M. T. Butt, S. Ullah, A. Mukhtar and M. Hussien, J. Hazard. Mater., 2022, 433, 128806 CrossRef CAS.
- L. A. Alshahrani, X. Li, H. Luo, L. Yang, M. Wang, S. Yan, P. Liu, Y. Yang and Q. Li, Sensors, 2014, 14, 22274–22284 CrossRef.
- R. Huang, S. Chen, J. Yu and X. Jiang, Ecotoxicol. Environ. Saf., 2019, 184, 109619 CrossRef CAS.
- L. Liao, P. Zhou, F. Xiao, W. Tang, M. Zhao, R. Su, P. He, D. Yang, L. Bian and B. Tang, Ionics, 2023, 29, 1605–1615 CrossRef CAS.
- Q. Saleem, S. Shahid, M. Javed, S. Iqbal, A. Rahim, S. Mansoor, A. Bahadur, N. S. Awwad, H. A. Ibrahium and R. S. Almufarij, RSC Adv., 2023, 13, 10017–10028 RSC.
- J. Zhu, R. Fan, Y. Wang, Z. Lv, Y. Han, J. Peng, X. Zheng and R. Lin, J. Braz. Chem. Soc., 2020, 31, 25–32 Search PubMed.
- S. Arpitha, B. K. Swamy and J. Shashikumara, Inorg. Chem. Commun., 2023, 152, 110656 CrossRef CAS.
- N. Yalikun, L. Xu, X. Yang and Q. Wang, Sci. Adv. Mater., 2021, 13, 2178–2184 CrossRef CAS.
- H. Hammani, F. Laghrib, S. Lahrich, A. Farahi, M. Bakasse, A. Aboulkas and M. El Mhammedi, Ionics, 2019, 25, 2285–2295 CrossRef CAS.
- M. K. Abugazleh, B. Rougeau and H. Ali, J. Environ. Chem. Eng., 2020, 8, 104180 CrossRef CAS.
- S. Ghiasi, H. Roshanfekr and H. Peyman, Adv. Nanochem., 2021, 3, 71–79 Search PubMed.
- B. De Gusseme, L. Vanhaecke, W. Verstraete and N. Boon, Water Res., 2011, 45, 1829–1837 CrossRef CAS PubMed.
- T. O. Olanrewaju, A. Aderibigbe, A. A. Popoola, K. T. Braimoh, M. O. Buhari, O. T. Adedoyin, S. A. Kuranga, S. A. Biliaminu, A. Chijioke and A. A. Ajape, BMC Nephrol., 2020, 21, 1–10 CrossRef PubMed.
- D. McGregor, Crit. Rev. Toxicol., 2007, 37, 887–914 CrossRef CAS PubMed.
- E. S. Agorku, E. E. Kwaansa-Ansah, R. B. Voegborlo, P. Amegbletor and F. Opoku, SpringerPlus, 2016, 5, 1–5 CrossRef CAS PubMed.
- S. B. Norton, D. J. Rodier, W. H. van der Schalie, W. P. Wood, M. W. Slimak and J. H. Gentile, Environ. Toxicol. Chem., 1992, 11, 1663–1672 CrossRef CAS.
- J. Wang, H. Wei, X. Zhou, K. Li, W. Wu and M. Guo, Mar. Pollut. Bull., 2019, 146, 794–800 CrossRef CAS PubMed.
- L. Wang, X. Yang, A. Zhang, G. Bidegain, R. Li, G. Na and X. Yuan, Mar. Pollut. Bull., 2019, 146, 915–920 CrossRef CAS PubMed.
- A. Ogunlaja, O. O. Ogunlaja, D. M. Okewole and O. A. Morenikeji, Sci. Total Environ., 2019, 651, 2943–2952 CrossRef CAS PubMed.
- O. O. Adesanya, O. O. Ogunlaja, F. O. Agunbiade, A. Ogunlaja, E. I. Unuabonah and L. O. Adebajo, Environ. Forensics, 2020, 1–12 CrossRef.
- O. Awolusi, M. Nasr, S. Kumari and F. Bux, Int. J. Environ. Sci. Technol., 2018, 15, 1477–1490 CrossRef CAS.
- N. B. Bolujoko, O. O. Ogunlaja, M. O. Alfred, D. M. Okewole, A. Ogunlaja, O. D. Olukanni, T. A. Msagati and E. I. Unuabonah, Sci. Total Environ., 2022, 814, 152448 CrossRef CAS PubMed.
- D.-P. Yang, H.-F. Ji, G.-Y. Tang, W. Ren and H.-Y. Zhang, Molecules, 2007, 12, 878–884 CrossRef CAS PubMed.
- K. Kurogi, A. Alazizi, M.-Y. Liu, Y. Sakakibara, M. Suiko, T. Sugahara and M.-C. Liu, Biochem. Pharmacol., 2012, 84, 1186–1195 CrossRef CAS PubMed.
- M. Patel, R. Kumar, K. Kishor, T. Mlsna, C. U. Pittman Jr and D. Mohan, Chem. Rev., 2019, 119, 3510–3673 CrossRef CAS PubMed.
- K. H. Kim, K. Jeong, J. Zhuang, H. J. Jeong, C. S. Kim, B. Koo and C. G. Yoo, Ind. Crops Prod., 2021, 159, 113095 CrossRef CAS.
- O. Onyekwere, C. J. Okonkwo, A. B. Okoroafor and C. J. Okonkwo, Ovidius Univ. Ann. Chem., 2019, 30, 101–107 CrossRef CAS.
- A. Al-Shekaili, W. Al-Shukaili and E. A. Khudaish, J. Electroanal. Chem., 2022, 919, 116509 CrossRef CAS.
Footnote |
| † Electronic supplementary information (ESI) available. See DOI: https://doi.org/10.1039/d3ra04877b |
| This journal is © The Royal Society of Chemistry 2024 |

