 Open Access Article
Exploring the stable structures of cerium oxide nanoclusters using high-dimensional neural network potential†
Huabing
Cai
ab,
Qinghua
Ren
 *a and
Yi
Gao
 *bcd
*bcd
aDepartment of Chemistry, Shanghai University, 99 Shangda Road, Shanghai 200444, China. E-mail: qinghua.ren@shu.edu.cn
bShanghai Institute of Applied Physics, Chinese Academy of Sciences, Shanghai 201800, China
cPhonon Science Research Center for Carbon Dioxide, Shanghai Advanced Research Institute, Chinese Academy of Sciences, Shanghai 201210, China. E-mail: gaoyi@sari.ac.cn
dKey Laboratory of Low-Carbon Conversion Science & Engineering, Shanghai Advanced Research Institute, Chinese Academy of Sciences, Shanghai 201210, China
First published on 3rd April 2024
Abstract
Cerium clusters have been extensively applied in industry owing to their extraordinary properties for oxygen storage and redox catalytic activities. However, their atomically precise structures have not been studied because of the lack of a reliable method to efficiently sample their complex structures. Herein, we combined a neural network algorithm with density functional theory calculations to establish a high-dimensional potential to search for the global minimums of cerium oxide clusters. Using Ce14O28 as well as its reduced state Ce14O27 and oxidized state Ce14O29 with ultra-small dimensions of ∼1.0 nm as examples, we found that these three clusters adopt pyramid-like structures with the lowest energies, which was obtained by exploring 100![[thin space (1/6-em)]](https://www.rsc.org/images/entities/char_2009.gif) 000 configurations in large feasible spaces. Further the neural network potential-enhanced molecular dynamics calculations indicated that these cluster structures are stable at high temperature. The electronic structure analysis suggested that these clusters are highly active and easily lose oxygen. This work demonstrated that neural network potentials can be useful for exploring the stable structures of metal oxide nanoclusters in practical applications.
000 configurations in large feasible spaces. Further the neural network potential-enhanced molecular dynamics calculations indicated that these cluster structures are stable at high temperature. The electronic structure analysis suggested that these clusters are highly active and easily lose oxygen. This work demonstrated that neural network potentials can be useful for exploring the stable structures of metal oxide nanoclusters in practical applications.
Introduction
With unique redox properties, which are crucial for many applications, CeO2-based materials have been widely used in fuel cells, water splitting, water–gas shift reactions, and others.1–9 The unique redox properties of cerium oxides are mainly related to oxygen vacancies and Ce3+ ions.10–12 In the past decade, nanoscale cerium oxides have received more attention than bulk materials because of their higher reactivity.13,14 The high reactivity of ultra-small cerium oxides even at ambient temperatures gives them many potential applications, especially in biomedical fields, such as antibacterial agents, cancer therapies, and antioxidative neurorestoration.15–18 The application of cerium oxide nanoparticles is related to their activity and stability, which depends on their size, shape, composition (such as Ce3+/Ce4+ ratios), and other structural factors.19,20 Obtaining atomically precise structures of cerium oxide nanoclusters can help understand how structural factors affect their properties; however, identifying the structures of pristine CeO2 clusters is still challenging in experimental work.Meanwhile, theoretical work has made great progress in exploring the stable structures of nanoclusters by combining the global-optimization method and first-principles calculations.21–24 However, predicting the stable structures of metal oxides is more complicated as their possible configurations are numerous and the computational costs increase exponentially. Although there are some empirical potentials developed to aid approximates, such as the Lennard-Jones potential for TiO2 nanoparticles,25 the modified embedded-atom method for ternary Cu–Ta–O oxides,26 and the Morse function for IrO2 nanoclusters,27 the complexity of the electronic configurations of CeO2 clusters requires a high-precision potential using first-principles calculations for efficient structural sampling, which to date is still lacking.
In this work, a machine learning model was developed to construct the high-dimensional neural network potential to search for the most stable cerium oxide nanoclusters in large feasible spaces. The data set for the machine learning model included the coordinates and energies corresponding to geometry optimization of each random initial structure using density functional theory calculations. Using a well-trained neural network, the most stable structure was obtained by the basin-hopping global optimization of randomly generated isomers. Active learning was used in this workflow, iterating many times until the predicted energies fitted well with DFT calculations, not only the numerical values but also the order of the isomers. Using Ce14O28 as well as its reduced state Ce14O27 and oxidized state Ce14O29 as examples, we found three clusters adopt pyramid-like structures as the global minima.
Methods
Generation of random initial structures
All the cerium oxide structures were randomly extracted from a large cerium oxide bulk structure. As shown in Fig. 1, taking the sampling gray region required to generate nanocluster Ce14O28 as an example, a cerium atom was first selected as the center of the sampling region, and the 8 oxygen atoms closest to it were preferentially selected (the atomic distances to the central atom were 2.37 Å), and then 20 oxygen atoms were randomly selected from the second nearest neighboring 24 O atoms with atomic distances of 4.53 Å. The remaining 13 Ce atoms were randomly selected from a total of 18 cerium atoms of the nearest neighbor with atomic distances of 3.86 Å and the second nearest neighbor with atomic distances of 5.46 Å. For securing the randomness of the constructed structures, all the atoms were given random displacements of no more than 0.2 Å compared to the initial positions.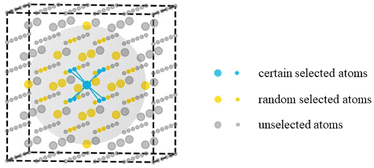 | ||
| Fig. 1 Schematic diagram of the sampling method. The larger atoms represent cerium atoms and the smaller atoms represent oxygen atoms, while the gray sphere shows the sampling area. | ||
Data set based on DFT calculations
The data set of the machine learning model was based on density functional theory (DFT) calculations, performed using the Vienna ab initio Simulation Package (VASP).28 All the DFT calculations employed the general gradient approximation (GGA) Perdew–Burke–Ernzerhof (PBE) functional.29 The cutoff energy of the plane-wave basis was set to 400 eV. The energies were converged to 10−4 eV. The conjugate gradient algorithm was employed for geometry optimization. The DFT + U method30 was used in these calculations with an effective U of 5.0 eV. Considering the rationality of the initial structures, the atomic spacings were calculated to determine whether there were outlier atoms. If outlier atoms existed, the random structure was re-generated. These structures were optimized by DFT calculations, and the coordinates and energies were used as the data set for machine learning. The total data set was randomly split into 90% for training, while the remaining 10% was used as the test data set to validate the accuracy of the machine learning potential.Construction of the machine learning model
The machine learning model of a class of high-dimensional neural network, based on the Behler–Parrinello artificial neural network, was constructed using the n2p2 code.31–33 Using this code, the total potential energy of the cerium oxide was defined as the sum of atomic potential energies. The atomic energies were trained by an atomic neural network using the symmetry function to represent the structural and chemical environment information of each atom. The symmetry functions, including radial symmetry function, narrow angular symmetry function, and wide angular symmetry function, were chosen to represent the local chemical environment of cerium atoms and oxygen atoms from the Cartesian coordinates. The cutoff radius of all the symmetry functions was 6 Å. Each neural network consisted of an input layer, two hidden layers with 18 nodes each, and an output layer. The weight parameters of the neural network were optimized by Kalman filter,34 which is an efficient approach to minimize the cost function defined by the root-mean-square error (RMSE) of energies and forces. In this machine learning model, active learning was used to iterate several times until the RMSE between the energies predicted by the neural network and the energies calculated by DFT converged to a value less than 10 meV per atom. More details about the machine learning method can be found in the ESI.†Global minimization based on the neural network potential
The neural network potential (NNP) combined with basin-hopping method was employed to explore the stable structures of the cerium oxide nanoclusters, using the large-scale atomic/molecular massively parallel simulator (LAMMPS).35 For sampling larger configuration spaces, we adopted another sampling strategy for global minimization, in which all the atoms in the sampling region were selected with the same probability, and the central atom of the sampling region was iteratively updated. All the random structures were generated by this method with different random seeds for each structure. The energy of each structure was minimized using the conjugate gradient algorithm based on the neural network potential function, setting 10−5 eV as the energy tolerance. A total of 10 paths were run in parallel to search for the most stable structure of cerium oxide nanoclusters in a huge configuration space, with 10![[thin space (1/6-em)]](https://www.rsc.org/images/entities/char_2009.gif) 000 structures per path. Combining the results of these 10 paths, the lowest energy nanocluster after geometry optimization was considered as the most stable structure.
000 structures per path. Combining the results of these 10 paths, the lowest energy nanocluster after geometry optimization was considered as the most stable structure.
Results and discussion
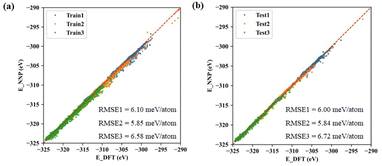
The machine learning model started with generating a total of ∼300 non-repeating initial structures of the three types of cerium oxides (Ce14O27, Ce14O28, Ce14O29) with the size of ∼1 nm, which were randomly sampled by the number of cerium and oxygen atoms in a large cerium oxide crystal structure. After optimizing the random initial structures by DFT calculations, the structures and energies were used as the data set for the machine learning model. In this work, active learning was used and the three neural networks were iterated several times until the predicted results were in good agreement with the values and ordering of the energies calculated by the DFT, increasing the data points to 8142, 7796, and 10![[thin space (1/6-em)]](https://www.rsc.org/images/entities/char_2009.gif) 385. Finally, the root-mean-square error (RMSE) of acceptable neural networks was about 6 meV per atom (Fig. 2).
385. Finally, the root-mean-square error (RMSE) of acceptable neural networks was about 6 meV per atom (Fig. 2).
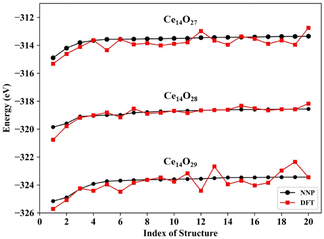
The predictions for the top 20 low-energy structures of the NNP were in good agreement with DFT calculations, as shown in Fig. 3. The mean absolute energy errors of these top 20 lowest energy nanoclusters Ce14Ox (x = 27, 28, and 29) were 0.36, 0.15, and 0.41 eV, and the mean errors to each atom were 8.8, 3.6, and 9.5 meV per atom, all of which were less than 10 meV per atom. For each type of cerium oxide nanocluster, the top two minimums predicted by the NNP were fully consistent with the top two minimums calculated by DFT. Although there were some fluctuations in the energy differences between NNP and DFT, especially for the nanocluster Ce14O29, the trend of energy ordering predicted by the NNP was similar to that calculated by DFT.
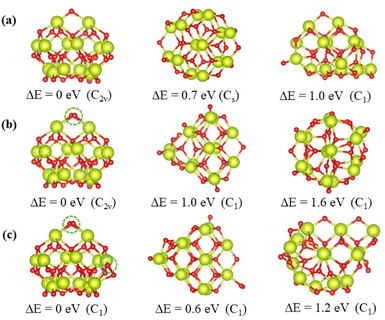
The top 3 minima obtained from the energy verified by DFT calculations of the nanoclusters Ce14Ox (x = 27, 28, and 29) are shown in Fig. 4, and the others are shown in Fig. S1–S3.† All the most stable structures had higher symmetry and lower energies by at least 0.6 eV than the others. These structures were all pyramid-like, where the cerium atoms were in the same configuration and oxygen atoms were nearly the same configuration. The 14 cerium atoms consisted of three Ce layers in a 2 × 1![[thin space (1/6-em)]](https://www.rsc.org/images/entities/char_2009.gif) :
:![[thin space (1/6-em)]](https://www.rsc.org/images/entities/char_2009.gif) 3 × 2
3 × 2![[thin space (1/6-em)]](https://www.rsc.org/images/entities/char_2009.gif) :
:![[thin space (1/6-em)]](https://www.rsc.org/images/entities/char_2009.gif) 2 × 3 pattern. The oxygen atoms consisted of four O layers in slightly different pattern. As shown in Fig. 4, the oxygen atoms circled in blue are the additional oxygen atoms of Ce14O28 and Ce14O29 compared to Ce14O27. The most stable structure of the nanocluster Ce14O28 was based on the structure of Ce14O27, adding a new oxygen atom next to the oxygen atom in the top layer and maintaining the same C2v symmetry as the nanocluster Ce14O27. As the most stable structure of the nanocluster Ce14O29, a new oxygen atom was added to the right corner of the third layer of oxygen atoms on the structure of Ce14O28, but the symmetry was reduced to C1.
2 × 3 pattern. The oxygen atoms consisted of four O layers in slightly different pattern. As shown in Fig. 4, the oxygen atoms circled in blue are the additional oxygen atoms of Ce14O28 and Ce14O29 compared to Ce14O27. The most stable structure of the nanocluster Ce14O28 was based on the structure of Ce14O27, adding a new oxygen atom next to the oxygen atom in the top layer and maintaining the same C2v symmetry as the nanocluster Ce14O27. As the most stable structure of the nanocluster Ce14O29, a new oxygen atom was added to the right corner of the third layer of oxygen atoms on the structure of Ce14O28, but the symmetry was reduced to C1.
The lowest oxygen vacancy formation energies of CeO2(111) and bulk CeO2 calculated by DFT were 1.63 and 3.30 eV. In comparison, the energies for the nanoclusters Ce14O29 and Ce14O28 to lose one oxygen atom were 0.03 and 0.15 eV, respectively, which are significantly lower than those of CeO2(111) and bulk CeO2, indicating cerium oxide nanoclusters are more likely to store and lose oxygen atoms for redox reactions.
Based on neural network potential, molecular dynamics (MD) simulations of the three most stable structures of the nanoclusters Ce14Ox (x = 27, 28, and 29) were performed for up to 1 nanosecond (ns) at 700 K to verify the dynamic stability. The simulations were performed in the NVT ensemble with time steps of 1 femtosecond (fs). The energies of Ce14Ox (x = 27, 28, and 29) fluctuated around −311.2, −316.0, and −320.9 eV, respectively. As shown in Fig. 5, the snapshots taken every 200 picosecond (ps) show that the structure of Ce14O28 was more stable over the simulation period of 1 ns, with almost no significant changes. Similar structural stabilities could also be found in Ce14O27 and Ce14O29 (Fig. S5 and S6†). Compared to the nanocluster Ce14O27, the nanoclusters Ce14O28 and Ce14O29 were more active, especially Ce14O29. These structural changes occur at the locations of the additional oxygen atoms compared to the nanocluster Ce14O27, where the cerium–oxygen bonds briefly break and then return to the previous structure, indicating that these locations may be the active sites of the structures.
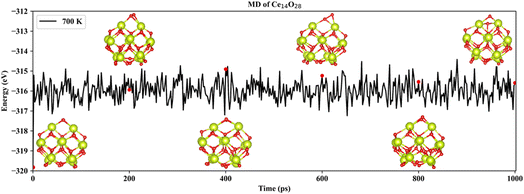 | ||
| Fig. 5 Snapshots of the most stable nanocluster Ce14O28 extracted every 200 ps from 700 K MD trajectories. | ||
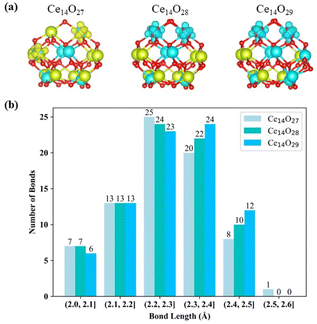
Compared to the bulk structure of CeO2, which is composed of 8-coordinate Ce4+ and 4-coordinate O2− ions, the Ce atoms in the three most stable nanoclusters Ce14Ox (x = 27, 28, and 29) are 5-coordinate (green) or 6-coordinate (cyan), as shown in Fig. 6(a). Ce14O27 has four 6-coordinate cerium atoms, while Ce14O28 and Ce14O29 have six and eight 6-coordinate cerium atoms, respectively. The oxygen atoms are 2, 3, and 4 coordinated. The inner oxygen atoms of the cerium oxide cluster are 4-coordinate and the outer oxygen atoms are 3- or 2-coordinate. The three most stable nanoclusters Ce14Ox (x = 27, 28, and 29) all have five 4-coordinate oxygen atoms. For each of most stable nanoclusters, all the 4-coordinate oxygen atoms are in the same position, where one is in the middle of the second layer of oxygen atoms, and the other four atoms are symmetrically located inside the third layer in a 2 × 2 pattern.
As shown in Fig. 6(a), the locations of Ce3+ in the three lowest energy structures were characterized according to the spin density. There are two Ce3+ in the most stable structures of each nanocluster Ce14Ox (x = 27, 28, and 29). The two Ce3+ in the nanoclusters Ce14O28 and Ce14O29 are located at the same location, symmetrically within the first layer of cerium atoms. Two Ce3+ of the nanocluster Ce14O27 are located on the right side of the first layer of cerium atoms and on the left of the second layer. Since the volume of Ce3+ is larger than that of Ce4+, the asymmetrical location of the two Ce3+ distorts the structure and affects the symmetry of the nanocluster Ce14O27. The symmetry of the nanocluster Ce14O27 was reduced from C2v to Cs. Interestingly, both the most stable structures of Ce14O28 and Ce14O29 have two Ce3+ polarons, which are different from the bulk and surface of CeO2. This could be attributed to their distinct structures, in which each additional oxygen atom of the Ce14O28 and Ce14O29 forms a 1.5 Å O–O bond with the adjacent oxygen atom. Thus, the O–O species contribute two electrons to the Ce14O28 and Ce14O29 as the O of Ce14O27. This means that all these three clusters have electrons they can easily lose, indicating their high catalytic activity.
The Ce–O bond length in the crystal structure of cerium oxide is 2.34 Å. The average bond lengths in the global minima of the nanoclusters Ce14Ox (x = 27, 28, and 29) are 2.28, 2.28, and 2.29 Å, respectively, which are shorter than the Ce–O bond in the crystal structure. As shown in Fig. 6(b) for the statistics of the bond lengths at 0.1 Å intervals, the Ce–O bond lengths of the three most stable cerium oxide nanoclusters are 2.3 ± 0.3 Å, and about 60% of the bond lengths are in the range of 2.3 ± 0.1 Å, with more than half less than 2.3 Å. Starting from the nanocluster Ce14O27 with 74 Ce–O bonds, two Ce–O bonds are added for each additional oxygen atom. The longest Ce–O bond lengths of these three most stable structures are 2.52, 2.46, and 2.47 Å. The longest bond length of the nanocluster Ce14O27 is significantly longer than the other two stable structures, and is 0.04 Å longer than the second longest bond of its own. Meanwhile, the differences between the longest bond length and the second bond length of Ce14O28 or Ce14O29 does not exceed 0.01 Å. In Ce14O27, the longest bond length is between the Ce3+ in the second layer of cerium atom and the leftmost oxygen atom in the second layer of oxygen atoms. This Ce3+ in Ce14O27 has longer bond lengths with the surrounding oxygen atoms compared to the Ce4+ atom at the same location in the nanocluster Ce14O28 or Ce14O29. It thus seems that Ce3+ is larger and requires more space, so it pulls away the surrounding oxygen atoms. The leftmost oxygen atom in the second layer is more likely to be pulled away, so the bond length between this oxygen and Ce3+ in the second layer of cerium atoms is significantly longer.
The density of states (DOS) of the most stable structures of the nanoclusters Ce14Ox (x = 27, 28, and 29) are shown in Fig. 7. The Fermi levels of these three structures are close to the valence band maximum (VBM) and the corresponding DOSs are zero. The band gaps are about 1.38, 1.48, and 1.30 eV for Ce14O27, Ce14O28, and Ce14O29, respectively. In the conduction band, the DOS value of the nanoclusters Ce14O27 is slightly lower than that of the nanoclusters Ce14O28 and Ce14O29, while the DOS values of the nanoclusters Ce14O28 and Ce14O29 are almost equal. All the VBM are mainly contributed by the p orbital of O, while the conduction band minimum (CBM) are contributed mainly by the f orbital of Ce.
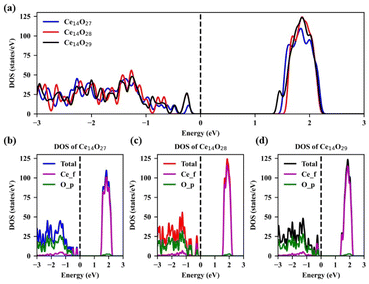 | ||
| Fig. 7 Density of states (DOS) of the most stable structures of Ce14Ox (x = 27, 28, and 29): (a) TDOS of Ce14Ox (x = 27, 28, and 29); (b) DOS of Ce14O27; (c) DOS of Ce14O28; (d) DOS of Ce14O29. | ||
Conclusions
In conclusion, a machine learning model was developed to predict the most stable structures of cerium oxide nanoclusters. Using the well-trained high-dimensional neural network potential combined with the basin-hopping method, the global minimum structures of Ce14O28 as well as its reduced state Ce14O27 and oxidized state Ce14O29 were explored. The Ce14Ox (x = 27, 28, and 29) clusters adopted similar pyramid-like structures. The NNP-MD simulation suggested these cluster structures are stable at high temperature. The electronic structures analysis indicated these clusters are highly active and can easily lose oxygen, which leads to their resultant antioxidant activity. Moreover, due to the stability of these ultra-small nanoclusters, they will be excellent antioxidant agents in biomedical fields for the treatment of oxygen-related diseases. This work provides a viable strategy to search for the stable structures of cerium oxides nanoclusters. In addition, using the global optimization combined with the neural network potential, this method has both the advantages of high efficiency and high accuracy compared to first-principles calculations and the empirical potentials, which indicates its potential for exploring more complex systems in the future.Author contributions
Y. G. initiated the project. Y. G. and Q. R. supervised the project. H. C. carried out the calculations and data analysis. H. C. drafted the paper. Y. G. revised the paper. All authors participated in the discussions.Conflicts of interest
There are no conflicts to declare.Acknowledgements
The work supported by National Key R&D Program of China (2023YFA1506903), the National Natural Science Foundation of China (12174408), Natural Science Foundation of Shanghai Municipality (22JC1404200), Shanghai Municipal Science and Technology Major Project, and the Foundation of Key Laboratory of Low-Carbon Conversion Science & Engineering, Shanghai Advanced Research Institute, Chinese Academy of Sciences (KLLCCSE-202201Z, SARI, CAS). The calculations were performed at National Supercomputer Centers in Tianjin, Shanghai and Guangzhou. We acknowledge the support from Big Data Science Center, Shanghai Synchrotron Radiation Facility, Shanghai Advanced Research Institute, Chinese Academy of Sciences. This work is also supported by the high performance computing center of Shanghai University and Shanghai Technical Service Center of Science and Engineering Computing, Shanghai University.References
- T. Montini, M. Melchionna, M. Monai and P. Fornasiero, Chem. Rev., 2016, 116, 5987–6041 CrossRef CAS PubMed.
- R. Fiala, A. Figueroba, A. Bruix, M. Vaclavu, A. Rednyk, I. Khalakhan, M. Vorokhta, J. Lavkova, F. Illas, V. Potin, I. Matolinova, K. M. Neyman and V. Matolin, Appl. Catal., B, 2016, 197, 262–270 CrossRef CAS.
- M. Riegraf, I. Bombarda, F. Dömling, T. Liensdorf, C. Sitzmann, N. Langhof, S. Schafföner, F. Han, N. Sata, C. Geipel, C. Walter and R. Costa, ACS Appl. Mater. Interfaces, 2021, 13, 49879–49889 CrossRef CAS PubMed.
- S. Wen, J. Huang, T. Li, W. Chen, G. Chen, Q. Zhang, X. Zhang, Q. Qian and K. Ostrikov, Appl. Catal., B, 2022, 316, 121678 CrossRef CAS.
- R. Li, C. Wen, K. Yan, T. Liu, B. Zhang, M. Xu and Z. Zhou, J. Mater. Chem. A, 2023, 11, 7128–7141 RSC.
- J.-O. Shim, H.-S. Na, A. Jha, W.-J. Jang, D.-W. Jeong, I. W. Nah, B.-H. Jeon and H.-S. Roh, Chem. Eng. J., 2016, 306, 908–915 CrossRef CAS.
- J. Lee, D. Shin, E. Lee, C. Li, J. M. Kim, J. W. Han and D. H. Kim, Appl. Catal., B, 2022, 305, 121038 CrossRef CAS.
- W. Yang, Z. Wang, Y. Wei, Y. Xia, Z. Zhu and C. Liu, Chem. Eng. J., 2022, 446, 136740 CrossRef CAS.
- D. Van Dao, H. D. Jung, T. T. D. Nguyen, S.-W. Ki, H. Son, K.-B. Bae, T. D. Le, Y.-H. Cho, J.-K. Yang, Y.-T. Yu, S. Back and I.-H. Lee, J. Mater. Chem. A, 2021, 9, 10217–10230 RSC.
- Z.-K. Han, Y.-Z. Yang, B. Zhu, M. V. Ganduglia-Pirovano and Y. Gao, Phys. Rev. Mater., 2018, 2, 035802 CrossRef CAS.
- D. Zhang, Z.-K. Han, G. E. Murgida, M. V. Ganduglia-Pirovano and Y. Gao, Phys. Rev. Lett., 2019, 122, 096101 CrossRef CAS PubMed.
- F. Esch, S. Fabris, L. Zhou, T. Montini, C. Africh, P. Fornasiero, G. Comelli and R. Rosei, Science, 2005, 309, 752–755 CrossRef CAS PubMed.
- C. Sun, H. Li and L. Chen, Energy Environ. Sci., 2012, 5, 8475–8505 RSC.
- S. D. Senanayake, D. Stacchiola and J. A. Rodriguez, Acc. Chem. Res., 2013, 46, 1702–1711 CrossRef CAS PubMed.
- M. A. Saifi, S. Seal and C. Godugu, J. Controlled Release, 2021, 338, 164–189 CrossRef CAS PubMed.
- E. Casals, M. Zeng, M. Parra-Robert, G. Fernández-Varo, M. Morales-Ruiz, W. Jiménez, V. Puntes and G. Casals, Small, 2020, 16, 1907322 CrossRef CAS PubMed.
- J. Kim, G. Hong, L. Mazaleuskaya, J. C. Hsu, D. N. Rosario-Berrios, T. Grosser, P. F. Cho-Park and D. P. Cormode, ACS Appl. Mater. Interfaces, 2021, 13, 60852–60864 CrossRef CAS PubMed.
- X. Li, Z. Han, T. Wang, C. Ma, H. Li, H. Lei, Y. Yang, Y. Wang, Z. Pei, Z. Liu, L. Cheng and G. Chen, Biomaterials, 2022, 291, 121904 CrossRef CAS PubMed.
- S. Yadav, S. Chamoli, P. Kumar and P. K. Maurya, Int. J. Biol. Macromol., 2023, 246, 125673 CrossRef CAS PubMed.
- S. Kargozar, F. Baino, S. J. Hoseini, S. Hamzehlou, M. Darroudi, J. Verdi, L. Hasanzadeh, H.-W. Kim and M. Mozafari, Nanomedicine, 2018, 13, 3051–3069 CrossRef CAS PubMed.
- Y. Gao and X. C. Zeng, J. Am. Chem. Soc., 2005, 127, 3698–3699 CrossRef CAS PubMed.
- X. Dong, S. Jalife, A. Vásquez-Espinal, E. Ravell, S. Pan, J. L. Cabellos, W.-y. Liang, Z.-h. Cui and G. Merino, Angew. Chem., Int. Ed., 2018, 57, 4627–4631 CrossRef CAS PubMed.
- X. Ma, Y. Bai, Y. Song, Q. Li, Y. Lv, H. Zhang, H. Yu and M. Zhu, Angew. Chem., Int. Ed., 2020, 59, 17234–17238 CrossRef CAS PubMed.
- Y. Gao, S. Bulusu and X. C. Zeng, ChemPhysChem, 2006, 7, 2275–2278 CrossRef CAS PubMed.
- B. Luan, T. Huynh and R. Zhou, J. Chem. Phys., 2015, 142, 234102 CrossRef PubMed.
- H. Gao, A. Otero-de-la-Roza, J. Gu, D. A. Stone, S. M. Aouadi, E. R. Johnson and A. Martini, ACS Appl. Mater. Interfaces, 2015, 7, 15422–15429 CrossRef CAS PubMed.
- F. G. Sen, A. Kinaci, B. Narayanan, S. K. Gray, M. J. Davis, S. K. R. S. Sankaranarayanan and M. K. Y. Chan, J. Mater. Chem. A, 2015, 3, 18970–18982 RSC.
- G. Kresse and J. Furthmüller, Phys. Rev. B: Condens. Matter Mater. Phys., 1996, 54, 11169–11186 CrossRef CAS PubMed.
- J. P. Perdew, K. Burke and M. Ernzerhof, Phys. Rev. Lett., 1996, 77, 3865–3868 CrossRef CAS PubMed.
- S. L. Dudarev, G. A. Botton, S. Y. Savrasov, C. J. Humphreys and A. P. Sutton, Phys. Rev. B: Condens. Matter Mater. Phys., 1998, 57, 1505–1509 CrossRef CAS.
- A. Singraber, T. Morawietz, J. Behler and C. Dellago, J. Chem. Theory Comput., 2019, 15, 3075–3092 CrossRef CAS PubMed.
- J. Behler and M. Parrinello, Phys. Rev. Lett., 2007, 98, 146401 CrossRef PubMed.
- J. Behler, J. Chem. Phys., 2011, 134, 074106 CrossRef PubMed.
- T. B. Blank and S. D. Brown, J. Chemom., 1994, 8, 391–407 CrossRef CAS.
- A. P. Thompson, H. M. Aktulga, R. Berger, D. S. Bolintineanu, W. M. Brown, P. S. Crozier, P. J. in 't Veld, A. Kohlmeyer, S. G. Moore, T. D. Nguyen, R. Shan, M. J. Stevens, J. Tranchida, C. Trott and S. J. Plimpton, Comput. Phys. Commun., 2022, 271, 108171 CrossRef CAS.
Footnote |
| † Electronic supplementary information (ESI) available. See DOI: https://doi.org/10.1039/d3na01119d |
| This journal is © The Royal Society of Chemistry 2024 |

