 Open Access Article
Bio-inspired copper complexes with Cu2S cores: (solvent) effects on oxygen reduction reactions†
Jordan Manguea,
Iris Wehrungb,
Jacques Pécautc,
Stéphane Ménage a,
Maylis Orio
 *b and
Stéphane Torelli
 *a
*a
aUniv. Grenoble Alpes, CNRS, CEA, IRIG, Laboratoire de Chimie et Biologie des Métaux, 17 rue des Martyrs, 38054 Grenoble Cedex 9, France. E-mail: stephane.torelli@cea.fr
bAix Marseille Univ. Centrale Med., ISM2, Marseille, France. E-mail: maylis.orio@univ-amu.fr
cUniv. Grenoble Alpes, CEA, CNRS, IRIG, SYMMES, UMR 5819, F-38000 Grenoble, France
First published on 23rd August 2024
Abstract
The need for effective alternative energy sources and “green” industrial processes is a more crucial societal topic than ever. In this context, mastering oxygen reduction reactions (ORRs) is a key step to develop fuel cells or to propose alternatives to energy-intensive setups such as the anthraquinone process for hydrogen peroxide production. Achieving this goal using bio-inspired metal complexes based on abundant and non-toxic elements could provide an environmentally friendly option. Given the prevalence of Cu-containing active sites capable of reductive activation of dioxygen in nature, the development of Cu-based catalysts for the ORR thus appears to be a relevant approach. We herein report the preparation, full characterization and (TD)DFT investigation of a new dinuclear mixed-valent copper complex 6 exhibiting a Cu2S core and a bridging triflate anion. Its ORR activity was compared with that of its parent catalyst 1. Two types of solvents were used, acetonitrile and acetone, and various catalyst/Me8Fc (electron source) ratios were tested. Our results highlight a counterintuitive solvent effect for 1 and a drastic drop in the activity for 6 in coordinating acetonitrile together with the modification of its chemical structure.
Introduction
Oxygen reduction reactions (ORRs) involve the reduction of dioxygen (O2) into hydrogen peroxide (O2 + 2e− + 2H+ → H2O2) and water (O2 + 4e− + 4H+ → 2H2O).1 On the one hand, reduction to H2O takes place via conventional fuel cells and is an efficient method for converting chemical energy (stored in the O![[double bond, length as m-dash]](https://www.rsc.org/images/entities/char_e001.gif) O bond) into electrical energy. Unfortunately, the most powerful systems remain those that are based on noble metal-containing architectures.2,3 On the other hand, H2O2 is a well-known reagent (one of the 100 most important chemicals used)4,5 for various industrial purposes (aqueous and organic media). It is applied for water treatment,6 paper bleaching,7 disinfection,8 chips making processes9 and aerospace.10 It is also considered the prototype of green oxidant for organic synthesis.11 More recently, its propensity to be utilized in mono-compartmental fuel cells has emerged.12 The consequence is an increase in the worldwide demand, which should reach 5.7 million tons by 2027.13 More than 95% of the global H2O2 production comes from the so-called anthraquinone (or Riedl-Pfleiderer) process. This method is energy consuming, dangerous (use of H2 and O2, transportation), produces a lot of waste and requires noble-based metal (Pt or Pd) catalysts.14 Thus, it becomes clear that providing efficient, environmentally friendly and on-site selective ORR catalysts is crucial to fulfill future needs and applications. This is particularly the case when considering the use in organic synthesis, which requires “water-free” environments.
O bond) into electrical energy. Unfortunately, the most powerful systems remain those that are based on noble metal-containing architectures.2,3 On the other hand, H2O2 is a well-known reagent (one of the 100 most important chemicals used)4,5 for various industrial purposes (aqueous and organic media). It is applied for water treatment,6 paper bleaching,7 disinfection,8 chips making processes9 and aerospace.10 It is also considered the prototype of green oxidant for organic synthesis.11 More recently, its propensity to be utilized in mono-compartmental fuel cells has emerged.12 The consequence is an increase in the worldwide demand, which should reach 5.7 million tons by 2027.13 More than 95% of the global H2O2 production comes from the so-called anthraquinone (or Riedl-Pfleiderer) process. This method is energy consuming, dangerous (use of H2 and O2, transportation), produces a lot of waste and requires noble-based metal (Pt or Pd) catalysts.14 Thus, it becomes clear that providing efficient, environmentally friendly and on-site selective ORR catalysts is crucial to fulfill future needs and applications. This is particularly the case when considering the use in organic synthesis, which requires “water-free” environments.
O2 activation is one of the most important processes used by nature to fulfill vital metabolic functions; thus, bio-inorganic chemists have investigated this field by means of bio-inspired or biomimetic complexes based on abundant and non-toxic transition metal ions such as Fe and Mn.15 Mono- and dinuclear Cu-containing complexes are also reported for efficient O2 activation.16 When dealing specifically with the ORR, electron supply can be achieved via an electrode. Generally, H2O production is mainly favored.17–23 Extensive and deep mechanistic investigations have provided undeniable insights into the role of the solvent(s) or proton source(s) in the reactivity.24–28 The use of sacrificial chemical electron sources such as ferrocene derivatives is an alternative. In this case, interesting results are obtained even if the activity in terms of turnover frequencies (TOFs) cannot compete with by electrocatalysis. However, H2O2 production can be obtained under given conditions.23,29 In this line, we previously described the unique behavior of the dinuclear mixed valent (MV) complex 1 (Fig. 1),30 which proves to be selective either for H2O2 or H2O depending on the amount of octamethyl or decamethylferrocene (Me8Fc or Me10Fc) present in the medium (acetonitrile). In all cases, reactions are extremely fast when dealing with homogeneous catalysis (TOF ∼10 s−1), with the full consumption of the ferrocene derivative.31
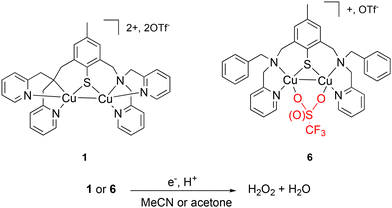 | ||
| Fig. 1 Chemical representations of 1,30 6 and the targeted ORR. | ||
Driven by the hypothesis that the unique reactivity of 1 could be related to its N3S environment and the presence of the Cu–Cu bond, we prepared a new MV copper complex having a N2S motif. This will open the Cu coordination sphere(s) to exogenous ligand(s) such as counter-anions and/or solvent molecules. Consequently, complex 6 featuring a ligated OTf− (OTf− = trifluoromethanesulfonate anion) was isolated and fully characterized. The structural differences between 1 and 6 finally allowed to investigate their abilities for ORR either in non-coordinating acetone or in coordinating acetonitrile (Fig. 1). The results of this work clearly demonstrate the influence of the Cu environment on the reactivity in terms of selectivity, kinetics and solvent tolerance of the reaction.
Results and discussion
Preparation and characterization of 6
The synthesis of the (BAMP)2S–S ligand (Fig. 2 and ESI† for experimental details) slightly differs from the ones we already reported for the preparation of other disulfide-containing derivatives.30,32 This time, the deprotection of the key methyl-diformyl-S-thiocarbamate precursor (I) was achieved under mild conditions (1 M NaOH instead of LiAlH4 or concentrated KOH and heating), and dimerization into the disulfide was performed using iodine. Subsequent reductive amination with [(benzyl-amino)methyl]pyridine and sodium triacetoxyborohydride finally gave the title ligand. Metalation with four molar eq. of [Cu(CH3CN)4](OTf) in acetone resulted in the isolation of 6 as a dark purple solid.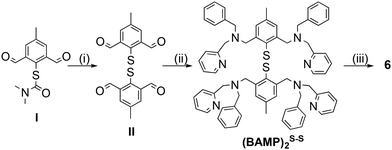 | ||
| Fig. 2 Preparation of the (BAMP)2S–S ligand from (I)30 and metalation into 6. | ||
The ESI-MS of 6 in acetone (Fig. S1, ESI†) displays isotopic patterns at m/z = 671.1, 820.0 and 968.9 corresponding to mono-charged ions ([BAMPS + 2Cu]+, [BAMPS + 2Cu + 1OTf]+, and [BAMPS + 2Cu + 2OTf]+, respectively) that attest to the presence of the Cu2S core as well as the integrity of the ligand. Crystals suitable for X-ray analysis were obtained upon layering pentane upon an acetone solution of the complex. As already observed for other members of the series,30,32,33 the reductive cleavage of the S–S bond occurs and leads to the formation of a MV(II,I) dinuclear species (Fig. 3). Both metal centers are pentacoordinated by the N/S atoms from the ligand, an O-atom from a triflate anion and the neighboring Cu. The Cu1–O1S2 = 2.176 (2) Å and Cu2–O2S2 = 2.674 (9) Å bond distances clearly indicate a weak bridging interaction. A Cu–Cu bond of 2.5475(5) Å length is present and will be further confirmed by theoretical calculations. When comparing 6 with 1 and focusing on the Cu2S core, the metrics are relatively close with Cu1–Cu2 = 2.5762(12), Cu1–S = 2.177(2) and Cu2–S = 2.193(2) for the latter.
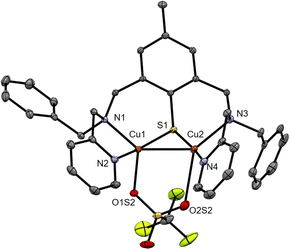 | ||
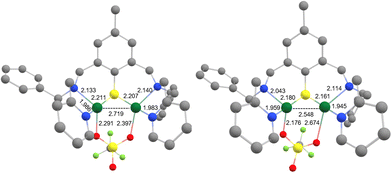
| Fig. 3 ORTEP diagram (30% probability) for the dicationic unit of 6. H-atoms are omitted for clarity. Selected bond distances (Å): Cu1–Cu2 2.5475(5), Cu1–S1 2.1798(8), Cu2–S1 2.1661(8), Cu1–N1 2.043(2), Cu1–N2 1.959(3), Cu1–O1S2 2.176(2), Cu2–N3 2.114(3), Cu2–N4 1.945(3), Cu2–O2S2 2.674(9); see Tables S1–S3, ESI.† | ||
Density functional theory (DFT) calculations were then performed to investigate the structure and properties of 6 and support the experimental findings. The complex was first subjected to geometry optimization in implicit solvent for comparison with the solid-state structure (Fig. 4). The main result is that the integrity of the structure is retained. The computed Cu1–S1, Cu2–S1, Cu1–N1, Cu1–N2, Cu2–N3 and Cu2–N4 bond distances of 2.211, 2.207, 2.133, 1.986, 2.140 and 1.983 Å indeed fall in the range of the experimental ones. Looking more specifically at the Cu1–Cu2 motif, a deviation between the computed (2.719 Å) and the experimental (2.5475(5) Å) metal–metal bond distance is observed. Finally, a significant shortening of one of the two Cu–OTf bonds (from 2.674(9) to 2.397 Å) was obtained, which somehow rendered the binding mode of the OTf anion more symmetrical. This can be tentatively attributed to the relaxation of the complex upon geometry optimization in the solvated medium, as opposed to the frozen X-ray (solid-state) structure. This finding suggests that particular attention will have to be paid when conducting the computational modeling since it may have repercussions on the calculated (UV-Vis/NIR, EPR and redox) properties.
Insights into the Cu–Cu bond is obtained by Natural Bond Order (NBO) analysis using the DFT-optimized structure of 6 (Fig. S2 and Table S4, ESI†). The calculated Wiberg bond index of 0.54 compares quite well with the one obtained for 1 (0.40), thus supporting the presence of a metal–metal bond. The relevant occupied natural orbital representing this Cu–Cu motif corresponds to a σ (4p 3d/4p 3d) overlap between the two metal centers. Note that a similar orbital was also found from calculations using the X-ray crystal structure, featuring a shorter Cu–Cu distance of 2.5475(5) Å (Fig. S3 and Table S4, ESI†). Electronic structure calculations using the DFT-optimized structure of 6 provide a singly occupied molecular orbital (SOMO) that is predominantly metal-based and features 30, 27 and 20% contributions from the Cu1, Cu2 and S centers, respectively (Fig. S4, ESI†). Mulliken population analysis (Fig. S4 and Table S5, ESI†) shows that the spin density is equally distributed between the two copper centers and the coordinating sulfur, which strongly suggests that 6 is a fully delocalized (Cu1.5Cu1.5) MV species.
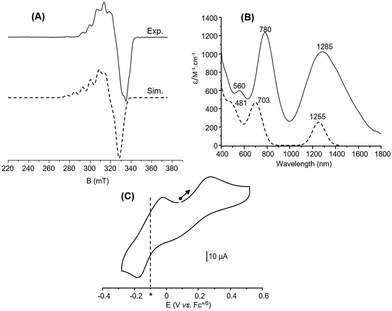
The electronic properties of 6 were then investigated in acetone. The X-band EPR spectrum recorded at 10 K (Fig. 5(A)) exhibits a complicated multiline pattern, as already observed for 1 and attributed to a (Cu1.5Cu1.5) MV state. This is further confirmed since the simulated spectrum (Fig. 5(A)) using the computed parameters obtained with the DFT-optimized structure with a fully delocalized valence (Table S6, ESI†) adequately reproduces the main experimental features. In the same vein, the UV-Vis/NIR absorption spectrum (Fig. 5(B)) displays intense and well-defined absorption bands resembling those of 1 in acetone. The near-infrared feature at 1285 nm (ε = 1025 M−1 cm−1) is thus assigned to an intervalence charge transfer transition (IVCT) and the others at 780 nm (ε = 1245 M−1 cm−1) and 560 nm (ε = 605 M−1 cm−1) to ligand-to-metal charge transfer (LMCT) transitions. These attributions are corroborated by TD-DFT calculations since three main absorption bands at 481 nm, 703 nm and 1255 nm are indeed obtained (Fig. 5(B), Fig. S5 and Table S7, ESI†).
Interestingly, the TD-DFT-computed UV-Vis/NIR spectrum using the X-ray crystal structure (Fig. S6 and Table S8, ESI†) exhibits two main absorption bands at 1007 nm and 613 nm. Although far from the experimental values, these signatures are, however, similar to those obtained when recording the solid-state spectrum of 6 diluted in BaSO4 (Fig. S6, ESI†) with bands at 1005 nm and 605 nm. This result reinforces the finding that solvation has repercussions on the electronic structure of the complex once solubilized.
Finally, the CV curve displays two distinct redox processes (Fig. 5(C)) when starting at the open-circuit potential (OCP) towards the anodic direction. The first one at Epa = 0.27 V vs. Fc+/0 is irreversible and attributed to CuIICuI → CuIICuII. The second one observed at −0.10 V vs. Fc+/0 (Epa = −0.02 V, Epc = −0.18 V, ΔEp = 0.16 V) is quasi reversible and corresponds to CuIICuI → CuICuI. DFT calculations (optimized structure) provide a computed redox potential of −0.102 V vs. Fc+/0 for the cathodic region that matches the experimental data (Tables S9 and S10, ESI†) and support the above assignment. The irreversibility of the anodic part clearly indicates structural changes at the metal coordination sphere(s) that stabilizes the in situ generated dicopper(II) state. No noticeable changes occur on the reversibility when performing a CV scan towards the cathodic direction from the OCP (Fig. S7, ESI†) One can note that a reversible oxidation process was on the contrary evidenced for 1.
Altogether, this set of experimental and theoretical data is in favor of the structure of 6 being retained in acetone. What also emerges and needs to be emphasized is that the DFT-optimized structure is here perfectly adapted to describe the conformation and the electronic properties of 6 in solution.
Catalytic O2 reduction by 1 and 6 with Me8Fc and lutidinium tetrafluoroborate (LutH)
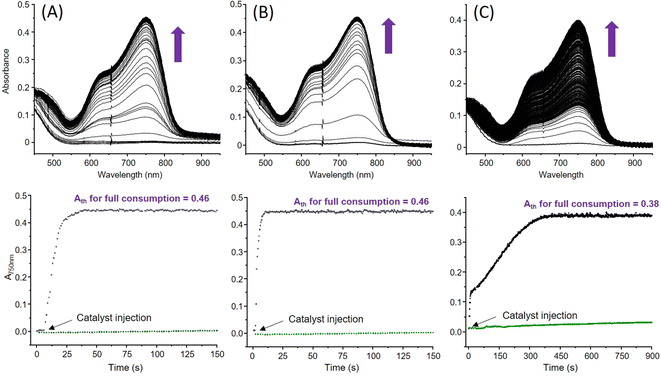
We already showed that 1 is capable of ORR in coordinating MeCN, its structure being maintained in this solvent as it is in non-coordinating acetone.31 Selectivity (H2O2 vs. H2O) is achieved by controlling the relative excess of the sacrificial electron source (Me8Fc) compared to the Cu catalyst in the presence of lutidinium tetrafluoroborate (LutH) as the chemically innocent proton source. With 6 in hand and its coordination sphere slightly different from that of 1, comparing the ORR abilities of both catalysts in MeCN or acetone could provide insights into the parameters at stake for orienting the selectivity. The experimental conditions are the same as those already used for 1 in MeCN. First, the ORR activity of 1 in acetone was investigated. The results (Table 1 and Table S11, ESI†) indicate, as already observed in MeCN, that Me8Fc is entirely consumed for each condition since the expected absorbance values for full Me8Fc+ accumulation at λmaxMe8Fc+ = 750 nm (ε = 460 M−1 cm−1 in acetone) are experimentally obtained (Fig. 6(A) and Fig. S8(A)–S10, ESI†). Interestingly, the kinetics are longer compared to those previously determined in MeCN. Considering that coordinating solvents such as MeCN usually slow down the reactivity, this quite counterintuitive result could indicate that no labile position(s) are available for MeCN at the metal coordination sphere(s) during catalysis.| Entry | [Me8Fc] (mM) | Cat/e−/H+ | TON | TONmax | kobs (s−1) | t (s) | % H2O2 Me8Fc | % H2O Me8Fc | TOFb (s−1) |
|---|---|---|---|---|---|---|---|---|---|
| a After 6000 s reaction time; nd: not determined.b Determined for the first kinetic event in the case of multi regimes. | |||||||||
| 1 in MeCN31 | 0.5 | 1/10/400 | 10 | 10 | 1.06 ± 0.02 | 4.1 ± 0.2 | 90 | 10 | 5.3 ± 0.3 |
| 3.0 | 1/60/400 | 60 | 60 | 0.13 ± 0.01 | 28.1 ± 0.5 | 51 | 49 | 8.3 ± 0.3 | |
| 5.0 | 1/100/400 | 100 | 100 | 0.12 ± 0.01 | 41.2 ± 2 | 10 | 90 | 14.1 ± 0.4 | |
| 1 in acetone | 0.5 | 1/10/400 | 10 | 10 | 0.30 ± 0.05 | 22.0 ± 0.8 | 70 | 30 | 1.5 ± 0.2 |
| 3.0 | 1/60/400 | 60 | 60 | 0.05 ± 0.004 | 91 ± 4 | 31 | 69 | 1.9 ± 0.2 | |
| 5.0 | 1/100/400 | 100 | 100 | 0.10 ± 0.02 | 268 ± 10 | 20 | 80 | 2.7 ± 0.4 | |
| 0.014 ± 0.009 | |||||||||
| 6 in acetone | 0.5 | 1/10/400 | 10 | 10 | 0.51 ± 0.01 | 11.2 ± 0.9 | 42 | 54 | 3.1 ± 0.2 |
| 3.0 | 1/60/400 | 60 | 60 | 0.40 ± 0.004 | 15.1 ± 1.2 | 11 | 89 | 10.6 ± 0.4 | |
| 5.0 | 1/100/400 | 100 | 100 | 0.46 ± 0.006 | 15.5 ± 1.3 | 5 | 95 | 17.6 ± 0.2 | |
| 6 in MeCN | 0.5 | 1/10/400 | 10 | 10 | 0.51 ± 0.05 | 340 ± 30 | 34 | 66 | <1 |
| 89.9 ± 8 | |||||||||
| 3.0 | 1/60/400 | 50a | 60 | nd | >6000 | nd | nd | nd | |
| 5.0 | 1/100/400 | 40a | 100 | nd | >6000 | nd | nd | nd | |
In large Me8Fc excess, a model with two kobs values is required, suggesting chemical changes at the catalyst with time in the reaction mixture that also contains accumulated O2-reduced species. Second, the ORR activity of 6 was studied in MeCN (λmaxMe8Fc+ = 750 nm, ε = 390 M−1 cm−1) and acetone (Fig. 6(B) and (C)). In acetone, full Me8Fc consumption also occurs (Table 1, Fig. S8(B), S11–12 and Table S11, ESI†). The reaction rates and times are roughly independent of [Me8Fc]. An average value of 14 s is calculated that makes 6 slower than 1 at low Me8Fc concentrations (i.e., from 1/10/400 to 1/40/400, Cat/Me8Fc/LutH, Table S11, ESI†) but more efficient at high Me8Fc concentrations (i.e., from 1/60/400, Cat/Me8Fc/LutH, Table S11, ESI†). A drastic change is observed in MeCN (Table 1, Fig. S8(C), S13–S14 and Table S11, ESI†); though the reaction is complete up to 40 molar eq. of Me8Fc within a longer but still acceptable timescale, very slow kinetics are obtained from 60 molar eq. to 100 molar eq. In these cases, the TONmax values are not even reach after 6000 s. This time, all the kinetic traces clearly indicate two different regimes: a “fast” one and a second slower one, suggesting that the catalyst evolves during the reaction towards a less reactive species (slow poisoning). One can also note that a factor of 10 for the reaction time is obtained between 20 molar eq. and 40 molar eq. Considering all these kinetic data, one might also note a rather unexpected trend for the kobs values for 1 that decrease when increasing the amount of Me8Fc. This negative order has to be opposed to the zero-order obtained for 6 in acetone (reactivity independent of [Me8Fc]). The former may correlate with a less efficient outer sphere electron transfer (steric hindrance at the metal centre(s)) that retard the reactivity, as already invoked for the dinuclear Mn species.34 Then, the selectivity of both complexes was evaluated via H2O2 titration (Tables S1 and S11, ESI†) with a dedicated Ti-based porphyrin (Fig. S15, ESI†).35,36 In acetone, 1 mainly produced H2O2 when using low Me8Fc loadings, as already observed in MeCN. In acetone, 6 is rather unselective at low [Me8Fc] compared to 1, as it is the case when switching to MeCN (34% maximum). For both complexes, H2O remains the main product for large Me8Fc excess. Finally, looking at the TOFs, values between 1.5 s−1 and 17.6 s−1 are obtained at best. This result is rather modest compared to the huge efficiency usually obtained under homogeneous electrocatalytic conditions for the reported copper complexes25,28,37–40 and in the same range as those reported by Fukuzumi with stopped-flow experiments for the study of the well-known mononuclear [(tmpa)(CuII)](ClO4)2 species.17
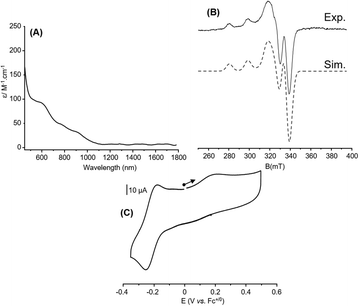
The behavior observed for 6 in MeCN urged us to probe its chemical structure in this solvent for comparison with acetone. Noticeable changes occur on the UV-Vis/NIR and EPR spectra as well as on the CV curve (Fig. 7). The well-defined and intense absorption bands observed in acetone gave way to a featureless spectrum with no band in the NIR region, which suggests a change in the valence state from mixed to localized (Fig. 7(A)). This is in line with the EPR spectrum that becomes characteristic of a mononuclear Cu(II) complex with axial symmetry (four lines pattern; ICu = 3/2, 2nI + 1 = 4 with n = 1, Fig. 7(B)). Finally, even if the CV (Fig. 7(C)) curve resembles the one recorded in acetone, a non-negligible cathodic shift occurs for the CuIICuI → CuICuI process from −0.10 V to −0.22 V vs. Fc+/0 (Epa = −0.18 V, Epc = −0.26 V, ΔEp = 0.08 V) and a slight one (0.05 V) is detected for CuIICuI → CuIICuII (from Epa = 0.27 V vs. Fc+/0 to Epa = 0.22) that remains irreversible. The important result here is that the CuIICuI → CuICuI event remains accessible by Me8Fc to perform ORR. As observed in acetone, a similar CV curve is obtained when scanning towards the cathodic region (Fig. S16, ESI†). Additionally, the smaller ΔEp in MeCN (70 mV to 90 mV) compared to that observed in acetone (130 mV to 180 mV) for this scan rate-dependent redox event (Fig. S15 in the ESI†) also points out different electron transfer efficiencies, which could have consequences on the activity. Electron self-exchange rate constants for 6 in both solvents were consequently determined by means of CV experiments (Fig. S17 and S18, ESI†). kel values of 1.5(1) × 10−3 cm s−1 and 1.1(1) × 10−2 cm s−1 (or estimated as khom = 2.3(2) × 105 L mol−1 s−1 and 1.67(6) × 106 L mol−1 s−1) were obtained in acetone and MeCN, respectively, indicating a faster electron transfer in MeCN, consistent with the ΔEp values. This result also suggests that this parameter is not directly related to the trend observed for ORR and the kobs values. Given these preliminary data, it is clear that 6 exists at different valence states/chemical structures when solvated in acetone or MeCN. These changes have sufficient repercussions on the nature of the coordination sphere and the electronics so that the ORR activity is affected in terms of kinetics and/or selectivity. Indeed, for the 1/40/400 condition, 6 turns to be 250 times faster in acetone compared to MeCN (13.8 s vs. 3500 s for full Me8Fc consumption, Table S11 in the ESI†).
Conclusion
To conclude, we report here the preparation, full characterization and ORR activity of a new MV dicopper complex 6 that is compared to its parent catalyst 1. Both complexes contain a Cu2S MV core but differ by the number of coordinating atoms from the ligands. In the case of 6, this leads to the presence of potentially exchangeable position(s). Theoretical investigations demonstrate in detail that special attention must be paid to the use of an optimized vs. X-ray structure to probe the electronic properties. In our case, the former is more suitable. From a reactivity point of view, significant differences in the kinetics and selectivity for ORR (kobs and reaction times) are obtained. 1 remains the most selective catalyst since the control of the amount of the sacrificial electron source allows to swing from H2O2 to H2O as the main product. 6 does not exhibit such a pronounced selectivity but appears to be the fastest in acetone. Comparatively, its reactivity in MeCN is rather poor. Interestingly, the data also suggest different reaction orders in Me8Fc depending on the catalyst. We tentatively correlate this output with differences in the outer sphere electron transfer efficiencies linked to the steric hindrance around the metal ions either during the CuIICuII reduction or for the reduction of the corresponding O2-adducts. Work including the determination of the rate-limiting step is currently under progress to clarify this point as we also continue to study in detail the structural changes resulting from the solvation of 6 in MeCN in order to understand its inefficiency for ORR. Post-catalysis verification that the catalyst(s) are still intact still needs to be optimized since analysis on the crude mixtures are plagued by the presence of Me8Fc+, LutH and Lut in large excess that preclude any unambiguous EPR, CV or NMR studies. This may lead to new architectures and exploration of the ORR activity of such Cu2S cores through the prism of the structure–activity relationship that undoubtedly correlates with the fate of the Cu2/O2 adduct(s) intermediates formed in the reaction medium.Author contributions
Stéphane Torelli and Maylis Orio designed this research and wrote the paper. Jordan Mangue, Jacques Pécaut and Stéphane Torelli performed all the syntheses, characterizations and catalytic studies. Iris Wehrung and Maylis Orio conducted the theoretical calculations. Stephane Torelli, Maylis Orio and Stéphane Ménage discussed this work. All authors have given approval to the final version of the manuscript.Data availability
The data supporting this article have been included as part of the ESI.†Crystallographic data for 6 and II have been deposited at the CCDC under 2347081 and 2347077.†
Conflicts of interest
There are no conflicts to declare.Acknowledgements
This work was supported by the French National Agency for Research (Labex ARCANE, CBH-EUR-GS, ANR-17-EURE-0003).References
- M. L. Pegis, C. F. Wise, D. J. Martin and J. M. Mayer, Chem. Rev., 2018, 118, 2340–2391 CrossRef CAS PubMed.
- X. Wang, Z. Li, Y. Qu, T. Yuan, W. Wang, Y. Wu and Y. Li, Chem, 2019, 5, 1486–1511 CAS.
- J. Zhao, C. Fu, K. Ye, Z. Liang, F. Jiang, S. Shen, X. Zhao, L. Ma, Z. Shadike, X. Wang, J. Zhang and K. Jiang, Nat. Commun., 2022, 13, 685 CrossRef CAS PubMed.
- R. L. Myers, The most 100 Most Important Chemical Compounds, Greenwood Press, London, 2007 Search PubMed.
- J. M. Campos-Martin, G. Blanco-Brieva and J. L. G. Fierro, Angew. Chem., Int. Ed., 2006, 45, 6962–6984 CrossRef CAS PubMed.
- C. Chu, Z. Chen, D. Yao, X. Liu, M. Cai and S. Mao, Angew. Chem., Int. Ed., 2024, 63, e202317214 CrossRef CAS PubMed.
- A. Walawska, M. Olak-Kucharczyk, A. Kaczmarek and M. H. Kudzin, Materials, 2024, 17, 1355 CrossRef CAS PubMed.
- A. Ayub, Y. K. Cheong, J. C. Castro, O. Cumberlege and A. Chrysanthou, Bioengineering, 2024, 11, 205 CrossRef CAS PubMed.
- M. McKoy, C&EN, 2017, 95(40), 32–33 Search PubMed.
- L. Wang, J. Zhang, Y. Zhang, H. Yu, Y. Qu and J. Yu, Small, 2022, 18, e2104561 CrossRef PubMed.
- E. T. Poursaitidis, P. L. Gkizis, I. Triandafillidi and C. G. Kokotos, Chem. Sci., 2024, 15, 1177–1203 RSC.
- S. Jeon, H. An and Y. Chung, Sustainable Energy Fuels, 2022, 6, 841–850 RSC.
- M. Melchionna and P. Fornasiero, Chem, 2019, 5, 1927–1928 CAS.
- R. Ciriminna and L. Albanese, ChemSusChem, 2016, 9, 3374–3381 CrossRef CAS PubMed.
- T. Devi, Y.-M. Lee, W. Nam and S. Fukuzumi, Coord. Chem. Rev., 2020, 410, 213219 CrossRef CAS.
- C. E. Elwell, N. L. Gagnon, B. D. Neisen, D. Dhar, A. D. Spaeth, G. M. Yee and W. B. Tolman, Chem. Rev., 2017, 117, 2059–2107 CrossRef CAS PubMed.
- S. Fukuzumi, H. Kotani, H. R. Lucas, K. Doi, T. Suenobu, R. L. Peterson and K. D. Karlin, J. Am. Chem. Soc., 2010, 132, 6874 CrossRef CAS PubMed.
- S. Kakuda, R. L. Peterson, K. Ohkubo, K. D. Karlin and S. Fukuzumi, J. Am. Chem. Soc., 2013, 135, 6513 CrossRef CAS PubMed.
- M. Langerman and D. G. H. Hetterscheid, Angew. Chem., Int. Ed., 2019, 58, 12974–12978 CrossRef CAS PubMed.
- H. Kotani, T. Yagi, T. Ishizuka and T. Kojima, Chem. Commun., 2015, 51, 13385–13388 RSC.
- S. N. Chowdhury, S. Biswas, P. Das, S. Paul and A. N. Biswas, Inorg. Chem., 2020, 59, 14012–14022 CrossRef CAS PubMed.
- S. Kakuda, C. J. Rolle, K. Ohkubo, M. A. Siegler, K. D. Karlin and S. Fukuzumi, J. Am. Chem. Soc., 2015, 137, 3330–3337 CrossRef CAS PubMed.
- D. Das, Y.-M. Lee, K. Ohkubo, W. Nam, K. D. Karlin and S. Fukuzumi, J. Am. Chem. Soc., 2013, 135, 2825–2834 CrossRef CAS PubMed.
- S. N. Chowdhury, S. Biswas, S. Das and A. N. Biswas, Dalton Trans., 2023, 52, 11581–11590 RSC.
- M. Langerman, M. van Dorth and D. G. H. Hetterscheid, Eur. J. Inorg. Chem., 2023, 26, e202300218 CrossRef CAS.
- N. W. G. Smits, D. Rademaker, A. I. Konovalov, M. A. Siegler and D. G. H. Hetterscheid, Dalton Trans., 2022, 51, 1206–1215 RSC.
- S. D'Agostini, K. G. Kottrup, C. Casadevall, I. Gamba, V. Dantignana, A. Bucci, M. Costas, J. Lloret-Fillol and D. G. H. Hetterscheid, ACS Catal., 2021, 11, 2583–2595 CrossRef PubMed.
- N. W. G. Smits, B. van Dijk, I. de Bruin, S. L. T. Groeneveld, M. A. Siegler and D. G. H. Hetterscheid, Inorg. Chem., 2020, 59, 16398–16409 CrossRef CAS PubMed.
- S. Fukuzumi, L. Tahsini, Y.-M. Lee, K. Ohkubo, W. Nam and K. D. Karlin, J. Am. Chem. Soc., 2012, 134, 7025–7035 CrossRef CAS PubMed.
- S. Torelli, M. Orio, J. Pécaut, H. Jamet, L. Le Pape and S. Ménage, Angew. Chem., Int. Ed., 2010, 49, 8249–8252 CrossRef CAS PubMed.
- J. Mangue, C. Gondre, J. Pécaut, C. Duboc, S. Ménage and S. Torelli, Chem. Commun., 2020, 56, 9636–9639 RSC.
- C. Esmieu, M. Orio, S. Torelli, L. Le Pape, J. Pecaut, C. Lebrun and S. Menage, Chem. Sci., 2014, 5, 4774–4784 RSC.
- C. Esmieu, M. Orio, J. Mangue, J. Pecaut, S. Menage and S. Torelli, Chem. – Eur. J., 2018, 24, 5060–5063 CrossRef CAS PubMed.
- M. Gennari, D. Brazzolotto, J. Pécaut, M. V. Cherrier, C. J. Pollock, S. DeBeer, M. Retegan, D. A. Pantazis, F. Neese, M. Rouzières, R. Clérac and C. Duboc, J. Am. Chem. Soc., 2015, 137, 8644–8653 CrossRef CAS PubMed.
- C. Matsubara, N. Kawamoto and K. Takamura, Analyst, 1992, 117, 1781–1784 RSC.
- K. Takamura, C. Matsubara and T. Matsumoto, Anal. Sci., 2008, 24, 401–404 CrossRef CAS PubMed.
- M. L. Skavenborg, M. S. Møller, C. J. Miller, J. Hjelm, T. D. Waite and C. J. McKenzie, Inorg. Chem., 2023, 62, 18219–18227 CrossRef CAS PubMed.
- C. J. M. van der Ham, D. N. H. Zwagerman, L. Wu, J. P. Hofmann and D. G. H. Hetterscheid, ChemElectroChem, 2022, 9, e202101365 CrossRef CAS PubMed.
- B. van Dijk, J. P. Hofmann and D. G. H. Hetterscheid, Phys. Chem. Chem. Phys., 2018, 20, 19625–19634 RSC.
- M. L. Pegis, B. A. McKeown, N. Kumar, K. Lang, D. J. Wasylenko, X. P. Zhang, S. Raugei and J. M. Mayer, ACS Cent. Sci., 2016, 2, 850–856 CrossRef CAS PubMed.
Footnote |
| † Electronic supplementary information (ESI) available: Experimental and computational details and reactivity details. CCDC 2347077 and 2347081. For ESI and crystallographic data in CIF or other electronic format see DOI: https://doi.org/10.1039/d4dt01629g |
| This journal is © The Royal Society of Chemistry 2024 |

