 Open Access Article
Single photon double and triple ionization of allene†
Veronica
Ideböhn
a,
Alistair J.
Sterling
 b,
Måns
Wallner
a,
Emelie
Olsson
a,
Richard J.
Squibb
a,
Ugne
Miniotaite
c,
Emma
Forsmalm
a,
Malin
Forsmalm
a,
Stefano
Stranges
 de,
John M.
Dyke
 f,
Fernanda
Duarte
 b,
John H. D.
Eland
g and
Raimund
Feifel
 *a
*a
aDepartment of Physics, University of Gothenburg, Origovägen 6B, 412 58 Gothenburg, Sweden. E-mail: raimund.feifel@physics.gu.se
bDepartment of Chemistry, Chemistry Research Laboratory, Mansfield Road, Oxford OX1 3TA, UK
cDepartment of Physics, Chalmers University of Technology, Kemigården 1, 412 96 Gothenburg, Sweden
dIOM-CNR Tasc, SS-14, Km 163.5 Area Science Park, Basovizza 34149, Trieste, Italy
eDipartimento di Chimica e Tecnologie del Farmaco, Universitá Sapienza, Rome I-00185, Italy
fSchool of Chemistry, University of Southampton, Highfield, Southampton SO17 1BJ, UK
gDepartment of Chemistry, Physical and Theoretical Chemistry Laboratory, Oxford University, South Parks Road, Oxford OX1 3QZ, UK
First published on 9th December 2021
Abstract
Double and triple ionization of allene are investigated using electron–electron, ion–ion, electron–electron–ion and electron–electron–ion–ion (ee, ii, eei, eeii) coincidence spectroscopies at selected photon energies. The results provide supporting evidence for a previously proposed roaming mechanism in H3+ formation by double ionization. The lowest vertical double ionization energy is found to be 27.9 eV, while adiabatic double ionization is not accessed by vertical ionization at the neutral geometry. The triple ionization energy is found to be close to 50 eV in agreement with theoretical predictions. The doubly charged parent ion is stable up to about 2 eV above the threshold, after which dissociations by charge separation and by double charge retention occur with comparable intensities. Fragmentation to H+ + C3H3+ starts immediately above the threshold as a slow (metastable) decay with 130.5 ± 9.9 ns mean lifetime.
1 Introduction
Allene (propadiene, C3H4, CH2![[double bond, length as m-dash]](https://www.rsc.org/images/entities/char_e001.gif) C
C![[double bond, length as m-dash]](https://www.rsc.org/images/entities/char_e001.gif) CH2) is the prototypical and first member of the group of molecules called cumulenes. It is thought to be present in the interstellar medium1,2 at least as an intermediate, but as it lacks a dipole moment it has not yet been detected there directly. It is closely related to the important transient molecule ketene (CH2
CH2) is the prototypical and first member of the group of molecules called cumulenes. It is thought to be present in the interstellar medium1,2 at least as an intermediate, but as it lacks a dipole moment it has not yet been detected there directly. It is closely related to the important transient molecule ketene (CH2![[double bond, length as m-dash]](https://www.rsc.org/images/entities/char_e001.gif) C
C![[double bond, length as m-dash]](https://www.rsc.org/images/entities/char_e001.gif) CO) which has been detected in the interstellar medium.3 This paper will report on single-photon double and triple ionization of allene, as well as on allene's dissociation pathways.
CO) which has been detected in the interstellar medium.3 This paper will report on single-photon double and triple ionization of allene, as well as on allene's dissociation pathways.
The single ionization of allene and its consequent dissociations have been studied using mass spectrometry,4 photoelectron spectroscopy5–7 and photoelectron–photoion coincidence spectroscopy.8 The electronic structure of the singly charged molecule has recently attracted theoretical interest, focusing on “Möbius” and “helical” frontier orbitals peculiar to cumulenes.9–11
Much less is known about multiple ionization of allene, but double and triple ionization of the molecule have both been examined in experiments using the electron capture charge exchange technique,12,13 where the lowest vertical double ionization energy to the expected ground-state triplet dication was determined as 28.2 ± 0.3 eV. Allene double ionization and the rates of its dissociation reactions have also been examined using multi photon ionization with femtosecond infrared (IR) laser pulses.14,15 In these and other previous studies of allene double ionization, dissociation producing H3+ ions has been found, surprisingly, to be more abundant than from molecules where three hydrogen atoms are initially contiguous in – CH3 groups. The mechanism was interpreted in the cases of H3+ formation from a series of hydrocarbon molecules with no methyl group, including allene, as involving a “roaming” mechanism where a neutral H2 is partially detached from the residual C3H22+ fragment, after which a proton is transferred from the fragment dication to form the H3+ ion,16,17 in line with the theoretical work of Mebel and Bandrauk.18 The creation of H3+ is found to be a significant dissociation mechanisms for doubly charged allene, and must at minimum include the migration of one hydrogen atom14,18 and possibly more extensive rearrangement. A number of experiments probing this mechanism, mainly by IR multi-photon ionization in different molecules (mostly methanol) followed.19 Calculations on methanol indicate that the formation of H3+ competes with that of H2+ on a sub-100 fs time scale.19 In the present work we examine both H2+ and H3+ detected in correlation with the electrons involved in the creation of the nascent allene dications which dissociate to form them.
Our study was carried out using electron–electron (ee) coincidence measurements at photon energies above and below the C1s ionization thresholds (approximately 291 eV), and electron–electron–ion (eei) as well as electron–electron–ion–ion (eeii) coincidence measurements at 40.8 eV photon energy. These measurements determine the spectra of states of nascent doubly ionised allene, and the spectra coincident with undissociated parent dications as well as each set of dissociation products. Photoionization mass spectra were also measured at all photon energies and ion–ion coincidence maps were taken to identify the decay pathways and clarify the mechanisms. The spectra and dissociation pathways are discussed and interpreted with the help of quantum chemical calculations carried out by ourselves. They are also compared with calculations available in the literature.18
2 Experimental methods
The experiments were carried out in our laboratory at the University of Gothenburg and at the synchrotron radiation facility BESSY-II of the Helmholtz Zentrum für Materialien in Berlin. In both cases, the target gas was let into the spectrometer using a hollow needle to create an effusive gas beam in the interaction region. The basic configuration of our system, which builds on a more compact version of the original magnetic bottle electronic spectrometet (MBES) instrument of this type,20 comprises a strong conical magnet with a divergent field of approximately 1 T at the light–matter interaction point and a 2 m flight tube surrounded by a weak homogeneous solenoid field (few mT). At the end of the flight tube, electrons are registered by a multi-channel plate (MCP) detector, making the overall collection-detection efficiency of this MBES for low energy (<ca. 400 eV) electrons about 50–60%. The electron energy resolution of the set-up is Ekin/ΔEkin ∼ 50 when collecting only electrons. For collection of both electrons and ions the strong conical magnet is replaced by a hollow ring magnet with a weaker magnetic field in the interaction zone, which limits the electron energy resolution to Ekin/ΔEkin ∼ 20, but with the benefit that ions can be extracted in the opposite direction.21,22 In this latter configuration, electron–ion coincidence data are obtained by first letting the electrons leave the interaction region, before accelerating the ions in the opposite direction, through the ring magnet and into a time of flight mass spectrometer with a 0.12 m long flight tube. The electric fields are optimized to achieve time focus conditions, giving a numerical resolving power for thermal ions of about 25. Under these conditions peaks in the parent ion group are only partially resolved. Complementary non-pulsed ion-only measurements were carried out with the magnetic bottle in its basic configuration by using the 2 m long flight tube for ions instead of electrons, and similar measurements were made using the shorter flight tube to capture processes on shorter time scales. With the longer flight path the numerical mass resolving power, m/Δm, was about 50, sufficient to resolve all the main ion peaks.In the Gothenburg laboratory, a pulsed helium gas discharge lamp with a repetition rate of approximately 4 kHz was used as ionization source where the atomic emission lines of HeIα and HeIIα provided photon energies of 21.2 and 40.8 eV, respectively. The discrete energies were selected using a monochromator based on an ellipsoidal grating of 550 lines mm−1 groove density which also focuses the radiation of a selected wavelength into the interaction region.
The flight times of the electrons were converted to kinetic energies on the basis of a calibration derived from measurements of known photoelectron and Auger electron spectra. For calibration in the low electron kinetic energy region we used the photoelectron spectra of molecular oxygen at 21.2 and 40.8 eV photon energy, and for higher energies the spectra of atomic argon and krypton at photon energies of 100 eV and above.
At BESSY-II, the experimental set-up was mounted on undulator beamline UE52/SGM where the photon energy can be tuned in the extreme ultraviolet and soft X-ray energy region. In order to doubly ionise allene through valence–valence, core–Auger and core–valence electron removal photon energies of 100 eV, 110 eV, 300.5 eV and 350.4 eV were used. The set up was essentially the same as in Gothenburg without the He lamp but with the addition of a mechanical chopper synchronized to the radio frequency signal of the storage ring operating in single bunch mode.23 The chopper was set to increase the time interval between photon bunches passed to the experiment (otherwise 800.5 ns) to between 10 and 100 μs, to allow detection of electrons and ions without interference from subsequent radiation pulses during their expected maximum flight times. The stated purity of the sample was ≥95%. This was verified by on-line valence and core level photoelectron spectroscopy and mass spectroscopy which showed no impurity lines.
3 Theoretical methods
Allene in its neutral form, C3H4, has 22 electrons (3 × 1s22s22p2 from the C atoms, 4 × 1s1 from the H atoms) and its ground state has a D2d geometry. The outermost electronic configuration is—3b221e42e4, which, in a simplified picture, can be viewed as derived from the 2p2 electrons of each carbon and the 1s1 electrons of each H atom.24 The 2e and 1e orbitals are π orbitals and the 3b2 orbital is a σ orbital. Removal of two electrons from the outermost 2e orbital gives rise to four states: 3A2, 1A1, 1B1 and 1B2. The lowest energy singlet state (1A1) of allene2+ undergoes a geometric distortion (D2d → D2h) to remove orbital degeneracy (see Fig. 1 and ESI†). Vertical ionization energies to these (2e)−2 states were calculated as the difference in total energies of the neutral and dicationic states at the optimised neutral ground state geometry of allene. Adiabatic ionization energies were calculated as the difference in the electronic energies of the neutral and dicationic states, each at their optimised geometry (see ESI†).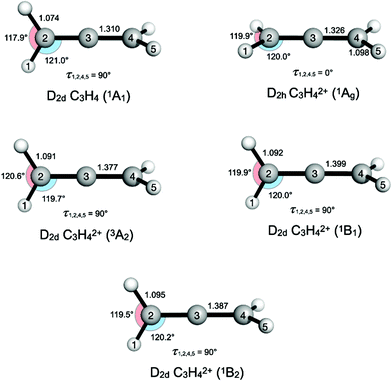 | ||
| Fig. 1 Changes in electronic structure of neutral D 2d allene upon vertical double ionization (in eV) to the four lowest energy states to give: 3A2, 1A1, 1B1 and 1B2 that make up the first peak in the double ionization spectrum in Fig. 2. The D2d1A 1 state undergoes a geometric distortion from D2d → D2h to remove orbital degeneracy. Optimised geometries at the CASSCF/def2-TZVP level are shown, with distances in Å and angles in degrees. | ||
All calculations were carried out using the ORCA program (v 4.1.2).25 Optimisations were carried out at the CASSCF(4,4) and CASSCF(2,4) levels with the def2-TZVP basis set26 for neutral and doubly-ionized states (see ESI†), respectively, reflecting ionization from the 2e (π) orbitals of allene. Optimisation used “tight” thresholds defined in ORCA, corresponding to an SCF energy convergence of 10−8 Ha. Ionization energies were obtained at the NEVPT2 level,27 based on CASSCF(4,4) and CASSCF(2,4) wavefunctions for neutral and doubly-ionized states, respectively, using the def2-QZVPP basis set (see ESI†). Static correlation arising from (near)-degeneracy, that is often a challenge for single-reference methods,12 is explicitly accounted for using the current procedure, and dynamic correlation is included by the NEVPT2 calculations.
4 Results and discussion
4.1 Double ionization of Allene
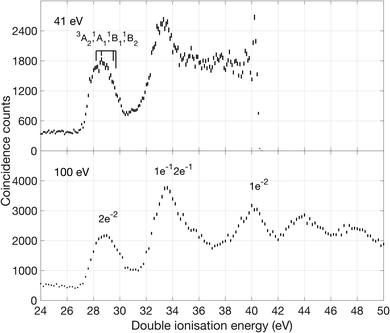
The first band is especially interesting, with substructures at 27.9, 28.7, 29.3 and 30.0 eV that are found by fitting the data to four separate Gaussian peaks, as described in the ESI.† The peaks are interpreted with the aid of our calculations of vertical ionization energies to the lowest triplet T0 (3A2 in D2d) state, the lowest singlet S0 state, which undergoes reorganization, possibly to 1Ag in D2h or to a lower symmetry structure, and the second and third singlet states (1B1 and 1B2) which retain D2d geometry, as illustrated in Fig. 1. Because of the resolution of approximately 0.3 eV in the energy area of the first peak, we are not able to fully resolve the individual peaks, but by fitting the data to four Gaussian peaks the individual peak values were obtained. The peak position from the fit seem to agree with theory and previous measurements of double ionization of allene.12,13
Our theoretical values for the double ionization energy of the different states as well as the experimental values taken from Fig. 2, are summarized in Table 1. The theoretical and experimental values are very close to each other, but adiabatic ionization to the rearranged ground state is not observed. Our calculations are in excellent agreement with the double ionization calculations by Andrews et al. at the MP2 and MP4 levels of theory.12,13 In the double ionization of allene, the molecule goes from being described by the point group D2d to D2h through a reorganisation of the orbitals and a reduction of degenerate states. This process, where the 3D structure of neutral allene changes to a planar form upon double ionization is schematically illustrated in Fig. 1. Although their calculations are otherwise very extensive, Mebel and Bandrauk did not report calculated energies or structures for S1 or any higher states of doubly ionised allene.18
| State configuration | Electronic state | Vertical double ionization (eV) | Adiabatic double ionization (eV) | Experimental vertical ionization energy (eV) |
|---|---|---|---|---|
| a Average of 1A1 and 1B1 energies. | ||||
| (2e)−2 | 3A2 | 28.2 (28.2) {28.05} | 28.0 | 27.9 |
| (2e)−2 | 1A1 | 28.6 (28.9)a [28.2] | 26.1 [25.5] {25.84} | 28.7 |
| (2e)−2 | 1B1 | 29.5 | 29.2 | 29.3 |
| (2e)−2 | 1B2 | 29.7 | 29.5 | 30.0 |
| (1e)−1(2e)−1 | 3A1, 3A2, 3B1, 3B2 | (32.7) | — | 33.5 |
| (1e)−1(2e)−1 | 1A1, 1A2, 1B1, 1B2 | (33.3) | — | |
| (3b2)−1(2e)−1 | 3E | (33.5) | — | |
| (3b2)−1(2e)−1 | 1E | (34.2) | — | |
| (4a1)−1(2e)−1 | 3E | (35.3) | — | 36 |
| (4a1)−1(2e)−1 | 1E | (35.9) | — | |
| (1e)−2 | 3A2 | (37.1) | — | |
| (1e)−2 | 1A1, 1B1 | (37.8) | — | |
| (3b2)−1 (1e)−1 | 3E | (37.9) | — | |
| (4a1)−1 (1e)−1 | 3E | (39.7) | — | 40 |
| (2b2)−1 (1e)−1 | 3E | (40.0) | — | |
| (4a1)−1 (3b2)−1 | 3B2 | (40.5) | — | |
The lowest (adiabatic) double ionization energy is calculated in the present work as 26.1 eV, which is somewhat higher than the previously reported value of 25.8 eV (see Table 1 of ref. 18), but still well below the range seen to be accessed by single-photon ionization in our spectra. The triplet state also relaxes, but much less, ending up at an adiabatic double ionization energy of 28.0 eV, which is in the range seen in our spectrum.
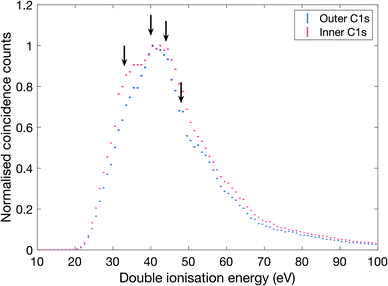 | ||
| Fig. 3 Double ionization spectra of allene measured with 300.5 eV photon energy. The spectra have been selected on outer and inner C1s core electron, respectively. The inner C1s electron has a binding energy of 290.8 eV and the outer C1s electron has 290.6 eV,29 and the selections comprise binding energy ranges of ±0.1 eV. The arrows indicate structures in the ionization spectra at energies of about 33, 40, 44 and 48 eV. | ||
As can be seen, there is a clear difference between the two selectively extracted spectra. Also, even though the experimental resolution is limited (ca. 5 eV) because of the high electron kinetic energies, substructures that correspond well with the distinct bands seen in the 100 eV spectra (cf.Fig. 2) are discernible as indicated by arrows, at about 33, 40, 44 and 48 eV.
4.2 Triple ionization of allene
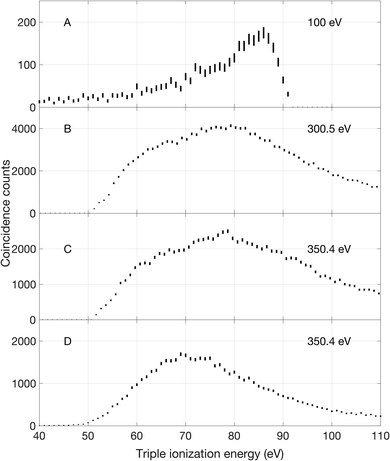
Triple ionization of allene can occur by different main pathways, according to the photon energy. At 100 eV there is only triple valence electron removal. At all energies above about 300 eV core ionization and subsequent double Auger decay is dominant, while at and above 330 eV there is also core–valence direct double ionization followed by Auger decay. Spectra corresponding to the three different pathways are shown in Fig. 4.The 100 eV spectrum (panel A in Fig. 4) is essentially structureless, showing only a smoothly rising signal with a possible start at about 50 eV (and an uncertainty of nearly 2 eV). To remove spurious low energy electrons, the lowest energy included in the events was set to 3 ± 0.5 eV.
The triple ionization spectra displayed in panels B and C were extracted from measurements at 300.5 and 350.4 eV photon energy by selecting events with one core electron and two other electrons. These selections excluded electrons that were not part of the desired energy sharing. As can be seen, the spectra reflect a broad, featureless bump with onset at about 51 ± 2.3 eV and maximum intensity in the 79–80 eV energy range. We note that the ratio of double to single Auger decay is experimentally found to be 13% at both 300.5 eV and 350.4 eV photon energy which is slightly higher than reported ratios in other C3 carbon compounds from the work of Hult Roos et al.30
At 350.4 eV we could also extract the triple ionization spectrum shown in panel D, based on selection of initial core–valence double ionization, for which full spectra will be presented in a forthcoming publication, followed by an additional Auger electron emission. The spectrum locates the lowest triple ionization energy at about 50 ± 5.4 eV. All these onset values are in reasonable agreement with the calculated adiabatic triple ionization values given by Mebel and Bandrauk as 52.29 eV.18
4.3 Fate of Allene above lowest double ionization threshold
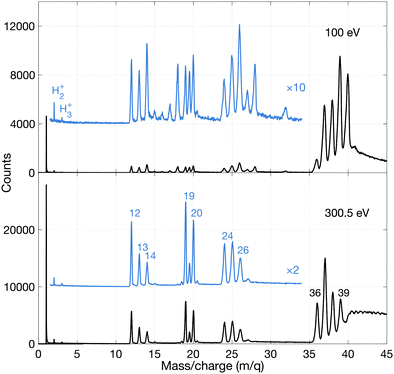
To investigate the fate of allene exposed to photon energies above the lowest double ionization threshold ion detection in multiplex was employed.As can be seen, the 100 eV spectrum is dominated by the parent ion group (m/q = 40, 39, 38, 37, 36). The weak and otherwise unexpected peak(s) at 32 (and 28) suggest(s) that a small amount of air was present during this recording. More interestingly, there are relatively strong peaks for doubly charged ions containing the C3 species at m/q = 20, 19.5 and 19, all three of roughly equal intensity. The very weak peak at m/q = 16 is probably due to O+, while the peak at m/q = 15 of similar intensity is attributed to the CH3+ species. Its intensity is about 1/4 that of the m/q = 14 peak associated with CH2+. Very interestingly, there are distinct peaks for m/q = 2 and 3, i.e. for H2+ and H3+. The remainder of the peaks will be discussed later.
The most striking points in comparing the mass spectrum at 300.5 eV with the 100 eV data are the greatly increased dissociation at 300.5 eV where double ionization by the Auger effect dominates, and the observed stability of the doubly-charged ions C3H42+, C3H32+ and C3H22+ (but not C3H2+ or C32+). We note that the structure and energetics of the parent doubly charged ion were calculated by Mebel and Bandrauk, but those of C3H22+ and C3H2+ were not.18 They, and the apparently less stable or unstable C3H2+ and C32+ species are fundamental entities, likely to be of relevance in astrophysical contexts. From a theoretical point of view, not much is known about their structure, except for the C32+ species for which a linear configuration has been suggested.31 However, for C3+ there is experimental evidence from Coulomb explosion imaging32 and theory33,34 that it is non-linear.
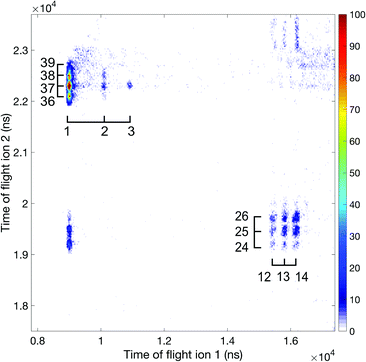 | ||
| Fig. 6 Ion–ion coincidence map at 100 eV photon energy using the 2 m flight tube. Accidental coincidences have been removed and the mass over charge information is included in the plot. | ||
| Ion pair | Rel. abundance (Σ = 1000) |
|---|---|
| H+ + C3H3+ or C3H2+ or C3H+ or C3+ | 562 |
| H+ + C2H+ or C2+ | 92 |
| H+ + CH+ or C+* | 72 |
| H2+ + C3H2+ or C3H+ or C3+ | 33 |
| H3+ + C3H+ or C3+ | 12 |
| C+ + C2H3+ or C2H2+ or C2H+ or C2+ | 49 |
| CH+ + C2H3+ or C2H2+ or C2H+ or C2+ | 76 |
| CH2+ + C2H3+ or C2H2+ or C2H+ or C2+ | 104 |
Apart from the numerous ion pairs observed at 100 eV, some of which may come from triple ionization and involve an unobserved third ion, four double-charge-retaining dissociation channels producing C3H32+, C3H22+, C3H22+ and C32+, as seen in Fig. 5, arise entirely from double ionization. From these and other data we identify the H+ + C3H+ + H2 double ionization channel as the most probable charge separation channel. As can be seen in Fig. 5, the number of charge retaining products increase with increased photon energy. For thermal ions the efficiency measured in separate experiments was about 7%, but the actual efficiency for charge-separating ion pairs will be lower because of losses caused by their initial kinetic energies. This means that the charge retaining products are overestimated if we only consider counts in Fig. 5 and are not one of the more abundant ionization channels.
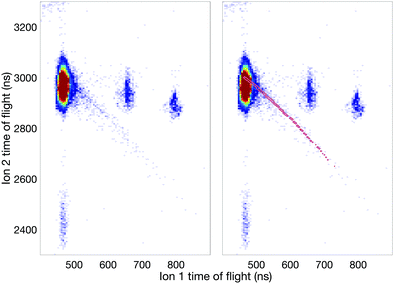
Fig. 7 displays an ion–ion coincidence map of allene obtained at the photon energy of 40.8 eV in DC mode using a much shorter (about 0.12 m long) ion time-of-flight spectrometer mounted in tandem configuration to the electron flight tube. This map confirms, though at lower resolution, several of the ion pair channels involving the H+, H2+, and H3+ species. The significant appearance of H3+ ions in coincidence is in agreement with the findings of Hoshina et al.14 and related theory.18 While the mechanism of formation of the H3+ ions is discussed in the literature in terms of a “roaming” mechanism, which involves an initial H2 species that “orbits” within a doubly-charged precursor until it succeeds in extracting the third proton, the identity of the electronic state from which it happens in allene dication has not been determined experimentally. According to the energy range it could be any of the four states in the first double ionization band (cf.Fig. 2). If Mebel and Bandrauk's RRKM rate calculation is taken at face value, it means that H+ + C3H3+ come from the relaxed ground state S0.18 Further support for that can be obtained from Fig. 3 of Mebel and Bandrauk18 according to which the ground state can make hiving off “roaming H2” more likely by the involvement of a methyl acetylene transition state which posses favourable structural characteristics.
The most interesting aspect in the 40.8 eV map is the presence of an unambiguous, though weak metastable tail, which is essentially invisible at 100 eV and higher photon energies. The map identifies the most intense part of the tail as belonging to the H+ + C3H3+ reaction channel but its comparatively broad spread may also include a contribution from the H+ + C3H2+ ion pairs. The H+ + c-C3H3+ (cyclic cyclo-propenyl) ion pair has the lowest thermodynamic formation limit at 25 eV, while almost all the other observed pairs have limits near 26 eV for formation with no kinetic or internal energy release. Since there is no detectable “V” shape from the metastable decay centred on the doubly charged parent ion's position as apex on the diagonal (t1 = t2),35 no longer-lived group of ions dissociates in the flight tube. This implies that essentially all the metastable decay takes place in the source field of our spectrometer.
The existence of this metastable decay was already noted by Barber and Jennings in 1969 in electron impact mass spectrometry.36 To investigate the metastable lifetime, we plotted the coincidence data as a map of t1 + t2vs. t2 − t1, where the metastable tail gets concentrated as a strip almost parallel to the (t2 − t1)-axis. The intensity as a function of the time difference was extracted and plotted, as is done in Fig. 8, for comparison with the theory given by Field and Eland.35 The fit to the metastable state in the figure has a 95% confidence interval of 229.2–266.8 ns which translates to a lifetime of 130.5 ± 9.9 ns. The observation that the experimental points fit well to a single exponential decay with a mean lifetime of 130.5 ns is in contrast to most other cases, where metastable lifetime decay curves investigated in this way represent a mixture or wide distribution of lifetimes.35 This may imply that only one single vibration level or a very close group lies just above the barrier to this reaction channel.
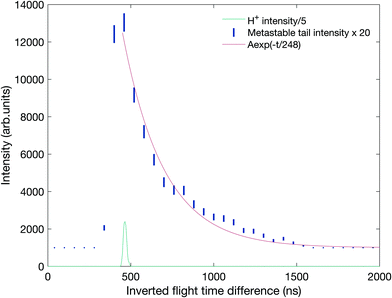 | ||
| Fig. 8 Metastable tail intensity as a function of the inverted flight time difference with a fit to the exponential decay in red. The coincidences are the same as in the tail in Fig. 7 plotted against t2 − t1 where t1 and t2 are the flight times of the first and second ion to be detected, respectively. The location of the mass peak for H+ ions on the same scale is included below the decay curve for comparison. | ||
Because significant approximations are involved in the theory behind the analysis of Fig. 8, the metastable decay was also investigated by a Monte-Carlo type simulation using a realistic model of the apparatus implemented in the software package SIMION,37 the results of which are presented in panel B of Fig. 7. The decay was modelled to have a 3 eV kinetic energy release (KER) in line with the observed difference in energy between the thermochemical threshold and the observed appearance energy, reported below. The pink contour shows the simulation results on top of the experimental coincidence map. This simulation fits the experimental observations well with a mean lifetime of 130 ± 10 ns, in good agreement with the simple exponential fit. We note that this lifetime is within the range predicted by Mebel and Bandrauk on the basis of RRKM theory, that is, assuming free flow of internal energy within the molecular ion allowing statistical energy redistribution.
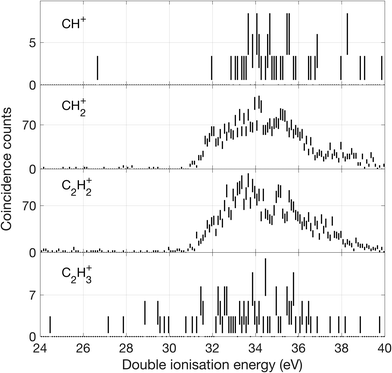 | ||
| Fig. 11 Double ionization spectra for channels where a C–C bond is broken, based on two electrons detected in coincidence with a singly charged ion as specified for each spectrum. | ||
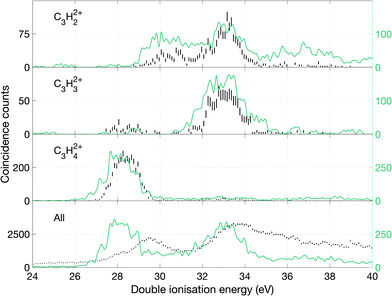
From these spectra, we can get an overview of the fates of allene dications in the range of the excitation energies covered by the double photoionization spectrum at 40.8 eV. As can be seen in Fig. 9, the first peak of the total double ionization spectrum is primarily associated with undissociated electronic states of the doubly ionised parent molecule at up to 3 eV above the calculated adiabatic double ionization threshold of 26 eV. Because of an overlap in the mass spectrum of the peaks reflecting the parent ion and the parent ion minus one hydrogen atom as well as minus a hydrogen molecule, it was impossible to separate the signals for these species completely. We believe that the peak in the double ionization spectrum of C3H32+ between 26 and 30 eV actually originates from C3H42+ instead, because otherwise its appearance energy would be impossibly low. Also, the high energy part of the C3H42+ spectrum may be affected in a similar way. In order to demonstrate more realistic spectra for the doubly-charged ions we have carried out an iterative subtraction process, based on the estimated extent of peak overlap. The resulting spectra are shown in Fig. 9 in green together with the raw spectra in black.
Over the first 2 eV above the onset of vertical double ionization at about 27 eV, the parent C3H42+ ion remains stable on the mass spectrometer time scale. The lowest energy dissociation by charge separation is the slow metastable decay by H+ ejection, with onset at 27.9 ± 0.3 eV and peak intensity at 29 eV ± 0.3 eV shown in Fig. 12. The metastable signal appears only in a narrow range, presumably just above threshold, with a full width at half maximum (FWHM) of 0.7 eV, in line with the expected electron energy resolution at this ionization energy of ca 0.6 eV. This observation strengthens the view that a single vibrational level of the parent dication is responsible for the slow dissociation. Once the ionization energy exceeds 29 eV formation of H+ + C3H3+ occurs rapidly and becomes the most probable dissociation pathway. However, at the same energy both H2+ and H3+ are formed with low intensity (cf.Fig. 10). The three lowest panels in Fig. 12 all represent the process of H+ + C3H3+ formation detected in different ways, and the differences between them illustrate the problems of poor statistics in fourfold coincidences and background subtraction of overlapping mass peaks.
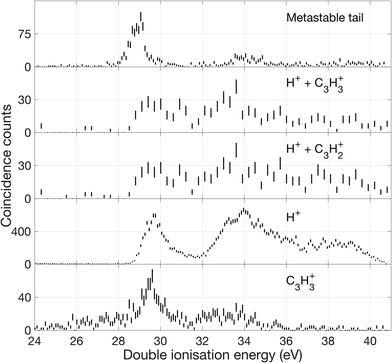 | ||
| Fig. 12 Double ionization spectra based on electrons that were detected in coincidence with ions as specified in the figure. The uppermost spectrum represents decay events detected in the metastable tail shown in Fig. 7. The next lower spectra are derived from selection of events with two ions such as, H+ and C3H3+, and two electrons, eeii. The lower spectra are from events with one ion H+ or C3H3+, respectively, and two electrons, eei. One coincident count is equivalent to two electrons being detected in the same event. | ||
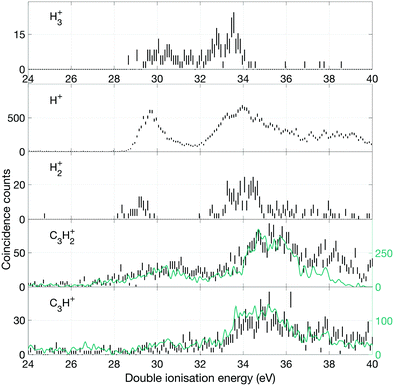
Fig. 10 shows the yields of selected single ions in coincidence with electron pairs. For all the C3Hn+ ions there is an overlap problem similar to that encountered for the doubly-charged ions (cf.Fig. 9) and we have compensated for it in a similar way. In this case, fourfold coincidence measurements give clear guidance on the extent of overlap and the necessary subtractions. Because of the threefold coincidence selection, the contributing ions may be formed by three-body as well as two-body dissociations, but the lowest energy pathways must be the two-body reactions forming H+, H2+ and H3+ with observed onset energies in the region of 28.5 to 29.5 eV. Where two-body reactions dominate, the spectra for H3+ and C3H+ and those of H2+ and C3H2+ should be the same. This is borne out by comparison of the spectra up to 35 or 36 eV, but at higher energy the different intensities indicate that three-body reaction releasing additional neutral fragments take over. The calculations of Mebel and Bandrauk18 indicate that barriers to the three hydrogen ion loss pathways should lie in the range of 28.84 to 29.03 eV, and their RRKM calculations predict that H3+ peak formation should occur at 29.53 eV. The calculated onsets and the peak production energy agree well with the observations in Fig. 10. However, further predictions based on the RRKM model assumption that all channels are in competition at all energies are not in line with our experimental data since the intensities of the channels leading to H+ and H3+ are not comparable at any energy. An alternative interpretation, that chimes with the “roaming” mechanism is that some of the initial population becomes isolated as a [C3H2 − H2]2+ complex, where the H2 can either escape or capture a proton. Such a mechanism would explain why H3+ formation does not take over from H+ production and why the intensities and spectra for H2+ and H3+ production are similar (cf.Fig. 10).
In the higher double ionization energy range, one of the main observations from our data is that the three-body products H+ + C3H2+ + H take over completely from H+ + C3H3+ at energies above 34 eV, as demonstrated by the spectra in Fig. 12. The most natural explanation for that is that this is a sequential decay; C3H3+ ions with sufficient internal energy (8 eV initially) dissociate further by H atom loss. Another very interesting channel is the production of H2+ + C3H2+, which according to the eei data given in Fig. 10 occurs weakly between 28 and 30 eV, then more strongly above 32 eV. Formation near 29 eV is possible only for the cyclic form of C3H2+ (thermochemical threshold 25.5 eV) with a sensible kinetic energy release. Both the cyclic and perhaps more naturally produced linear C3H2+ ion (threshold 27.7 eV) can be formed at 32 eV, which is the energy where the second main double ionization band begins (cf.Fig. 2). According to a recent femtosecond laser pump–probe study of the roaming mechanism for H3+ formation from doubly ionised methanol,19 the two exit channels giving H3+ and H2+ are both ultrafast and in competition. If that is also true for allene, the channel forming H3+ must have entropic or related factors in its favour, as it takes over completely from H2+ formation in the second part of the first main double ionization band (cf.Fig. 10). It is also striking that the charge retaining channel H2 + C3H22+ appears at 29.6 ± 0.3 eV (cf.Fig. 9), near the energy where H2+ ceases to be produced (Fig. 10) and close to its calculated asymptote. This suggests that charge separation and charge retention by the heavier fragment are also in competition at this point.
There is an apparent reappearance of intensity for H+ + C3H3+ peaking at around 34 eV (cf.Fig. 12) in the second double ionization band. In this range both the cyclic and linear isomers of the ion may be formed and charge-retaining formation of both C3H32+ and C3H22+ appear to compete strongly in the same energy range. As can be seen from Fig. 11, this is also the energy range where the charge-separating C–C bond-breaking reaction giving rise to CH2+ + C2H2+ becomes intense. It is slightly surprising that so many very different dissociation routes can all compete in the same energy range with comparable intensities in all the channels.
The appearance energies of the different sets of products determined from the experimental spectra in Fig. 9–11, are listed in Table 3 together with thermodynamic thresholds and theoretical predictions. For all the thermodynamic 0 K thresholds for ions formed with no internal energy or kinetic energy, heats of formation are taken from the NIST database or are estimated by combining known thermodynamic data with theoretical calculations (e.g. from Mebel and Bandrauk (M&B)18). We note that the ions of mass 39, 38 and possibly 37 can have either cyclic or linear structures, with significantly different heats of formation (the heats of formation for mass 37 is uncertain). The Mebel and Bandrauk-calculated thresholds are taken from their Fig. 2, with some degree of ambiguity.
| Channel | 0 K threshold (eV) | Appearance energy (eV) | ||
|---|---|---|---|---|
| Therm. | Calc. (M&B)18 | Calc. (M&B)18 | Obs. (μs) | |
| H+ + C3H3+ | Cyclic 24.9 | 24.95 | 28.8 | 28.9 ± 0.3 |
| Linear 26.0 | 26.2 | |||
| H+ + C3H2+ + H | Cyclic 28.2 | 32 ± 0.3 | ||
| Linear 30.3 | ||||
| H+ + C3H+ + H2 | 30.3 | |||
| H2+ + C3H2+ | Cyclic 25.5 | 27.7 | 32.8 ± 0.2 | |
| Linear 27.7 | 27.9 | 29.44 | ||
| H2+ + C3H+ + H | 32.1 | |||
| H3+ + C3H+ | 25.9 | 26.0 | 29.03 | 29 ± 0.3 |
| CH2+ + C2H2+ | 26.1 | 26.2 | 30.8 (vinylidene) | 31 ± 0.3 |
| CH+ + C2H3+ | 26.3 | 30.36 | 32.1 ± 0.2 | |
| C3H42+ | adb. 25.84 | |||
| vert. 28.05 | 27.5 ± 0.3 | |||
| C3H32+ + H | c-30.55 | 32.1 ± 0.2 | ||
| C3H22+ + H2 | 29.92, 29.39 | 29.6 ± 0.3 | ||
5 Conclusions
Using multi-particle coincidence experiments we have obtained single-photon double and triple ionization spectra of allene, and have determined how dissociation of the doubly charged ions depends on the ionization energy. New high-level calculations confirm that adiabatic double ionization would require isomerization to a different structure, not accessible to vertical ionization processes. The calculations allow substructure in the first double ionization band to be assigned to different electronic states of the dications. Double ionization of allene by Auger decay of C1s hole states is found to populate different spectra of dication states according to location of the vacancy on either the central or an outer C atom.Triple ionization of allene by three routes: valence ionization at 100 eV, double Auger decay of C1s holes and Auger decay of a C1s core–valence doubly ionised intermediate state yield different spectra, but all exhibit an onset of triple ionization at approximately 50 eV, in line with predictions available in the literature.
Eight significant decay pathways for dissociative decay of nascent allene dications have been identified and the energy dependence of their relative intensities is reported. At the lowest energies there is evidence that formation of H2+ + C3H2+ and H3+ + C3H+ are in competition with each other and possibly with the charge-retaining H + C3H32+ channel, but not with charge separation to H+ + c-C3H3+. This finding supports the roaming mechanism, already proposed, where an H2 molecule becomes partially detached from the heavy residual molecular dication.
For the decay to H+ + c-C3H3+, we have confirmed the existence of a slow metastable decay happening in a narrow energy range just above threshold. This decay is well characterised as a single exponential with a mean lifetime determined as 130.5 ± 9.9 ns. We suspect that a single vibrational level of the parent dication may be involved and might be identified by future calculations.
Author contributions
R. F. and J. H. D. E. devised the research, V. I., M. W., E. O., R. J. S., U. M., E. F., M. F., S. S. and R. F. participated in the conduction of the experimental research, A. J. S. and F. D. carried out the theoretical calculations partially advised by J. M. D., V. I. and J. H. D. E. performed the data analysis, V. I., A. S., F. D., J. H. D. E. and R. F. wrote the first version of the paper and all authors discussed the results and commented on the manuscript.Conflicts of interest
There is no conflict of interest.Acknowledgements
This work has been financially supported by the Swedish Research Council (VR) and the Knut and Alice Wallenberg Foundation, Sweden. A. J. S. thanks the EPSRC Centre for Doctoral Training in Synthesis for Biology and Medicine for a studentship (EP/L015838/1). We thank the Helmholtz Zentrum Berlin for the allocation of synchrotron radiation beam time and the staff of BESSY-II for smooth operation of the storage ring in single-bunch mode. The research leading to these results has received funding from the European Union's Horizon 2020 research and innovation programme under grant agreement No. 730872.References
- R. I. Kaiser, D. Stranges, Y. T. Lee and A. G. Suits, Astrophys. J., 1997, 477, 982 CrossRef CAS
.
- B. M. Jones, F. Zhang, R. I. Kaiser, A. Jamal, A. M. Mebel, M. A. Cordiner and S. B. Charnley, Proc. Natl. Acad. Sci. U. S. A., 2011, 108, 452–457 CrossRef CAS PubMed
.
- R. Ruiterkamp, S. B. Charnley, H. M. Butner, H.-C. Huang, S. Rodgers, Y.-J. Kuan and P. Ehrenfreund, Astrophys. Space Sci., 2007, 310, 181–188 CrossRef CAS
.
- R. Stockbauer, K. E. McCulloh and A. C. Parr, Int. J. Mass Spectrom. Ion Phys., 1979, 31, 187–189 CrossRef CAS
.
- C. Baker and D. W. Turner, J. Chem. Soc. D, 1969, 480–481 RSC
.
- R. K. Thomas and H. W. Thompson, Proc. R. Soc. London, Ser. A, 1974, 339, 29–36 CAS
.
- G. Bieri, F. Burger, E. Heilbronner and J. P. Maier, Helv. Chim. Acta, 1977, 60, 2213–2233 CrossRef CAS
.
- J. Dannacher and J. Vogt, Helv. Chim. Acta, 1978, 61, 361–372 CrossRef CAS
.
- M. H. Garner, R. Hoffmann, S. Rettrup and G. C. Solomon, ACS Cent. Sci., 2018, 4, 688–700 CrossRef CAS PubMed
.
- C. H. Hendon, D. Tiana, A. T. Murray, D. R. Carbery and A. Walsh, Chem. Sci., 2013, 4, 4278–4284 RSC
.
- E. Soriano and I. Fernandez, Chem. Soc. Rev., 2014, 43, 3041–3105 RSC
.
- S. R. Andrews, D. E. Parry, M. Vairamani and F. M. Harris, J. Chem. Soc., Faraday Trans., 1992, 88, 3403–3407 RSC
.
- S. R. Andrews, D. E. Parry and F. M. Harris, J. Chem. Soc., Faraday Trans., 1995, 91, 1181–1183 RSC
.
- K. Hoshina, H. Kawamura, M. Tsuge, M. Tamiya and M. Ishiguro, J. Chem. Phys., 2011, 134, 064324 CrossRef PubMed
.
- H. Xu, C. Yao, G. Xu, Z. Wang and H. Jin, Combust. Flame, 2013, 160, 1333–1344 CrossRef CAS
.
- K. Hoshina, Y. Furukawa, T. Okino and K. Yamanouchi, J. Chem. Phys., 2008, 129, 104302 CrossRef PubMed
.
- N. Iwamoto, C. J. Schwartz, B. Jochim, K. Raju, P. P. Feizollah, J. Napierala, T. Severt, S. Tegegn, A. Solomon and S. Zhao,
et al.
, J. Chem. Phys., 2020, 152, 054302 CrossRef CAS PubMed
.
- A. M. Mebel and A. D. Bandrauk, J. Chem. Phys., 2008, 129, 224311 CrossRef CAS PubMed
.
- E. Livshits, I. Luzon, K. Gope, R. Baer and D. Strasser, Commun. Chem., 2020, 3, 1–6 CrossRef
.
- J. H. D. Eland, O. Vieuxmaire, T. Kinugawa, P. Lablanquie, R. I. Hall and F. Penent, Phys. Rev. Lett., 2003, 90, 053003 CrossRef CAS PubMed
.
- J. H. D. Eland and R. Feifel, Chem. Phys., 2006, 327, 85 CrossRef CAS
.
- J. H. D. Eland and R. Feifel, J. Chem. Phys., 2006, 125, 194318 CrossRef PubMed
.
- S. Plogmaker, P. Linusson, J. H. D. Eland, N. Baker, E. M. J. Johansson, H. Rensmo, R. Feifel and H. Siegbahn, Rev. Sci. Instrum., 2012, 83, 013115 CrossRef PubMed
.
- Y. A. Kruglyak, H. Preuss and R. Janoschek, Theor. Exp. Chem., 1973, 7, 241 CrossRef
.
- F. Neese, Rev. Comput. Mol. Sci, 2018, 8, 4 Search PubMed
.
- F. Neese, Phys. Chem. Chem. Phys., 2005, 7, 3297 RSC
.
- C. Angeli, R. Cimiraglia, S. Evangelisti, T. Leininger and J. P. Malrieu, J. Chem. Phys., 2001, 114, 10252 CrossRef CAS
.
- M. W. Wong and L. Radom, J. Mol. Struct., 1989, 198, 391–402 CrossRef CAS
.
-
O. Travnikova, PhD thesis, Acta Universitatis Upsaliensis, 2008
.
-
A. Hult Roos, PhD thesis, The University of Gothenburg, The Faculty of Science, 2019
.
- H. Hogreve, J. Chem. Phys., 1995, 102, 3281–3291 CrossRef CAS
.
- A. Faibis, E. P. Kanter, L. M. Tack, E. Bakke and B. J. Zabransky, J. Phys. Chem., 1987, 91, 6445–6447 CrossRef CAS
.
- P. R. Taylor, J. M. L. Martin, J. P. Francois and R. Gijbels, J. Phys. Chem., 1991, 95, 6530–6534 CrossRef CAS
.
- S. Diaz-Tendero, G. Sánchez, P.-A. Hervieux, M. Alcam and F. Martn, Braz. J. Phys., 2006, 36, 529–533 CrossRef CAS
.
- T. A. Field and J. H. D. Eland, Chem. Phys. Lett., 1993, 211, 436–442 CrossRef CAS
.
- M. Barber and K. R. Jennings, Zeitschrift für Naturforschung A, 1969, 24, 134–138 CrossRef CAS
.
-
D. Manura and D. Dahl, SIMION 8.0/8.1 User Manual: Covering SIMION Version 8.1.0.31, Scientific Instrument Services, Incorporated, 2011 Search PubMed
.
Footnote |
| † Electronic supplementary information (ESI) available. See DOI: 10.1039/d1cp04666g |
| This journal is © the Owner Societies 2022 |

