DOI:
10.1039/D3SM01648J
(Review Article)
Soft Matter, 2024,
20, 2419-2441
Lattice Boltzmann simulation of deformable fluid-filled bodies: progress and perspectives
Received
6th December 2023
, Accepted 20th February 2024
First published on 21st February 2024
Abstract
With the rapid development of studies involving droplet microfluidics, drug delivery, cell detection, and microparticle synthesis, among others, many scientists have invested significant efforts to model the flow of these fluid-filled bodies. Motivated by the intricate coupling between hydrodynamics and the interactions of fluid-filled bodies, several methods have been developed. The objective of this review is to present a compact foundation of the methods used in the literature in the context of lattice Boltzmann methods. For hydrodynamics, we focus on the lattice Boltzmann method due to its specific ability to treat time- and spatial-dependent boundary conditions and to incorporate new physical models in a computationally efficient way. We split the existing methods into two groups with regard to the interfacial boundary: fluid–structure and fluid–fluid methods. The fluid–structure methods are characterised by the coupling between fluid dynamics and mechanics of the flowing body, often used in applications involving membranes and similar flexible solid boundaries. We further divide fluid–structure-based methods into two subcategories, those which treat the fluid–structure boundary as a continuum medium and those that treat it as a discrete collection of individual springs and particles. Next, we discuss the fluid–fluid methods, particularly useful for the simulations of fluid–fluid interfaces. We focus on models for immiscible droplets and their interaction in a suspending fluid and describe benchmark tests to validate the models for fluid-filled bodies.
I. Introduction
The many-body dynamics of deformable objects, passive and active alike, in confined fluid flows is a central theme of modern soft matter research, with many applications in science, engineering, and medicine. From a fundamental perspective, the main challenge relates to the self-consistent interplay between external degrees of freedom, positions and momenta, and the internal ones describing the shape changes of the deformable body. Such an interplay is expected to spawn new dynamic regimes that are simply inaccessible to rigid particles. Likewise, such new dynamic regimes are expected to lead to new states of soft matter, hence potentially new materials.
In this review, we shall focus on the transport of deformable fluid-filled bodies, an important problem with various applications, from oil to pharmaceutical and food-processing industries.1–4 Familiar examples include paints,5–7 milk,8–10 and blood,11,12 where the internal constituents are ink droplets, fat droplets, and cells, respectively, and all deform when subjected to mechanical stresses, such as the ones resulting from the flow of the surrounding fluid. An analytical approach proves challenging due to the strong coupling between the fluid and the deformable particles. This interaction is reciprocal, for the fluid affects the shape of the particle due to hydrodynamic forces and the deformation in turn changes the boundaries of the fluid flow. While still facing numerous challenges, computational methods have become an indispensable alternative tool to study these systems.13–16
Numerical models for the interplay between the macroscopic fluid properties and its internal deformable constituents usually combine computational fluid dynamics (CFD) with computational mechanics.17–19 This is particularly true for the simulation of fluid-filled bodies with solid boundaries. Deformability alters the flow, hence it affects the way energy is dissipated within the flow, resulting in strong rheological and mechanical nonlinearities, as signalled by the crossover from Newtonian to shear-thinning regimes, such as in most emulsions. A fluid-filled body consists of a body, usually spherical, with a fluid core (see Fig. 1). Common examples include droplets and capsules. The latter is a liquid droplet enclosed by a thin membrane. These bodies are often surrounded by a fluid environment and consequently, they exhibit fluid–fluid boundaries (droplets) or fluid–solid boundaries (capsules).
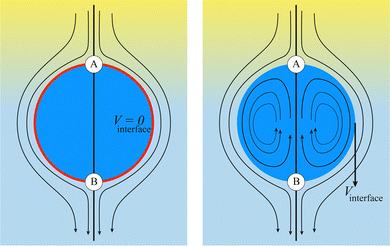 |
| | Fig. 1 Comparison of flow around a fluid–solid (left) and a fluid–fluid (right) interface. On the left, the red line represents a fluid–solid interface such as a membrane on a rigid capsule. There is no internal circulation because the velocity at the interface is zero (considering no-slip boundary conditions). On the right, we see internal circulation due to the continuity of the velocity across the fluid–fluid interface. Points A and B indicate stagnation points and the colour gradient of the external fluid represents a pressure gradient which drives the flow. Both images are in the capsule reference frame (fluid velocity relative to the capsule/droplet). The internal fluid in both images is blue. Black arrows represent the fluid flow. | |
The modelling approaches for fluid-filled bodies can be divided into two groups, based on the boundary between the fluid-filled body and its environment. These are fluid–structure and fluid–fluid methods. The former consists of modelling a fluid–solid boundary, where the fluid and a deformable solid interact with each other. The second consists of modelling the interactions between two fluids, usually separated by a fluid–fluid interface. The nature of the boundaries requires computational methods to describe both the fluid inside and outside of the particles. Furthermore, tracking the interface is often required, which can make the overall process computationally expensive. In this review, we focus on cases where the internal and external fluids are both Newtonian. We point out that for industrial applications, capsules can have solid cores (even multiple small solid cores) enclosed by a membrane; however this will not be addressed in this review.20
Computational methods can often illuminate regions of parameter space not easily accessible by experiments or analytical methods. Several methods can be used to model the fluid flow. Here, we focus on the lattice Boltzmann method (LBM), as it provides a versatile way to introduce fluid–fluid interactions and to couple fluid–solid boundaries as well. Various methods (continuum, discrete, mesoscopic) have been developed to simulate droplets, cells, capsules and so on, and we refer to existing literature on this.21,22 We restrict ourselves to those methods that employ or pertain to LBM. Previous reviews and books23–25 have covered some fluid–solid and fluid–fluid methods in a different context. For instance, Karimnejad et al.23 have reviewed fluid–structure (FS) methods for rigid particles. Here our focus is on methods for deformable particles in fluids. We present a comprehensive review of those methods and compare them.
Finally, we wish to underline that the methods described in this review straddle across the passive versus active soft matter divide, just because, once the coupling between internal and external degrees of freedom is accounted for, such divide largely blurs out.26 The methods described here may be used to investigate problems in the active matter systems such as the emergent nematic order in epithelial cells, which share many similarities with the emulsions of Section IV, and the shape changes in bacteria, which become more elongated when swarming.27,28
The review is organised as follows. The LBM is summarised in Section II. In Section III, we review fluid–structure methods which often use the immersed boundary method. We highlight the differences and similarities between the continuum and the discrete approaches. In Section IV, we review the various multicomponent methods for immiscible droplets. In Section V, we provide benchmarks in 2D and 3D for hydrostatic and hydrodynamic conditions. In Section VI, we conclude by summarising our observations and make remarks on open questions and future challenges.
II. Lattice Boltzmann method
In recent years the LBM has become a useful tool in solving the hydrodynamics of soft matter systems.29 The fluid flow is described by the Navier–Stokes (NS) equations,| |  | (1) |
where u is the fluid velocity, t is time, p is the pressure field, μ is the dynamic viscosity, ρ is the density and g is the body force. LBM however does not solve the NSE directly. Instead, it is a mesoscopic method which recovers the results of the NS equations. As opposed to molecular dynamics, which solves the dynamics of individual molecules/atoms, in LBM a fluid “particle” consists of a group of molecules and consequently is much larger than the individual scale of molecules. Information about the fluid is contained in the lattice nodes and can only move in specific directions reducing the number of degrees of freedom. Although it originates from Lattice Gas Automata,30 it is now considered a separate method. Several works have shown the potential of LBM to solve fluid-related problems.13,31–35 It is an efficient algorithm particularly popular for Stokes flow, systems with complex solid boundaries,36 multiphase flow,37 hydrodynamic dispersion38 and convection.39
A. Lattice BGK model
The Boltzmann equation that contains the fluid particle information reads| |  | (2) |
where f = f(x, v, t) is the distribution function for a fluid particle in phase space, having microscopic velocity, v, at time t, at position x, where a is the acceleration and Ω(f) is the collision operator which describes the interaction between molecules. Different LBM formulations will have different collision operators. The simplest one is the Bhatnagar–Gross–Krook (BGK) operator given by| |  | (3) |
where τ is the relaxation time which drives the relaxation to the equilibrium distribution feq(x,v,t). The relaxation time is directly related to the viscosity of the fluid since the fluid kinematic viscosity ν is given by| |  | (4) |
where cs is the speed of sound, τ is the single relaxation time and Δt is the time step. It should be stated, however, that connecting the kinematic viscosity and the speed of sound is shown to be valid for low Mach number (<0.3) and nearly incompressible flow.
The equilibrium distribution function is related to the macroscopic fluid velocity u and density ρ
| |  | (5) |
where
θ is the normalised temperature which is usually assumed to be the unity and
D is the spatial dimension. Note that
ρ,
u and
θ depend on time and space in general. The above equation can be expanded using the Hermite series to the second order as
| |  | (6) |
where the subscript
α represents the discrete lattice speed (see
Fig. 2),
ξα is the microscopic velocity vector,
wα is the weight of the lattice and,
i is the index of lattice sites.
feqα(
xi,
t) is the distribution at equilibrium at position
xi and time
t. Both
ρ and
u are a function of position
xi and time
t. The parameters
ξα and
wα depend on the lattice chosen for the discretization. The velocity is discretized into structured lattice velocity (1D, 2D or 3D) vectors. For example, the D1Q3 lattice represents a one-dimensional chain with three vectors per node. Usually, more lattice vectors mean increased precision but also increased computational effort. Popular lattices include the D2Q9 (see
Fig. 2) and D3Q19. Different lattices have different speeds of sound
cs and weights
wα for each vector.
25
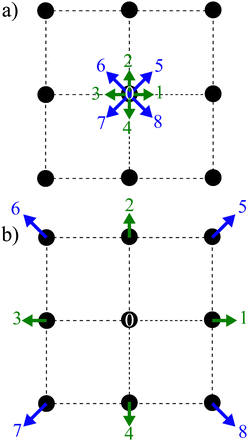 |
| | Fig. 2 Two main steps of the LBM: (a) collision and (b) streaming using a D2Q9 lattice. The collision is described by the distribution functions going from one node after the streaming step propagates them to the neighbouring nodes according to the direction. The arrows represent the nine distribution functions. | |
The final discrete lattice Boltzmann equation (with the BGK operator) is,
| |  | (7) |
where

is the forcing term which includes both external forces and intra/intermolecular fluid forces. There are different force schemes in LBM used to implement these terms. Several articles and reviews have been written about the advantages/disadvantages of each one (see ref.
40–42). A popular one, the Guo forcing scheme,
43 is given by
| |  | (8) |
where
F is the force. There are two main steps in
eqn (7): collision and streaming (see
Fig. 2). The information for both steps comes from the nearest neighbours (usually within the first belt) of the respective fluid node. This makes the method very adaptable to parallel computing such as with graphical processing units (GPUs), when compared to other conventional methods.
The macroscopic density and velocity are calculated through
| |  | (9) |
In this review, we focus on the LBM to model the hydrodynamics. The LBM is particularly well suited to multiphase flow, particularly drops, bubbles, and emulsions. Some of the commonly quoted strengths and weaknesses of the LBM method are discussed, for example, in ref. 25 and 44. We also focus on the single relaxation time collision operator due to its simplicity, but we emphasise that more sophisticated ones are used to mitigate spurious effects and may offer enhanced stability, like the MRT collision operator45,46 and the entropic LBM.47,48
III. Fluid–structure based methods
At the microscale, there is a plethora of particles which are bound by membranes. Examples include living cells, artificial capsules (e.g. polymerised membranes) and vesicles (e.g. lipid bilayer membranes). An example of biological membrane-bound particles is red blood cells (RBCs). We highlight that variations of the models presented here have been used for soft objects like microgels49 and capsules.50 While these bodies can suffer strong deformations, for the majority of them volume is relatively unchanged. Consequently, researchers have been interested in the transport of soft matter and other complex fluids flowing at low Reynolds numbers. In order to model biological and synthetic membrane-bound particles, one should consider the membrane elastic, bending and viscous properties along with the inner and outer fluid viscosity. Depending on what is being modelled a combination of the aforementioned properties is necessary to accurately capture the physics. Furthermore, the meshing of the membrane is required, particularly for the methods described in this section. In 2D, the mesh consists of line segments and 3D of surfaces. In general, there are two ways to approach this problem. These approaches depend on whether the boundary (in most cases a membrane) is treated as a continuum medium or as a discrete one. We show in Fig. 3 an illustration of the two different approaches.
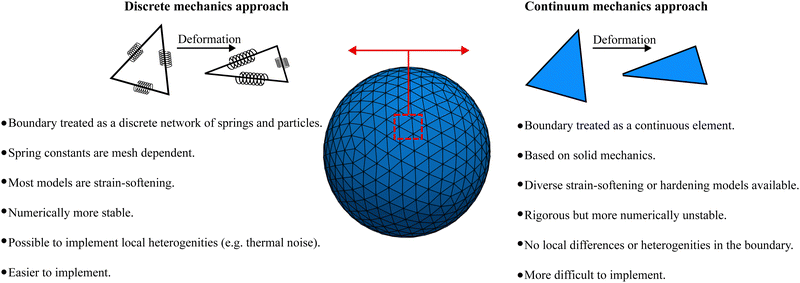 |
| | Fig. 3 Discrete mechanics approach (left) vs. continuum mechanics approach (right). On the discrete mechanics approach the dynamics of the membrane is given by a connected network of springs. On the continuum mechanics approach the membrane is treated as a surface i.e. a continuum medium. The advantages and disadvantages of each approach are highlighted. | |
The first approach is a continuum one where the membrane is treated as a 2D continuum surface in 3D space. One simulates the solid mechanics of the membrane using appropriate constitutive laws that are descriptions of the energy–strain or stress–strain relations of the membrane. It is then possible to model strain-softening membranes, i.e. the membrane stress increases slower than strain, or strain-hardening membranes, where the membrane stress increases faster than strain.51 Although constitutive laws are rigorous physical descriptions of the membrane, the numerical implementation is complicated. In addition, due to the continuity of the membrane properties, this approach is limited to modelling at length scales where local differences in the membrane are insignificant.52 Another consequence of applying a constitutive model in the entire membrane domain is that the shape memory might be neglected in some cases.53 This approach is discussed in Section IIIA.
In the second approach, the membrane is treated as a discrete network of springs and particles. This approach provides some advantages namely, its mathematical description is simpler and local differences or thermal fluctuations can be included in contrast to the continuum approach. However, spring constants can depend strongly on the mesh configuration as shown in ref. 54. In fact, ref. 54 shows that discrete spring models have anisotropic mechanical properties, in general. Furthermore, when studying biological membranes, local area incompressibility has to be enforced which is not possible using simple discrete spring models.54 Additional terms have to be included. This approach is also known to suffer less numerical instability than the continuum approach.52 This discrete approach is discussed in Section IIIB.
The elastic forces are treated differently in each approach. In the continuum approach, these are solved using continuum-based solvers such as the finite element method (FEM) while in the discrete approach, the motion and interaction of individual springs are treated in a particle-based manner. Each approach has its own advantages and drawbacks which we highlight in the following sections. The bending along with the volume and area constraints are in common with both the continuum and discrete approaches and are discussed in Section IIIC. Additionally, the fluid can be coupled with membrane dynamics using the immersed boundary method (IBM). In Section IIID, we discuss how to couple the fluid mesh with the membrane mesh. This review focuses on LBM for the fluid which has a Cartesian fixed mesh and for the membrane a (triangular) evolving mesh. The IBM has proven to be useful for partitioned simulations, where the flow and the displacement of the structure are calculated separately55 and where the elastic bodies have negligible mass.56 In IBM, the flow is solved on an Eulerian grid while the membrane is treated on a Lagrangian grid.57 The total force acting on the membrane is treated as a source term in the NS equation. This means that artificial forces are spread as body forces around the membrane boundary in order to mimic the effects of the moving membrane. In the LBM, this is included in the g term of eqn (1), which ensures no slip and no flow penetration boundaries. Because the IBM is often employed for structures with negligible inertia (overdamped regime), the velocity of a membrane node is interpolated from the surrounding fluid while the forces acting on the membrane node are spread in the surrounding fluid nodes. IBM is discussed in more detail in Section IIID.
Once we define the constitutive models and constraints, it is straightforward to derive the nodal forces as will be shown. However, it is nontrivial to implement the force calculations. The vast majority of meshes used in the literature are triangular meshes in both the continuum and discrete approaches. We aim, in the following sections, to describe approaches to obtain those forces for elastic, immersed bodies. We illustrate different possible shapes with the fluid–structure-based models in Fig. 6.
A. Continuum approach
The membrane can be treated as a continuum sheet with infinitesimal thickness. The total energy of a membrane is| | | W = Ws + Wb + WA + WV, | (10) |
where Ws is the elastic strain (in-plane) energy, Wb is the bending energy, WA is the area penalty energy, and WV is the volume penalty energy. We highlight that Ws is described by a continuum function which describes the in-plane energy. It is possible then to calculate elastic in-plane forces from Ws using FEM. Moreover, explicit expressions can be used for the calculation of bending and area/volume penalty forces as this does not necessarily require the FEM. In general, to solve the physics of the continuum membrane we need to discretize it using an appropriate mesh (usually triangular). The elementary surfaces in the mesh are connected by nodes which interact with the fluid. The force acting on membrane node i at position xi is given by the principle of virtual work,58–61| |  | (11) |
Details about derivations using the equation for each term can be found in ref. 62. For simplicity, we usually consider more straightforward expressions for the force instead of the full expressions derived in the next sections.
1. Elastic membrane models and finite element method.
To determine the elastic forces acting on membrane nodes, it is essential to choose an appropriate constitutive equation that accurately captures the membrane's inherent properties. We refer the reader to ref. 63–65 for commonly used models which we also discuss in this section. The Neo-Hookean (NH) model63 is one of the most straightforward choices among different constitutive equations, in the form| |  | (12) |
where Es is the surface shear elasticity modulus, λ1 and λ2 are the principle stretch ratios (see Fig. 4a) and dA is a surface element area. The NH constitutive equation describes the membrane as a material that doesn't change volume when deformed. If the membrane area increases, it gets thinner to keep the volume constant. An alternative form of eqn (12) is the zero-thickness (ZT) shell representation66 with the strain energy function given as:| | 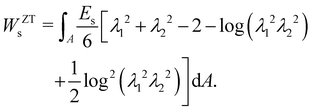 | (13) |
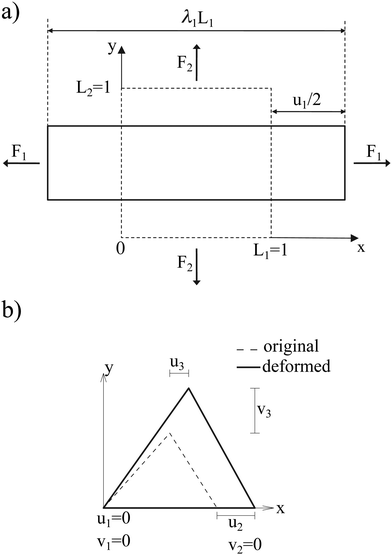 |
| | Fig. 4 (a) Example of a deformation of a 2D sheet due to forces F1 and F2. Deformation in the x direction is characterised by the stretch ratio λ1 or by the displacement u1 (the same in the y direction). λ1 and λ2 are the stretch ratios in two principle directions, defined as the ratio of the final to the initial length. (b) Computation of the deformation is done by mapping both the original and the deformed triangles to a common plane. Inspired by ref. 67. | |
A widely used model suggested by Skalak;68 see e.g. ref. 18 and 69. The membrane is treated as a thin, 2D elastic surface due to its small thickness compared to its surface area. This allows for an effective modelling of the membrane's behaviour under both low stress and strong deformations. In this model, the strain energy density function is defined as:
| |  | (14) |
where
Es and
C are the membrane elastic shear and area dilation moduli. The same is true for other elastic models.
Eqn (12)–(14) can also be written as a function of the strain invariants
I1 and
I2 defined for a 2D membrane (with isotropic and homogeneous properties) as
| |  | (15) |
We note that some of the methods, such as that proposed by ref.
43, allow one to model a more generic capsule whose interface is also a 2D isotropic sheet with no bending energy. The membrane energy is given by
W =
W(
I1,
I2,
α1,
α2,
α3) with
| |  | (16) |
where
W0 is a reference value,
I1 and
I2 are the strain invariants and
α1,
α2 and
α3 are coefficients which control the elasticity and deformation of the capsule. In fact, one can tune these coefficients to obtain other models such as the Skalak or Neo–Kookean models previously mentioned and even the properties of a droplets.
70
Once the constitutive law is chosen, we can compute the elastic forces using the linear FEM.58 The elastic forces are calculated at the Lagrangian nodes of the membrane mesh, using a linear FEM, commonly employed in capsule deformation studies.4,18,71 These forces result from the planar deformation of discrete surface elements deviating from their original configurations. To enable a comparison between the current and reference configurations, each deformed surface element is projected onto a common plane, aligning with its initial configuration, as shown in Fig. 4b. Triangular surface elements are often used to discretize the membrane thus we also use triangular surface elements in this review. Next, the in-plane displacements, denoted as ux and uy, can be calculated at every vertex. The procedure, as described below, is motivated by ref. 18, 58, 59, 62 and 67,72,73.
Let us denote a undeformed membrane marker described by the reference coordinates x and y and after deformation by X and Y. The relation between the undeformed and deformed state is given by:
| |  | (17) |
As the membrane is modelled using an 2D energy law
W, the nodal forces,
Fs,ix and
Fs,iy, are derived using the principle of virtual work for a discrete element. This is expressed in terms of virtual displacements, δ
uix and δ
uiy, given by:
| |  | (18) |
where, as in
Fig. 4b, we use the superscripts
i = 1, 2, 3 to identify the variables vertices of the triangle. δ
Ws is the first order variation in the strain energy of the discrete surface element.
There are two assumptions one can make for simplicity. Firstly, a discrete element can be assumed to undergo uniform deformation which leads to the stretch ratios being constant on that discrete element. Consequently, the virtual work for an discrete element is given by
where
A0 is the original area of the discrete element and
W strain energy density. Secondly, one can assume that the strain energy is related to the principal stretch ratios,
λ1 and
λ2 due to the membrane being isotropic and incompressible. This leads to the first variation of the strain energy function, δ
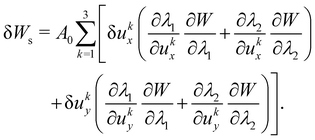
W, computed using the chain rule resulting in the following equation for virtual work of a discrete element due to displacements, δ
uix and δ
uiy:
| |  | (20) |
To obtain expressions for the nodal forces,
Fs,ix and
Fs,iy,
eqn (18) and (20) are substituted in
eqn (19) and using the fact that displacements, δ
uix and δ
uiy, are arbitrary gives:
| |  | (21) |
The forces
Fs,ix and
Fs,iy are in the local coordinate system, which after computing are then transformed back to the global Cartesian coordinates and added to the node's Lagrangian force term as shown in ref.
58. As an example, in a triangular mesh, every node serves as the vertex for 5 or 6 triangles as shown in
Fig. 5 where we highlight a few Lagrangian nodes in red. Consequently, the total elastic force at each node is the combined force from each of these 5 or 6 triangles.
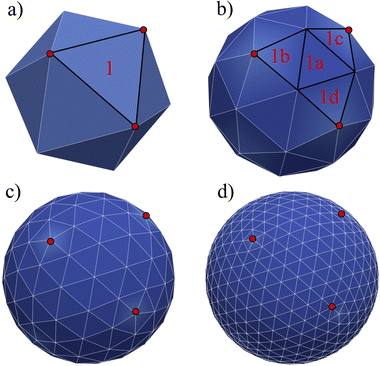 |
| | Fig. 5 Loop subdivision mesh. The mesh is started from a solid such as an icosahedron (or other initial shapes such as a pyramid) which has 20 sides and 12 nodes. A triangular surface element is divided into 4. There are 3 levels of refinement shown: (a)–(d). For clarification, we highlight an initial triangle 1 which is divided into triangles 1a, 1b, 1c, and 1d. The red points just indicate the nodes of the initial face element. | |
The derivatives in eqn (21) are computed using a linear FEM, with linear shape functions, Ni, i = 1, 2, 3, where N1, is defined as58,67,73
| |  | (22) |
and
N2 and
N3 can be obtained by cycling the indices from 1 → 2 → 3 → 1. 2
A0 is twice the area of the undeformed element and is computed as follows:
| | | 2A0 = |(y(2) − y(3))x(1) + (x(3) − x(2))y(1) + x(2)y(3) − x(3)y(2)|. | (23) |
In turn, the spatial dependence of the displacement on the element can be expressed as
| |  | (24) |
The relation between (
x,
y) and (
X,
Y) (see
eqn (17)) is given in matrix notation by
dX =
F·
dx where the matrix of the Cartesian components of the deformation gradient tensor is

as shown in ref.
58 and
59. Lastly, one just needs to compute the principle stretch ratios,
λ1 and
λ2, from the eigenvalues of the two-dimensional right Cauchy–Green tensor,
G =
FTF, whose components are given by
| | 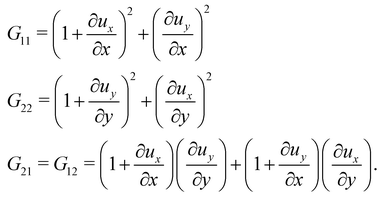 | (25) |
The derivatives of the in-plane displacements,
u and
v, in
eqn (25) for
G21 =
G12 are computed by differentiating their linear representations given by
eqn (24). Finally, the principle stretch ratios are expressed in terms of the components of
G as follows:
| |  | (26) |
B. Discrete approach
A different approach to model membrane elasticity is based on molecular dynamics, as initially suggested in ref. 74, and subsequently widely used.75,76 Although theoretically possible to use molecular dynamics to model fluid–structure interaction flows, the computational cost of molecular dynamics is prohibitively expensive to reach the length and time scales relevant to the motion and deformation of flexible objects. Addressing this regime requires a mesoscale method. One strategy involves using a discrete arrangement of springs and (coarse-grained) particles. As one represents multiple atoms as a single particle, the computational cost is reduced. In addition, this simplification helps in studying larger spatial scales or longer timeframes while sacrificing some fine-scale details. Furthermore, this allows for defining an effective interaction potential between each particle to simulate the mechanical behaviour of the system. By adopting this approach, the number of degrees of freedom is minimised, and the time and length scales are increased. The force acting in each particle can be obtained by taking the derivative of the potential energy. Other forces such as fluid forces and particle–particle repulsion are also taken into account.
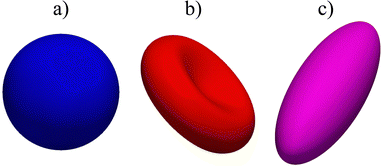 |
| | Fig. 6 Examples of different shapes that can be used in the lattice-Boltzmann method with finite elements and immerse boundary. (a) is a sphere, (b) is a biconcave shell and (c) is an ellipsoid. An icosahedron was used for the subdivision scheme and there were 5 subdivisions, so the total number of elements is Ne5 = 20 × 45 = 20![[thin space (1/6-em)]](https://www.rsc.org/images/entities/char_2009.gif) 480 faces. 480 faces. | |
While membranes have different constituents, most share common physical properties. The in-plane stretching energy can be modelled through several different potentials. These can range from the simple linear such as the harmonic potential to a complex nonlinear ones such as worm-like-chain (WLC) potential or the finite extensible nonlinear elastic (FENE) potential. This approach has proven effective in making predictions that consistently match the energy density functions used in the continuum model.54,74 The total energy of a membrane is
| | | W = Wstretch + Wbending + Warea + Wvolume, | (27) |
where
Wvolume is included only for 3D simulations. Once again, the nodal force at node
i at position
xi derived from the potential energy is given by
| |  | (28) |
Full derivations are not shown but can be found in ref.
77.
1. Elastic membrane models.
A harmonic stretching potential can be used to model the stretching energy as| |  | (29) |
where ks is the linear spring stretching constant, NS is the number of springs, lj and lj0 are length and the equilibrium length of the j-th spring, respectively. Eqn (29) has been used to study diseased RBCs,78 blood flow in capillaries79 and has been validated against modern experimental techniques such as atomic force microscopy.80Eqn (29) is one of the simplest form of in-plane to model in-plane streching energy, however it is restricted in its ability to model nonlinear characteristics. Nonetheless, some attempts have been made to account for an increase in stretching resistance with elongation of the spring by using a nonlinear spring constant ks as ks = ks0e2(ι−1) where the bond stretch ratio (ι) is included.81 The stretch ratio ι is defined as ι = l/l0 where l and l0 are length and the equilibrium length of the spring, respectively. It has been shown to achieve good results between experiments and simulations.79 Similarly, other nonlinear potentials may be used to model the stretching energy. The two most popular nonlinear potentials75 are the WLC potential and FENE potential. Explicitly, they are defined as| |  | (30) |
where kB is the Boltzmann constant, p is the persistence length, T is the temperature, x = l/lm ∈ (0,1), lm is the maximum spring extension and ks is the FENE spring constant. Notice that in both models the maximum extension is limited to lm as the force will approach infinity as the spring length approaches lm.
Note that these springs (FENE and WLC) represent attractive potentials, thus they tend to reduce the area (area compression). A repulsive force field should be combined to restrict this reduction. ref. 75 proposed two potentials, one of which is an inverse power repulsive potential (WPOW) that is based on the spring length i.e. it will restrict the length of the spring. This means
| | | Wstretch = WWLC + WPOW or Wstretch = WFENE + WPOW, | (31) |
where the inverse power repulsive potential is given by
| |  | (32) |
and
kp is the repulsive stiffness. Finally, the forces for
eqn (30) and (32) are
| | 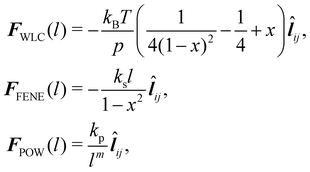 | (33) |
where
x =
l/
lm and
![[l with combining circumflex]](https://www.rsc.org/images/entities/b_i_char_006c_0302.gif) ij
ij =
![[l with combining right harpoon above (vector)]](https://www.rsc.org/images/entities/i_char_006c_20d1.gif) ij
ij/
l is the vector of unit length between nodes
i and
j.
C. Bending and area & volume constraints
1. Bending.
The resistance to bending and the prevention of buckling is relevant in many membrane-bounded bodies, particularly biological ones. The implementation of bending is not trivial and it is computationally intricate. In fact, it has been the subject of several reviews.82–84 Since there are many ways to implement bending, for simplicity, we focus on the two most common approaches, one for the continuum approach and another for the discrete approach. We refer the reader to ref. 82 and 83 for bending models and numerical implementations. In line with the continuum approach, one of the most popular bending formulations is that of Helfrich85| |  | (34) |
where κ is the mean curvature and κG is the Gaussian curvature, c0 is the spontaneous curvature (curvature for which the bending energy is minimal). It has been shown that the bending force acting on node i can be written as86,87| | | Fbi = EB[(2κ + c0)(2κ2 − 2κg − c0κ) + 2ΔLBκ]n | (35) |
where n is the outwards normal vector to the surface and ΔLB is the Laplace–Beltrami operator. Calculation of eqn (35) and ΔLBκ can be found in ref. 82, 83 and 88.
Another popular and simplified expression for the bending energy84 often used with the discrete approach is,
| |  | (36) |
where
kb is the spring constant for bending,
Nb is the number of bending springs,
θk is the angle between two outward surface normals of two neighbouring triangular elements that share the edge
k and
θk0 is the equilibrium angle. The corresponding force
eqn (36) is given by
| |  | (37) |
Details on the calculation of

can be found in ref.
62 and
84.
D. Linking fluid to structure
The field of fluid–structure interaction (FSI) revolves around the intricate dynamics and interdependence between two fundamental components: a fluid and a solid. This dynamic interplay gives rise to a range of challenges and opportunities, offering insights into complex phenomena across various scientific and engineering domains, encompassing areas like paint pigments, polymers, gels, proteins, red blood cells flow in the heart, and more.91–93 The essence of FSI lies in understanding how fluids and solids interact dynamically. When a fluid flows around or interacts with a solid structure, it induces forces and deformations in the solid, while the solid, in turn, influences the behaviour of the fluid. This mutual influence creates a complex coupling that is prevalent in numerous natural and engineered systems. However, they pose challenges due to their nonlinear and multiscale nature. The nonlinear interactions between fluid and solid components, coupled with the need to consider multiple scales of phenomena, make analytical solutions often impossible. leading to the development of numerical methods to simultaneously address fluid and structure dynamics. In these methods, interface boundary conditions are of crucial as they ensure consistency and continuity between the fluid and solid domains. They dictate how forces, velocities, and deformations are transmitted across the interface. When considering interfacial conditions, there are two main approaches. The first is the Arbitrary Lagrangian–Eulerian (ALE) method.91 In the ALE method, the mesh used to discretize the fluid domain is allowed to move. Unlike the traditional Eulerian approach where the mesh is fixed in space or the Lagrangian approach where the mesh moves with the fluid, the ALE method allows the motion of the mesh. On the interface between fluid and solid, the velocity and stress should be continuous. The fluid mesh follows the shape of the solid mesh, making it easy to set accurate and efficient boundary conditions at the fluid–solid interface. Yet, when solids undergo significant deformations, re-meshing is often needed to prevent mesh tangling which can affect the mesh motion. This process of mesh regeneration can be challenging during simulations. As an alternative the (IBM) was proposed57 using a non-boundary fitting method. The IBM uses two independent meshes for fluid and solid components. The solid boundaries are immersed in the fluid mesh, and forces from the solid are spread into the fluid. This eliminates the need for the fluid mesh to conform to the solid boundaries.
The mechanics of the solid and fluid flow need to be solved. This can be done in two ways: a partitioned way where the structural mechanics and flow equations are solved separately or a monolithic way where they are solved simultaneously. FSI problems using the LBM often use the IBM as a coupling algorithm. This allows software modularity and different, possibly more efficient algorithms can be used to solve the structural mechanics.
This section will discuss the technical details of IBM and its coupling with the LBM and is primarily driven by ref. 25, 57, 94 and 95. Other coupling techniques such as the stress integration approach96 and friction coupling approach29,97–99 are briefly mentioned. The IBM was selected due to its efficiency and popularity. It was first proposed by Peskin to study blood flow in the heart57,100 using vortex methods. The fluid is solved on a stationary mesh, while the immersed solids are modelled using a flexible moving mesh. This mesh is not tied to the fixed structure of the fluid mesh. Information is exchanged between the fluid and solid mesh through nodal interpolation. Two-way coupling implies that both the fluid and the immersed structures influence each other. The motion and forces of the fluid impact the immersed structures, and, conversely, the motion and forces of the immersed structures affect the fluid through an effect force density and can prevent fluid penetration in the solid. IBM has been used in the simulation of jellyfish,101 blood flow18,102,103 and platelet migration.104 We refer the reader to ref. 57 and 105 for a more detail description of IBM and applications.
Firstly, one can start a description of IBM through a Lagrangian perspective. The immersed structure is characterised as a parametric surface, denoted as X(p, q, r, t). This means that the shape and position of the structure are defined by curvilinear coordinates (p, q, r) varying in a 3D space, with the additional temporal parameter t representing time. Curvilinear coordinates are particularly useful for describing complex shapes or deformations that may not align with a Cartesian coordinate system (e.g. fluid domain). In contrast, The fluid domain is described by coordinates which are fixed in space and provide a frame of reference independent of the motion of the fluid i.e. Eulerian coordinates denoted by x. Ref. 57,95 defines the force density g(x, t) exerted by the structure on the fluid as
| |  | (42) |
This force is distributed then used by the momentum equation of the surrounding fluid nodes.
δ(
x) is the delta function
δ(
x)
δ(
y)
δ(
z) where
x,
y,
z are the Cartesian components of the position vector
x. Likewise, the structural velocity
v(
X(
p,
q,
r,
t),
t) is updated by interpolating the neighbouring fluid velocities
u(
x,
t) as
| |  | (43) |
Note that
eqn (43) represents the continuity of velocity on the fluid–solid boundary.
The idea of IBM coupling is shown in Fig. 7 where the black dots represent fluid nodes, and magenta dots represent the solid structure. How many nodes are used for the interpolation and their weights depend on δ(x). For instance, Fig. 7(a) illustrates that the velocity of the magenta node X will be interpolated from the surrounding four black fluid nodes within the shaded square frame. Likewise, in Fig. 7(b) the structural force will spread to the four surrounding nodes.
 |
| | Fig. 7 IBM two-way fluid–solid coupling. (a) The solid velocity v(X,t) is interpolated from neighbouring fluid nodes within the shaded square box. The contribution from a fluid node is weighted by the δ(x) function. (b) The solid force g(x,t) will spread to the local fluid nodes as a force density. We see that the fluid node x will receive a force contribution from the magenta nodes within the shaded area as the magenta nodes will spread the force to the nearest four black nodes. As x is the nearest fluid node to the magenta nodes in the shaded area, it will receive the force from them. The spread of the force among fluid nodes is given by the δ(x) function. The number of neighbouring nodes to spread the force can vary. Inspired by ref. 62. | |
1. Spatial and temporal discretization.
Implementing the IBM requires both spatial and temporal discretization of eqn (42) and (43), is needed for the numerical implementation of the IBM. Following ref. 57 and 94, we address the discretization in space first, then proceed to discuss the selection of δ(x), and, finally the discretization in time.
The discretization in space of the Eulerian grid, denoted by gx is a uniform and regular grid in x, y, z coordinates, e.g., x = (xj, yj, zj)Δx, where Δx is the spacing, (xj, yj, zj) are the components of the position in each direction. This discretization also matches the discretization used in the LBM, which leads to Δx = δx and Δt = δt. Equally, the discretization of the Lagrangian grid, denoted by Gs, is the set of (p, q, r) of the form (pkδp, qkδq, rkδr), where (pk, qk, rk) are integers. Ref. 57 recommended that  to prevent fluid penetration/leaking. However, ref. 62 systematically studied mesh ratio between solid and fluid for small deformations, e.g.,
  and concluded that a range of approximately (0.5, 1.5) is enough to prevent fluid penetration/leading without notably affecting the results. Nonetheless, if large deformations occurs that the mesh should be refined accordingly to capture these deformations. Resuming, the force spreading eqn (42) becomes
| |  | (44) |
where
F(
p,
q,
r,
t) is the force density from the solid structures. As in ref.
94, let us define

.

can be viewed as the integration of the force density
F over the element of volume d
v = Δ
pΔ
qΔ
r, which is the force term applied to each node. The Lagrangian nodes of the solid can be indexed as
i without losing generality.
Eqn (44) is then simplified to
| |  | (45) |
where
Xi is the position of the
i-th Lagrangian node.
Eqn (43) is simplified to
| |  | (46) |
In the LBM, the time and spatial step in LB units are usually assumed unity,
e.g., Δ
t = 1, Δ
x = 1, respectively. Thus,
eqn (46) is simplified to
| |  | (47) |
ref.
57 demonstrated that the
δΔ(
x) function must adhere to specific constraints and properties to ensure consistent calculation of mass, force, and torque from both Eulerian and Lagrangian point of view. Here, we assumed that
δΔ(
x) expressed through the scalar function
ϕ(
x)
| | | δΔ(x) = ϕ(x)ϕ(y)ϕ(z), | (48) |
where (
x,
y,
z) are the three components of the position vector
x. We do not delve into the specifics of the
ϕ(
x) function. Rather, our intention is to highlight the frequently utilised four-point interpolation function, which is,
| | 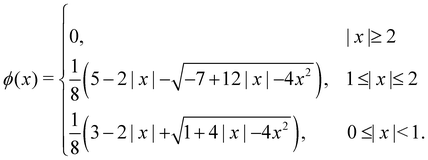 | (49) |
Ref.
57 showed that
ϕ(
x) can be accurately estimated using a straightforward formula
| |  | (50) |
However,
eqn (49) is much faster as it involves evaluating polynomial functions rather than the cos(
x) function. Given that the delta function is used to transfer quantities between the solid and the fluid, the choice of its regularisation determines the accuracy of the IBM. Certain properties have to be satisfied in a discrete way by the discrete version of the delta function, to ensure the conservation of force, mass and torque, or to prevent void jumps of variables on the grid nodes.
106 Often three or four-grid approximations are sufficient to satisfy the necessary discrete conditions. Linear interpolation is too simplistic of an approximation and does not lead to the conservation of the physical quantities. Studies of the stability of different regularised delta functions and smoothing techniques can be found in ref.
106–108.
Because the fluid and solid are solved in an alternating fashion, the IBM follows a partitioned approach. To achieve a temporal discretization scheme with second-order accuracy, ref. 57,95 suggested an integration scheme based midpoint rule.57 For the sake of simplicity, the solution at time step n will be denoted by a superscript on the variable. We can then consider the solid nodal position Xni at time step n, the intermediate position at time step  is calculated using
| |  | (51) |
Using the updated solid nodal position at the

time step, the force acting on the structure can be evaluated as
| |  | (52) |
where we take the gradient of the energy function
W. Next, the structure force

will be spread out into the fluid through
| |  | (53) |
For specific 2D simulations (
e.g. sedimentation) an area scaling factor
Ab can be used in
eqn (53).
109 Using the force density

in the LBM forcing scheme (
e.g.eqn (8)), we can then stream and collide using
eqn (7) and then calculate velocity

using
eqn (9). Finally, the solid position at time
n + 1 is updated as
| |  | (54) |
We recall that we use Δ
t = 1 and Δ
x = 1 in the above equations.
2. Lubrication corrections.
When the gap between particles or between particles and the wall is equal to or less than the resolution of the discretization, the fluid flow can no longer be resolved in this region. In most cases this happens when the gap is less than one lattice spacing. To solve this, there are two alternative solutions. The first one is to use a refined mesh for the entire fluid system (or just near the region in question if possible). This would lead to a more expensive simulation. Depending on the problem a slightly finer mesh might prove to be enough. The second approach is to introduce a lubrication force that mimics the repulsive force of the fluid being squeezed out of the gap. This second approach is computationally more manageable. This idea has been incorporated into the LBM,110–112 using lubrication theory. The lubrication force between two rigid spheres is| |  | (55) |
μ is the dynamic viscosity of the fluid, where r is the radius of the spheres, s is the dimensionless gap s = R/r − 2 where R is the central distance between two spheres. xij is the position vector difference between sphere i and j, defined as xij = xi − xj, ![[x with combining circumflex]](https://www.rsc.org/images/entities/b_i_char_0078_0302.gif) ij is the unit vector. u is the sphere's velocity. Eqn (55) can also be extended to the case where a sphere approaches a stationary wall or object by setting uj = 0.
ij is the unit vector. u is the sphere's velocity. Eqn (55) can also be extended to the case where a sphere approaches a stationary wall or object by setting uj = 0.
For deformable bodies, a repulsive force between any two nodes of two meshes in close proximity is sufficient.113 This force is zero for node-to-node distances larger than one lattice constant and increases as 1/r2 at smaller distances
where
dij is the distance between the two nodes
i and
j,
κint is a constant regulating the strength and
gintji = −
gintij.
3. Other coupling schemes.
Here we discuss only the no-slip boundary conditions between fluid and structure, motivated by ref. 94, which consists of imposing velocity and force continuity along the interface| |  | (56) |
where uf and us are the fluid and solid velocity,  is the fluid–solid boundary and σij is the stress tensor with superscript f and s meaning fluid and solid, respectively. nj is the surface normal. In the IBM, the solid velocity is interpolated from the fluid, as seen in eqn (43), while the force is spread into the fluid, as shown in eqn (42). Alternatively, the inverse method can be used.96,114 In this approach, we initially apply the fluid stress to the structure, subsequently solve for the structural response, and ultimately enforce the structural velocity as a boundary condition on the fluid. This technique is referred to as the stress integration approach.96,115 The total force acting on the structure is
| |  | (57) |
where dA is the differential area over the interface. The stress tensor σij is given by| | | σij = −pδij + ρν(ui,j + uj,i). | (58) |
The pressure term p is usually assumed to follow an ideal gas law p = ρcs2. Following ref. 116, the deviatoric shear stress in the LBM τij := ρν(ui,j + uj,i) can be evaluated as| |  | (59) |
where  is the relaxation time for the LBM. α represents the discrete lattice speed, fneqα is the non-equilibrium part of the density distribution defined as fneqα = fα − feqα with feqα calculated from eqn (6). ξα is the discretized velocity vector. Using the stress computed from the LBM through eqn (58) and (59), the force exerted on the structure can be calculated by taking the dot product between the surface normal and the stress tensor, using the second equation in (56).
In soft matter systems, the flows are often at low Reynolds numbers. Therefore, it is appropriate to Stokes friction force to couple the immersed solids and fluids.97–99,117 In ref. 98, polymer monomers are treated as points with a friction force
where
ζ is the friction coefficient, which might differ from the one provided by Einstein's diffusion relation.
us,
uf are solid point and local fluid velocities, respectively. Ref.
97 notes that
uf can be estimated through interpolation from the nearest neighbouring fluid nodes. The solid will experience a friction force
Fζ, among other forces such as elastic, to determine its motion. Notice that in order to conserve momentum, a force of equal magnitude but opposite direction −
Fζ is applied to the neighbouring fluid nodes. For example, ref.
97 and
98 uses a force density −
Fζ/δ
x3. Tuning might be necessary for an appropriate choice of the friction coefficient to reduce the effect of slip.
Lastly, while in this section we focus on the simulation of membrane-bound particles such as capsules using primarily the IBM, recent works have also used the IBM to simulate droplets.70,118,119
IV. Fluid–fluid based methods
This section gives an overview of widely multicomponent (different fluids) models for studying droplets and emulsions using the LBM as seen in ref. 25, 35, 120 and 121. These have applications in several fields, such as for example in injet printing.122 The LBM facilitates the relatively seamless integration of inter-particle forces, forming interfaces between components. However, these forces are often simplified to save time in numerical simulations. Various models have been modified and improved to explore different parameters and reduce issues. Despite these efforts, no single model is perfect for all situations. First, we present the multicomponent formulation of each method and then we explain how frustrated coalescence can be achieved.
A. Colour modelling
Colour modelling was among the early multicomponent models developed as seen in ref. 123. This model is an extension of a basic lattice-gas cellular automaton (LGCA) that handles two immiscible components with surface tension. Instead of the usual indistinguishable particles, it uses two distinct particles labelled as red and blue. The model follows rules similar to the standard LGCA, ensuring that collisions maintain the count of red and blue particles. This modification enables the simulation of immiscible fluids and incorporates surface tension effects within the LGCA framework. Yet, additional rules are introduced to promote the clustering of similar colours and generate surface tension effects. Following this, the model was integrated into the LBM in ref. 124 and later, in ref. 125 the model underwent changes to accommodate variations in viscosity and density ratios. Another key development was proposed in ref. 126, namely, to add a recolouring step which significantly reduces the computational requirements while minimising the spurious currents and removing the lattice pinning effect.127,128 The model works by introducing the distribution function for each of the fluid components fα,k(x,t), where k is the component index. The discrete LBM equation is given by| | | fα,k(x + ξαΔt,t + Δt) = fα,k(x,t) + Ωα,k(x,t), | (61) |
where Ωα,k is the multistage collision operator expressed as| | | Ωα,k = [Ω(1)α,k + Ω(2)α,k]Ω(3)α,k. | (62) |
Each has a distinct aim:
• Ω(1)α,k is the normal single-phase collision operator for each component;
• Ω(2)α,k is the perturbation operator, generating the interfacial tension;
• Ω(3)α,k is the recolouring operator responsible for phase separation.
Macroscopic quantities are obtained by calculating the standard moments of fα,k(x,t):
| |  | (63) |
where
ρ =
Σkρk. Consequently, the velocity
u is referred to as the colour-blind velocity. The perturbation step, responsible for creating surface tension at the interface between two fluids
i.e. components, is expressed as:
| |  | (64) |
where ∇
ρ is the colour gradient,
Ak regulates the intensity of the surface tension and
Bα are constants unique to the D
NQ
n set. For the D2Q9 velocity set,
Bα are given by
| |  | (65) |
Likewise, for the D3Q19 velocity set,
Bα are given by
| |  | (66) |
where
χ is a free parameter: values for
Bα and
χ are derived in ref.
129. Calculation of partial derivatives is necessary for ∇
ρ and it has been shown
130 that the following isotropic central difference contributes to enhancing numerical stability and lowering the discretization error,
| |  | (67) |
where
j runs through the spatial coordinates. Lastly, one just needs to do the recolouring. In ref.
123 this involves the minimisation of the work,
W, which is given by
| | | W(fr,fb) = −∇ρ·q(fr,fb), | (68) |
where
q is the local or colour flux
| |  | (69) |
Nevertheless, this recolouring method may lead to pinning. This was corrected in ref.
126 by enabling the blending of red and blue components through symmetric colour distribution concerning the colour gradient. The particle distributions after recolouring are given as
| |  | (70) |
where

is used to manage the thickness of the interface,

where

is the post-collision state after
Ω(1)α,k and
Ω(2)α,k have been applied. The term cos(
θα) is conveniently expressed as
| |  | (71) |
The total zero-velocity equilibrium distribution function

is given by
| |  | (72) |
where the weights
ϕα (along with
wα) are lattice dependent.
131,132 Further modification of the recolouring step in
eqn (70) to improve spurious velocities, lattice pinning and convergence was done first in ref.
131. Furthermore,
θα is the angle between ∇
ρ and
ξα. Finally, the streaming step is carried for each colour.
The advantages of the colour model include its ease of extension beyond two components. Moreover, it provides free control over both the surface tension and thus, the interface thickness. Recent advancements have enabled the simulations of fluids with high density133 and viscosity ratios.134 One possible limitation, contingent on the modelling needs, is the absence of a direct connection to thermodynamics. Another downside involves the creation of undesired velocities at curved interfaces, a phenomenon commonly observed in various other fluid–fluid models.
Frustrated coalescence.
In colour modelling, a repulsive force has been used to prevent the coalescence of immiscible droplets.135–137 This repulsive force term (operating exclusively on the fluids interfaces) can be introduced to account for any near-contact forces acting between droplets that are closer than the lattice spacingwhere Ah[h(x)] is the parameter controlling the strength of this repulsive force, n is a unit normal to the interface and  is a function proportional to the phase field
  which confines the repulsive force to the interface. A graphical representation of this force is shown in Fig. 8. Ah[h(x)] can be set equal to a constant A if h ≤ hmin, it decays as f−3 if hmin < h ≤ hmax and it is equal to zero if h > hmax. For example in ref. 137, hmin = 2 and hmax = 4 lattice spacing. Despite the possibility of other functional forms, this one is generally adequate to prevent droplet coalescence and, more significantly, to accurately describe the physics at various length scales. The repulsive force leads to
| |  | (74) |
which is the NS momentum equation for a multicomponent system, with a surface-localised repulsive term, expressed through the potential function ∇π. Including extra forces to frustrate coalescence can in principle be used for any multicomponent method, as will be discussed in the following sections.
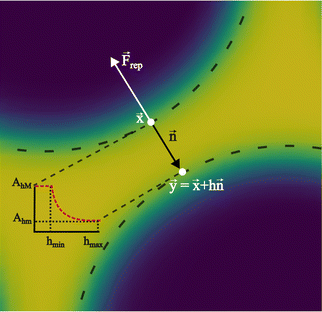 |
| | Fig. 8 Near contact forces representation. Mesoscale modelling of the interactions at the point of contact of two immiscible fluid droplets. The repulsive force is denoted by Frep, and the unit vector n = −∇ρ/|∇ρ| is perpendicular to the fluid interface. The dotted line follows the fluid interface outermost boundary, and the vectors x and y represent the coordinates taken there. The repulsive parameter maximum and minimum values are AhM and Ahm, respectively. The colours represent the density field i.e. yellow is the continuum fluid and blue is the dispersed (droplets) fluid. | |
B. Free-energy modelling
We introduce a straightforward free-energy LBM for binary liquid mixtures.138,139 In this method, discrete density distributions fk,α for each k-component model the hydrodynamics and the evolution of a phase field, respectively. This approach utilises a Cahn–Hilliard phase field method to represent a scalar determining the fluid's composition. We will describe a model where both the fluid flow and evolution of the scalar phase field are solved with the LBM. However, it is also possible to use a hybrid scheme such that the fluid flow is solved with LBM while the phase field is solved with finite differences which leads to reduced memory requirement and usually a marginal loss of numerical stability.140–143 The scalar not only moves with the flow but also undergoes diffusion to minimise a free-energy functional. The functional includes two components: a double-well potential leading to phase separation and an energy penalty discouraging composition gradients, giving tension to interfaces. The thickness of the interface and its interfacial tension can be specified independently (in terms of α and κϕ as discussed below eqn (83)) which is an important advantage over the pseudopotential models described in the next section.
The distribution function fk,α evolves according to
| |  | (75) |
where
τk specify the relaxation rates. By relating macroscopic values to the density distributions and appropriately choosing the equilibrium distributions
feqk,α, the simulations model the required continuum equations. For the
fk,α field, the macroscopic density and momentum are
| |  | (76) |
and the equilibrium distribution is
| | | feqk,α = Aα + Bαu·ξα + Cαu·u + Dα(u·ξα)2 + Gα,xyξα,xξα,y, | (77) |
where index notation has been used for the last term and summation over repeated
xy indices is implied. The coefficients
Aα,
Bα,
Cα,
Dα and
Gα needs to adhere to conservation constraints, yet these constraints do not uniquely define the coefficients. It is possible to use coefficients that reduce spurious currents.
144 For a D2Q9 velocity set, the full list of coefficients is given in ref.
44 and details for construction on a D3Q19 velocity set are given in ref.
144.
For the phase field, the scalar ϕ specifies the composition of the fluid, and it varies between −1 (continuum phase) and 1 (droplet phase). It is determined from the density distribution by
| |  | (78) |
The continuum equation for ϕ is the Cahn–Hilliard one
| |  | (79) |
where
M is the mobility of the chemical potential
μ. This diffusivity is determined by the relaxation time
τϕ and a free parameter
P according to

, while the chemical potential is determined by the free-energy of the system. The free-energy functional [
ϕ(
x)] is
139| |  | (80) |
The first term gives an ideal gas equation of state, the second term is a double-well potential that causes phase separation with minima at compositions

and the third term sets the interfacial tension by associating an energy penalty for changes in
ϕ with an elastic constant
κϕ. The parameters
A and
B specify the shape of the double-well potential. Two symmetrical phases with
ϕ0 = ±1, are obtained when
A =
B. The strength of the free energy resulting from concentration gradients is governed by the parameter
κϕ. The chemical potential is then given by
| |  | (81) |
The one-dimensional steady-state solution for
ϕ between two infinite domains offers crucial insights into the interface, particularly regarding its thickness and excess free energy. The solution is as follows
139| |  | (82) |
where

is the interfacial thickness of the droplets. The free energy model is also used to study active droplets.
141,145,146
Frustrated coalescence.
Literature on frustrated coalescence using the free energy LBM is scarce. We present a method used by ref. 147 to study the shear thinning of immiscible droplets in a 2D channel driven by flow. It tracks two fields: the phase-field variables representing each droplet's density ϕi where i = 1, …, N is the number of droplets and the fluid velocity field u. The free energy is given by:| |  | (83) |
where the first term represents the double well potential which ensures droplet stability. It yields two minima for ϕi = ϕ0 and ϕi = 0, which represent the inside and outside region of the i-th droplet, respectively. The droplet deformability properties are determined by their surface tension  and can therefore be tuned by changing the value of κϕ in eqn (83). The parameters κϕ and α also determine the interfacial thickness of the droplets
  . The third, final term describes a soft repulsion pushing the droplets apart when they overlap, therefore preventing coalescence. The strength of this repulsion is regulated by the value of the positive constant ε. The dynamics of ϕi is given by
| |  | (84) |
where M is the mobility and  is the chemical potential of the i-th droplet. Eqn (83) and (84) are solved using a combination of the LBM (for the fluid flow) and finite differences (for the phase field) similar to ref. 138 and 148. This may be used for a small number of droplets. As the number of times that eqn (83) and (84) are solved increases the computational cost rapidly as the number of droplets increases. This method is also useful to simulate droplets inside droplets.149
C. Pseudopotential method
The pseudopotential (or Shan–Chen models) first introduced in ref. 150 and 151 as a way to simulate multicomponent and multiphase flows. It works by adding inter-particle interactions resulting in the separation of components. Some instances of applications of pseudopotential models include gravity driven droplets in confined environments152 and transport of H2O in air.153,154 Different fluids in a multicomponent mixture have different molecular forces. The force acts on pairs of molecules located at x and ![[x with combining tilde]](https://www.rsc.org/images/entities/b_i_char_0078_0303.gif) ≠ x. It is also assumed that a higher density ρ(x) of molecules leads to larger forces. The total force is given as an integral over all possible effective interactions as
≠ x. It is also assumed that a higher density ρ(x) of molecules leads to larger forces. The total force is given as an integral over all possible effective interactions as| |  | (85) |
where G(x,![[x with combining tilde]](https://www.rsc.org/images/entities/b_i_char_0078_0303.gif) ) strength of force between two fluid elements at x and x′ and ψ(x) is the pseudopotential, which is a function of the fluid density. Assuming nearest-neighbour interactions at the mesoscopic scale, the effective force on the kth component is given by
) strength of force between two fluid elements at x and x′ and ψ(x) is the pseudopotential, which is a function of the fluid density. Assuming nearest-neighbour interactions at the mesoscopic scale, the effective force on the kth component is given by| |  | (86) |
where G![[k with combining tilde]](https://www.rsc.org/images/entities/i_char_006b_0303.gif) k is a k × k matrix for the molecular interaction strength between fluid components and its sign regulates whether the forces are attractive (negative) or repulsive (positive). Subscript r stands for repulsive. To create immiscible droplets Fkr needs to be repulsive. k and
k is a k × k matrix for the molecular interaction strength between fluid components and its sign regulates whether the forces are attractive (negative) or repulsive (positive). Subscript r stands for repulsive. To create immiscible droplets Fkr needs to be repulsive. k and ![[k with combining tilde]](https://www.rsc.org/images/entities/i_char_006b_0303.gif) are just two different components of the fluid system. For a multicomponent mixture (no multiphase), the diagonal components of the matrix are zero and GAB = GBA for two components A and B. ψk is the pseudopotential (or effective density). The pseudopotential can take different forms. A commonly used form is
are just two different components of the fluid system. For a multicomponent mixture (no multiphase), the diagonal components of the matrix are zero and GAB = GBA for two components A and B. ψk is the pseudopotential (or effective density). The pseudopotential can take different forms. A commonly used form is| |  | (87) |
where ρ0 is a freely chosen reference density, usually unity. ψk(x,t) = ρk can also be used and it is an approximation of eqn (87) at low-density. However, at higher densities, this assumption will lead to numerical instabilities.155 In the absence of attraction between components, the pseudopotential can often be reduced to the physical density for simplicity. Nevertheless, using eqn (87) instead of ψk(x,t) = ρk leads to improved numerical stability.
The pseudopotential model allows for multicomponent multiphase (MCMP) simulations, but, for simplicity, we do not present the variants of pseudopotential MCMP LBM. In what follows, we focus only on the multicomponent variant as it is the most widely used method for immiscible droplets. In ref. 150 and 151, they proposed a simple forcing scheme to include these interactions. Similar to the body force, it is also possible to incorporate the effective force of the interaction potential in the fluid velocity field. Nevertheless, for a multicomponent system, we introduce ueq which is a combined velocity (different from the physical velocity) of different components given by:
| | 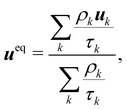 | (88) |
where
ρkuk is the
kth component of momentum and
τk is the relaxation time of the BGK collision operator for the component
k. The barycentric velocity
u of the fluid mixture,
i.e., the physical velocity and the total density are given by
| |  | (89) |
Also, the density and momentum of each component can be calculated using,
| |  | (90) |
For a multi-component system, the time evolution of fk,α(x,t) is given by the discrete Boltzmann equation for each component k (similar to eqn (7)),
| |  | (91) |
The equilibrium distribution is given by
| |  | (92) |
The Guo forcing scheme
156 can be used to implement these forces acting in a fluid as it yields a viscosity-independent surface tension,
157 particularly with the frustrated coalescence mechanism described in the next section. Thus similar to
eqn (8),
| |  | (93) |
where
Fk is the total force acting on component
k. In this case
Fk =
Frk. Different forcing schemes can be used. Additionally, as shown in the next section, the frustrated coalescence mechanism can be introduced as an extra force term. Although we described a model based on the BGK operator, extensions for MRT are possible.
158
The pseudopotential model provides isotropy of the surface tension and spontaneous component separation which improves the numerical efficiency of the simulation. The method is successful because of its simplicity and flexibility in large-scale simulations of complex fluids. The implementation is relatively simple when compared to the other models reported so far. However, it also comes with some nonphysical features such as a diffusing interface and spurious currents.25 Some attempts have also been made to derive a thermodynamically consistent pseudopotential model.159–161 Moreover, it is possible to obtain an effective free energy in the pseudopotential models.162,163
Frustrated coalescence.
To prevent coalescence a multi-range repulsive force is used which acts between the nearest neighbours and the next nearest neighbours.157,164 This force is used in addition to the repulsive component separation force Frk. This means that in eqn (93), Fk = Frk + Fck where Fck is a competing force given by| | 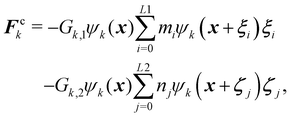 | (94) |
where Gk,1 and Gk,2 regulate the strength of force. It is a competing mechanism (superscript c) where the first term is an attractive force and the second term is a repulsive force between same components. This multi-range potential uses 2 different lattices L1 and L2. In 2D these are the D2Q9 and D2Q25,164 respectively while in 3D they are D3Q41 for L1 and D3Q39 for L2.165 In 2D, it is possible to completely separate the range of the forces i.e. the L1 lattice runs over only on the first belt of neighbours while L2 runs over on the second belt of neighbours. However, in 3D both lattices (D3Q41 and D3Q39) run over to the third belt of neighbours but on different lattice points which is sufficient to prevent droplet coalescence.166 In the competing force Fck, the attractive force must overcome the repulsive force to stabilise droplets, so we set |Gk,1| > |Gk,2|. To obtain the desired repulsive and attractive forces: Gk,1 < 0, Gk,2 > 0, and Gk,![[k with combining macron]](https://www.rsc.org/images/entities/i_char_006b_0304.gif) > 0. For simplicity, we assume: GA,1 = GB,1, GA,2 = GB,2, GA,B = GB,A for the two components A and B.
> 0. For simplicity, we assume: GA,1 = GB,1, GA,2 = GB,2, GA,B = GB,A for the two components A and B.
The computational cost does not increase with the number or size of the droplets by contrast to the colour gradient. Compared to the free energy model where each droplet is a different component, the pseudopotential model performs computationally better. This provides an efficient algorithm for simulating a large number of droplets.167 This is because the repulsion between droplets is based on the density of each LB lattice node. The extra cost comes from using a second lattice to calculate the force. However, this model suffers from spurious velocities caused by an imbalance between the forces. Using a higher order lattice for the streaming can help to reduce these velocities.166 These velocities increase as the viscosity ratio deviates from unity or the surface tension increase. Proper and careful calibration of the G parameters is necessary otherwise the droplet may increase or decrease in size. With this method, it is not possible to vary the surface tension and the interface thickness independently (Fig. 9 and 10).
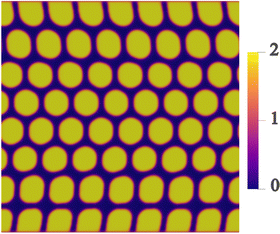 |
| | Fig. 9 Droplets moving in a channel. This was obtained using a free energy LBM and solving eqn (84). Colour depicts  which is ≈2 for droplets (yellow) and ≈0 for the background fluid (black). which is ≈2 for droplets (yellow) and ≈0 for the background fluid (black). | |
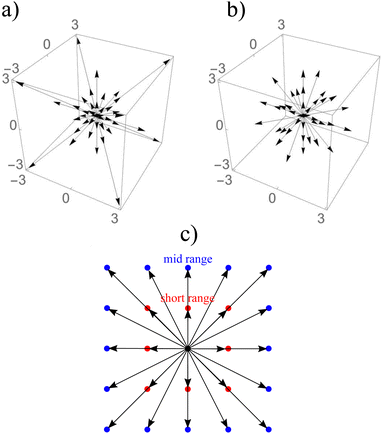 |
| | Fig. 10 (a) The D3Q41 lattice and (b) the D3Q39 lattice. The D3Q41 is a zero-one-three lattice meaning that it is analogous to the Brillouin zones (also referred to as lattice-belts, or lattice-stencils) covered by ξα. The D3Q39 is a zero-one-two-three lattice. (c) The D2Q9 lattice for short-range nodes (red). The D2Q25 lattice for short and mid-range nodes (blue). | |
V. Benchmarks
We now summarise a few simple benchmarks that can be used to test the model implementation in hydrostatic and hydrodynamic conditions. The benchmarks are for one capsule/droplet in shear flow, capsule sedimentation and a test of the Laplace law. We refer the reader to ref. 157 for benchmarks on multiple droplets.
A. Capsule and droplet in shear flow
Shear flow is a common validation flow to test for both droplets168,169 and capsules115,170 (fluid–structure interactions). Here we use capsules as a generic term for membrane-bound particles. This benchmark consists of placing a spherical (circular in 2D) droplet/capsule in shear flow (between two parallel walls with opposite velocities) and allowing it to deform until a steady state regime is reached169 (see Fig. 11). In what follows, we have separated into two sections the shear flow of a droplet and a capsule for clarity.
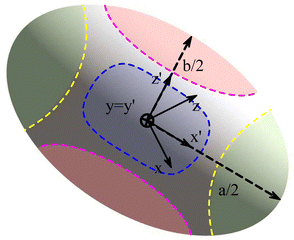 |
| | Fig. 11 The final steady-state shape of droplet/capsule with the major axis, a, the minor axis of deformation, b, and the third axis, c. An additional reference frame (x′, y′, z′) is defined, with the axes corresponding to the deformed droplet principal axes. The different regions of the droplet have been also highlighted for ease of reference: tips (green), belly (red) and sides (blue). Inspired by ref. 169. | |
1. Droplet.
As a droplet deforms in shear flow, the final shape is a result of viscous forces competing with surface tension. The ratio of these forces is the Capillary number,| |  | (95) |
where uw is the wall velocity, H is the distance between walls, R is the radius of the droplet, μ the dynamic viscosity and Γ is the surface tension. Ca is the main parameter that controls the deformation and final shape of the droplet. The final shape is evaluated using the Taylor deformation parameter given by| |  | (96) |
where a and b are the lengths of the major and minor axis, respectively. In the limit of small Capillary numbers (thus small deformations) a steady state is always achieved. In the limit of nearly spherical droplets an analytical solution was first reported in ref. 171 by solving the momentum and continuity equation using the Lorentz reflection method. ref. 171 gives the first order solution DSH (SH stands for the initials of the original authors in ref. 171) for small confinements ratio R/H between two parallel walls171,172| |  | (97) |
where p is the viscosity ratio between the droplet and surrounding fluid, H is the gap between the walls, R is the droplet radius and parameter CSH which depends on the position of the droplet relative to the walls and this value grows when closer to the walls. Ref. 171 performed analytical calculations for which they found that a droplet placed in the middle of the walls (R/H = 0.5) has CSH = 5.699 while a droplet at R/H = 0.125 has CSH = 193.3. Other values at different droplet positions are also reported. Some values have been tested against experiments as shown in ref. 172. The theoretical model given eqn (97) and ref. 171 has an additional term DTaylor obtained from Taylor small-deformation bulk theory173,174 and is given by| |  | (98) |
where Ca is the Capillary number and θ is the angle between reference axis x and major axis a (see Fig. 11) and usually assumed to be π/4 radians as in ref. 172 and 173. Taylor bulk theory173,174 is valid for small deformations and viscosity ratios p close to 1. Furthermore, while this theoretical model predicts that the magnitude of the deformation will scale with the confinement ratio, the shape should remain ellipsoidal.
We highlight that this test can be performed in both 2D and 3D for droplets. For small Ca the deformation parameter is the same for a 2D and 3D droplet (same parameters), while for higher Ca results for 2D and 3D droplets start to deviate. An extensive study of 2D vs. 3D droplets can be found in ref. 175. The methodology presented here is valid for all the fluid–fluid models mentioned in this review.
2. Capsule.
A capsule in shear will also reach a steady state and the main parameter defining the deformation is also the Capillary number now defined as  where ks is the stretching coefficient and has the same physical units as the surface tension Γ. The Taylor deformation parameter is also used to characterise capsules in shear flow. We highlight that the correct constitutive model needs to be used to compare with other literature or analytical results. Results and validation for Hookean constitutive laws can be found in ref. 176–178. For Skalak models we refer the reader to ref. 18, 179 and 180. It is not trivial to obtain analytical results from constitutive models. In most cases, models are validated against other numerical implementations. An analytical result for the Taylor deformation parameter has been found for the neo-Hookean and Skalak laws, eqn (12) and (14) and is given by,18,43,181
| |  | (99) |
where α1 = 0, α2 = 2/3, and α3 = 1/3 are coefficients extracted from the constitutive model. Eqn (99) is only valid for small deformation in Stokes flow (Re < 1). More details can be found in ref. 18.
B. Capsule sedimentation
The process of capsule sedimentation involves placing a capsule in a static fluid and allowing it to accelerate downward under gravity until it reaches a terminal velocity, where the resultant drag force balances the gravitational load (see Fig. 12). We present a simple validation for a confined 2D capsule using the harmonic potential given in eqn (29). The capsule should be rigid. The elastic and bending coefficients can be adjusted to achieve a quasi-rigid state. It is clear that simulating sedimentation of a 2D capsule i.e. a cylinder, will encounter Stokes paradox, which states that there is no drag force on the cylinder in the Stokes regime. However, experiments and approximations have been derived for cylinder sedimentation in the presence of walls. Therefore, this benchmark consists of placing the 2D capsule between 2 vertical parallel walls. The top and bottom boundaries can be walls or periodic but the vertical walls need to be long enough to minimize boundary effects.
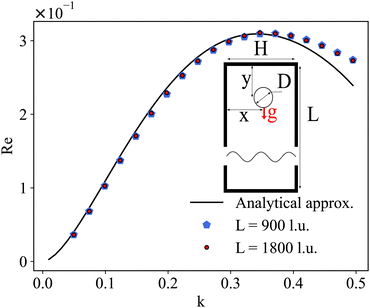 |
| | Fig. 12 Schematic of an initially circular particle of diameter D moving in a channel of length L and width H due to the force of gravity g. The particle is placed at x0 = 0.5H. Terminal velocity Vt against dimensionless size k. The particle has a diameter of 12.5 l.u. and the fluid has a relaxation parameter τ = 1. The analytical approximation corresponds to eqn (100). | |
According to ref. 109, the analytical wall-corrected settling velocity of a 2D particle can be calculated from
| |  | (100) |
where
D is the diameter of the particle,
g is gravitational acceleration,
ρ is the density where s and f stand for solid and fluid, respectively,
μ is the dynamic viscosity and
Λ is the wall correction factor. Subscript
c stands for corrected. Notice that
eqn (100) is obtained by equating the gravitational force per unit length

with the drag force per unit length
Fd =
VcμΛ. Moreover,
eqn (100) is valid for low Reynolds numbers. There are several approximations for
Λ which can be found in ref.
109 and
182. A commonly cited approximation can be found in ref.
183 and
184 where Stokes equation for Newtonian fluids using asymptotic expansion with no-slip boundary conditions on the walls given by
| |  | (101) |
where
k =
D/
H is the dimensionless particle size.
D is the diameter of the particle and
H is the distance between the two vertical walls
i.e., the width of the channel. Ref.
183,184 applied an integral transform which produces a convergent series and allows the boundary conditions to be applied simultaneously. It is generally known that
eqn (101) is valid for
k ∈ [0, 0.5]. Usually,
Λ is only a function of
k for low or very high Reynolds numbers Re. For intermediate values, it is also a function of the Reynolds number. The results for a 2D sedimenting capsule are shown in
Fig. 12 and are in agreement up to
k ≈ 0.4 in the range
k ∈ [0, 0.5]. Note that for a 3D spherical capsule, Stokes' law can be used for validation.
C. Droplet Laplace test
The Laplace test consists of placing a spherical droplet in the centre of a fluid domain and verifying the Laplace law. Laplace law dictates that when the system reaches equilibrium, the pressure difference across the droplet interface ΔP is related to the interfacial tension Γ| |  | (102) |
where R is the radius of the droplet. In 2D the Laplace pressure is  . One should measure the pressure at the droplet centre and then as far away from the centre as possible to prevent undesired effects from affecting the measurements such as spurious velocities. The domain needs to be large enough to prevent the effect of periodic copies (periodic boundaries) or walls (solid boundaries). A linear relationship should be obtained and the slope is the surface tension. As an example, we plot results for a droplet using the pseudopotential method depicted in Fig. 13. Additionally, it is possible to compare the surface tension value to theoretical and numerical values.185 Moreover, other hydrostatic tests such as contact angle test185 (for wetting boundary conditions) can be useful to further check the accuracy of the model.
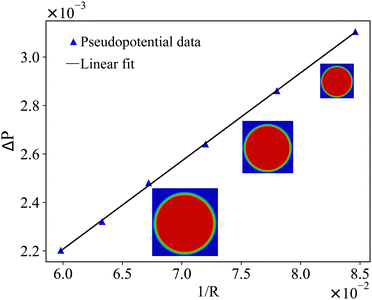 |
| | Fig. 13 Laplace test using the pseudopotential method at equilibrium for Gk,1 = −7.9, Gk,2 = 4.9 (see eqn (94)) and τA = τB = 1. From the linear fit we obtain the surface tension Γ = 0.00367. The images show the steady state of droplets as we vary the radius. | |
VI. Summary and outlook
We reviewed different methods to model fluid-filled objects in flow and addressed some of the advantages, disadvantages, and trade-offs of the different methodologies, as perceived based on our own (necessarily biased) experience and the literature survey. Below, we summarise the main items.
Fluid–fluid models are usually computationally more economical than fluid–structure ones because the interfaces emerge spontaneously from the underlying mesoscale physics and do not require any explicit tracking. The price for this flexibility is a lack of specific control of the mechanical properties of the interfaces, as often required in biological applications. They are also generally affected by spurious currents resulting from lack of sufficient isotropy of the underlying lattice; even though several efficient remedies have been developed over the years, spurious currents remain an issue to be critically monitored.
Both pseudo-potential and free energy must be supplemented with a model for near-contact interactions in order to prevent droplet coalescence, especially under conditions typical of microfluidic experiments. Such near-contact interactions can be implemented very effectively within high-performance LB codes, yielding excellent performances on parallel GPU clusters. For instance, optimized codes running on GPU accelerators can reach GLUPS performance (one billion lattice updates per second) on single GPU machines with a few thousands CUDA cores.186,187 To convey a concrete idea means that one can simulate one millimeter cube material at micron resolution in space and nanosecond resolution in time, over one millisecond timespan in about 106 seconds, namely about two weeks wall clock time. On massively parallel GPU clusters, these figures can be boosted by two orders of magnitude, meaning that the above simulation can be performed in just a few hours of wall-clock time. These numbers open up exciting perspectives for the computational design of new soft materials.24,188 Fluid–fluid models readily extend to three dimensions by simply enlarging the set of discrete velocities, although at a correspondingly increased computational cost (especially on account of memory access).189
As mentioned above, fluid–structure models are computationally intensive but offer a more accurate control of the mechanical properties of the interfaces, hence of the shape of the resulting droplets and capsules. They also provide a significant latitude in shape-space and do not suffer from significant spurious current effects. Since the structural dynamics is explicitly taken into account, the computational cost raises with the number of droplets and the number of degrees of freedom per droplet/capsule, setting the case for a judicious trade-off between physical fidelity and computational viability. Significant progress over the recent years has led to near-GLUPS performance on multi-million grid sizes with embedded propellers.190
Finally, three-dimensional extensions are demanding not only in terms of computational resources, but also in terms of model and programming complexity, such as the switch to finite-element representations of the internal degrees of freedom.
By and large, it appears fair to say that the major progress of LB models over the last decade, both in its fluid–fluid and fluid–structure versions has come to a point of enabling the computational study of new smart materials, both passive and active. Furthermore, the capability of tracking droplets and capsules in realistically complex geometries, such as the human body, may disclose new exciting perspectives in computational microphysiology and medicine.191
Conflicts of interest
There are no conflicts to declare.
Acknowledgements
We acknowledge financial support from the Portuguese Foundation for Science and Technology (FCT) under the contracts: PTDC/FIS-MAC/28146/2017 (LISBOA-01-0145-FEDER-028146), EXPL/FIS-MAC/0406/2021 (DOI: 10.54499/EXPL/FIS-MAC/0406/2021), UIDB/00618/2020 (DOI: 10.54499/UIDB/00618/2020), UIDP/00618/2020 (DOI: 10.54499/UIDP/00618/2020), 2020.08525.BD and DL57/2016/CP1479/CT0057 (DOI: 10.54499/DL57/2016/CP1479/CT0057). SS wishes to acknowledge financial support from the ERC-PoC grants DROPTRACK (contract number 101081171).
References
- S. L. Anna and H. C. Mayer, Phys. Fluids, 2006, 18, 121512 CrossRef.
- H. Liu and Y. Zhang, Phys. Fluids, 2011, 23, 082101 CrossRef.
- J. R. Clausen and C. K. Aidun, Phys. Fluids, 2010, 22, 123302 CrossRef.
- Y. Sui, Y. T. Chew and H. T. Low, Int. J. Mod. Phys. C, 2007, 18, 993–1011 CrossRef.
-
P.-G. Gennes, F. Brochard-Wyart, D. Quéré, et al., Capillarity and wetting phenomena: drops, bubbles, pearls, waves, Springer, 2004 Search PubMed.
-
J. N. Israelachvili, The Handbook of Surface Imaging and Visualization, CRC Press, 2022, pp. 793–816 Search PubMed.
- W. Qi and P. B. Weisensee, Phys. Fluids, 2020, 32, 067110 CrossRef CAS.
- T. Truong, N. Bansal and B. Bhandari, Food Bioprocess Technol., 2014, 7, 3416–3428 CrossRef CAS.
- E. Dickinson, Food Hydrocolloids, 2012, 28, 224–241 CrossRef CAS.
- D. J. McClements, Sustainable Food Proteins, 2023, 1, 101–132 CrossRef.
- D. A. Fedosov, M. Peltomäki and G. Gompper, Soft Matter, 2014, 10, 4258–4267 RSC.
- J. Dupire, M. Socol and A. Viallat, Proc. Natl. Acad. Sci. U. S. A., 2012, 109, 20808–20813 CrossRef CAS PubMed.
- C. K. Aidun and J. R. Clausen, Annu. Rev. Fluid Mech., 2010, 42, 439–472 CrossRef.
- R. Benzi, S. Succi and M. Vergassola, Phys. Rep., 1992, 222, 145–197 CrossRef.
- T. Ye, D. Pan, C. Huang and M. Liu, Phys. Fluids, 2019, 31, 011301 CrossRef.
- H. Zhu, Z. Zhou, R. Yang and A. Yu, Chem. Eng. Sci., 2008, 63, 5728–5770 CrossRef CAS.
- T. Gao and H. H. Hu, J. Comput. Phys., 2009, 228, 2132–2151 CrossRef CAS.
- T. Krüger, F. Varnik and D. Raabe, Comput. Math. Appl., 2011, 61, 3485–3505 CrossRef.
- K. Sugiyama, S. Ii, S. Takeuchi, S. Takagi and Y. Matsumoto, Comput. Mech., 2010, 46, 147–157 CrossRef.
- W. Gao and Y. Chen, Int. J. Heat Mass Transfer, 2019, 135, 158–163 CrossRef CAS.
- G. Hou, J. Wang and A. Layton, Commun. Comput. Phys., 2012, 12, 337–377 CrossRef.
- U. D. Schiller, T. Krüger and O. Henrich, Soft Matter, 2018, 14, 9–26 RSC.
- S. Karimnejad, A. A. Delouei, H. Basağaoğlu, M. Nazari, M. Shahmardan, G. Falcucci, M. Lauricella and S. Succi, Commun. Comput. Phys., 2022, 32, 899–950 CrossRef.
-
S. Succi, The Lattice Boltzmann Equation: For Complex States of Flowing Matter, Oxford University Press, 2018 Search PubMed.
-
T. Krüger, H. Kusumaatmaja, A. Kuzmin, O. Shardt, G. Silva and E. M. Viggen, The Lattice Boltzmann Method, Springer International Publishing, 2017 Search PubMed.
- M. L. Manning, Phys. Rev. Lett., 2023, 130, 130002 CrossRef CAS PubMed.
- R. C. V. Coelho, N. A. M. Araújo and M. M. Telo da Gama, Soft Matter, 2022, 18, 7642–7653 RSC.
- A. Beer and G. Ariel, Movement Ecology, 2019, 7, 1–17 CrossRef PubMed.
-
B. Dunweg and A. J. C. Ladd, Advanced Computer Simulation Approaches for Soft Matter Sciences III, Springer Berlin Heidelberg, 2009, pp. 89–166 Search PubMed.
- U. Frisch, B. Hasslacher and Y. Pomeau, Phys. Rev. Lett., 1986, 56, 1505–1508 CrossRef CAS PubMed.
- Y. H. Qian, D. D'Humières and P. Lallemand, Europhys. Lett., 1992, 17, 479–484 CrossRef.
- X. He and L.-S. Luo, J. Stat. Phys., 1997, 88, 927–944 CrossRef.
- A. K. Gunstensen, D. H. Rothman, S. Zaleski and G. Zanetti, Phys. Rev. A: At., Mol., Opt. Phys., 1991, 43, 4320–4327 CrossRef CAS PubMed.
- S. Chen and G. D. Doolen, Annu. Rev. Fluid Mech., 1998, 30, 329–364 CrossRef.
-
S. Succi, The Lattice Boltzmann Equation: For Fluid Dynamics and Beyond, Oxford Science Publications, 2001 Search PubMed.
- A. J. C. Ladd, J. Fluid Mech., 1994, 271, 311–339 CrossRef CAS.
- X. He, S. Chen and R. Zhang, J. Comput. Phys., 1999, 152, 642–663 CrossRef CAS.
- A. Cal, S. Succi, A. Cancelliere, R. Benzi and M. Gramignani, Phys. Rev. A: At., Mol., Opt. Phys., 1992, 45, 5771–5774 CrossRef PubMed.
- X. He, S. Chen and G. D. Doolen, J. Comput. Phys., 1998, 146, 282–300 CrossRef.
- S. A. Bawazeer, S. S. Baakeem and A. A. Mohamad, Arch. Comput. Methods Eng., 2021, 28, 4405–4423 CrossRef.
- K. Sun, T. Wang, M. Jia and G. Xiao, Phys. A, 2012, 391, 3895–3907 CrossRef.
- L. Chen, Q. Kang, Y. Mu, Y.-L. He and W.-Q. Tao, Int. J. Heat Mass Transfer, 2014, 76, 210–236 CrossRef CAS.
- D. Barthès-Biesel and J. M. Rallison, J. Fluid Mech., 1981, 113, 251 CrossRef.
-
H. Huang, M. C. Sukop and X.-Y. Lu, Multiphase lattice Boltzmann methods: theory and application, John Wiley and Sons, Inc., Chichester, West Sussex, 2015 Search PubMed.
- P. Asinari, Phys. Rev. E: Stat., Nonlinear, Soft Matter Phys., 2008, 78, 016701 CrossRef PubMed.
- P. Lallemand and L.-S. Luo, Phys. Rev. E: Stat., Nonlinear, Soft Matter Phys., 2000, 61, 6546–6562 CrossRef CAS PubMed.
- B. M. Boghosian, J. Yepez, P. V. Coveney and A. Wager, Proc. R. Soc. London, Ser. A, 2001, 457, 717–766 CrossRef.
- A. Mazloomi M, S. S. Chikatamarla and I. V. Karlin, Phys. Rev. Lett., 2015, 114, 174502 CrossRef PubMed.
- W. Lei, C. Xie, T. Wu, X. Wu and M. Wang, Sci. Rep., 2019, 9, 1453 CrossRef PubMed.
- J. Zhang, P. C. Johnson and A. S. Popel, Phys. Biol., 2007, 4, 285–295 CrossRef CAS PubMed.
- W. R. Dodson and P. Dimitrakopoulos, J. Fluid Mech., 2009, 641, 263–296 CrossRef.
- Y. Imai, T. Omori, Y. Shimogonya, T. Yamaguchi and T. Ishikawa, J. Biomech., 2016, 49, 2221–2228 CrossRef PubMed.
- T. M. Fischer, Biophys. J., 2004, 86, 3304–3313 CrossRef CAS PubMed.
- T. Omori, T. Ishikawa, D. Barthès-Biesel, A.-V. Salsac, J. Walter, Y. Imai and T. Yamaguchi, Phys. Rev. E: Stat., Nonlinear, Soft Matter Phys., 2011, 83, 041918 CrossRef CAS PubMed.
- D.-K. Sun and Z. Bo, Int.
J. Heat Mass Transfer, 2015, 80, 139–149 CrossRef.
- D. C. Bottino, J. Comput. Phys., 1998, 147, 86–113 CrossRef.
- C. S. Peskin, Acta Numer., 2002, 11, 479–517 CrossRef.
- J. M. Charrier, S. Shrivastava and R. Wu, J. Strain Anal. Eng. Des., 1989, 24, 55–74 CrossRef.
- S. Shrivastava and J. Tang, J. Strain Anal. Eng. Des., 1993, 28, 31–51 CrossRef.
-
H. Goldstein, C. Poole and J. Safko, Classical Mechanics, Pearson, 3rd edn, 2002 Search PubMed.
- G. R. Lázaro, I. Pagonabarraga and A. Hernández-Machado, Eur. Phys. J. E: Soft Matter Biol. Phys., 2017, 40, 77 CrossRef PubMed.
-
T. Krüger, Computer Simulation Study of Collective Phenomena in Dense Suspensions of Red Blood Cells under Shear, Vieweg+Teubner Verlag, 2012 Search PubMed.
- D. Barthès-Biesel, A. Diaz and E. Dhenin, J. Fluid Mech., 2002, 460, 211–222 CrossRef.
- E. Lac, D. Barthès-Biesel, N. A. Pelekasis and J. Tsamopoulos, J. Fluid Mech., 2004, 516, 303–334 CrossRef CAS.
- Z. Hashemi, M. Rahnama and S. Jafari, Sci. Iran., 2015, 22, 1877–1890 Search PubMed.
- S. Ramanujan and C. Pozrikidis, J. Fluid Mech., 1998, 361, 117–143 CrossRef CAS.
- C. Armstrong and Y. Peng, Phys. Rev. E, 2021, 103, 023309 CrossRef CAS PubMed.
- R. Skalak, A. Tozeren, R. P. Zarda and S. Chien, Biophys. J., 1973, 13, 245–264 CrossRef CAS PubMed.
- Y. Sui, Y. T. Chew, P. Roy, Y. P. Cheng and H. T. Low, Phys. Fluids, 2008, 20, 112106 CrossRef.
- F. Pelusi, F. Guglietta, M. Sega, O. Aouane and J. Harting, Phys. Fluids, 2023, 35, 082126 CrossRef CAS.
- K. Vahidkhah, S. L. Diamond and P. Bagchi, Biophys. J., 2014, 106, 2529–2540 CrossRef CAS PubMed.
- J. Charrier, S. Shrivastava and R. Wu, J. Strain Anal. Eng. Des., 1987, 22, 115–125 CrossRef.
-
C. L. Armstrong, PhD thesis, Old Dominion University, 2021.
- J. Li, G. Lykotrafitis, M. Dao and S. Suresh, Proc. Natl. Acad. Sci. U. S. A., 2007, 104, 4937–4942 CrossRef CAS PubMed.
- G. E. K. D. A. Fedosov and B. Caswell, Biophys. J., 2010, 98, 2215–2225 CrossRef PubMed.
- K. Ichi Tsubota, S. Wada and T. Yamaguchi, Comput. Methods Programs Biomed., 2006, 83, 139–146 CrossRef PubMed.
-
C. Pozrikidis, Computational hydrodynamics of capsules and biological cells, CRC Press, 2010 Search PubMed.
- T. Wu and J. J. Feng, Biomicrofluidics, 2013, 7, 044115 CrossRef PubMed.
- M. Nakamura, S. Bessho and S. Wada, Int. J. Numer. Method. Biomed. Eng., 2013, 29, 114–128 CrossRef PubMed.
- S. Barns, M. A. Balanant, E. Sauret, R. Flower, S. Saha and Y. Gu, Biomed. Eng. Online, 2017, 16, 1–21 CrossRef PubMed.
- M. Nakamura, S. Bessho and S. Wada, Int. J. Numer. Method. Biomed. Eng., 2014, 30, 42–54 CrossRef PubMed.
- A. Guckenberger, M. P. Schraml, P. G. Chen, M. Leonetti and S. Gekle, Comput. Phys. Commun., 2016, 207, 1–23 CrossRef CAS.
- A. Guckenberger and S. Gekle, J. Phys.: Condens. Matter, 2017, 29, 203001 CrossRef PubMed.
- X. Bian, S. Litvinov and P. Koumoutsakos, Comput. Methods Appl. Mech. Eng., 2020, 359, 112758 CrossRef.
- W. Helfrich, Z. Naturforsch., 1973, 28, 693–703 CrossRef CAS PubMed.
- O.-Y. Zhong-can and W. Helfrich, Phys. Rev. A: At., Mol., Opt. Phys., 1989, 39, 5280–5288 CrossRef PubMed.
- K. Sinha and M. D. Graham, Phys. Rev. E: Stat., Nonlinear, Soft Matter Phys., 2015, 92, 042710 CrossRef PubMed.
- M. Reuter, S. Biasotti, D. Giorgi, G. Patanè and M. Spagnuolo, Comput. Graph., 2009, 33, 381–390 CrossRef.
-
C. Zhang and T. Chen, Proceedings 2001 International Conference on Image Processing (Cat. No. 01CH37205), Thessaloniki, Greece, 2001, pp. 935–938.
- Z. Gou, X. Ruan, F. Huang and X. Fu, Comput. Methods Biomech. Biomed. Eng., 2019, 22, 465–474 CrossRef PubMed.
- C. W. Hirt, A. A. Amsden and J. L. Cook, J. Comput. Phys., 1974, 14, 227–253 CrossRef.
- F.-B. Tian, H. Dai, H. Luo, J. F. Doyle and B. Rousseau, J. Comput. Phys., 2014, 258, 451–469 CrossRef CAS PubMed.
-
C. Duprat and H. A. Shore, Fluid-structure interactions in low-Reynolds-number flows, Royal Society of Chemistry, 2016 Search PubMed.
-
J. Tan, PhD thesis, Lehigh University, 2015.
- C. S. Peskin and D. M. McQueen, J. Comput. Phys., 1989, 81, 372–405 CrossRef.
- S. Kollmannsberger, S. Geller, A. Düster, J. Tölke, C. Sorger, M. Krafczyk and E. Rank, Int. J. Numer. Meth. Eng., 2009, 79, 817–845 CrossRef.
- P. Ahlrichs and B. Dünweg, Int. J. Mod. Phys. C, 1998, 09, 1429–1438 CrossRef.
- P. Ahlrichs and B. Dünweg, J. Chem. Phys., 1999, 111, 8225–8239 CrossRef CAS.
- C. W. Hsu and Y.-L. Chen, J. Chem. Phys., 2010, 133, 034906 CrossRef PubMed.
- C. S. Peskin, J. Comput. Phys., 1972, 10, 252–271 CrossRef.
- G. Herschlag and L. Miller, J. Theor. Biol., 2011, 285, 84–95 CrossRef PubMed.
- J. Zhang, P. C. Johnson and A. S. Popel, J. Biomech., 2008, 41, 47–55 CrossRef PubMed.
- Y. Liu and W. K. Liu, J. Comput. Phys., 2006, 220, 139–154 CrossRef.
- L. M. Crowl and A. L. Fogelson, Int. J. Numer. Method. Biomed. Eng., 2010, 26, 471–487 CrossRef PubMed.
- R. Mittal and G. Iaccarino, Annu. Rev. Fluid Mech., 2005, 37, 239–261 CrossRef.
-
T. Kajishima and K. Taira, Computational fluid dynamics: incompressible turbulent flows, Springer, 2016 Search PubMed.
- S. J. Shin, W.-X. Huang and H. J. Sung, Int. J. Numer. Methods Fluids, 2008, 58, 263–286 CrossRef.
- X. Yang, X. Zhang, Z. Li and G.-W. He, J. Comput. Phys., 2009, 228, 7821–7836 CrossRef.
- S. Ghosh and J. M. Stockie, Commun. Comput. Phys., 2015, 18, 380–416 CrossRef.
- A. J. C. Ladd and R. Verberg, J. Stat. Phys., 2001, 104, 1191–1251 CrossRef CAS.
- A. J. C. Ladd, Phys. Fluids, 1997, 9, 491–499 CrossRef CAS.
- A. S. Nunes, R. C. V. Coelho, V. C. Braz, M. M. Telo da Gama and N. A. M. Araújo, Commun. Comput. Phys., 2023, 33, 1–21 CrossRef.
- M. Gross, T. Krueger and F. Varnik, Soft Matter, 2014, 10, 4360 RSC.
- Y. Kwon, Eng. Comput., 2006, 23, 860–875 CrossRef.
- R. M. MacMeccan, J. R. Clausen, G. P. Neitzel and C. K. Aidun, J. Fluid Mech., 2009, 618, 13–39 CrossRef.
- T. Krüger, F. Varnik and D. Raabe, Phys. Rev. E: Stat., Nonlinear, Soft Matter Phys., 2009, 79, 046704 CrossRef PubMed.
-
B. Dünweg and A. J. C. Ladd, Advanced Computer Simulation Approaches for Soft Matter Sciences III, Springer Berlin Heidelberg, Berlin, Heidelberg, 2009 Search PubMed.
- P. Li and J. Zhang, Int. J. Numer. Method. Biomed. Eng., 2019, 35, e3200 CrossRef PubMed.
- D. Taglienti, F. Guglietta and M. Sbragaglia, Phys. Rev. Fluids, 2023, 8, 013603 CrossRef.
-
F. F. Jackson, PhD thesis, University of Leeds, 2021.
-
O. Shardt, PhD thesis, University of Alberta, 2014.
- F. F. Jackson, K. J. Kubiak, M. C. Wilson, M. Molinari and V. Stetsyuk, Langmuir, 2019, 35, 9564–9571 CrossRef CAS PubMed.
- D. Rothman and J. Keller, J. Stat. Phys., 1988, 52, 1119–1127 CrossRef.
- A. Gunstensen, D. Rothman, S. Zaleski and G. Zanetti, Phys. Rev. A: At., Mol., Opt. Phys., 1991, 43, 4320 CrossRef CAS PubMed.
- D. Grunau, S. Chen and K. Eggert, Phys. Fluids A, 1993, 5, 2557–2562 CrossRef CAS.
- M. Latva-Kokko and D. Rothman, Phys. Rev., 2005, 71, 056702 CAS.
- K. Connington and T. Lee, J. Mech. Sci. Technol., 2012, 26, 3857–3863 CrossRef.
- X. Shan, Phys. Rev. E: Stat., Nonlinear, Soft Matter Phys., 2006, 73, 047701 CrossRef PubMed.
- S. Leclaire, M. Reggio and J.-Y. Trépanier, Appl. Math. Model., 2012, 36, 2237–2252 CrossRef.
- H. Liu, A. Valocchi and Q. Kang, Phys. Rev., 2012, 85, 046309 Search PubMed.
- T. Reis and T. N. Phillips, J. Phys. A: Math. Theor., 2007, 40, 4033–4053 CrossRef CAS.
- S. Leclaire, A. Parmigiani, O. Malaspinas, B. Chopard and J. Latt, Phys. Rev. E, 2017, 95, 033306 CrossRef PubMed.
- Y. Ba, H. Liu, Q. Li, Q. Kang and J. Sun, Phys. Rev. E, 2016, 94, 023310 CrossRef PubMed.
- H. Liu, L. Wu, Y. Ba, G. Xi and Y. Zhang, J. Comput. Phys., 2016, 327, 873–893 CrossRef CAS.
- A. Montessori, M. Lauricella and S. Succi, Philos. Trans. R. Soc., A, 2019, 377, 20180149 CrossRef CAS PubMed.
- A. Montessori, M. Lauricella, N. Tirelli and S. Succi, J. Fluid Mech., 2019, 872, 327–347 CrossRef CAS.
- A. Montessori, A. Tiribocchi, F. Bonaccorso, M. Lauricella and S. Succi, Philos. Trans. R. Soc., A, 2020, 378, 20190406 CrossRef CAS PubMed.
- M. Swift, E. Orlandini, W. Osborn and J. Yeomans, Phys. Rev., 1996, 54, 5041–5052 CAS.
- A. J. Briant and J. M. Yeomans, Phys. Rev. E: Stat., Nonlinear, Soft Matter Phys., 2004, 69, 031603 CrossRef CAS PubMed.
- D. Marenduzzo, E. Orlandini, M. E. Cates and J. M. Yeomans, Phys. Rev. E: Stat., Nonlinear, Soft Matter Phys., 2007, 76, 031921 CrossRef CAS PubMed.
- R. C. V. Coelho, N. A. M. Araújo and M. M. Telo da Gama, Philos. Trans. R. Soc., A, 2021, 379, 20200394 CrossRef CAS PubMed.
- G. R. Lázaro, A. Hernández-Machado and I. Pagonabarraga, Soft Matter, 2014, 10, 7207–7217 RSC.
- G. R. Lázaro, A. Hernández-Machado and I. Pagonabarraga, Soft Matter, 2014, 10, 7195–7206 RSC.
- C. M. Pooley and K. Furtado, Phys. Rev. E: Stat., Nonlinear, Soft Matter Phys., 2008, 77, 046702 CrossRef CAS PubMed.
- A. Tiribocchi, M. Durve, M. Lauricella, A. Montessori, D. Marenduzzo and S. Succi, Nat. Commun., 2023, 14, 1096 CrossRef CAS PubMed.
- R. C. V. Coelho, H. R. J. C. Figueiredo and M. M. Telo da Gama, Phys. Rev. Res., 2023, 5, 033165 CrossRef CAS.
- M. Foglino, A. Morozov, O. Henrich and D. Marenduzzo, Phys. Rev. Lett., 2017, 119, 208002 CrossRef CAS PubMed.
- A. Tiribocchi, N. Stella, G. Gonnella and A. Lamura, Phys. Rev. E: Stat., Nonlinear, Soft Matter Phys., 2009, 80, 026701 CrossRef CAS PubMed.
- A. Tiribocchi, A. Montessori, M. Lauricella, F. Bonaccorso, S. Succi, S. Aime, M. Milani and D. A. Weitz, Nat. Commun., 2021, 12, 82 CrossRef CAS PubMed.
- X. Shan and H. Chen, Phys. Rev., 1993, 47, 1815 Search PubMed.
- X. Shan and H. Chen, Phys. Rev., 1994, 49, 2941 CAS.
- Q. Kang, D. Zhang and S. Chen, J. Fluid Mech., 2005, 545, 41–66 CrossRef.
- J. Bao and L. Schaefer, Appl. Math. Model., 2013, 37, 1860–1871 CrossRef.
- C. Stiles and Y. Xue, Comput. Fluids, 2016, 131, 81–90 CrossRef CAS.
- M. Sbragaglia, R. Benzi, L. Biferale, S. Succi, K. Sugiyama and F. Toschi, Phys. Rev., 2007, 75, 026702 CAS.
- Z. Guo, C. Zheng and B. Shi, Phys. Rev., 2002, 65, 046308 Search PubMed.
- L. Fei, A. Scagliarini, A. Montessori, M. Lauricella, S. Succi and K. H. Luo, Phys. Rev. Fluids, 2018, 3, 104304 CrossRef.
- Z.-H. Chai and T.-S. Zhao, Acta Mech. Sin., 2012, 28, 983–992 CrossRef CAS.
- Q. Li and K. Luo, Appl. Therm. Eng., 2014, 72, 56–61 CrossRef.
- J. Huang, X. Yin and J. Killough, Phys. Rev. E, 2019, 100, 053304 CrossRef CAS PubMed.
- C. Peng, L. F. Ayala and O. M. Ayala, J. Comput. Phys., 2021, 429, 110018 CrossRef CAS.
- M. Sbragaglia, H. Chen, X. Shan and S. Succi, Europhys. Lett., 2009, 86, 24005 CrossRef.
- M. Sbragaglia and X. Shan, Phys. Rev. E, 2011, 84, 036703 CrossRef CAS PubMed.
- R. Benzi, M. Sbragaglia, A. Scagliarini, P. Perlekar, M. Bernaschi, S. Succi and F. Toschi, Soft Matter, 2015, 11, 1271–1280 RSC.
- S. S. Chikatamarla and I. V. Karlin, Phys. Rev. E: Stat., Nonlinear, Soft Matter Phys., 2009, 79, 046701 CrossRef PubMed.
- D. P. F. Silva, R. C. V. Coelho, M. M. T. da Gama and N. A. M. Araújo, Phys. Rev. E, 2023, 107, 035106 CrossRef CAS PubMed.
- R. C. V. Coelho, D. P. F. Silva, A. M. R. Maschio, M. M. Telo da Gama and N. A. M. Araújo, Phys. Fluids, 2023, 35, 013304 CrossRef CAS.
- A. Yiotis, J. Psihogios, M. Kainourgiakis, A. Papaioannou and A. Stubos, Colloids Surf., A, 2007, 300, 35–49 CrossRef CAS.
- G. Soligo, A. Roccon and A. Soldati, Meccanica, 2020, 55, 371–386 CrossRef.
- C. D. Eggleton and A. S. Popel, Phys. Fluids, 1998, 10, 1834–1845 CrossRef CAS PubMed.
- M. Shapira and S. Haber, Int. J. Multiphase Flow, 1990, 16, 305–321 CrossRef CAS.
- A. Vananroye, P. Puyvelde and P. Moldenaers, J. Rheol., 2007, 51, 139–153 CrossRef CAS.
- G. Taylor, Proc. R. Soc. London, Ser. A, 1932, 138, 41–48 CAS.
- G. Taylor, Proc. R. Soc. London, Ser. A, 1934, 146, 501–523 CAS.
- S. Afkhami, P. Yue and Y. Renardy, Phys. Fluids, 2009, 21, 072106 CrossRef.
- Z. Gou, F. Huang, X. Ruan and X. Fu, Commun. Comput. Phys., 2018, 24, 234–252 Search PubMed.
- A. Rahmat, J. Meng, D. R. Emerson, C.-Y. Wu, M. Barigou and A. Alexiadis, Microfluid. Nanofluid., 2021, 25, 1 CrossRef CAS.
- Y. Sui, Y. T. Chew, P. Roy, X. B. Chen and H. T. Low, Phys. Rev. E: Stat., Nonlinear, Soft Matter Phys., 2007, 75, 066301 CrossRef CAS PubMed.
- M. Wouters, O. Aouane, T. Krüger and J. Harting, Phys. Rev. E, 2019, 100, 033309 CrossRef CAS PubMed.
- F. Guglietta, M. Behr, L. Biferale, G. Falcucci and M. Sbragaglia, Soft Matter, 2020, 16, 6191–6205 RSC.
- D. Barthès-Biesel, J. Fluid Mech., 1980, 100, 831–853 CrossRef.
- A. Ben Richou, A. Ambari, M. Lebey and J. Naciri, Chem. Eng. Sci., 2005, 60, 2535–2543 CrossRef CAS.
- O. H. Faxen, Proc. Roy. Irish Acad., 1946, 187, 1–13 Search PubMed.
-
J. Happel and H. Brenner, Low Reynolds number hydrodynamics: with special applications to particulate media, Springer, 1st edn, 1983 Search PubMed.
- E. Montellà, B. Chareyre, S. Salager and A. Gens, MethodsX, 2020, 7, 101090 CrossRef PubMed.
- F. Bonaccorso, M. Lauricella, A. Montessori, G. Amati, M. Bernaschi, F. Spiga, A. Tiribocchi and S. Succi, Comput. Phys. Commun., 2022, 277, 108380 CrossRef CAS.
- A. Tiribocchi, A. Montessori, G. Amati, M. Bernaschi, F. Bonaccorso, S. Orlandini, S. Succi and M. Lauricella, J. Chem. Phys., 2023, 158, 104101 CrossRef CAS PubMed.
- S. Succi, G. Amati, M. Bernaschi, G. Falcucci, M. Lauricella and A. Montessori, Comput. Fluids, 2019, 181, 107–115 CrossRef.
- G. Falcucci, G. Amati, P. Fanelli, V. K. Krastev, G. Polverino, M. Porfiri and S. Succi, Nature, 2021, 595, 537–541 CrossRef CAS PubMed.
- J. Latt, O. Malaspinas, D. Kontaxakis, A. Parmigiani, D. Lagrava, F. Brogi, M. B. Belgacem, Y. Thorimbert, S. Leclaire, S. Li, F. Marson, J. Lemus, C. Kotsalos, R. Conradin, C. Coreixas, R. Petkantchin, F. Raynaud, J. Beny and B. Chopard, Comput. Math. Appl., 2021, 81, 334–350 CrossRef.
-
P. Coveney, R. Highfield and V. Ramakrishnan, Virtual You: How Building Your Digital Twin Will Revolutionize Medicine and Change Your Life, Princeton University Press, 2023 Search PubMed.
|
| This journal is © The Royal Society of Chemistry 2024 |
Click here to see how this site uses Cookies. View our privacy policy here.  Open Access Article
 *ab,
Ignacio
Pagonabarraga
 cd,
Sauro
Succi
 ef,
Margarida M.
Telo da Gama
 ab and
Nuno A. M.
Araújo
 *ab
*ab


 is the forcing term which includes both external forces and intra/intermolecular fluid forces. There are different force schemes in LBM used to implement these terms. Several articles and reviews have been written about the advantages/disadvantages of each one (see ref. 40–42). A popular one, the Guo forcing scheme,43 is given by


 as shown in ref. 58 and 59. Lastly, one just needs to compute the principle stretch ratios, λ1 and λ2, from the eigenvalues of the two-dimensional right Cauchy–Green tensor, G = FTF, whose components are given by


![[l with combining circumflex]](https://www.rsc.org/images/entities/b_i_char_006c_0302.gif) ij =
ij = ![[l with combining right harpoon above (vector)]](https://www.rsc.org/images/entities/i_char_006c_20d1.gif) ij/l is the vector of unit length between nodes i and j.
ij/l is the vector of unit length between nodes i and j.


 can be found in ref. 62 and 84.
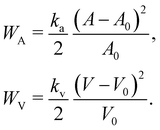
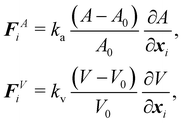
 and
and  may be found in ref. 62. While A can be calculated by summing the elemental areas (e.g. triangles), the calculation of volume requires a more sophisticated approach. An efficient way to calculate V is described in ref. 89. We can also express eqn (38) as,90
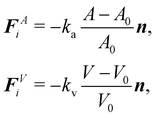


 to prevent fluid penetration/leaking. However, ref. 62 systematically studied mesh ratio between solid and fluid for small deformations, e.g.,
  and concluded that a range of approximately (0.5, 1.5) is enough to prevent fluid penetration/leading without notably affecting the results. Nonetheless, if large deformations occurs that the mesh should be refined accordingly to capture these deformations. Resuming, the force spreading eqn (42) becomes
 .
.  can be viewed as the integration of the force density F over the element of volume dv = ΔpΔqΔr, which is the force term applied to each node. The Lagrangian nodes of the solid can be indexed as i without losing generality. Eqn (44) is then simplified to


 is calculated using
 time step, the force acting on the structure can be evaluated as
 will be spread out into the fluid through
 in the LBM forcing scheme (e.g.eqn (8)), we can then stream and collide using eqn (7) and then calculate velocity
  using eqn (9). Finally, the solid position at time n + 1 is updated as

![[x with combining circumflex]](https://www.rsc.org/images/entities/b_i_char_0078_0302.gif) ij is the unit vector. u is the sphere's velocity. Eqn (55) can also be extended to the case where a sphere approaches a stationary wall or object by setting uj = 0.
ij is the unit vector. u is the sphere's velocity. Eqn (55) can also be extended to the case where a sphere approaches a stationary wall or object by setting uj = 0.

 is the fluid–solid boundary and σij is the stress tensor with superscript f and s meaning fluid and solid, respectively. nj is the surface normal. In the IBM, the solid velocity is interpolated from the fluid, as seen in eqn (43), while the force is spread into the fluid, as shown in eqn (42). Alternatively, the inverse method can be used.96,114 In this approach, we initially apply the fluid stress to the structure, subsequently solve for the structural response, and ultimately enforce the structural velocity as a boundary condition on the fluid. This technique is referred to as the stress integration approach.96,115 The total force acting on the structure is

 is the relaxation time for the LBM. α represents the discrete lattice speed, fneqα is the non-equilibrium part of the density distribution defined as fneqα = fα − feqα with feqα calculated from eqn (6). ξα is the discretized velocity vector. Using the stress computed from the LBM through eqn (58) and (59), the force exerted on the structure can be calculated by taking the dot product between the surface normal and the stress tensor, using the second equation in (56).


 is used to manage the thickness of the interface,
  where
where  is the post-collision state after Ω(1)α,k and Ω(2)α,k have been applied. The term cos(θα) is conveniently expressed as
 is given by
 is a function proportional to the phase field
  which confines the repulsive force to the interface. A graphical representation of this force is shown in Fig. 8. Ah[h(x)] can be set equal to a constant A if h ≤ hmin, it decays as f−3 if hmin < h ≤ hmax and it is equal to zero if h > hmax. For example in ref. 137, hmin = 2 and hmax = 4 lattice spacing. Despite the possibility of other functional forms, this one is generally adequate to prevent droplet coalescence and, more significantly, to accurately describe the physics at various length scales. The repulsive force leads to


 , while the chemical potential is determined by the free-energy of the system. The free-energy functional [ϕ(x)] is139
 and the third term sets the interfacial tension by associating an energy penalty for changes in ϕ with an elastic constant κϕ. The parameters A and B specify the shape of the double-well potential. Two symmetrical phases with ϕ0 = ±1, are obtained when A = B. The strength of the free energy resulting from concentration gradients is governed by the parameter κϕ. The chemical potential is then given by

 is the interfacial thickness of the droplets. The free energy model is also used to study active droplets.141,145,146

 and can therefore be tuned by changing the value of κϕ in eqn (83). The parameters κϕ and α also determine the interfacial thickness of the droplets
  . The third, final term describes a soft repulsion pushing the droplets apart when they overlap, therefore preventing coalescence. The strength of this repulsion is regulated by the value of the positive constant ε. The dynamics of ϕi is given by
 is the chemical potential of the i-th droplet. Eqn (83) and (84) are solved using a combination of the LBM (for the fluid flow) and finite differences (for the phase field) similar to ref. 138 and 148. This may be used for a small number of droplets. As the number of times that eqn (83) and (84) are solved increases the computational cost rapidly as the number of droplets increases. This method is also useful to simulate droplets inside droplets.149
![[x with combining tilde]](https://www.rsc.org/images/entities/b_i_char_0078_0303.gif) ≠ x. It is also assumed that a higher density ρ(x) of molecules leads to larger forces. The total force is given as an integral over all possible effective interactions as
≠ x. It is also assumed that a higher density ρ(x) of molecules leads to larger forces. The total force is given as an integral over all possible effective interactions as
![[x with combining tilde]](https://www.rsc.org/images/entities/b_i_char_0078_0303.gif) ) strength of force between two fluid elements at x and x′ and ψ(x) is the pseudopotential, which is a function of the fluid density. Assuming nearest-neighbour interactions at the mesoscopic scale, the effective force on the kth component is given by
) strength of force between two fluid elements at x and x′ and ψ(x) is the pseudopotential, which is a function of the fluid density. Assuming nearest-neighbour interactions at the mesoscopic scale, the effective force on the kth component is given by
![[k with combining tilde]](https://www.rsc.org/images/entities/i_char_006b_0303.gif) k is a k × k matrix for the molecular interaction strength between fluid components and its sign regulates whether the forces are attractive (negative) or repulsive (positive). Subscript r stands for repulsive. To create immiscible droplets Fkr needs to be repulsive. k and
k is a k × k matrix for the molecular interaction strength between fluid components and its sign regulates whether the forces are attractive (negative) or repulsive (positive). Subscript r stands for repulsive. To create immiscible droplets Fkr needs to be repulsive. k and ![[k with combining tilde]](https://www.rsc.org/images/entities/i_char_006b_0303.gif) are just two different components of the fluid system. For a multicomponent mixture (no multiphase), the diagonal components of the matrix are zero and GAB = GBA for two components A and B. ψk is the pseudopotential (or effective density). The pseudopotential can take different forms. A commonly used form is
are just two different components of the fluid system. For a multicomponent mixture (no multiphase), the diagonal components of the matrix are zero and GAB = GBA for two components A and B. ψk is the pseudopotential (or effective density). The pseudopotential can take different forms. A commonly used form is


![[k with combining macron]](https://www.rsc.org/images/entities/i_char_006b_0304.gif) > 0. For simplicity, we assume: GA,1 = GB,1, GA,2 = GB,2, GA,B = GB,A for the two components A and B.
> 0. For simplicity, we assume: GA,1 = GB,1, GA,2 = GB,2, GA,B = GB,A for the two components A and B.

 which is ≈2 for droplets (yellow) and ≈0 for the background fluid (black).


 where ks is the stretching coefficient and has the same physical units as the surface tension Γ. The Taylor deformation parameter is also used to characterise capsules in shear flow. We highlight that the correct constitutive model needs to be used to compare with other literature or analytical results. Results and validation for Hookean constitutive laws can be found in ref. 176–178. For Skalak models we refer the reader to ref. 18, 179 and 180. It is not trivial to obtain analytical results from constitutive models. In most cases, models are validated against other numerical implementations. An analytical result for the Taylor deformation parameter has been found for the neo-Hookean and Skalak laws, eqn (12) and (14) and is given by,18,43,181


 with the drag force per unit length Fd = VcμΛ. Moreover, eqn (100) is valid for low Reynolds numbers. There are several approximations for Λ which can be found in ref. 109 and 182. A commonly cited approximation can be found in ref. 183 and 184 where Stokes equation for Newtonian fluids using asymptotic expansion with no-slip boundary conditions on the walls given by

 . One should measure the pressure at the droplet centre and then as far away from the centre as possible to prevent undesired effects from affecting the measurements such as spurious velocities. The domain needs to be large enough to prevent the effect of periodic copies (periodic boundaries) or walls (solid boundaries). A linear relationship should be obtained and the slope is the surface tension. As an example, we plot results for a droplet using the pseudopotential method depicted in Fig. 13. Additionally, it is possible to compare the surface tension value to theoretical and numerical values.185 Moreover, other hydrostatic tests such as contact angle test185 (for wetting boundary conditions) can be useful to further check the accuracy of the model.


![[thin space (1/6-em)]](https://www.rsc.org/images/entities/char_2009.gif) 480 faces.
480 faces.

