 Open Access Article
Catalytic fabrication of graphene, carbon spheres, and carbon nanotubes from plastic waste
Eslam Salama *a,
Safaa Mohameda,
Mahmoud Samyb,
Kenneth Mensah
 c,
Mona Ossmana,
Marwa F. Elkadyde and
Hassan Shokry Hassanfg
aEnvironment and Natural Materials Research Institute (ENMRI), City of Scientific Research and Technological Applications (SRTA-City), New Borg El-Arab City, Alexandria 21934, Egypt. E-mail: esalama@srtacity.sci.eg
bDepartment of Public Works Engineering, Faculty of Engineering, Mansoura University, Mansoura 35516, Egypt
cDepartment of Civil and Environmental Engineering, University of Maine, Orono, ME 04469, USA
dFabrication Technology Research Department, Advanced Technology and New Materials Research Institute (ATNMRI), City of Scientific Research and Technological Applications (SRTA-City), New Borg El-Arab City, Alexandria 21934, Egypt
eChemical and Petrochemical Engineering Department, Egypt-Japan University of Science and Technology (E-JUST), New Borg El-Arab City, Alexandria 21934, Egypt
fElectronic Materials Research Department, Advanced Technology and New Materials Research Institute (ATNMRI), City of Scientific Research and Technological Applications (SRTA-City), New Borg El-Arab City, Alexandria 21934, Egypt
gEnvironmental Engineering Department, Egypt-Japan University of Science and Technology, New Borg El-Arab City, Alexandria 21934, Egypt
First published on 9th January 2024
Abstract
In this study, we reported sustainable and economical upcycling methods for utilizing plastics such as polyethylene terephthalate (PET) and polypropylene (PP) compiled from the garbage of a residential area as cheap precursors for the production of high-value carbon materials such as graphene (G), carbon spheres (CS), and carbon nanotubes (CNTs) using different thermal treatment techniques. Graphene, carbon spheres, and carbon nanotubes were successfully synthesized from PET, PP, and PET, respectively via catalytic pyrolysis. XRD and FTIR analyses were conducted on the three materials, confirming the formation of carbon and their graphitic structure. TEM images displayed uniform and consistent morphological structures of the fabricated materials. EDX data confirmed that the prepared carbon-based materials only contained carbon and oxygen without any significant contaminations. XPS results revealed significant peaks in the C 1s spectra associated with sp2 and sp3 hybridized carbon for the three materials. BET spectra showed that the prepared CNTs (54.872 m2 g−1) have the highest surface area followed by carbon spheres (54.807 m2 g−1). The thermal stability of graphene surpassed both carbon spheres and carbon nanotubes which is mainly attributed to the stronger inter-molecular bonds of graphene. Based on the characterization of the prepared materials, these materials are promising to be utilized in environmental remediation applications due to their high carbon content, low cost, and high surface area.
1. Introduction
The yearly massive production of plastics and the improper management of these plastics have received global concern owing to the adverse environmental impacts related to the presence of plastics in the environment.1 Plastics are stable and can remain in the environment for hundreds of years without degradation.2 Due to the low density of plastic waste, it can transfer to water streams and sometimes people dispose of plastic waste directly in water sources as one of the unsuitable management approaches.3 The presence of plastics in water streams can harm aquatic organisms and may lead to their death.4 Landfills and incinerators are another improper management method of plastic waste. Around 79% of plastic waste is dumped into landfills which could result in the leaching of plastics into the soil and groundwater.5 Therefore, plants can adsorb plastics which can result in the transfer of these plastics to humans via the food chain.5 Additionally, plastics' surfaces can carry toxic contaminants.6 On the other hand, managing plastic wastes by incineration can result in the pollution of air and the increase of greenhouse gas emissions.7 Accordingly, it is imperative to develop an effective management approach for plastic waste that overcomes the problems associated with traditional management techniques.The utilization of plastic waste as a precursor for the synthesis of value-added products (e.g., carbonaceous materials) has magnetized great solicitude as a sustainable management approach. Plastic wastes contain high carbon content with limited inorganic impurities which qualify them to be used as a precursor for the production of carbon rich materials.8 Different carbonaceous materials can be prepared from plastic waste such as graphene,9 activated carbon10 and carbon nanotubes.11 The conversion of plastics to the aforementioned valuable materials can contribute to the sustainable management of plastic wastes leading to the control of the environmental hazards related to plastics and reducing the reliance on landfilling and incineration for managing plastics. The produced carbonaceous materials are inexpensive because of the abundance of plastic waste, and they can be produced on a large-scale. Therefore, the produced carbon-rich materials can be employed in various environmental remediation technologies such as adsorption,12 persulfate activation,13 periodate activation,14 photocatalysis15 and Fenton16 techniques. The utilization of carbonaceous materials prepared from plastic waste in the aforementioned treatment systems can reduce the treatment cost and facilitate the full-scale of these techniques.
In this study, mineral water plastic bottles, plastic drinking cups, and plastic yogurt cups were utilized as precursors for the preparation of carbon-rich materials such as graphene, carbon spheres and carbon nanotubes. The chemical composition, chemical structure, functional groups and morphology of the prepared materials were investigated using energy dispersive X-ray spectroscopy, X-ray diffraction, Fourier transform infrared spectroscopy and transmission electron microscopy, respectively. Further, chemical states and thermal stability of the prepared materials were studied by X-ray photoelectron spectroscopy and thermogravimetric analysis. Moreover, the surface area of the synthesized materials was estimated using BET surface area analyzer.
2. Experimental
2.1 Materials
Post-consumer waste plastic bottles, plastic drinking cups, and plastic yogurt cups were obtained from the garbage of a residential area in Alexandria, Egypt. All the gathered plastics were washed, shredded, and dried at room temperature prior their usage in the preparation process. Iron chloride anhydrous (FeCl3, MW = 162.21), citric acid anhydrous crystalline (C6H8O7, MW = 192.13), and nickel chloride hexahydrate (NiCl2·2H2O, MW = 237.71) were purchased from Fisher Bio-Reagents, USA. Aluminum nitrate nonahydrate (Al(NO3)3·9H2O, ASC reagent 98%, MW = 375.13) and Hydrofluoric acid [HF] (48 wt% in H2O, ≥99.99%) were purchased from Sigma Aldrich, USA. Stöber silica spheres were obtained from Sharc Matter, UK.2.2 Synthesis of graphene from plastic waste
Catalytic pyrolysis is a promising method to fabricate high-value carbon materials while reducing oxygenated compounds, lowering viscosity, and increasing stability.17 Firstly, a catalyst was prepared by citric acid combustion method, where 8.11 g FeCl3, 18.756 g Al(NO3)3·9H2O, and 9.606 g citric acid were mixed at an equal molar ratio. The mixture was kept on continuous stirring on a hotplate at 120 °C until a viscous orange gel was obtained. Then, the gel was dried at 90 °C overnight. Next, the powder was calcined in a muffle furnace at 350 °C for 3 h. Finally, the catalyst was grounded into a fine powder.5 g of the prepared catalyst was added to 10 g of the washed and shredded polyethylene terephthalate (PET) = plastic cups inside a stainless-steel reactor. Then, the reactor was placed in a muffle furnace at 800 °C for 2 h in the presence of nitrogen flow as shown in Fig. 1a.18 The produced black char was grinned using a mortar for further characterization.
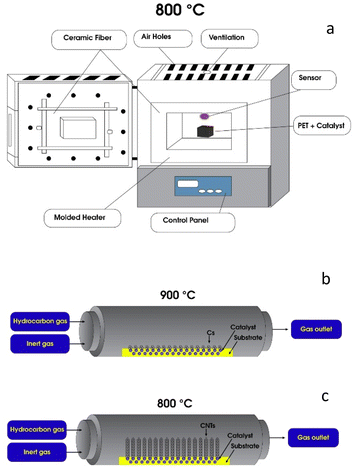 | ||
| Fig. 1 Schematic illustration of catalytic fabrication of graphene (a), synthesis of carbon spheres (b), and fabrication carbon nanotubes (c). | ||
2.3 Synthesis of carbon spheres (CS) from plastic waste
In order to fabricate carbon spheres, 4 g of the washed and shredded polypropylene (PP) yogurt cups contained in a quartz boat was placed in the first stage of a tube-furnace reactor (NABERTHERM R 120/500/13 Compact tube furnace) and 2 gm of Stöber silica spheres (performs as a catalyst) was placed in the middle of the second stage of the tube-furnace reactor as shown in Fig. 1b. The temperature of the second stage reactor was elevated from room temperature to 900 °C with an increase rate of 10 °C min−1 under a flow of nitrogen.Once the temperature of the catalyst stage reached 900 °C, the temperature of the pyrolysis stage of the furnace was ramped up to 500 °C at a ramping rate of 10 °C min−1. Polypropylene gas flow generated from the pyrolysis of PP waste flushed the Stöber spheres' surface for 1 h. After, the tube furnace was allowed to cool to room temperature. The yield of this process is silica/carbon material. Carbon spheres were obtained by removing the Stöber silica template, using 10 mL of 10% HF solution for 24 h.19 Finally, carbon spheres were carefully filtered and washed with distilled water several times until a neutral pH of the water was reached.
2.4 Synthesis of carbon nanotubes (CNTs) from plastic waste
A metal-based catalyst was prepared by the wet-impregnation method, where nickel and iron were employed as the base metals as shown in Fig. 1c. Nickel-based catalysts have been shown to improve the efficiency of the pyrolysis process, as higher amounts of hydrogen are produced.20 Ni to Fe molar ratio of 1![[thin space (1/6-em)]](https://www.rsc.org/images/entities/char_2009.gif) :
:![[thin space (1/6-em)]](https://www.rsc.org/images/entities/char_2009.gif) 3 was selected based on the previous studies.21–23 13.68 g of NiCl2·6H2O and 24.33 g of FeCl3 were firstly dissolved in ethanol and then placed on a hotplate at 50 °C under a continuous stirring, followed by the addition of a support material (metal loading) until 10 wt% was achieved. The mixture was stirred for 4 h and dried at 100 °C in an oven overnight. Afterward, the dry catalyst powder was calcined at 800 °C in a muffle for 3 h in air with a heating rate of 10 °C min−1.11 4 g of the washed and shredded PET plastic bottles were thermally treated using a catalytic pyrolysis tube-furnace.24–26 The sample was placed in a quartz boat in the first stage of the tube-furnace. 2 g of the catalyst was placed in a quartz boat in the second stage, where the catalysis temperature was set to 800 °C. Carrier gas (nitrogen) was supplied at a flow rate of 100 mL min−1. Once the catalyst achieved the desired temperature, the plastic sample was heated to 500 °C with an increase rate of 30 °C min−1. The final pyrolysis temperature was held for 20 min and then the furnace was allowed to cool.
3 was selected based on the previous studies.21–23 13.68 g of NiCl2·6H2O and 24.33 g of FeCl3 were firstly dissolved in ethanol and then placed on a hotplate at 50 °C under a continuous stirring, followed by the addition of a support material (metal loading) until 10 wt% was achieved. The mixture was stirred for 4 h and dried at 100 °C in an oven overnight. Afterward, the dry catalyst powder was calcined at 800 °C in a muffle for 3 h in air with a heating rate of 10 °C min−1.11 4 g of the washed and shredded PET plastic bottles were thermally treated using a catalytic pyrolysis tube-furnace.24–26 The sample was placed in a quartz boat in the first stage of the tube-furnace. 2 g of the catalyst was placed in a quartz boat in the second stage, where the catalysis temperature was set to 800 °C. Carrier gas (nitrogen) was supplied at a flow rate of 100 mL min−1. Once the catalyst achieved the desired temperature, the plastic sample was heated to 500 °C with an increase rate of 30 °C min−1. The final pyrolysis temperature was held for 20 min and then the furnace was allowed to cool.
2.5 Characterization of the produced carbon-based materials
Graphene, carbon spheres, and carbon nanotubes were characterized using different techniques such as: Fourier transform infrared analysis (FTIR) (Bruker Bremen, Germany), X-ray diffraction (XRD) using an X-ray powder diffractometer (CuK α1 radiation, λ = 1.54056 Å) at 40 kV and 40 mA and intensity data for 2θ from 20° to 80° over a period of 30 min (Schimadzu-7000, Shimadzu Corporation, Kyoto, Japan), transmission electron microscope (TEM) and energy dispersive X-ray spectroscopy (EDX) (JEOL, JEM-2100, Japan with an accelerating voltage of 80 kV), X-ray photoelectron spectroscopy (XPS) (Thermo Fisher Scientific, USA), Brunauer–Emmett–Teller (BET) surface area analyzer (Beckman Coulter SA3100, Brea, CA, USA), and the measurement of the N2 adsorption–desorption isotherms were performed at 77 K. All samples were degassed before measurements under vacuum at room temperature for 12 h, and finally thermogravimetric analysis (TGA) (Shimadzu TGA-50 instrument).3. Results and discussion
3.1 Morphological structure of the synthesized carbon materials
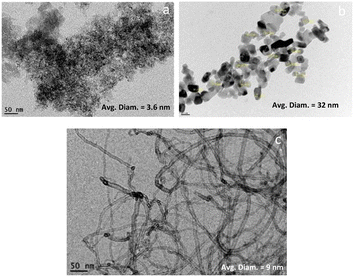
The morphological structure of the synthesized carbon materials was determined using TEM. TEM images confirm that the carbon structure in the case of the graphene is likely to be in form of a single, or a few layers sheet as indicated in Fig. 1a. The surface morphology and porosity of carbon spheres grow in a specific manner at elevated temperatures during the pyrolysis process. In these polycondensation reactions, carbon-containing materials can form an extended polymer chain that can curl up around a center point to form carbon spheres if suitable conditions are achieved.27 Fig. 2a shows the TEM analysis of graphene, the outline of graphene flakes can be detected among the stalked graphene layers. The average diameter of the graphene flake is around 3.2 nm. Fig. 2b illustrates the formation of carbon spheres with a well-defined spherical structure having an average diameter of 32 nm. As shown in Fig. 2c, the structure of carbon nanotubes is clearly observed. They are homogeneous, with a diameter that ranges from 5 to 12 nm, which is well visible in TEM images. The results also confirm that the carbon nanotubes synthesized by this method showed poor crystallinity resulting from the dispersed graphene sheath that is not properly aligned and present in a disordered form.283.2 Chemical properties of prepared carbon materials
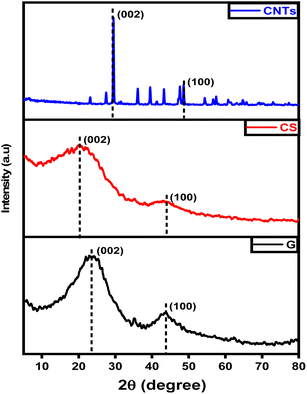
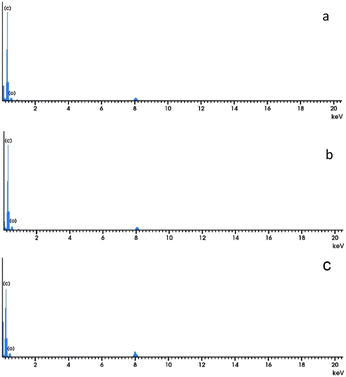
The chemical structures and crystallinity of graphene, carbon spheres, and carbon nanotubes were investigated via XRD as depicted in Fig. 3. Both graphene and carbon spheres have diffraction peaks at around 2θ = 25–26° which can be indexed to (002) crystal plane of graphitic structures29 and another smaller peak at around 2θ = 43° that is attributed to the (100) diffraction plane of graphitic structures. The weak peaks around 23.2° and 42.1° for (002) and (101) planes, respectively were observed indicates the absence of high regularity stacked graphene structure confirming the results of TEM analysis. On the other hand, XRD analysis of carbon nanotubes indicates a different pattern. A sharp and intense peak at 29.4° corresponds to the (002) reflection plane which affirms that a tetragonal arrangement of carbon atoms is formed30 indicating that a high level of crystalline carbon structure is obtained.31,32 Despite the sharp peak at the (002) plane, the resulting carbon-based material can be non-crystalline with a periodic structure that results in a distinct X-ray diffraction peak. This phenomenon can be due to the production of some extra hexagonal peak arrays which can be noticed multiple times at different azimuths but at much lower intensity compared to the main graphitic peak as a result of the passage of X-ray beams through the empty central core of a small tube.20 The XRD pattern of the CNTs also shows that nickel, nickel oxide, and iron oxide were present in the spectrum attributable to the catalyst used. In a high-temperature environment (above 400 °C), nickel and iron react with oxygen and become nickel/iron oxide. The typical peaks near 43.2° and 53.74° disappeared due to existing Ni and Fe.13,33,34EDX spectroscopy specified the elemental composition of materials as shown in Fig. 4. It was observed that only high-intensity carbon and low content of oxygen are detected corresponding to (002) and (100) planes and there are no other visible peaks indicating that the material is free of contamination.
Table 1 presents the structural carbon/oxygen content which provides an excellent platform for both the chemical composition and morphology of the materials.35 As shown in Table 1, graphene possesses the highest carbon content compared to carbon spheres and carbon nanotubes which suggests a stacked array of graphene layers. The higher oxygen content in both carbon spheres and carbon nanotubes may be attributed to the amorphous nature of the material.
| Sample | Element content wt% | |
|---|---|---|
| C | O | |
| Graphene | 97.98 | 2.02 |
| Carbon spheres | 96.59 | 3.41 |
| Carbon nanotubes | 95.51 | 4.49 |
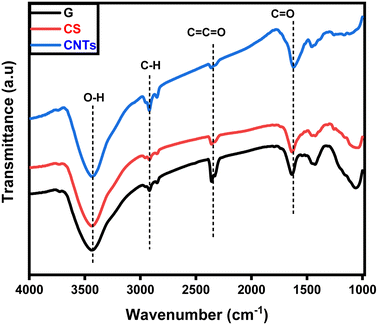
The functional groups of the fabricated graphene, carbon spheres, and carbon nanotubes were specified using FTIR as shown in Fig. 5. The three products contain distinctive O–H stretching vibrations around the 3400 cm−1 range.36,37 This bond is associated with the presence of amorphous carbon.12,13,38–40 The smaller peaks at 2800 cm−1 to 2900 cm−1 correspond to the stretching vibration of the C–H bond.41–43 Further, a stretching vibration of C![[double bond, length as m-dash]](https://www.rsc.org/images/entities/char_e001.gif) C
C![[double bond, length as m-dash]](https://www.rsc.org/images/entities/char_e001.gif) O can be noticed around 2300 cm−1. The peaks at around 1600 cm−1 are due to the stretching vibration of carboxyl groups C
O can be noticed around 2300 cm−1. The peaks at around 1600 cm−1 are due to the stretching vibration of carboxyl groups C![[double bond, length as m-dash]](https://www.rsc.org/images/entities/char_e001.gif) O.44–47 The three products own the same main functional groups due to their carbonic structures.
O.44–47 The three products own the same main functional groups due to their carbonic structures.
The chemical composition and chemical states of the synthesized carbon materials were analyzed using XPS. Fig. 6 shows the high-resolution survey, C 1s, and O 1s spectra of the different structures. The C 1s spectrum of graphene is characterized by the peaks at 284.62 ± 0.1, 286.27 ± 0.1, and 288.38 ± 0.2 eV, which are imputed to the C![[double bond, length as m-dash]](https://www.rsc.org/images/entities/char_e001.gif) C (sp2 bonded carbons), C–C (sp3 bonded carbons), and carbonyl C
C (sp2 bonded carbons), C–C (sp3 bonded carbons), and carbonyl C![[double bond, length as m-dash]](https://www.rsc.org/images/entities/char_e001.gif) O.48 On the other hand, the peaks in carbon spheres at 284.38 ± 0.1, 285.96 ± 0.1, 286.77 ± 0.1, and 288.3 ± 0.2 eV correspond to the C
O.48 On the other hand, the peaks in carbon spheres at 284.38 ± 0.1, 285.96 ± 0.1, 286.77 ± 0.1, and 288.3 ± 0.2 eV correspond to the C![[double bond, length as m-dash]](https://www.rsc.org/images/entities/char_e001.gif) C (sp2 bonded carbons), C–C (sp3 bonded carbons), alkoxy C–O–H and carbonyl C
C (sp2 bonded carbons), C–C (sp3 bonded carbons), alkoxy C–O–H and carbonyl C![[double bond, length as m-dash]](https://www.rsc.org/images/entities/char_e001.gif) O, while carbon nanotubes had peaked at 284.83 ± 0.1 eV, 286.18 ± 0.1 eV, 288.14 ± 0.1 eV and 289.7 ± 0.1 eV which are associated with sp2 and sp3 hybridized carbon (C
O, while carbon nanotubes had peaked at 284.83 ± 0.1 eV, 286.18 ± 0.1 eV, 288.14 ± 0.1 eV and 289.7 ± 0.1 eV which are associated with sp2 and sp3 hybridized carbon (C![[double bond, length as m-dash]](https://www.rsc.org/images/entities/char_e001.gif) C and C–C), hydroxyl/phenols (C–OH) and carboxyl (O–C
C and C–C), hydroxyl/phenols (C–OH) and carboxyl (O–C![[double bond, length as m-dash]](https://www.rsc.org/images/entities/char_e001.gif) O) groups, respectively.49–51
O) groups, respectively.49–51
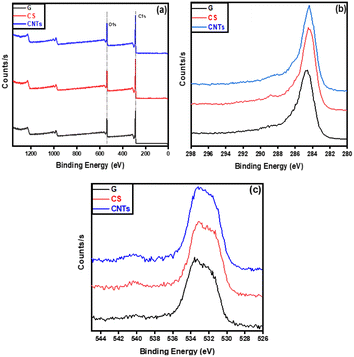 | ||
| Fig. 6 XPS analysis of graphene (G), carbon spheres (CS), and carbon nanotubes (CNTs); XPS survey of G, CS, and CNTs (a), C 1s spectra of G, CS, and CNTs (b), and O 1s spectra of G, CS, and CNTs (c). | ||
3.3 Physical characteristics of the fabricated carbon materials
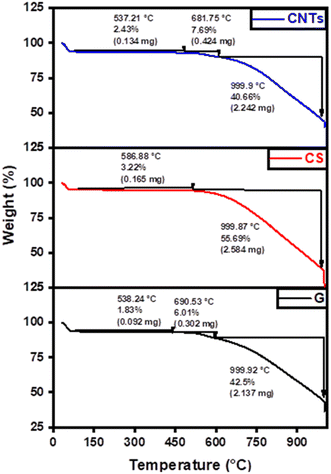
The thermal behavior of graphene, carbon spheres, and carbon nanotubes was examined by thermal gravimetric analysis (TGA) in a nitrogen atmosphere, to identify the quality of their thermal characteristics and possible structural deterioration. The TGA behavior is mainly affected by the number of layers, particle size, defects, and oxygen level.52 As shown in Fig. 7, graphene started to lose weight at 32 °C, which is related to the physically adsorbed moisture, whereas the sudden weight loss at 650 °C is attributed to the combustion of the carbon backbone to carbon dioxide. The results affirmed that graphene had the highest thermal stability, where mass loss ratios of 50.34%, 50.78%, and 58.91% were achieved in the case of graphene, carbon nanotubes, and carbon spheres, respectively due to the removal of moisture and the decomposition carbon backbone. On the other hand, the mass loss ratio in the case of carbon spheres was around 3.22% compared to 10.12% in the case of carbon nanotubes until 690 °C which affirmed the high thermal stability of carbon spheres under low temperature and the high thermal stability of carbon nanotubes under higher temperatures.To further investigate the structural morphology and its influence on physical properties, nitrogen physisorption measurements were conducted to investigate the surface area and porosity of the samples using BET analyzer as shown in Fig. 8. The nitrogen adsorption–desorption curves of graphene exhibited a typical type IV isotherm, suggesting a porous structure of the composite. The BET-specific surface area of the fabricated graphene was 11.860 m2 g−1 with an average pore diameter of 9.518 nm. A large hysteresis area is observed, indicative of a wide distribution of pore sizes. The adsorption–desorption curves of the carbon spheres and carbon nanotubes showed a greater pore diameter compared to graphene (14.454 nm and 15.557 nm, respectively) despite having the same chemical graphitic composition, they showed distinctly different physical properties. The surface area and pore diameter of carbon nanotubes are mainly affected by the number of walls, tube diameter, and impurities.47,53–55 The reported values for the surface area of single-walled CNTs ranged from ∼150 m2 g−1 to 600 m2 g−1, and from ∼15 m2 g−1 to 300 m2 g−1 for multi-walled CNTs.56 The total pore volume of graphene, carbon spheres, and carbon nanotubes are 2.823 cm3 g−1, 0.183 cm3 g−1, and 0.214 cm3 g−1, respectively.
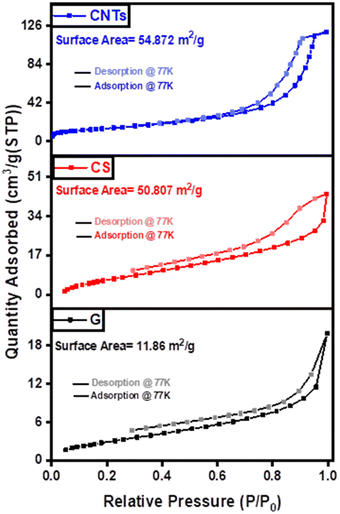 | ||
| Fig. 8 Adsorption–desorption curves of graphene (G), carbon spheres (CS), and carbon nanotubes (CNTs). | ||
4. Conclusions
Three carbon-derived materials were successfully synthesized using catalytic pyrolysis technique utilizing different common plastic wastes (plastic cups, yogurt cups, and plastic bottles). XRD, FTIR, and EDX results of the three materials confirmed the formation of carbon and its graphitic structure and the presence of the main active surface groups associated with graphene, carbon spheres, and carbon nanotubes as well as the chemical composition. The presence of sp2 and sp3 hybridized carbon in the C 1s spectra reaffirmed the chemical structure of the three materials. CNTs exhibited the highest surface area of 54.872 m2 g−1 compared to graphene and carbon spheres. Graphene showed the highest thermal stability attaining a mass loss ratio of 50.34% followed by CNTs and carbon spheres. TEM images revealed a smooth and uniform morphology for the three materials. This study presents promising carbonaceous materials that can be used in various environmental purification applications such as adsorption, persulfate activation, and periodic activation processes due to their cheapness and high carbon ratios.Author contributions
ES: conceptualization, methodology, investigation, writing – original draft, writing – review & editing. SM & MS & KM: writing – original draft, conceptualization, methodology. MO & ME & HS: validation, formal analysis, visualization, writing – review & editing, supervision, resources, funding acquisition.Conflicts of interest
There are no conflicts of interest to declare.Acknowledgements
This paper is based upon work supported by Science, Technology & Innovation Funding Authority (STDF) under a grant (46138).Notes and references
- M. C. Ariza-Tarazona, J. F. Villarreal-Chiu, J. M. Hernández-López, J. R. De la Rosa, V. Barbieri, C. Siligardi and E. I. Cedillo-González, J. Hazard. Mater., 2020, 395, 122632 CrossRef CAS PubMed.
- R. Geyer, J. R. Jambeck and K. L. Law, Sci. Adv., 2017, 3, e1700782 CrossRef PubMed.
- P. Jiang, S. Zhao, L. Zhu and D. Li, Sci. Total Environ., 2018, 624, 48–54 CrossRef CAS PubMed.
- M. C. Ariza-Tarazona, J. F. Villarreal-Chiu, V. Barbieri, C. Siligardi and E. I. Cedillo-González, Ceram. Int., 2019, 45, 9618–9624 CrossRef CAS.
- M. A. Malla, A. Dubey, A. Kumar and S. Yadav, Process Saf. Environ. Prot., 2023, 170, 372–379 CrossRef CAS.
- S. Tang, L. Lin, X. Wang, A. Feng and A. Yu, J. Hazard. Mater., 2020, 386, 121960 CrossRef CAS.
- M. Samy, M. G. Alalm, M. N. Khalil, E. Ezeldean, A. El-Dissouky, M. Nasr and A. Tawfik, J. Environ. Manage., 2023, 332, 117402 CrossRef CAS PubMed.
- K. Mensah, H. Mahmoud, M. Fujii and H. Shokry, J. Water Process. Eng., 2022, 45, 102512 CrossRef.
- S. Pandey, A. Kumar, M. Karakoti, K. K. Garg, A. Rana, G. Tatrari, B. S. Bohra, P. Yadav, R. K. Singh and N. G. Sahoo, Nanoscale Adv., 2021, 3, 4726–4738 RSC.
- M. Kumari, G. R. Chaudhary, S. Chaudhary and A. Umar, Chemosphere, 2022, 294, 133692 CrossRef CAS PubMed.
- D. Yao, H. Yang, Q. Hu, Y. Chen, H. Chen and P. T. Williams, Appl. Catal., B, 2021, 280, 119413 CrossRef CAS.
- H. Shokry, M. Elkady and E. Salama, Sci. Rep., 2020, 10, 10265 CrossRef CAS PubMed.
- M. Samy, A. G. Kumi, E. Salama, M. ElKady, K. Mensah and H. Shokry, Process Saf. Environ. Prot., 2023, 169, 337–351 CrossRef CAS.
- S. Shen, W. Jiang, Q. Zhao, L. He, Y. Ma, X. Zhou, J. Wang, L. Yang and Z. Chen, Sci. Total Environ., 2023, 859, 160001 CrossRef CAS PubMed.
- L. Li, Z. M. H. M. Shafie, T. Huang, R. Lau and C.-H. Wang, Chem. Eng. J., 2023, 141342 CrossRef CAS.
- N. T. Hanh, H. An, N. T. Tinh, N. T. H. Nam, C. Q. Cong, N. D. Hai, N. M. Dat and N. H. Hieu, Mater. Lett., 2023, 134591 CrossRef CAS.
- Q. Li, A. Faramarzi, S. Zhang, Y. Wang, X. Hu and M. Gholizadeh, Energy Convers. Manage., 2020, 226, 113525 CrossRef CAS.
- A. I. Osman, C. Farrell, A. H. Al-Muhtaseb, A. S. Al-Fatesh, J. Harrison and D. W. Rooney, Environ. Sci. Eur., 2020, 32, 1–12 CrossRef.
- P. K. Tripathi, S. Durbach and N. J. Coville, Appl. Sci., 2019, 9, 2451 CrossRef CAS.
- M. Al-asadi and N. Miskolczi, Energies, 2020, 13, 1284 CrossRef CAS.
- S. Saconsint, N. Sae-Tang, A. Srifa, W. Koo-Amornpattana, S. Assabumrungrat, C. Fukuhara and S. Ratchahat, Sci. Rep., 2022, 12, 15195 CrossRef CAS.
- S.-L. Wu, C.-M. Chen, J.-H. Kuo and M.-Y. Wey, Chem. Eng. Sci., 2020, 217, 115541 CrossRef CAS.
- W. Yang, L. Cao, W. Li, X. Du, Z. Lin and P. Zhang, Ionics, 2022, 28, 3489–3500 CrossRef CAS PubMed.
- J. N. Cruz, K. D. Martínez, D. Á. Zavariz and I. P. Hernández, J. Ecol. Eng., 2022, 23, 319–330 CrossRef.
- Y. Peng, Y. Wang, L. Ke, L. Dai, Q. Wu, K. Cobb, Y. Zeng, R. Zou, Y. Liu and R. Ruan, Energy Convers. Manage., 2022, 254, 115243 CrossRef CAS.
- R. Miandad, M. Rehan, M. A. Barakat, A. S. Aburiazaiza, H. Khan, I. M. Ismail, J. Dhavamani, J. Gardy, A. Hassanpour and A.-S. Nizami, Front. Energy Res., 2019, 7, 27 CrossRef.
- S. Dong, J. Li, S. Zhang, N. Li, B. Li and L. Ge, J. Polym. Res., 2021, 28, 1–10 CrossRef.
- R. Shoukat and M. I. Khan, Microsyst. Technol., 2022, 28, 885–901 CrossRef CAS.
- M. Kolahdouz, B. Xu, A. F. Nasiri, M. Fathollahzadeh, M. Manian, H. Aghababa, Y. Wu and H. H. Radamson, Micromachines, 2022, 13, 1257 CrossRef PubMed.
- M. R. Mohammad, D. S. Ahmed and M. K. Mohammed, J. Sol-Gel Sci. Technol., 2019, 90, 498–509 CrossRef CAS.
- A. Awadallah-F and S. Al-Muhtaseb, Sci. Rep., 2020, 10, 4878 CrossRef CAS PubMed.
- M. X. Tran, R. E. A. Ardhi, G. Liu, J. Y. Kim and J. K. Lee, Chem. Eng. J., 2020, 401, 126075 CrossRef CAS.
- E. Salama, M. Samy, H. Shokry, G. El-Subruiti, A. El-Sharkawy, H. Hamad and M. Elkady, Sci. Rep., 2022, 12, 22443 CrossRef CAS PubMed.
- M. F. Elkady, H. S. Hassan, W. A. Amer, E. Salama, H. Algarni and E. R. Shaaban, Materials, 2017, 10, 1355 CrossRef PubMed.
- A. Raoof Mahmood, M. A. Alheety, M. M. M. Asker, A. Zyaad Tareq and A. Karadağ, J. Phys.: Conf. Ser., 2019, 1294, 052003 CrossRef.
- R. Al-Gaashani, A. Najjar, Y. Zakaria, S. Mansour and M. Atieh, Ceram. Int., 2019, 45, 14439–14448 CrossRef CAS.
- R. E. A. Ardhi, G. Liu, M. X. Tran, C. Hudaya, J. Y. Kim, H. Yu and J. K. Lee, ACS Nano, 2018, 12, 5588–5604 CrossRef CAS PubMed.
- Z. Mehmood, M. Aamir, M. Sher, M. Sohail, R. Qadeer, N. Revaprasadu, M. A. Malik and J. Akhtar, Optik, 2019, 197, 163035 CrossRef CAS.
- R. Panickar, C. Sobhan and S. Chakravorti, Vacuum, 2020, 172, 109108 CrossRef CAS.
- H. S. Hassan, D. Abol-Fotouh, E. Salama and M. F. Elkady, Sci. Rep., 2022, 12, 8774 CrossRef CAS PubMed.
- E. A. Trusova, I. V. Klimenko, A. M. Afzal, A. N. Shchegolikhin and L. V. Jurina, New J. Chem., 2021, 45, 10448–10458 RSC.
- A. M. Saad, A. Y. M. Alabdali, M. Ebaid, E. Salama, M. T. El-Saadony, S. Selim, F. A. Safhi, S. M. ALshamrani, H. Abdalla and A. H. Mahdi, Molecules, 2022, 27, 5640 CrossRef CAS PubMed.
- R. E. A. Ardhi, G. Liu, J. Park and J. K. Lee, Energy Storage Mater., 2023, 54, 863–874 CrossRef.
- D. Balarak, M. Zafariyan, C. A. Igwegbe, K. K. Onyechi and J. O. Ighalo, Environ. Processes, 2021, 8, 869–888 CrossRef CAS.
- C. Zhang, W. Song, X. Zhang, R. Li, S. Zhao and C. Fan, J. Mater. Sci., 2018, 53, 9429–9448 CrossRef CAS.
- E. Salama, M. Ghanim, H. S. Hassan, W. A. Amer, E.-Z. M. Ebeid, A. H. El-Shazly, M. Ossman and M. F. Elkady, RSC Adv., 2022, 12, 18363–18372 RSC.
- I. Albaik, K. E. Diab, M. Saleh, R. Al-Dadah, S. Mahmoud, M. B. Elsheniti, İ. Solmaz, E. Salama, H. S. Hassan and M. F. Elkadi, Sustain. Energy Technol. Assess., 2023, 56, 103006 Search PubMed.
- J. Ederer, P. Janoš, P. Ecorchard, J. Tolasz, V. Štengl, H. Beneš, M. Perchacz and O. Pop-Georgievski, RSC Adv., 2017, 7, 12464–12473 RSC.
- E. Aliyev, V. Filiz, M. M. Khan, Y. J. Lee, C. Abetz and V. Abetz, Nanomaterials, 2019, 9, 1180 CrossRef CAS PubMed.
- E. Salama, A. Hamdy, H. S. Hassan, W. A. Amer, E.-Z. M. Ebeid, M. Ossman and M. F. Elkady, Adsorpt. Sci. Technol., 2022, 2022, 6818348 CrossRef.
- R. E. A. Ardhi, G. Liu and J. K. Lee, ACS Energy Lett., 2021, 6, 1432–1442 CrossRef CAS.
- F. Farivar, P. Lay Yap, R. U. Karunagaran and D. Losic, C, 2021, 7, 41 CAS.
- S. ullah Rather, Int. J. Hydrogen Energy, 2020, 45, 4653–4672 CrossRef CAS.
- K. E. Diab, E. Salama, H. S. Hassan, A. A. El-moneim and M. F. Elkady, Polymers, 2021, 13, 3869 CrossRef CAS PubMed.
- K. E. Diab, E. Salama, H. S. Hassan, A. El-moneim and M. F. Elkady, Sci. Rep., 2021, 11, 1–13 CrossRef PubMed.
- E.-S. Duraia and A. Almaqwashi, Ain Shams Eng. J., 2021, 12, 1017–1024 CrossRef.
| This journal is © The Royal Society of Chemistry 2024 |

