 Open Access Article
Dissociative photoionization of acetaldehyde in the 10.2–19.5 eV VUV range†
Pedro
Recio
 a,
Roger Y.
Bello
 b,
Gustavo A.
García
 c,
Alexandre
Zanchet
 d,
Jesús
González-Vázquez
 ef,
Luis
Bañares
 ag and
Sonia
Marggi Poullain
 *a
*a
aDepartamento de Química Física, Facultad de Ciencias Químicas, Universidad Complutense de Madrid, 28040 Madrid, Spain. E-mail: smarggi@ucm.es
bDepartamento de Química Física Aplicada, Facultad de Ciencias, Universidad Autónoma de Madrid, 28049 Madrid, Spain
cSynchrotron SOLEIL, L'Orme des Merisiers, St. Aubin, BP 48, 91192 Gif-sur-Yvette, France
dInstituto de Física Fundamental, Consejo Superior de Investigaciones Científicas, C/Serrano, 123, 28006 Madrid, Spain
eDepartamento de Química, Facultad de Ciencias, Universidad Autónoma de Madrid, 28049 Madrid, Spain
fInstitute for Advanced Research in Chemical Sciences (IAdChem), Universidad Autónoma de Madrid, 28049 Madrid, Spain
gInstituto Madrileño de Estudios Avanzados en Nanociencia (IMDEA-Nanoscience), Cantoblanco, 28049 Madrid, Spain
First published on 18th July 2024
Abstract
The valence-shell dissociative photoionization of acetaldehyde has been investigated by means of the photoion photoelectron coincidence technique in conjunction with tuneable synchrotron radiation. The experimental results consist of threshold photoelectron spectra for the parent ion and for each fragment ion in the 10.2–19.5 eV photon energy range, along with (ion, e) kinetic energy coincidence diagrams obtained from measurements at fixed photon energies. The results are complemented by high-level ab initio calculations of potential energy curves as a function of the C–H bond distance. The nudged elastic band (NEB) method has been employed to connect the parent ion Franck–Condon region to the formation of the HCO+, CH3+ and CH4+ ion fragments. Appearance energies have been determined for six fragment ions with an improved accuracy, including two fragmentation channels, which to the best of our knowledge have not been reported previously, i.e. the formation of CH2CO+, lying at 13.10 ± 0.05 eV, and the formation of CH2+ at 15.1 ± 0.1 eV. Based on both experimental and theoretical results, the dissociation dynamics following ionization of acetaldehyde into the different fragmentation channels are discussed.
1 Introduction
Astrophysical media, such as the interstellar medium (ISM), are characterized by a complex photochemistry involving many stable and reactive species. Galactic fluxes and solar vacuum ultraviolet (VUV) radiation can induce a variety of reactions leading to the formation of diverse species.1,2 Acetaldehyde (CH3CHO) is one of the first molecules to have been detected in the ISM and one of the most abundant interstellar complex organic molecules (iCOMs), defined in astrochemistry as organic species composed of at least six atoms.3,4 The VUV photoionization of acetaldehyde is therefore particularly relevant for a deeper understanding of the photochemistry in astrophysical media. In this work, we revisit the valence-shell dissociative photoionization of acetaldehyde upon excitation in the 10–19.5 eV photon energy range. In a joint experimental and theoretical investigation, two previously unreported channels associated with the formation of CH2+ and CH2CO+ are described, while the results obtained for a variety of fragment ions shed more light on the fragmentation pathways following photoionization of acetaldehyde.The VUV photoionization of acetaldehyde was first investigated based on the photoelectron spectrum (PES) from HeI radiation5,6 and, more recently, based on the measurement of threshold photoelectron spectra (TPES) using tuneable synchrotron radiation.7,8 Additional multiphoton ionization studies, some involving resonance enhancement, have been reported.9,10 The vertical ionization energy of acetaldehyde lies at 10.228 ± 0.002 eV, and also corresponds to the adiabatic ionization potential, since the equilibrium geometries of the ground neutral and cationic states are considerably similar which results in a well-defined sharp peak in both PES and TPES associated with photoionization into the ground electronic state. A small vibrational progression, presenting a rather low intensity, is observed, and it has been assigned mainly to the combination of three vibrational modes, ν6, ν7, and ν8, corresponding to the C–H bending, CH3 s-deformation, and C–C stretching modes, respectively, with a weak contribution of ν9, the CH3 rock mode.
A schematic energy diagram is depicted in Fig. 1 showing the cationic electronic states following valence shell ionization as well as the reported fragmentations pathway. A series of broad bands are observed in both PES and TPES between 12 and 20 eV and have been assigned to up to six electronic excited states, labeled Ã2A′′, ![[B with combining tilde]](https://www.rsc.org/images/entities/i_char_0042_0303.gif) 2A′,
2A′, ![[C with combining tilde]](https://www.rsc.org/images/entities/i_char_0043_0303.gif) 2A′,
2A′, ![[D with combining tilde]](https://www.rsc.org/images/entities/i_char_0044_0303.gif) 2A′′, Ẽ2A′ and
2A′′, Ẽ2A′ and ![[F with combining tilde]](https://www.rsc.org/images/entities/i_char_0046_0303.gif) 2A′. They are attributed to photoionization from π(CO), π(CH3), σ(CC), π(CH3), σ(CO) and C2s molecular orbitals, respectively.7 We notice that the à and
2A′. They are attributed to photoionization from π(CO), π(CH3), σ(CC), π(CH3), σ(CO) and C2s molecular orbitals, respectively.7 We notice that the à and ![[B with combining tilde]](https://www.rsc.org/images/entities/i_char_0042_0303.gif) states slightly overlap in energy, while states
states slightly overlap in energy, while states ![[C with combining tilde]](https://www.rsc.org/images/entities/i_char_0043_0303.gif) and
and ![[D with combining tilde]](https://www.rsc.org/images/entities/i_char_0044_0303.gif) overlap almost completely. Vibrational structures resolved in the band associated with photoionization into the Ã2A′′ state have also been discussed. Cvitas et al.6 found two active vibrational modes, ν4 and ν10, corresponding to the C–O stretching and C–C–O bending, respectively, the former in agreement with earlier work5 and more recent TPES by Yencha et al.7 In contrast, Wu et al.8 proposed recently vibrational excitation in the ν6, ν8, ν11, and ν13 modes, based on a comparison with Franck–Condon factors calculated using the harmonic approximation. Rani et al.11 carried out a detailed theoretical study of multi-state and multi-mode vibronic dynamics in the photoionization of acetaldehyde. Their calculations allow them to simulate the PES and the vibrational progressions underneath. They assigned the vibronic structure from the à state to contributions from ν4, ν5 (CH3 d-deformation) and ν9, with moderate excitation of ν7 and ν10 modes. Similarly the band from photoionization into the
overlap almost completely. Vibrational structures resolved in the band associated with photoionization into the Ã2A′′ state have also been discussed. Cvitas et al.6 found two active vibrational modes, ν4 and ν10, corresponding to the C–O stretching and C–C–O bending, respectively, the former in agreement with earlier work5 and more recent TPES by Yencha et al.7 In contrast, Wu et al.8 proposed recently vibrational excitation in the ν6, ν8, ν11, and ν13 modes, based on a comparison with Franck–Condon factors calculated using the harmonic approximation. Rani et al.11 carried out a detailed theoretical study of multi-state and multi-mode vibronic dynamics in the photoionization of acetaldehyde. Their calculations allow them to simulate the PES and the vibrational progressions underneath. They assigned the vibronic structure from the à state to contributions from ν4, ν5 (CH3 d-deformation) and ν9, with moderate excitation of ν7 and ν10 modes. Similarly the band from photoionization into the ![[B with combining tilde]](https://www.rsc.org/images/entities/i_char_0042_0303.gif) state was assigned to excitation of ν5, ν7 and ν8.
state was assigned to excitation of ν5, ν7 and ν8.
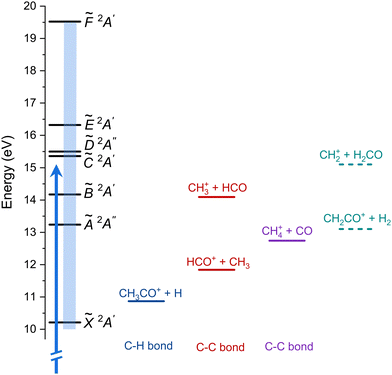 | ||
| Fig. 1 Schematic energy diagram showing the cationic electronic states of acetaldehyde (left) and the different fragmentation pathways. The blue arrow represents one-photon ionization at hν = 15 eV (results in Fig. 3) and the blue rectangle indicates the energy region of the threshold photoelectron spectrum (TPES, Fig. 4). The two additional fragmentation pathways reported here are shown in dashed lines. | ||
Four fragment ions from the dissociative photoionization of acetaldehyde, namely CH3CO+, HCO+, CH4+ and CH3+, were first reported based on synchrotron radiation experiments.12 Appearance energies were provided while partially deuterated acetaldehyde was measured to demonstrate intramolecular hydrogen-atom exchange in the CH4+ and CH3+ channels.12 More recently, the photodissociation of acetaldehyde cations prepared by either multiphoton ionization9,13 or single VUV photoionization14 has been investigated. In particular, Murray and co-workers14 discussed in detail the photofragmentation dynamics associated with the four channels. H-atom loss was proposed to occur through a small barrier, while CH3+ was suggested to be formed in the secondary fragmentation of CH3CO+. HCO+ and CH4+ were found to be produced mostly through statistical slow dissociation, although a fast component was observed and could not be explained.
Recently, Wu et al.8 reported TPES associated with the four fragment ions produced with synchrotron radiation in the 10.0–13.7 eV photon energy range together with density functional theory (DFT) calculations, carried out assuming dissociation in the cationic ground state, in order to further investigate the fragmentation into CH3CO+, HCO+ and CH4+. A small barrier for the H-atom loss was indeed found while the C–C bond cleavage was suggested to directly produce HCO+. In contrast, the CO-loss, which requires an intramolecular hydrogen-atom transfer, was proposed to occur by surpassing a 2.62 eV energy barrier into a transition state which is 0.42 eV above the dissociation limit. To the best of our knowledge, these DFT calculations by Wu et al.8 are the most advanced calculations reported so far on the VUV photoionization of acetaldehyde, besides the calculations by Rani et al.11 on the vibronic PES, and the electronic structure fix-point calculations carried out by Murray and co-workers.14
In the present work, the dissociative photoionization of acetaldehyde is investigated by means of photoion photoelectron coincidence (PEPICO) experiments carried out at the DESIRS beamline of synchrotron SOLEIL (France) following one-photon VUV excitation in the 10.2–19.5 eV photon energy range. The experimental results consist of (ion, electron) kinetic energy correlation diagrams following ionization at a fixed photon energy of 15.0 eV, as well as TPES measured for each fragment produced as a function of the photon and ion kinetic energy. The experimental results are complemented by high-level ab initio electronic structure calculations including potential energy curves for the main fragmentation pathways associated with the formation of the CH3CO+, CH2CO+, HCO+, CH4+, and CH3+ ions. The results are consistent, in general, with statistical dissociation, mainly in the cationic ground state, while the role of a conical intersection located close to the Franck–Condon region associated with vertical excitation from the neutral ground state is discussed. Two additional fragmentation pathways, CH2+ and CH2CO+, not reported before to the best of our knowledge, are observed, and appearance energies of 15.1 ± 0.1 eV and 13.10 ± 0.04 eV, respectively, are provided.
2 Method
2.1 Experimental set-up
Experiments were performed at the permanent end-station SAPHIRS,15 at the DESIRS beamline of the synchrotron SOLEIL16 using the PEPICO spectrometer DELICIOUS III.17 Synchrotron photons emitted from an undulator were dispersed by a 6.65 m normal incidence monochromator. A 200 l mm−1 grating was used and the monochromator slits were set to provide a photon energy resolution of ∼3 meV. A gas filter filled with Ar was used both to absorb high harmonics from the undulator and provide spectral purity and to calibrate the absolute photon energy scale through well-known Ar absorption bands. A continuous molecular beam with a rotational temperature of 58 ± 5 K, as inferred from the parent ion velocity distribution extracted from the corresponding ion image, was generated by a supersonic expansion of acetaldehyde (Sigma Aldrich), placed in a bubbler at −10 °C (no carrier gas), through a 50 μm diameter nozzle and collimated by two consecutive skimmers (beam dynamics, 1.0 mm diameter).The synchrotron radiation and the molecular beam cross each other at a right angle at the center of the DELICIOUS III spectrometer. The produced electrons and ions are extracted and accelerated in opposite directions by a continuous electric field. Electrons are detected by velocity map imaging (VMI) while a modified Wiley–McLaren time-of-flight (TOF) imaging spectrometer is used for ions. Photoelectron spectra (PES) and angular distributions were obtained from the electron VMI image via Abel inversion using the pBasex algorithm,18 while the full ion 3D momentum distribution was extracted from the ion TOF and the 2D arrival position onto the corresponding position-sensitive detector. The coincidence scheme yielded electron images, and thus the PES correlated to a particular mass and ion momentum, which in turn produced the electron and ion kinetic energy correlation diagram. The mass resolving power (M/ΔM) was sufficient to separate the CH3CO+ fragment ion (m/z = 43) from the parent ion CH3CHO+ (m/z = 44).
Measurements at two fixed photon energies, i.e. 14.0 eV and 15.0 eV, along with a scan between 10.2 eV and 19.5 eV were carried out. The energy scan was performed with a 25 meV energy step and the energy scale is accurate to within 12.5 meV. Measurements at fixed photon energies were carried out using an extraction field of 88 V cm−1 and thus a kinetic energy bandwidth of 3 eV, while in order to increase particle-energy resolution, an extraction field of 52.8 V cm−1 was used during the scan leading to an associated kinetic energy bandwidth of 1.8 eV. For measurements at a fixed photon energy, the photoelectron and photoion kinetic energy correlation diagrams (KECDs) represent the main result, while the scan is analyzed to obtain, for each ion, the coincident electron signal as a function of the ion and electron kinetic energy, and the photon energy. Such 3D histograms are condensed to 2D and 1D representations by integration over a limited bandwidth of the electron energy along constant ionic states, reducing the electron energy distribution to TPES, as detailed elsewhere.19 This allows extraction of 2D energy correlation diagrams as a function of ion kinetic and cationic state, as well as 1D TPES by integration over all ion kinetic energies.
2.2 Theoretical
The relevant potential energy curves (PECs) were calculated using the complete active space self-consistent field (CASSCF)/XMS-CASPT2 as implemented in OpenMOLCAS.20,21 The one-electron basis set was aug-cc-pVTZ.22,23 The active space included 13 orbitals CAS(13,13), the lone pair in the O atom, the C![[double bond, length as m-dash]](https://www.rsc.org/images/entities/char_e001.gif) O π and π* orbitals, and the σ and σ* orbitals involved in the C–C, C–O and C–H bonds, which are relevant in the dissociation process. Note that a similar active space was used in a previous work for the neutral molecule.24 For the XMS-CASPT2 calculation, an imaginary shift of ε = 0.2 was used while simultaneously removing the ionization potential-electron-affinity shift.
O π and π* orbitals, and the σ and σ* orbitals involved in the C–C, C–O and C–H bonds, which are relevant in the dissociation process. Note that a similar active space was used in a previous work for the neutral molecule.24 For the XMS-CASPT2 calculation, an imaginary shift of ε = 0.2 was used while simultaneously removing the ionization potential-electron-affinity shift.
In the optimization procedure, the Franck–Condon geometry was calculated using many-body second-order perturbation theory, while the remaining geometries, i.e. at the dissociation limits and at the conical intersection between the first and ground cationic state, were optimized using the XMS-CASPT2 procedure, as implemented in the OpenMOLCAS package.20,21 While for the dissociation limits and the equilibrium geometries a regular optimization is carried out, the conical intersection is optimized by including the energy difference between the two states as a constrain. For the description of the CH3CO+ + H channel, one-dimensional PECs were calculated along the C–H bond distance while the rest of the coordinates were relaxed following the gradient of the first doublet at XMS-CASPT2 level of theory. The CH3+, CH3 and the CH4+ channels were evaluated by connecting the Frank–Condon geometry with the different products using the nudged elastic band (NEB) method25 using the FIRE optimizer.26 These simulations were performed with a home-made interface between the OpenMolcas (providing the energy and the gradients) and the atomic simulation environment (ASE).27 Each dissociation channel was optimized using a total of 21 images and with the XMS-CASPT2 procedure described above.
Complementary potential energy curves were computed at the CASSCF level along the C–C bond distance while the rest of the coordinates are kept unchanged from the equilibrium geometry. The AVTZ basis set was used while the active space included nine orbitals, CAS(11,9).
3 Results
3.1 Experimental results
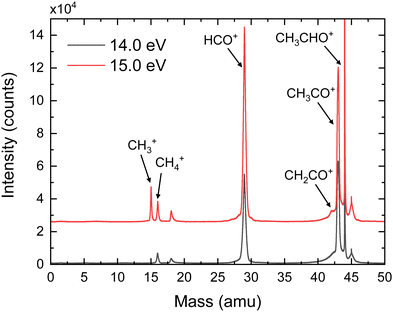
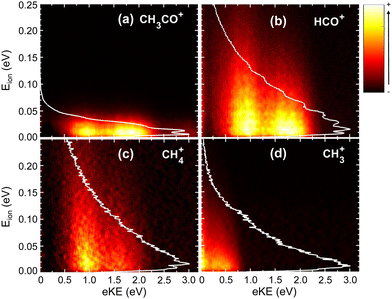
Fig. 2 shows the time-of-flight mass spectra (TOFMS) obtained after CH3CHO photoionization at hν = 14.0 eV and 15.0 eV. The TOFMS at 14.0 eV is dominated by the strong signal of the parent ion, CH3CHO+, at m/z = 44, although peaks associated with photofragmentation are also present. In particular, formation of CH3CO+ (m/z = 43) and HCO+ (m/z = 29) is observed with similar ratios along with a weak signal corresponding to CH4+ (m/z = 16). The small structure observed at m/z = 18 is related to the residual water present inside the experimental chamber. Note that O+ from dissociative photoionization of residual water cannot contribute to m/z = 16 since its appearance energy lies around 19 eV. Contributions from the residual gas often present an asymmetric shape due to the long interaction region along the photon direction. Peaks from the supersonic gas are characterized by a symmetric shape while their width reflects the ion kinetic energy content. A shoulder is observed at m/z = 30 which is consistent with the fragmentation into HCO+ of acetaldehyde containing 13C in its natural abundance. As expected, the TOFMS measured at 15.0 eV shows a larger fragmentation pattern, increasing the relative ratios of all fragments ions. In addition, a peak at m/z = 15 (CH3+) is clearly visible, even larger than the one assigned to CH4+. Moreover, a shoulder close to the CH3CO+ signal is observed at m/z = 42, which is assigned to CH2CO+. Notice that a minor signal at m/z = 42 is also present in the measurement at 14.0 eV, although it cannot be observed in Fig. 2. A detailed analysis of the small peak observed at m/z = 45 indicates that it corresponds to both a proton-transfer mechanism prior to dissociation of a small amount of dimers28 present in the molecular beam, as well as to some contribution of the acetaldehyde containing 13C in its natural abundance. Based on the TPES obtained for the signal at m/z = 45 compared to the monomer signal, we can estimate the dimer contribution to be half of the 13C acetaldehyde. Accounting for the natural abundance of 13C, this means that the relative abundance of dimer would be 1% that of the monomer. The amount of trimer is estimated to be at 4% based on a small signal observed at m/z = 89 and only trace amounts of tetramer are expected from the m/z = 133 peak. Sequential fragmentation might occur but mostly by monomer evaporation28 restricting the contribution of the clusters to the m/z = 45, 89, … channels.The photoelectron (eKE) and photoion (Eion) KECDs for CH3CO+, HCO+, CH4+, and CH3+ obtained upon photoionization at 15.0 eV are depicted in Fig. 3. The corresponding KECD for the parent ion is not shown here. As a non-dissociative event, only the photoelectron spectrum is relevant. This channel leads to major ionization into the ground state and thus to the emission of high-kinetic energy electrons while the extractor field is applied does not allow to fully detect those photoelectrons.
The KECD for the H-atom loss leading to CH3CO+ (Fig. 3(a)) shows two main features at eKE ∼ 1.75 eV and ∼1.0 eV, correlated with photoionization into the first (Ã2A′′) and second (![[B with combining tilde]](https://www.rsc.org/images/entities/i_char_0042_0303.gif) 2A′) excited states, respectively. A weak signal is nevertheless observed at higher eKE, which can suggest the formation of this fragment in the Franck–Condon (FC) gap between the ground and first excited states of the acetaldehyde cation. As observed in Fig. 3(b), the two peaks at eKE ∼ 1.75 eV and ∼1.0 eV are similarly observed for HCO+, reflecting that photoionization into the à and
2A′) excited states, respectively. A weak signal is nevertheless observed at higher eKE, which can suggest the formation of this fragment in the Franck–Condon (FC) gap between the ground and first excited states of the acetaldehyde cation. As observed in Fig. 3(b), the two peaks at eKE ∼ 1.75 eV and ∼1.0 eV are similarly observed for HCO+, reflecting that photoionization into the à and ![[B with combining tilde]](https://www.rsc.org/images/entities/i_char_0042_0303.gif) electronic states leads to both C–H and C–C bond cleavage. The KECD associated with the formation of CH4+ (Fig. 3(c)) presents a main peak at eKE ∼ 1.0 eV with a shoulder at higher kinetic energy (lower binding energy). This seems to indicate that, although the first two excited electronic states can lead to this channel, fragmentation after photoionization into the
electronic states leads to both C–H and C–C bond cleavage. The KECD associated with the formation of CH4+ (Fig. 3(c)) presents a main peak at eKE ∼ 1.0 eV with a shoulder at higher kinetic energy (lower binding energy). This seems to indicate that, although the first two excited electronic states can lead to this channel, fragmentation after photoionization into the ![[B with combining tilde]](https://www.rsc.org/images/entities/i_char_0042_0303.gif) state is more favorable. The KECD obtained for CH3+ depicted in Fig. 3(d) shows only a feature at low eKE (0–0.5 eV), which seems to arise from ionization into high-lying vibrational levels of the
state is more favorable. The KECD obtained for CH3+ depicted in Fig. 3(d) shows only a feature at low eKE (0–0.5 eV), which seems to arise from ionization into high-lying vibrational levels of the ![[B with combining tilde]](https://www.rsc.org/images/entities/i_char_0042_0303.gif) state along with some threshold ionization in the
state along with some threshold ionization in the ![[C with combining tilde]](https://www.rsc.org/images/entities/i_char_0043_0303.gif) 2A′ state.
2A′ state.
The photoion kinetic energy (Eion) distributions obtained for each fragment and for all electron energies are shown in Fig. 3 as white lines. In addition, the distributions obtained for each mass and for selected photoelectron energies corresponding to each electronic cationic state are also included in the ESI.† The distributions in Fig. S1 (ESI†) are plotted in terms of kinetic energy release (KER), which corresponds to the center-of-mass kinetic energy and can be obtained by multiplying by the Eion of a cationic fragment by the mass factor (m1 + m2+)/m1, where m1 and m2+ are the masses of the neutral and cationic fragments produced in the two-body fragmentation. All photoion kinetic energy distributions show a Boltzmann-type shape for all channels, reflecting indirect or slow dissociation processes following photoionization, where the available energy is shared between translational and ro-vibrational modes. The distributions have therefore been fitted to the Boltzmann equation from which a translational temperature is directly obtained. For the H-atom loss channel, the Eion distribution is narrow since the co-fragment carries most of the available kinetic energy. It is difficult to extrapolate to the center-of-mass KER distribution in this case due to experimental factors such as ion energy resolution and molecular beam temperature, but the fragment energy distribution can be defined as a Boltzmann distribution with a translational temperature of ∼170 K, which is broader than that of the parent ion. In contrast, for the other HCO+ and CH4+, the Eion distributions show a maximum at threshold energies but extends up to less than KER ∼ 1 eV (FWHM). For both fragment ions, the Eion distributions are broader following photoionization into the ![[B with combining tilde]](https://www.rsc.org/images/entities/i_char_0042_0303.gif) state. The Boltzmann-type Eion distribution obtained for the CH3+ extends up to KER ∼ 0.3 eV, consistent with a threshold dissociation.
state. The Boltzmann-type Eion distribution obtained for the CH3+ extends up to KER ∼ 0.3 eV, consistent with a threshold dissociation.
The TPES obtained for the parent and all the fragment ions are depicted in Fig. 4(a), while the corresponding molar fraction as a function of the photon energy is shown in Fig. 4(b). The approximate position of each ionic electronic state is indicated in Fig. 4(a) based on data reported by Cvitas et al.6 and Yencha et al.7 The ![[C with combining tilde]](https://www.rsc.org/images/entities/i_char_0043_0303.gif) 2A′ and
2A′ and ![[D with combining tilde]](https://www.rsc.org/images/entities/i_char_0044_0303.gif) 2A′′ cationic states overlap considerably in energy and cannot be properly identified. The ion appearance energies (AEs) observed in the TPES can present considerable deviations from the adiabatic values. On the one hand, the temperature, and hence the initial ro-vibrational distribution, of the molecules can lead to a red shift of the observed value. On the other hand, particularly long kinetics of the fragmentation reactions, associated often with large molecular systems, can lead to a blue shift of the values.29 Since we employ a relatively cold molecular beam with an estimated temperature of 58 ± 5 K and acetaldehyde can be considered as a small polyatomic system, we chose here to neglect these two sources of deviations. Nevertheless, the values provided here should still be considered as observed values. The observed AEs for each fragment determined from Fig. 4(a) are summarized in Table 1 and compared to earlier work. As observed, a very good agreement is found. Besides the four fragment ions already reported in the literature, i.e. CH3CO+, HCO+, CH4+, and CH3+, two supplementary fragments have been identified in the present work: CH2+ and CH2CO+ with AEs of 15.1 ± 0.1 eV and 13.10 ± 0.04 eV, respectively. Since the fixed-photon-energy measurement was carried out at 15.0 eV, close to the observed AE for CH2+, its KECD could not be determined while the corresponding KECD for CH2CO+ is not shown due to the low signal. We note that the signal at m/z = 14, assigned to CH2+, cannot be due to N+ from the residual gas since its appearance energy from dissociative photoionization of N2 lies around 24 eV.
2A′′ cationic states overlap considerably in energy and cannot be properly identified. The ion appearance energies (AEs) observed in the TPES can present considerable deviations from the adiabatic values. On the one hand, the temperature, and hence the initial ro-vibrational distribution, of the molecules can lead to a red shift of the observed value. On the other hand, particularly long kinetics of the fragmentation reactions, associated often with large molecular systems, can lead to a blue shift of the values.29 Since we employ a relatively cold molecular beam with an estimated temperature of 58 ± 5 K and acetaldehyde can be considered as a small polyatomic system, we chose here to neglect these two sources of deviations. Nevertheless, the values provided here should still be considered as observed values. The observed AEs for each fragment determined from Fig. 4(a) are summarized in Table 1 and compared to earlier work. As observed, a very good agreement is found. Besides the four fragment ions already reported in the literature, i.e. CH3CO+, HCO+, CH4+, and CH3+, two supplementary fragments have been identified in the present work: CH2+ and CH2CO+ with AEs of 15.1 ± 0.1 eV and 13.10 ± 0.04 eV, respectively. Since the fixed-photon-energy measurement was carried out at 15.0 eV, close to the observed AE for CH2+, its KECD could not be determined while the corresponding KECD for CH2CO+ is not shown due to the low signal. We note that the signal at m/z = 14, assigned to CH2+, cannot be due to N+ from the residual gas since its appearance energy from dissociative photoionization of N2 lies around 24 eV.
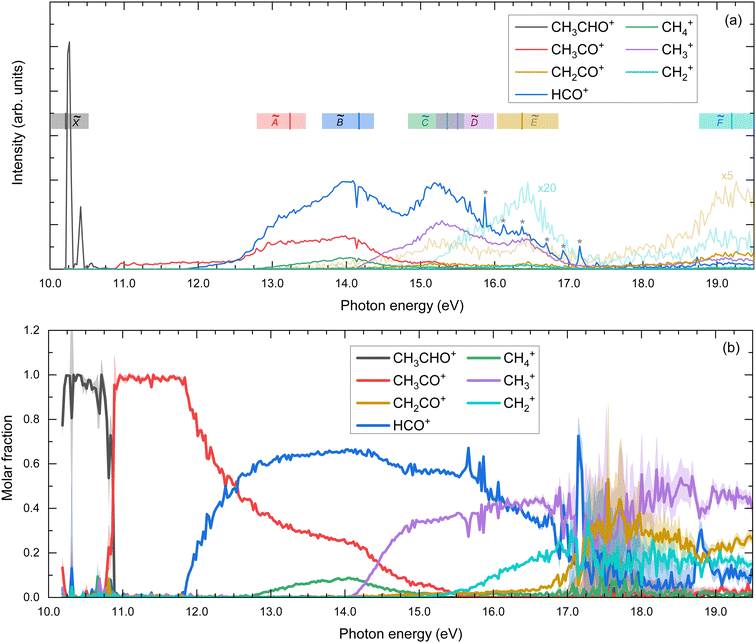 | ||
| Fig. 4 (a) Threshold photoelectron spectra (TPES) for the parent ion and for the different fragment ions. The spectra for CH2CO+ and CH2+ were multiplied by factors of 5 and 20, respectively, and depicted with light lines. Colored vertical bars indicate vertical excitation energies reported by Cvitas et al.6 The colored horizontal bands illustrate the approximate position of each band based on ref. 6 and 7. The peak observed at 14.2 eV is assigned to resonant excitation of Ar 5s present in the gas filter. * indicates autoionizing resonances from residual N2. (b) Molar fraction as a function of the photon energy. The error bars in panel (b) are estimated by propagating the experimental error from the TPES in panel (a), which in turn are derived assuming a Poisson distribution on the individual pixel counts of the photoelectron images. The large error bars in the 17–19 eV photon energy range are due to the particularly large cross-section of autoionizing states of residual N2. Note that, since only events related to the production of threshold electrons are considered, photon energy equals internal energy of the molecule. | ||
| Ion fragment | This work, exp. | This work, theor. | Jochims et al.12 | Wu et al.8 (exp./theor.) |
|---|---|---|---|---|
| a Values estimated from thermochemical data.30 | ||||
| CH3CHO+ | 10.21 ± 0.03 | 10.21 | 10.22 | —/10.226 |
| CH3CO+ | 10.87 ± 0.03 | 10.92 | 10.90 | 10.89/10.96 |
| CH2CO+ | 13.10 ± 0.04 | 10.79a | ||
| HCO+ | 11.84 ± 0.03 | 11.92 | 12.03 | 11.54/11.71 |
| CH4+ | 12.74 ± 0.03 | 12.67 | 12.61 | —/12.85 |
| CH3+ | 14.09 ± 0.03 | 13.49 | 14.08 | |
| CH2+ | 15.1 ± 0.1 | 14.98a | ||
Several well-defined peaks are observed in the TPES measured for HCO+ (m/z = 29) above 15 eV. These peaks have been identified as autoionization features from residual N2+ (m/z = 28), showing a considerable spread in the TOF signal, which, combined with the large autoionization cross-sections, makes impossible to properly remove them from the measured curve.
The parent ion is exclusively formed through non-dissociative photoionization into the cationic ground state. A sharp peak is observed at 10.21 ± 0.03 eV, which is consistent with the adiabatic ionization potential of the molecule. A subsequent vibrational progression is observed, which is attributed to a combination of several vibrational modes,5–7,11i.e., the CH bending (ν6), the CH3 deformation (ν7), the C–C stretching (ν8), and a weak contribution attributed to CH3 rocking (ν9).
As observed in Fig. 4(b), the main fragmentation channels, i.e. H-atom loss and C–C bond breaking forming HCO+, are the most probable outcomes following photoionization into the à and ![[B with combining tilde]](https://www.rsc.org/images/entities/i_char_0042_0303.gif) states. For photon energies above ∼14 eV, photoionization into
states. For photon energies above ∼14 eV, photoionization into ![[C with combining tilde]](https://www.rsc.org/images/entities/i_char_0043_0303.gif) ,
, ![[D with combining tilde]](https://www.rsc.org/images/entities/i_char_0044_0303.gif) and Ẽ cationic states leads to major C–C bond cleavage and to the formation of both CH3+ and HCO+, while the H-atom loss leading to CH3CO+ diminishes considerably and is produced exclusively from the
and Ẽ cationic states leads to major C–C bond cleavage and to the formation of both CH3+ and HCO+, while the H-atom loss leading to CH3CO+ diminishes considerably and is produced exclusively from the ![[C with combining tilde]](https://www.rsc.org/images/entities/i_char_0043_0303.gif) state. The increase in CH3+ formation occurs indeed simultaneously to a pronounced decrease in both CH3CO+ and CH4+. Although theoretical results from the present work show a possible pathway for direct formation of CH3+, this behavior could indicate a major formation of methyl cation through sequential fragmentation from the produced CH3CO+via a C–C bond cleavage or from methane cations via a C–H bond breaking, as will be discussed in more detail below. Photoionization at higher excitation energies between 17–19 eV, which includes the
state. The increase in CH3+ formation occurs indeed simultaneously to a pronounced decrease in both CH3CO+ and CH4+. Although theoretical results from the present work show a possible pathway for direct formation of CH3+, this behavior could indicate a major formation of methyl cation through sequential fragmentation from the produced CH3CO+via a C–C bond cleavage or from methane cations via a C–H bond breaking, as will be discussed in more detail below. Photoionization at higher excitation energies between 17–19 eV, which includes the ![[F with combining tilde]](https://www.rsc.org/images/entities/i_char_0046_0303.gif) cationic state, leads to fragmentation into CH2CO+, CH3+ and CH2+, with a similarly small probability. The low fragmentation intensity observed following photoionization into the
cationic state, leads to fragmentation into CH2CO+, CH3+ and CH2+, with a similarly small probability. The low fragmentation intensity observed following photoionization into the ![[F with combining tilde]](https://www.rsc.org/images/entities/i_char_0046_0303.gif) state can be rationalized by the diabatic dynamics calculations carried out by Rani et al.11 which indicate that no efficient internal conversion into lower cationic states is produced.
state can be rationalized by the diabatic dynamics calculations carried out by Rani et al.11 which indicate that no efficient internal conversion into lower cationic states is produced.
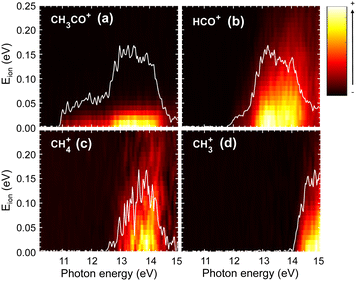
The TPES obtained for the four main fragmentation channels, i.e. CH3CO+, HCO+, CH4+, and CH3+, are represented as 2D energy correlation diagrams in Fig. 5, showing the ion signal correlated to threshold photoelectrons as a function of the photoion kinetic energy, Eion and the photon energy. The associated TPESs, plotted as white curves in Fig. 5, are obtained by integrating the corresponding ion signal associated with Eion below 25 meV. These plots can give complementary information on the participation of certain vibrational modes31 and on the energy sharing. As observed, in all cases, the corresponding Eion present small values reflecting indirect dissociation processes, where the available energy is randomized between the different degrees of freedom including vibrational and rotational modes. While interesting vibrational structures are observed in the TPES associated with a Eion below 25 meV, these progressions are complicated to assign, especially considering the large number of vibrational modes of this molecule. Similarly, the correlation diagrams do not indicate the formation of the fragment ions in any particular vibrational mode.
As observed in Fig. 4 and 5, the H-atom loss channel is characterized by an AE within the FC gap between the ground and first excited states of the acetaldehyde cation. A plateau, featuring a detailed vibrational progression, is observed in the TPES for CH3CO+ extending up to the first excited state at ∼12.5 eV. This feature has been discussed previously by Yencha et al.7 and more recently by Wu et al.8 who suggested the role of an autoionizing state. Fig. 6 shows an expanded view of the TPES measured for both the parent ion and the H-atom loss channel. Based on the vibrational assignments proposed Rani et al.11 for the ground state parent ion, the combs depicted in Fig. 6 represent the ν6, ν7 and ν8 vibrational modes, which seem to provide a considerable good agreement. The structures observed in Fig. 5(a) for the formation of CH3CO+ following photoionization into the à state could be assigned to the ν4 (CO stretching), with some contribution of ν10 (CCO bending), according to previous works,5–7 although recent calculations by Wu et al.8 suggest that this vibrational structure could be related to the ν6ν8, ν6ν11, and ν6ν13 vibronic transitions.
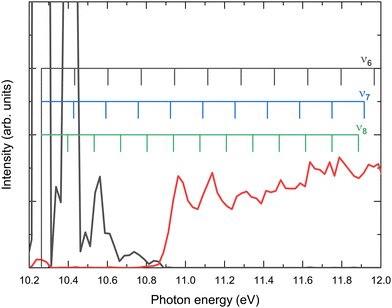 | ||
| Fig. 6 Expanded view of the threshold photoelectron spectrum (TPES) presented in Fig. 4 for the parent ion (black line) and CH3CO+ (red line). The combs indicate possible assignments of the vibrational structure to the ν6, ν7 and ν8 modes in accordance with the assignments by Rani et al.11 | ||
3.2 Theory results
High-level ab initio electronic structure calculations have been carried out in order to get a deeper insight into the fragmentation dynamics leading to the four main dissociative ionization channels, i.e. those yielding CH3CO+, HCO+, CH4+ and CH3+, following photoionization into the first four electronic states of the cationic acetaldehyde. The calculated vertical excitation energies (VEEs) are included in Table 2. As can be seen, an excellent agreement with the reported values is obtained. Similarly, the appearance energies from the present calculations, included in Table 1, are consistent with experimental values from this work and the previous ones.| State | This work (theory) | Chadwick et al.5 | Cvitas et al.6 | Murray et al.14 | Rani et al.11 | Yencha et al.7 |
|---|---|---|---|---|---|---|
| X 2 A′ | 10.21 | 10.24 | 10.21 | 10.57 | 10.37 | 10.228 ± 0.002 |
| Ã 2 A′′ | 13.31 | 13.15 | 13.24 | — | 13.31 | 13.093 ± 0.005 |
![[B with combining tilde]](https://www.rsc.org/images/entities/i_char_0042_0303.gif) 2
A′
2
A′ |
14.53 | 14.1 | 14.17 | 14.818 | 14.39 | 13.93 ± 0.01 |
![[C with combining tilde]](https://www.rsc.org/images/entities/i_char_0043_0303.gif) 2
A′
2
A′ |
15.69 | 15.4 | 15.36 | 15.606 | 15.39 | 15.20 ± 0.01 |
![[D with combining tilde]](https://www.rsc.org/images/entities/i_char_0044_0303.gif) 2
A′′
2
A′′ |
— | — | 15.36 | 16.095 | 15.56 | 15.5 (estimated) |
| Ẽ 2 A′ | — | 16.4 | 16.32 | — | 16.66 | 16.37 ± 0.01 |
![[F with combining tilde]](https://www.rsc.org/images/entities/i_char_0046_0303.gif) 2
A′
2
A′ |
— | ∼19 | 19.52 | — | — | 19.40 ± 0.01 |
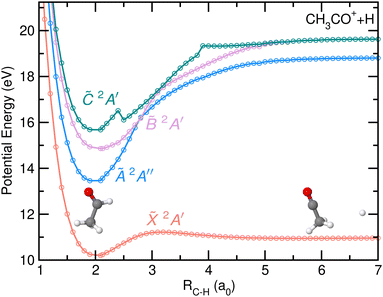
The potential energy curves (PECs) as a function of the C–H bond distance are depicted in Fig. 7. The first four electronic states of the cation have been considered in the calculations. The H-atom loss channel takes place from the carbonyl moiety, leading to the formation of CH3CO+ + H in their respective ground states through direct dissociation in the cationic ground state of acetaldehyde. A small reverse barrier of 0.27 eV, consistent with the reported Eion distribution, is observed in agreement with previous calculations.8 The dissociation is characterized by a C–C–O nuclear motion, ending in a linear geometry. Since the PECs calculated for the first excited electronic states, Ã2A′′, ![[B with combining tilde]](https://www.rsc.org/images/entities/i_char_0042_0303.gif) 2A′ and
2A′ and ![[C with combining tilde]](https://www.rsc.org/images/entities/i_char_0043_0303.gif) 2A′, do not correlate with CH3CO+ + H in their respective ground states, and thus photoionization in those states cannot lead to the H-atom loss channel, fragmentation must occur by internal conversion into a vibrationally hot cationic ground state prior to statistical dissociation. Such dissociation mechanism is characterized by a randomization of the available energy and a large intramolecular vibrational redistribution (IVR), since the molecule can explore the whole normal mode space before reaching the dissociation limit.32
2A′, do not correlate with CH3CO+ + H in their respective ground states, and thus photoionization in those states cannot lead to the H-atom loss channel, fragmentation must occur by internal conversion into a vibrationally hot cationic ground state prior to statistical dissociation. Such dissociation mechanism is characterized by a randomization of the available energy and a large intramolecular vibrational redistribution (IVR), since the molecule can explore the whole normal mode space before reaching the dissociation limit.32
A search for stationary points has revealed the presence of a conical intersection (CI) between the ![[X with combining tilde]](https://www.rsc.org/images/entities/i_char_0058_0303.gif) and à states located at ∼12.98 eV, close to the energy minimum of the à state. The CI cannot be observed in the PECs (Fig. 7) nor in the rest of the theoretical figures, as the needed geometrical modifications are related to different coordinates. The geometry of the molecule at the CI compared to the equilibrium one and to the one at the energy minimum of the à state can be found in the ESI.† Reaching the CI requires a large decrease of the H–C–H angle characterizing the methyl moiety, from 108° to 45°. The vector associated with the calculated non-adiabatic coupling, which allows a transfer of population at the CI, shows activity along this bending coordinate as well as a strong contribution along the C–C coordinate. Upon vertical ionization, this CI can be reached easily as a result of its proximity from the à state, and would be consistent with the calculations of multi-state dynamics by Rani et al.11 which show an ultrafast decay of the population from the à to the
and à states located at ∼12.98 eV, close to the energy minimum of the à state. The CI cannot be observed in the PECs (Fig. 7) nor in the rest of the theoretical figures, as the needed geometrical modifications are related to different coordinates. The geometry of the molecule at the CI compared to the equilibrium one and to the one at the energy minimum of the à state can be found in the ESI.† Reaching the CI requires a large decrease of the H–C–H angle characterizing the methyl moiety, from 108° to 45°. The vector associated with the calculated non-adiabatic coupling, which allows a transfer of population at the CI, shows activity along this bending coordinate as well as a strong contribution along the C–C coordinate. Upon vertical ionization, this CI can be reached easily as a result of its proximity from the à state, and would be consistent with the calculations of multi-state dynamics by Rani et al.11 which show an ultrafast decay of the population from the à to the ![[X with combining tilde]](https://www.rsc.org/images/entities/i_char_0058_0303.gif) states in just few hundreds of femtoseconds. The calculations by Rani et al.11 focused on the diabatic dynamics following excitation to the first seven cationic electronic states during 200 fs. However, no information was obtained on the subsequent fragmentation pathways.
states in just few hundreds of femtoseconds. The calculations by Rani et al.11 focused on the diabatic dynamics following excitation to the first seven cationic electronic states during 200 fs. However, no information was obtained on the subsequent fragmentation pathways.
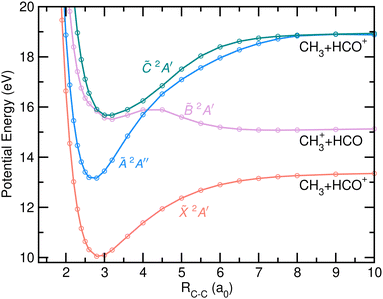
The PECs computed as a function of the C–C bond distance are depicted in Fig. 8. The calculations were carried out in this case in the Cs symmetry group, using a frozen FC geometry of the molecule. The analysis of these PECs must be limited to the area surrounding the FC region. The fragmentation pathways associated with the C–C bond cleavage are characterized by large geometrical modifications, i.e. a planarization of the CH3 moiety and an eventual linearization of HCO+. The curves for the four electronic states included show pronounced wells with considerable energy barriers for dissociation, with the exception of the ![[B with combining tilde]](https://www.rsc.org/images/entities/i_char_0042_0303.gif) state which shows a small reverse barrier and dissociation limit below the vertical energy at the FC region. A degeneration point is clearly observed between the states
state which shows a small reverse barrier and dissociation limit below the vertical energy at the FC region. A degeneration point is clearly observed between the states ![[B with combining tilde]](https://www.rsc.org/images/entities/i_char_0042_0303.gif) 2A′ and
2A′ and ![[C with combining tilde]](https://www.rsc.org/images/entities/i_char_0043_0303.gif) 2A′, probably reflecting the presence of a CI, which would allow a fast transfer of population.
2A′, probably reflecting the presence of a CI, which would allow a fast transfer of population.
Diabatic dynamics reported by Rani et al.11 show an ultrafast and efficient transfer of population from ![[C with combining tilde]](https://www.rsc.org/images/entities/i_char_0043_0303.gif) to
to ![[B with combining tilde]](https://www.rsc.org/images/entities/i_char_0042_0303.gif) , through an intersection located close in energy to the
, through an intersection located close in energy to the ![[C with combining tilde]](https://www.rsc.org/images/entities/i_char_0043_0303.gif) state minimum. A curve crossing observed at larger C–C distances between
state minimum. A curve crossing observed at larger C–C distances between ![[B with combining tilde]](https://www.rsc.org/images/entities/i_char_0042_0303.gif) 2A′ and Ã2A′′ could lead to a CI at a non-Cs symmetry. Its energy location, requiring to overcome a non-negligible energy barrier, would seem to indicate that it does not play a prominent role in the relaxation dynamics. Rani et al.11 reported indeed a slower internal conversion when starting the dynamics in
2A′ and Ã2A′′ could lead to a CI at a non-Cs symmetry. Its energy location, requiring to overcome a non-negligible energy barrier, would seem to indicate that it does not play a prominent role in the relaxation dynamics. Rani et al.11 reported indeed a slower internal conversion when starting the dynamics in ![[B with combining tilde]](https://www.rsc.org/images/entities/i_char_0042_0303.gif) due to a poor coupling between
due to a poor coupling between ![[B with combining tilde]](https://www.rsc.org/images/entities/i_char_0042_0303.gif) and Ã.
and Ã.
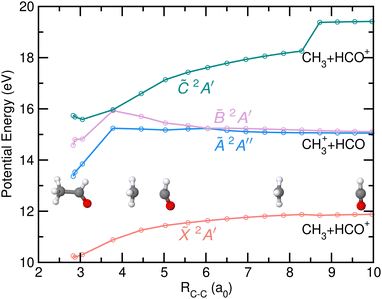
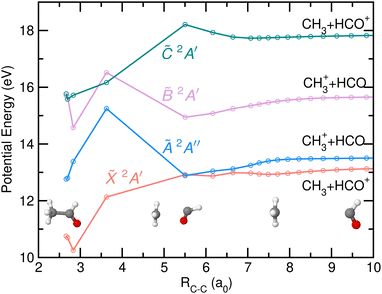
The corresponding PECs relaxing the geometry to lead to the formation of either CH3+ or HCO+ could not be computed due to severe computational challenges arising from the strong geometrical modifications involved in the dissociation. The HCO fragment presents indeed a bent geometry while the associated cation is linear and the C–C bond cleavage can lead to the formation of both dissociation limits, CH3+ + HCO and CH3 + HCO+. The NEB method, connecting the FC region to the different dissociation channels, was therefore employed providing additional information on the fragmentation dynamics, similarly to a minimum energy path.
The potential energy of the first four excited states of cationic acetaldehyde as a function of the C–C bond distance resulting from the NEB calculations are depicted in Fig. 9 and 10 for the optimization of CH3 + HCO+, and of CH3+ + HCO, respectively. The C–C bond cleavage in the ground cationic state leads to the formation of HCO+ while dissociation in the first excited state leads to the formation of CH3+.
As observed in Fig. 9, the formation of HCO+ is characterized by a planarization of the methyl moiety and a linearization of the HCO group. Photofragmentation from excited cationic states into this channel, HCO+ + CH3, requires internal conversion into the ground cation state, likely through the Ã/![[X with combining tilde]](https://www.rsc.org/images/entities/i_char_0058_0303.gif) CI, followed by statistical dissociation without any reverse energy barrier. In contrast, the formation of CH3+ from the à state, characterized by a ∼1 eV energy barrier, leads to a planarization of the methyl moiety while the HCO stays bent. Direct dissociation could occur avoiding such energy barrier. As commented on above, the CI found between the
CI, followed by statistical dissociation without any reverse energy barrier. In contrast, the formation of CH3+ from the à state, characterized by a ∼1 eV energy barrier, leads to a planarization of the methyl moiety while the HCO stays bent. Direct dissociation could occur avoiding such energy barrier. As commented on above, the CI found between the ![[X with combining tilde]](https://www.rsc.org/images/entities/i_char_0058_0303.gif) and à states allows an efficient and fast transfer of population to the cationic ground state. As can be seen in Fig. 10, a second CI, located at large C–C distances and in a flat potential energy region, could allow a transfer of population back to the à state.
and à states allows an efficient and fast transfer of population to the cationic ground state. As can be seen in Fig. 10, a second CI, located at large C–C distances and in a flat potential energy region, could allow a transfer of population back to the à state.
Photoionization into the ![[B with combining tilde]](https://www.rsc.org/images/entities/i_char_0042_0303.gif) and
and ![[C with combining tilde]](https://www.rsc.org/images/entities/i_char_0043_0303.gif) states would allow internal conversion into the à state on the good side of the barrier and thus to directly leading to C–C bond cleavage into CH3+. Note that three-body fragmentation into CH3+ + CO + H was also evaluated, but the dissociation energy lies at 14.98 eV, which is considerably higher than the CH3+ appearance energy.
states would allow internal conversion into the à state on the good side of the barrier and thus to directly leading to C–C bond cleavage into CH3+. Note that three-body fragmentation into CH3+ + CO + H was also evaluated, but the dissociation energy lies at 14.98 eV, which is considerably higher than the CH3+ appearance energy.
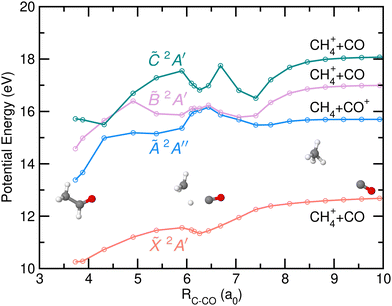
Finally, the potential energy as a function of the distance between the C-atom from the CH3 group and the center-of-mass of the CO moiety, resulting from the NEB calculations and associated with the CH4+ + CO channel is depicted in Fig. 11. Fragmentation into this channels occurs in the cationic ground state and is characterized by a direct hydrogen migration into the CH3 group while the CO group rotates away. A small stabilization of the potential energy is found at relatively large distances, due to the presence of the H-atom just in between the two groups. Notice that CH4+ is characterized by a strongly distorted geometry compared to the classical tetrahedral one due to the Jahn–Teller effect. In contrast to the calculations by Wu et al.8 where a 0.42 eV reverse barrier was reported, no reverse barrier was found in the present case. Photoionization into the à and ![[B with combining tilde]](https://www.rsc.org/images/entities/i_char_0042_0303.gif) states leads to internal conversion into the cationic ground state prior to a statistical dissociation into the CO-loss.
states leads to internal conversion into the cationic ground state prior to a statistical dissociation into the CO-loss.
4 Discussion
Based on the experimental and theoretical results, some insights on the fragmentation dynamics following valence-shell photoionization of acetaldehyde can be extracted. The measured threshold photoelectron spectrum (see Fig. 4) reveals in particular two additional fragmentation pathways: the formation of CH2+ (m/z = 14) rising at 15.1 ± 0.1 eV and of CH2CO+ (m/z = 14) at 13.10 ± 0.04 eV. At photon energies between 17 and 19.5 eV, these two fragments are the major fragmentation channels along with the methyl cation formation.The formation of CH2+ can be envisaged from three possible sources. (i) CH2+ can be produced in the secondary dissociation of CH3+ leading to H-atom loss. Considering the dissociation energy of CH3+, estimated to be around 3.0 eV,30 and the fact that the AE for CH2+ lies only 1 eV above that of CH3+, the possibility of a secondary dissociation seems unlikely. (ii) Methylene cation can be formed in a three-body dissociation of cationic acetaldehyde in correlation with HCO and H fragments. Based on thermochemical data,30 the AE for this channel would be expected to be at around 18.7 eV, which, however, is considerably larger than the AE for CH2+ reported in the present work. (iii) CH2+ can be produced in correlation with formaldehyde (H2CO). A value of 14.98 eV (ref. 30) is estimated as the AE for this pathway, which is in good agreement with the value obtained in this work. This pathway, which implies an intramolecular H-atom transfer from the methyl moiety into the carbonyl moiety seems to be the most probable one based on the energetics.
Three fragmentation pathways can explain the formation of CH2CO+: direct two-body dissociation of cationic acetaldehyde into either CH2CO+ or CHCHO+ in correlation with H2 elimination, or a sequential H-atom loss from CH3CO+. AEs for the last two options are expected to be at 14.91 eV and 15.32 eV, respectively, based on thermochemical data,30 while the first is characterized by an expected AE of 10.79 eV. Based on the observed AE of 13.10 ± 0.05 eV, the formation of CH2CO+ observed is therefore attributed to a two-body dissociation into CH2CO+ + H2. The considerable difference between the estimated AE and the experimental value may reflect the existence of a considerable energy barrier in this fragmentation pathway. This barrier might be visualized as the result of breaking two C–H bonds and the formation of H2 through an intramolecular transfer.
Besides these two additional fragments, the appearance energies are determined for the four main fragmentation pathways and additional information on the dissociation dynamics is extracted from the results. The appearance energy for the H-atom loss leading to CH3CHO+ lies in the Franck–Condon gap between the à and the ![[X with combining tilde]](https://www.rsc.org/images/entities/i_char_0058_0303.gif) cationic states in agreement with previous work. Some signal, involving some vibrational progressions are clearly observed in this region in both the KECD from fixed energy measurements (Fig. 3) and in the TPES (Fig. 4 and 6). In previous works,8 autoionizing states have been suggested to be responsible for the H-atom loss in this energy region. However, the presence of a Rydberg state would give rise to a single structure at its energy position in the TPES. The vibrational progression observed can either reflect the autoionization through a series of vibrationally excited Rydberg states or simply, although small, non-zero FC factors characterizing the ionization into high-lying vibrational states of the ground cationic state. The fact that some signal is also observed in the FC gap for measurements at fixed photon energies (see Fig. 3(a)) as well as in the PES using HeI reported previously6 would seem to support the last hypothesis. However, zero FC factors were recently obtained in this energy region,8 although the calculations were performed in the harmonic approximation and correspond to high vibrational levels. Further calculations including the anharmonicity which would be highly computationally demanding, would be needed to confirm the presence of non-zero FC factors.
cationic states in agreement with previous work. Some signal, involving some vibrational progressions are clearly observed in this region in both the KECD from fixed energy measurements (Fig. 3) and in the TPES (Fig. 4 and 6). In previous works,8 autoionizing states have been suggested to be responsible for the H-atom loss in this energy region. However, the presence of a Rydberg state would give rise to a single structure at its energy position in the TPES. The vibrational progression observed can either reflect the autoionization through a series of vibrationally excited Rydberg states or simply, although small, non-zero FC factors characterizing the ionization into high-lying vibrational states of the ground cationic state. The fact that some signal is also observed in the FC gap for measurements at fixed photon energies (see Fig. 3(a)) as well as in the PES using HeI reported previously6 would seem to support the last hypothesis. However, zero FC factors were recently obtained in this energy region,8 although the calculations were performed in the harmonic approximation and correspond to high vibrational levels. Further calculations including the anharmonicity which would be highly computationally demanding, would be needed to confirm the presence of non-zero FC factors.
Based on the theoretical results, the H-atom loss, the HCO+ and CH4+ formation are all produced through statistical dissociation on the ground state following internal conversion from excited electronic states. In contrast to the two last fragments, the H-atom loss is characterized by a small reverse barrier. Internal conversion into the cationic ground state will certainly involved the CI reported between à and ![[X with combining tilde]](https://www.rsc.org/images/entities/i_char_0058_0303.gif) states while internal conversion from
states while internal conversion from ![[B with combining tilde]](https://www.rsc.org/images/entities/i_char_0042_0303.gif) into à is expected to be less efficient, in agreement with Rani et al. calculations.11 The measured ion kinetic energy distributions reflect in all cases Boltzmann-type distributions in agreement with such statistical dissociation. Following internal conversion, the molecule is in a hot ground state and can explore the whole space before fragmentation. A complete randomization of the available energy into the different degrees of freedom is expected leading to an often broad Boltzmann-type contribution. The fragment kinetic energy distributions reported here (see Fig. 3(b) and (c)) can be understood as a result of both the dynamics at the CI and the dissociation in the ground state. The activity observed in the non-adiabatic vector along the C–C bond and along the H–C–H angle may reflect a somehow prioritized subsequent dynamics along these coordinates. This would prevent the exploration of the whole space by the molecule and thus the complete randomization of the energy which often leads to broad Eion distributions. The larger kinetic energy obtained following ionization into the
into à is expected to be less efficient, in agreement with Rani et al. calculations.11 The measured ion kinetic energy distributions reflect in all cases Boltzmann-type distributions in agreement with such statistical dissociation. Following internal conversion, the molecule is in a hot ground state and can explore the whole space before fragmentation. A complete randomization of the available energy into the different degrees of freedom is expected leading to an often broad Boltzmann-type contribution. The fragment kinetic energy distributions reported here (see Fig. 3(b) and (c)) can be understood as a result of both the dynamics at the CI and the dissociation in the ground state. The activity observed in the non-adiabatic vector along the C–C bond and along the H–C–H angle may reflect a somehow prioritized subsequent dynamics along these coordinates. This would prevent the exploration of the whole space by the molecule and thus the complete randomization of the energy which often leads to broad Eion distributions. The larger kinetic energy obtained following ionization into the ![[B with combining tilde]](https://www.rsc.org/images/entities/i_char_0042_0303.gif) state compared to the à state reflects the larger energy available upon arrival at the CI.
state compared to the à state reflects the larger energy available upon arrival at the CI.
While calculations for the formation of the methyl cation show a non-negligible energy barrier preventing direct C–C bond cleavage in the à state, an alternative pathway is found through internal conversion into the ground cationic state via the aforementioned CI, followed by dissociation in the ground state. A second CI, located at the exit channel, (see Fig. 10) could allow to switch back into the à state on the good side of the barrier leading to the formation of the methyl cation. This fragmentation pathway seems, however, unlikely taking into account the energy barrier associated with this second CI. In addition, the measured relatively broad fragment Eion distribution seems to point out to a more favorable pathway. Therefore, the formation of CH3+ likely occurs through sequential fragmentation from the CH3CO+ and CH4+ produced in agreement with the observations from Fig. 4(b) where the molar fraction for these two last fragments decreases as soon as the AE for CH3+ is reached.
5 Conclusions
The valence-shell dissociative photoionization of acetaldehyde is revisited by means of photoion photoelectron coincidence experiments in combination with tuneable synchrotron radiation. The experimental results consist of threshold photoelectron spectra for the parent ion and for each fragment ion measured in the photon energy range 10.2–19.5 eV, along with ion-electron kinetic energy coincidence diagrams obtained from measurements at fixed photon energies.The appearance energies for six fragment ions are determined with improved accuracy and, in particular, for two fragmentation channels not reported before to the best of our knowledge, i.e. the formation of CH2CO+ and CH2+, lying at 13.10 ± 0.01 eV and 15.1 ± 0.1 eV, respectively. The former is associated with an H2 elimination and a ∼2 eV reverse energy barrier characterizing this pathway. The appearance energy reported for the methylene cation CH2+ is consistent with the thermochemical value for dissociation in correlation with formaldehyde (H2CO), which would imply an intramolecular hydrogen-atom transfer. The experimental results are consistent with slow dissociation for the four main channels leading to the formation of CH3CO+, HCO+, CH4+, and CH3+.
The experiments are complemented by high-level ab initio electronic structure calculations of potential energy curves. In addition, the NEB method is employed to connect the Franck–Condon region to the formation of HCO+, CH4+, and CH3+. The H-atom loss channel, as well as, the formation of HCO+ and CH4+ are found to be produced by statistical dissociation in the ground cationic state, following internal conversion from higher ionic states. The role of a conical intersection in the internal conversion and subsequent fragmentation is discussed. A considerable energy barrier highlights dissociation into CH3+. Although the presence of two conical intersections could allow the molecule to avoid that energy barrier upon photoionization close to the appearance energy, sequential dissociation from CH3CO+ and CH4+ seems more plausible in agreement with the experimental results.
Data availability
Part of the data supporting this article has been included in the ESI† and in the Zenodo repository. The rest of the data are available from the corresponding author upon reasonable request.Conflicts of interest
There are no conflicts of interest to declare.Acknowledgements
We thank Garikoitz Balerdi and Dr David V. Chicharro for their help in the first stages of this project. This work was performed at the DESIRS beamline. We acknowledge SOLEIL for provision of synchrotron radiation facilities under proposal number 20141243, and the DESIRS beamline staff for their assistance. This work has been financed in part by the Spanish Ministry of Science and Innovation (Grant PID2021-122839NB-I00, PID2019-107115GB-C21 and PID2021-122549NB-C21) and by the Madrid Government (Comunidad de Madrid, Spain) under the Multiannual Agreement with Universidad Complutense de Madrid in the line Research Incentive for Young PhDs, in the context of the V PRICIT (Regional Programme of Research and Technological Innovation) (Grant: PR27/21-010).Notes and references
- F. Lique and A. Faure, Gas-phase chemistry in space: from elementary particles to complex organic molecules, IOP Publishing, 2019 Search PubMed.
- A. Heays, V. Bosman and E. Van Dishoeck, Astron. Astrophys., 2017, 602, A105 Search PubMed.
- F. Vazart, C. Ceccarelli, N. Balucani, E. Bianchi and D. Skouteris, Mon. Not. R. Astron. Soc., 2020, 499, 5547–5561 Search PubMed.
- J. Enrique-Romero, C. Ceccarelli, A. Rimola, D. Skouteris, N. Balucani and P. Ugliengo, Astron. Astrophys., 2021, 655, A9 Search PubMed.
- D. Chadwick and A. Katrib, J. Electron Spectrosc. Relat. Phenom., 1974, 3, 39–52 Search PubMed.
- T. Cvitas, H. Güsten and L. Klasinc, J. Chem. Phys., 1976, 64, 2549–2551 Search PubMed.
- A. J. Yencha, M. R. F. Siggel-King, G. C. King, A. E. R. Malins and M. Eypper, J. Electron Spectrosc. Relat. Phenom., 2013, 187, 65–71 Search PubMed.
- X. Wu, C. Zhang, X. Gu, C. Fittschen, J.-C. Loison, M. R. Chowdhury, G. A. Garcia, L. Nahon and X. Tang, ChemPhysChem, 2024, 25, e202400208 Search PubMed.
- S. K. Shin, B. Kim, J. G. Haldeman and S.-J. Han, J. Phys. Chem., 1996, 100, 8280–8284 Search PubMed.
- H.-T. Kim and S. L. Anderson, J. Chem. Phys., 2001, 114, 3018–3028 Search PubMed.
- V. J. Rani, A. K. Kanakati and S. Mahapat, J. Phys. Chem. A, 2022, 126, 6581–6593 Search PubMed.
- H. Jochims, W. Lohr and H. Baumgärtel, Chem. Phys. Lett., 1978, 54, 594–596 Search PubMed.
- S. K. Lee, R. Silva, M. H. Kim, L. Shen and A. G. Suits, J. Phys. Chem. A, 2007, 111(29), 6741–6745 Search PubMed.
- K. M. Kapnas, L. M. McCaslin and C. Murray, Phys. Chem. Chem. Phys., 2019, 21, 14214 Search PubMed.
- X. Tang, G. A. Garcia, J.-F. Gil and L. Nahon, Rev. Sci. Instrum., 2015, 86, 123108 Search PubMed.
- L. Nahon, N. de Oliveira, G. A. Garcia, J.-F. Gil, B. Pilette, O. Marcouillé, B. Lagarde and F. Polack, J. Synchrotron Radiat., 2012, 19, 508–520 Search PubMed.
- G. Garcia, B. C. de Miranda, M. Tia, S. Daly and L. Nahon, Rev. Sci. Instrum., 2013, 84, 053112 Search PubMed.
- G. A. García, L. Nahon and I. Powis, Rev. Sci. Instrum., 2004, 75, 4989–4996 Search PubMed.
- J. Poully, J. Schermann, N. Nieuwjaer, F. Lecomte, G. Gregoire, C. Desfrançois, G. Garcia, L. Nahon, D. Nandi and L. Poisson, et al. , Phys. Chem. Chem. Phys., 2010, 12, 3566–3572 Search PubMed.
- I. Fdez Galván, M. Vacher, A. Alavi, C. Angeli, F. Aquilante, J. Autschbach, J. J. Bao, S. I. Bokarev, N. A. Bogdanov, R. K. Carlson, L. F. Chibotaru, J. Creutzberg, N. Dattani, M. G. Delcey, S. S. Dong, A. Dreuw, L. Freitag, L. M. Frutos, L. Gagliardi, F. Gendron, A. Giussani, L. González, G. Grell, M. Guo, C. E. Hoyer, M. Johansson, S. Keller, S. Knecht, G. Kovacević, E. Källman, G. Li Manni, M. Lundberg, Y. Ma, S. Mai, J. P. Malhado, P. A. Malmqvist, P. Marquetand, S. A. Mewes, J. Norell, M. Olivucci, M. Oppel, Q. M. Phung, K. Pierloot, F. Plasser, M. Reiher, A. M. Sand, I. Schapiro, P. Sharma, C. J. Stein, L. K. Sørensen, D. G. Truhlar, M. Ugandi, L. Ungur, A. Valentini, S. Vancoillie, V. Veryazov, O. Weser, T. A. Wesołowski, P.-O. Widmark, S. Wouters, A. Zech, J. P. Zobel and R. Lindh, J. Chem. Theory Comput., 2019, 15, 5925–5964 Search PubMed.
- F. Aquilante, J. Autschbach, A. Baiardi, S. Battaglia, V. A. Borin, L. F. Chibotaru, I. Conti, L. De Vico, M. Delcey, I. Fdez Galván, N. Ferré, L. Freitag, M. Garavelli, X. Gong, S. Knecht, E. D. Larsson, R. Lindh, M. Lundberg, P. A. Malmqvist, A. Nenov, J. Norell, M. Odelius, M. Olivucci, T. B. Pedersen, L. Pedraza-González, Q. M. Phung, K. Pierloot, M. Reiher, I. Schapiro, J. Segarra-Martí, F. Segatta, L. Seijo, S. Sen, D.-C. Sergentu, C. J. Stein, L. Ungur, M. Vacher, A. Valentini and V. Veryazov, J. Chem. Phys., 2020, 152, 214117 Search PubMed.
- R. A. Kendall, J. Dunning, H. Thom and R. J. Harrison, J. Chem. Phys., 1992, 96, 6796–6806 Search PubMed.
- J. Dunning and H. Thom, J. Chem. Phys., 1989, 90, 1007–1023 Search PubMed.
- L. Rubio-Lago, G. A. Amaral, A. Arregui, J. González-Vázquez and L. Bañares, Phys. Chem. Chem. Phys., 2012, 14, 6067–6078 Search PubMed.
- H. Jónsson, G. Mills and K. W. Jacobsen, Classical and Quantum Dynamics in Condensed Phase Simulations, World Scientific, 1998, pp. 385–404 Search PubMed.
- E. Bitzek, P. Koskinen, F. Gähler, M. Moseler and P. Gumbsch, Phys. Rev. Lett., 2006, 97, 170201 Search PubMed.
- A. H. Larsen, J. J. Mortensen, J. Blomqvist, I. E. Castelli, R. Christensen, M. Dułak, J. Friis, M. N. Groves, B. Hammer, C. Hargus, E. D. Hermes, P. C. Jennings, P. B. Jensen, J. Kermode, J. R. Kitchin, E. L. Kolsbjerg, J. Kubal, K. Kaasbjerg, S. Lysgaard, J. B. Maronsson, T. Maxson, T. Olsen, L. Pastewka, A. Peterson, C. Rostgaard, J. Schiøtz, O. Schütt, M. Strange, K. S. Thygesen, T. Vegge, L. Vilhelmsen, M. Walter, Z. Zeng and K. W. Jacobsen, J. Phys.: Condens. Matter, 2017, 29, 273002 Search PubMed.
- F. Dong, S. Heinbuch, J. Rocca and E. Bernstein, J. Chem. Phys., 2006, 124, 224319 Search PubMed.
- T. Baer and W. L. Hase, Unimolecular reaction dynamics: theory and experiments, Oxford University Press, 1996, vol. 31 Search PubMed.
- B. Ruscic and D. Bross, Active Thermochemical Tables (ATcT) Thermochemical Values ver. 1.130, https://atct.anl.gov/.
- J. González-Vázquez, G. A. Garca, D. V. Chicharro, L. Bañares and S. M. Poullain, Chem. Sci., 2024, 15, 3203 Search PubMed.
- M. Ashfold, R. N. Dixon, M. Kono, D. Mordaunty and C. Reed, Philos. Trans. R. Soc., A, 1997, 355, 1659–1676 Search PubMed.
Footnote |
| † Electronic supplementary information (ESI) available: Kinetic energy release distributions for the four main fragments following photoionization at 15 eV and computed geometries for relevant points. See DOI: https://doi.org/10.1039/d4cp01984a |
| This journal is © the Owner Societies 2024 |

