 Open Access Article
A pyridinium-modified chitosan-based adsorbent for arsenic removal via a coagulation-like methodology†
Deysi J.
Venegas-García
,
Bernd G. K.
Steiger
 and
Lee D.
Wilson
 *
*
Department of Chemistry, University of Saskatchewan, 110 Science Place – Room 156 Thorvaldson Building, Saskatoon, SK S7N 5C9, Canada. E-mail: lee.wilson@usask.ca; Tel: +1-306-966-2961
First published on 19th June 2023
Abstract
The goal of this study was to synthesize a chitosan-derived adsorbent that can be used in a coagulation–flocculation (CF) process for facile integration into existing water treatment processes. Therefore, an insoluble pyridinium-modified chitosan (Chi-Py) was prepared. Structural characterization was achieved with spectroscopy (FT-IR, 13C solids NMR, and X-ray photoelectron) methods and thermogravimetric analysis. Approximately 7% di-nitrobenzene and ca. 30% pyridinium moieties were incorporated into the chitosan framework via an adapted, moderate-temperature, Zincke reaction. The arsenic removal efficiency was evaluated by a coagulation-inspired methodology at pH 7.5, where the results were compared against CF systems such as pristine chitosan, FeCl3 and chitosan–FeCl3. The kinetic and van't Hoff thermodynamic parameters for arsenic removal were calculated. Arsenic adsorption was shown to be a spontaneous and exothermic process (ΔG = −4.7 kJ mol−1; ΔH = −75.6 kJ mol−1) with a 76% arsenic removal efficiency at 23 °C and 96% at 5 °C with a maximum effective adsorbent dosage of Chi-Py of 300 mg L−1. The adsorption process for Chi-Py followed pseudo-first order kinetics, where the pyridinium-modified chitosan adsorbent can be successfully employed similar to coagulant-like systems in conventional water treatment processes. In contrast to conventional adsorbents (1–2 g L−1), a dosage of only 300 mg L−1 was required for Chi-Py that offers greater sustainability and recycling of materials. This is contrasted with single-use conventional coagulants such as FeCl3 or binary FeCl3–chitosan CF systems.
Sustainability spotlightAddressing arsenic water pollution represents a grand environmental challenge due to its widespread occurrence, high mobility and toxicity. Arsenic at elevated groundwater concentrations (“hotspots”) occurs across regions of Asia, the America’s, and Europe and represents a key global water security concern to ecosystems and human health. This research uses green chemistry to modify chitosan with suitable properties for dispersed solid phase extraction (dSPE) that reveals unique advantages over other conventional adsorbents. The facile and low-cost approach described herein is suitable for scale-up and implementation in current water treatment technologies for the sustainable treatment of arsenic-laden groundwater. Our work emphasizes the importance of the following UN sustainable development goals: water and sanitation (SDG 6); industry, innovation and infrastructure (SDG 9). |
1. Introduction
Arsenic is a highly toxic pollutant prevalent in aqueous sources such as ground water, soils and sediments. Arsenic release into the environment can occur through natural processes (erosion and leaching) or anthropogenic activities (mining, pesticides).1 Through various physical processes, water soluble arsenate species can be ingested upon dissolution, which results in detrimental effects on the ecosystem and human health. Arsenic exists in variable oxidation states and chemical forms such as organoarsenicals (monomethylarsonate, dimethylarsinate, roxarsone) or as inorganic oxyanions (As(III) or As(V)).2,3 The latter pose a significant risk for human health through tainted water sources, hence; drinking water advisories (e.g., Canada, WHO) have set limits to arsenic levels at 10 μg L−1.4,5 Mine tailings and various anthropogenic activities may result in greater arsenic levels, as highlighted by a comparative study with elevated levels of arsenic (0.7–5.5 mg L−1) in specific surface waters for lakes near Yellowknife.6,7 Such arsenic concentrations exceed the regulatory limits and require cost-effective techniques that can be readily integrated into conventional water treatment processes. In aqueous media at oxic conditions, As(V) is the dominant species at environmentally relevant conditions, where a near 1![[thin space (1/6-em)]](https://www.rsc.org/images/entities/char_2009.gif) :
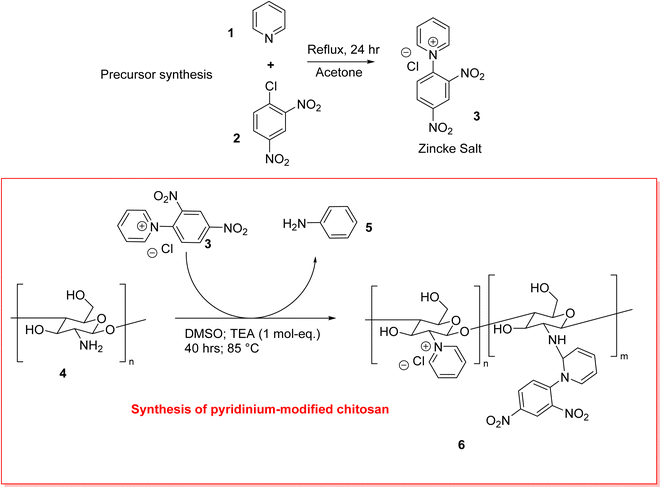
:![[thin space (1/6-em)]](https://www.rsc.org/images/entities/char_2009.gif) 1 mixture of H2AsO4− and HAsO42− co-exist at pH 7.8,9 Various remediation techniques such as precipitation, membrane filtration, reverse osmosis and adsorption are known that display variable arsenic removal efficiency.10–12 While efficient removal is desired, access to low-cost and low-maintenance methods can increase the viability of effective and sustainable water treatment. Adsorption-based processes meet such criteria, especially when employing biopolymer adsorbents.13–16 Globally, water treatment plants (WTPs) employ either coagulation or coagulation–flocculation (CF) processes for contaminant removal, where the selection of the coagulants and flocculants is of paramount importance to facilitate effective contaminant removal. Biopolymers have several advantages such as affordability, relative abundance, as exemplified by sustainable materials like cellulose-based CF systems.17 Recent research efforts have been directed at development of alternate polysaccharide-based CF systems such as chitosan (Chi).18 Chi represents a promising and versatile biopolymer that is derived from chitin, the second most abundant natural biopolymer.19–21 Chitosan is a partially deacetylated form (typically >50%) of chitin, which has hydroxyl and amine groups that present additional functionalization sites. A study by Billah et al. highlighted a modified chitosan-based adsorbent with 12.32 mg g−1 adsorption capacity at pH 5 with 99% removal.22 However, arsenic removal studies via chitosan-based adsorbents are limited by its pKa (ca. 6.5), where chitosan's arsenic removal efficacy drastically decreases at pH > 6,23–27 where acidic conditions (pH < 6) are required for optimum uptake.21 However, this is in contrast with the regularly encountered pH of natural water sources such as ground water with slightly alkaline pH conditions (ca. pH 7–8).26 Optimal chitosan-based adsorbents should be designed to obviate pH adjustments to afford more efficient water treatment. One such example for removal at pH 7 can be found in chitosan-loaded MgAl layered double hydroxides.28 The amine groups of chitosan are amenable to chemical modification to yield cationic functional groups. One such example was reported by Chen et al., where a pyridinium-moiety was grafted onto the amine-group of chitosan via a linker unit.29 However, a more direct approach is the conversion of the amine group into a pyridinium chloride moiety, according to the well-known Zincke reaction, which has been utilized to obtain such chitosan derivatives.30,31 The Zincke reaction is envisaged to require a lower temperature and shortening of the reaction time to yield a cationic form with variable hydration properties via a lower energy synthesis (cf.Scheme 1).32,33 The pyridinium-modified chitosan is posited to function as an adsorbent for efficient arsenic removal due to the pyridyl grafted units and its reduced hydrophile character (versus chitosan), where such differences in biopolymer hydration are likely to enhance arsenate uptake versus sulfate or nitrate oxyanions.34
1 mixture of H2AsO4− and HAsO42− co-exist at pH 7.8,9 Various remediation techniques such as precipitation, membrane filtration, reverse osmosis and adsorption are known that display variable arsenic removal efficiency.10–12 While efficient removal is desired, access to low-cost and low-maintenance methods can increase the viability of effective and sustainable water treatment. Adsorption-based processes meet such criteria, especially when employing biopolymer adsorbents.13–16 Globally, water treatment plants (WTPs) employ either coagulation or coagulation–flocculation (CF) processes for contaminant removal, where the selection of the coagulants and flocculants is of paramount importance to facilitate effective contaminant removal. Biopolymers have several advantages such as affordability, relative abundance, as exemplified by sustainable materials like cellulose-based CF systems.17 Recent research efforts have been directed at development of alternate polysaccharide-based CF systems such as chitosan (Chi).18 Chi represents a promising and versatile biopolymer that is derived from chitin, the second most abundant natural biopolymer.19–21 Chitosan is a partially deacetylated form (typically >50%) of chitin, which has hydroxyl and amine groups that present additional functionalization sites. A study by Billah et al. highlighted a modified chitosan-based adsorbent with 12.32 mg g−1 adsorption capacity at pH 5 with 99% removal.22 However, arsenic removal studies via chitosan-based adsorbents are limited by its pKa (ca. 6.5), where chitosan's arsenic removal efficacy drastically decreases at pH > 6,23–27 where acidic conditions (pH < 6) are required for optimum uptake.21 However, this is in contrast with the regularly encountered pH of natural water sources such as ground water with slightly alkaline pH conditions (ca. pH 7–8).26 Optimal chitosan-based adsorbents should be designed to obviate pH adjustments to afford more efficient water treatment. One such example for removal at pH 7 can be found in chitosan-loaded MgAl layered double hydroxides.28 The amine groups of chitosan are amenable to chemical modification to yield cationic functional groups. One such example was reported by Chen et al., where a pyridinium-moiety was grafted onto the amine-group of chitosan via a linker unit.29 However, a more direct approach is the conversion of the amine group into a pyridinium chloride moiety, according to the well-known Zincke reaction, which has been utilized to obtain such chitosan derivatives.30,31 The Zincke reaction is envisaged to require a lower temperature and shortening of the reaction time to yield a cationic form with variable hydration properties via a lower energy synthesis (cf.Scheme 1).32,33 The pyridinium-modified chitosan is posited to function as an adsorbent for efficient arsenic removal due to the pyridyl grafted units and its reduced hydrophile character (versus chitosan), where such differences in biopolymer hydration are likely to enhance arsenate uptake versus sulfate or nitrate oxyanions.34
Water treatment plants currently employ coagulation–flocculation (CF) processes on a wide scale, especially where inorganic coagulants such as alum and ferric salts are utilised with or without flocculants. A key feature of efficient CF-based water treatment relies on floc formation to enable phase separation of contaminants from treated water. Currently, a drawback of conventional chemical systems is the lack of biodegradability, which as been described elsewhere.18 Whereas the co-application of biodegradable polymers or biopolymers such as plant-based mucilage in conjunction with metal-salt coagulants offer an alternative strategy. Herein, a modified chitosan-based system was utilized as a dispersed solid-phase extraction (dSPE) material, where the insoluble adsorbent was directly added to afford facile separation during the treatment process.35
The key feature of this study is the facile integration of an adsorbent material into an existing process without the need to employ high dosages common to classical adsorption or extraction processes.36–38 Hence, it is posited that modified Chi can facilitate the transition from non-biodegradable materials to more sustainable water treatment options, whilst obviating the need for pH adjustments of the wastewater system. Furthermore, this facile integration into coagulation–flocculation processes negates the need to increase pH for dosage-dependent removal efficiency as for the use of iron(III) salts.39–42
This work will contribute to the field of sustainable water treatment for removal of arsenic species in aqueous media at neutral pH conditions by employing a natural biopolymer (chitosan) that typically requires more acidic conditions to be feasible.
2. Materials and methods
2.1. Materials
2.2. Characterization
![[thin space (1/6-em)]](https://www.rsc.org/images/entities/char_2009.gif) :
:![[thin space (1/6-em)]](https://www.rsc.org/images/entities/char_2009.gif) 10 weight ratio (sample
10 weight ratio (sample![[thin space (1/6-em)]](https://www.rsc.org/images/entities/char_2009.gif) :
:![[thin space (1/6-em)]](https://www.rsc.org/images/entities/char_2009.gif) KBr). The diffuse reflectance infrared Fourier transform (DRIFT) spectra were obtained at 295 K over a spectral range of 400–4000 cm−1 with a resolution of 4 cm−1, where a minimum of 128 scans were recorded and corrected relative to a background spectrum of KBr.
KBr). The diffuse reflectance infrared Fourier transform (DRIFT) spectra were obtained at 295 K over a spectral range of 400–4000 cm−1 with a resolution of 4 cm−1, where a minimum of 128 scans were recorded and corrected relative to a background spectrum of KBr.
2.3. Arsenic removal methods
 | (1) |
 | (2) |
| qt = qe(1 − e−k1t) | (3) |
 | (4) |
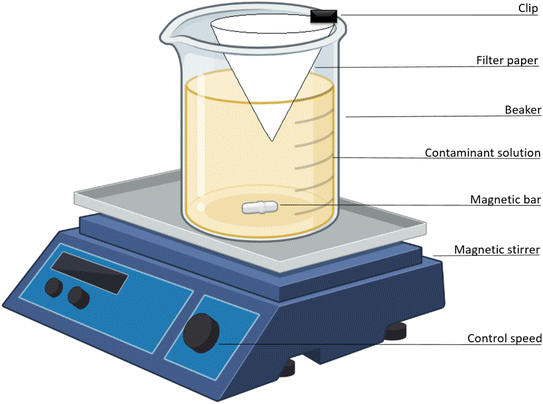
Kinetic studies were performed in situ using a one-pot method (Fig. 1), as described by Venegas-García & Wilson.46 Briefly, a 600 mL beaker containing 400 mL of 5 mg per L arsenic solution (pH 7.5) was mixed by magnetic stirring. A filter paper (Whatman no. 40) was folded into a cone and attached to the beaker that was immersed in the solution at a depth of 2 cm whilst stirring at a fixed rate (25 rpm). An initial 3 mL was sampled from within the filter cone interior. Sampling within the filter cone began at time (t) = 0, when the coagulant-based material was added, which continued at 1 min intervals for 10 min, then for a further 10 min at 2 min intervals, and finally for 50 min at 5 min intervals. Stirring was stopped at t = 30 min. After 50 min, sampling continued for a further 40 min at 10 min intervals. Sample aliquots were prepared for UV-vis spectral analysis, as discussed above. The adsorption capacity at different times was determined using eqn (2). To measure adsorption kinetics at variable temperatures, the one-pot experiment was thermally regulated using an Endocal refrigerated circulating bath (−40 to 40 °C) with flow control (Neslab, Newington, NH, USA) at 23 °C, 15 °C, and 5 °C ± 0.5 °C.
| ΔG° = ΔH° − TΔS° | (5) |
To obtain ΔG° for calculation of ΔH° and ΔS°, eqn (6) and (7) were used:
ΔG° = −RT![[thin space (1/6-em)]](https://www.rsc.org/images/entities/char_2009.gif) ln ln![[thin space (1/6-em)]](https://www.rsc.org/images/entities/char_2009.gif) Ke Ke | (6) |
 | (7) |
To obtain the thermodynamic parameters, the slope of a plot of ln![[thin space (1/6-em)]](https://www.rsc.org/images/entities/char_2009.gif) Kevs. 1/T (slope = −ΔH°/R; intercept = ΔS°/R) was obtained.
Kevs. 1/T (slope = −ΔH°/R; intercept = ΔS°/R) was obtained.
3. Results and discussion
The following section is divided into three parts, where the first part covers the structural characterization of the material. The second section characterizes the utility of Chi-Py for the removal of arsenic via the CF-methodology, where the results are compared against single component systems (chitosan or FeCl3) or a binary system (Fe–chitosan) at pH 7.5. The third part describes the kinetic and thermodynamic parameters of arsenic adsorption onto Chi-Py to evaluate the adsorptive removal at variable temperatures.3.1. Characterization
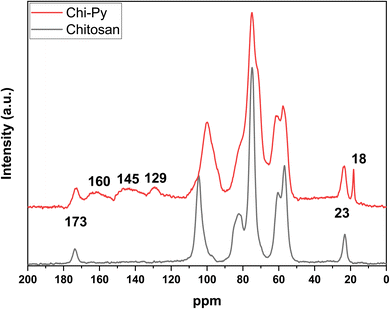
Herein, the characteristic polysaccharide backbone was visible between 110 and 50 ppm for chitosan, with additional signals at 23 ppm (acetyl-CH3) and 173 ppm (acetyl-C![[double bond, length as m-dash]](https://www.rsc.org/images/entities/char_e001.gif) O).47 The pyridinium-modified chitosan also observes these signals, but also has three broad overlapping signals between 165 and 120 ppm in addition, indicating additional aromatic moieties stemming from partially converted, attached N-2,4-dinitrobenzene (around 160 ppm).48,49 In addition, a sharp signal at 18 ppm appeared, which could indicate N-2,4-dinitrobenzene-groups adjacent to the acetyl-moiety, as the reactants observe different shifts in ppm, where triethyl ammonium chloride occurs near 10 and 46 ppm.50
O).47 The pyridinium-modified chitosan also observes these signals, but also has three broad overlapping signals between 165 and 120 ppm in addition, indicating additional aromatic moieties stemming from partially converted, attached N-2,4-dinitrobenzene (around 160 ppm).48,49 In addition, a sharp signal at 18 ppm appeared, which could indicate N-2,4-dinitrobenzene-groups adjacent to the acetyl-moiety, as the reactants observe different shifts in ppm, where triethyl ammonium chloride occurs near 10 and 46 ppm.50
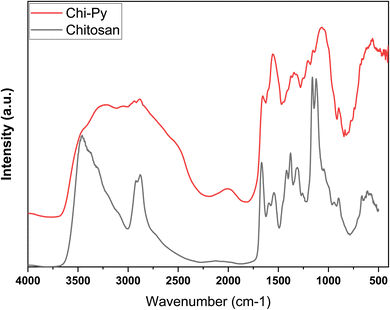
For chitosan, the band around 3500 cm−1 can be ascribed to its –NH and –OH groups, whereas the –CH bands can be observed near 2800 cm−1. The amine-groups of chitosan concur with the band at 1661 cm−1 (amide C![[double bond, length as m-dash]](https://www.rsc.org/images/entities/char_e001.gif) O), in conjunction with 1163 cm−1 and 1123 cm−1, which are identified as C–O and C–H stretching.20 A small signature around 2095 cm−1 relates to –CH stretching. For pyridinium-modified chitosan, these IR signals appear abated and additional bands between 3500 and 2250 cm−1 are visible, which are attributed to aromatic CH bands.48,49 Furthermore, a strong band at 1657 cm−1 can ascribed to a conjugated C
O), in conjunction with 1163 cm−1 and 1123 cm−1, which are identified as C–O and C–H stretching.20 A small signature around 2095 cm−1 relates to –CH stretching. For pyridinium-modified chitosan, these IR signals appear abated and additional bands between 3500 and 2250 cm−1 are visible, which are attributed to aromatic CH bands.48,49 Furthermore, a strong band at 1657 cm−1 can ascribed to a conjugated C![[double bond, length as m-dash]](https://www.rsc.org/images/entities/char_e001.gif) N band. The broad and strong IR band near 1545 cm−1 concurs with C
N band. The broad and strong IR band near 1545 cm−1 concurs with C![[double bond, length as m-dash]](https://www.rsc.org/images/entities/char_e001.gif) C (aromatic) contributions.51,52
C (aromatic) contributions.51,52
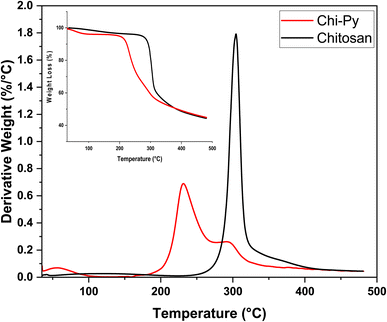
In the DTG profile, a greater water loss centred near 50 °C is noted for Chi-Py, as compared to pristine chitosan.53,54 Chitosan is characterized by a sharp peak (onset ca. 250 °C, maximum 305 °C), which can be assigned to the dehydration, depolymerization and decomposition of N-acetyl- and amine groups.55 Chi-Py, on the other hand, shows a large decomposition event shifted to a lower temperature onset (ca. 170 °C) with a maxima near 230 °C, which coincides with a second, smaller decomposition event with a maxima near 290 °C, which can be ascribed to the chitosan backbone. It is posited that the pyridinium-moiety induces this shift in stability to lower temperatures, due to disruption of the semi-crystalline structure of unmodified chitosan. Parallel trends have been ascribed to modified cellulosic materials, which is related to disruption of the interchain hydrogen bonding of cellulose.56,57 Additionally, the TG profiles (cf. inset in Fig. 4) show a similar remaining weight at 500 °C, indicating that the carbonized backbone remains, which displays similar trends for both biopolymers.
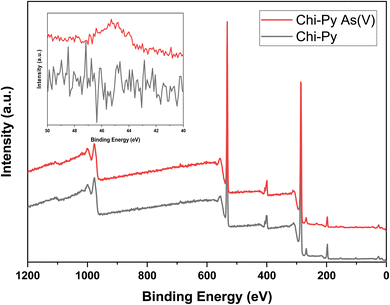 | ||
| Fig. 5 XPS survey scan of Chi-Py before (Chi-Py) and after arsenic adsorption (Chi-Py As(V)) with the As 3d narrow scan as the inset. | ||
| Chi-Py | Chi-Py As(V) | |||||
|---|---|---|---|---|---|---|
| Spot 1 | Spot 2 | Average | Spot 1 | Spot 2 | Average | |
| C | 62.27 | 60.32 | 61.30 | 61.68 | 63.03 | 62.36 |
| N | 5.93 | 6.97 | 6.45 | 5.93 | 5.62 | 5.78 |
| O | 26.85 | 26.81 | 26.83 | 27.58 | 28.18 | 27.88 |
| Cl | 4.95 | 2.26 | 3.61 | 3.44 | 2.95 | 3.20 |
| As | 0 | 0 | 0 | 1.39 | 0.22 | 0.81 |
Based on the survey scan of Chi-Py before and after adsorption (Chi-Py As(V)), elemental quantification was performed to support that arsenic is adsorbed onto the insoluble Chi-Py derivative and to investigate whether the chloride content decreased (cf.Table 1).
In the pristine material, chloride was present and was quantified to ca. 3.6 wt%. As expected, arsenic could not be identified in the pristine material before adsorption. After adsorption, a small amount of arsenic (0.81 wt%) was quantified in the matrix of Chi-Py, with a slightly lower average chloride content (3.2 wt%). This trend indicates anion exchange as adsorption mechanism and coordination of arsenic while replacing chloride.
In addition, the N 1s narrow scan was performed to elucidate the oxidation states of nitrogen within the material before and after adsorption (cf.Fig. 6) using a binding energy window wide enough to capture all possible nitrogen species.58
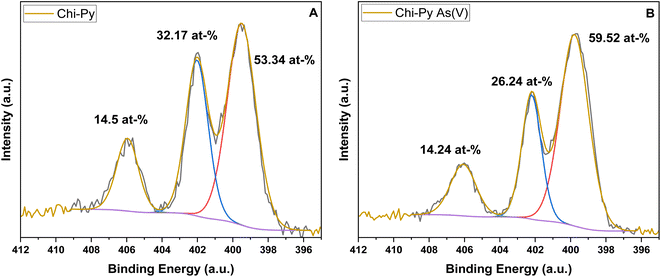 | ||
| Fig. 6 The oxidation state of nitrogen via N 1s narrow scan of the pristine Chi-Py (A) and Chi-Py As(V) after (B) adsorption. | ||
The peak around 399.50 eV in Chi-Py and 399.78 eV in Chi-Py As(V) was identified as the amine band, whereas the pyridinium signature appeared at 402.03 eV and 402.20 eV in Chi-Py and Chi-Py As(V), respectively. The identified nitro-group nitrogen appeared at 495.95 eV in Chi-Py and 406.07 eV in Chi-Py As(V) respectively.59 While inhomogeneities and variable surface characteristics alter the local elemental concentrations, which results in variable elemental quantification. For example, the N-atom of the nitro-group was quantified as 14.49 atom% in Fig. 6A and 14.24 atom% in Fig. 6B. Based on this evaluation, it can be concluded that after exposure to aqueous media, negligible levels of di-nitro compound dissolved and remained bound to the material. The stability of Chi-Py does not pose significant risks to aquatic life due to its chemical stability and relative insolubility in aqueous media.
3.2. Arsenic removal via a coagulation-like methodology
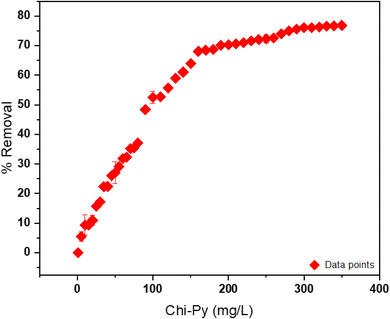 | ||
| Fig. 7 Removal% and Chi-Py dosage evaluation from 1–400 mg L−1 with constant arsenic(V) concentration at 23 °C and pH 7.5. | ||
| EXP | Single component | Single component | Binary system | ||||
|---|---|---|---|---|---|---|---|
| Chitosan (mg L−1) | % removal | Fe3+ (mg L−1) | % removal | Fe3+ (mg L−1) | Chitosan (mg L−1) | % removal | |
| 1 | 0.5 | 1.6 | 8.3 | 3.2 | 8.3 | 5 | 4.1 |
| 2 | 1.0 | 2.4 | 7.1 | 5.7 | 7.1 | 5 | 4.1 |
| 3 | 3.0 | 3.2 | 6.3 | 8.9 | 6.3 | 5 | 4.9 |
| 4 | 5.0 | 4.1 | 5.6 | 73.9 | 5.6 | 5 | 4.9 |
| 5 | 10.0 | 1.6 | 5 | 68.1 | 5 | 5 | 57.2 |
| 6 | 20.0 | 1.6 | 4.6 | 58.9 | 4.6 | 5 | 69.1 |
| 7 | 50.0 | 1.6 | 4.2 | 53.9 | 4.2 | 5 | 63.5 |
| 8 | 100.0 | 1.6 | 3.8 | 46 | 3.9 | 5 | 43.7 |
The removal (%) of arsenic through chitosan (single component system) and a binary system (Fe–chitosan) was investigated under the same conditions at pH 7.5 and 23 °C (cf.Table 2) until a decrease in the removal efficiency was observed.
Under same conditions for arsenic concentration and pH, pristine chitosan, FeCl3 and Fe–chitosan were tested as CF systems to compare with the efficiency of Chi-Py. Pristine chitosan as the coagulant for arsenic removal under an initial pH 7.5, showed a low efficiency of removal (4%, see Table 2). This can be attributed to greater chitosan solubility (at acidic pH) and surface charge (pHpzc = 6.5), especially for pH < pHpzc. Application of FeCl3 as coagulant showed a 73% removal almost comparable with the Chi-Py material (76%). Finally, for the process with FeCl3 as coagulant and pristine chitosan as the flocculant, a 69% removal efficiency was reached. Additional comparison of arsenic removal through various coagulants and flocculants was outlined in Table 3, where a comparison of the results for the Chi-Py obtained herein with other biopolymer systems reveal that comparable arsenic removal (%) could be achieved.
| Flocculant (mg L−1) | Concentration (mg L−1) | Coagulant | Concentration (mg L−1) | As(V) (mg L−1) | pH | Removal (%) |
|---|---|---|---|---|---|---|
| a Adapted from Table 4 in ref. 18. | ||||||
| Aloe vera gum | 2 | PAC | 3 | 0.2–1 | 5 | 92.6 |
| Chitosan | 0.5 | FeCl3 | 0.2–1 | 7 | ca. 100 | |
| Opuntia ficus-indica gum | 350 | — | — | 0.002–0.01 | 5.9 | 70 |
| — | — | FeCl3 | 27.029 | 1 | 5 | 98 |
| — | — | Fe2(SO4)3 | 100 | 5 | 6 | 99 |
| — | — | Al2(SO4)3 | 25–50 | 0.065–0.216 | 7–8 | 81 |
| Flaxseed gum | 64 | FeCl3 | 35 | 50 | 7 | 90 |
| Fenugreek gum | 52 | FeCl3 | 33 | 50 | 7 | 90 |
3.3. Kinetic and thermodynamic investigation of Chi-Py
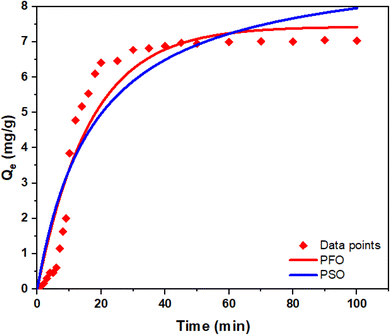
After evaluation of the arsenic removal efficacy of Chi-Py with the jar test apparatus, an investigation of the kinetics and thermodynamic parameters of the arsenic removal by Chi-Py were estimated by employing an analogous experimental approach via a one-pot setup (cf.Fig. 1). The one pot setup enables in situ sampling and further insight on the arsenic adsorption process, along with the capability of adsorption kinetics at variable temperature conditions.| Pseudo-first order model | Pseudo-second order model | ||||
|---|---|---|---|---|---|
| k 1 (min−1) | q e (mg g−1) | R 2 | k 2 (M−1 min−1) | q e (mg g−1) | R 2 |
| 0.0609 ± 0.008 | 2.9739 ± 0.1481 | 0.912 | 0.0060 ± 0.0019 | 9.3635 ± 0.8040 | 0.880 |
The adsorption process of arsenic occurs into two stages: a fast initial adsorption process, where ca. 90% of the equilibrium adsorption capacity was reached, followed by a subsequent slow adsorption process, where the adsorption capacity gradually approaches pseudo-equilibrium conditions. The kinetic behavior of Chi-Py for the removal of arsenic is shown in Fig. 8, where the two kinetic models (PFO and PSO) were used to fit the kinetic adsorption profiles for the removal of As(V).
The better fit for the PFO kinetic model mirrors the trends observed for the removal of other pollutants during the CF process, unlike classical adsorption processes, as outlined elsewhere.18,46,61 This further highlights the applicability of the prepared material for arsenic removal through this one-pot process, as compared to (batch) adsorption removal.
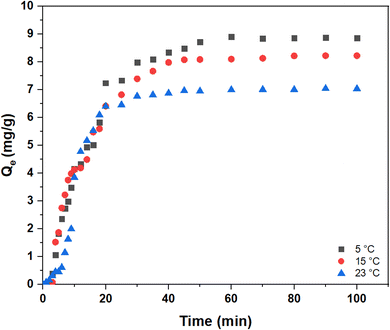
To study the effect of temperature on the kinetics for the removal of arsenic, variable temperature conditions were tested. Fig. 9 shows that the kinetics for arsenic removal at 5, 15, and 23 °C. Kinetic results for arsenic showed that by increasing the temperature from 5 to 23 °C, the adsorption capacity decreased from 8.9 to 7.0 mg g−1. Temperature is a crucial parameter in adsorption processes, where the adsorption–desorption equilibrium can be shifted by an increase or decrease in temperature. For example, exothermic adsorption processes may observe increased desorption upon increased temperatures.62
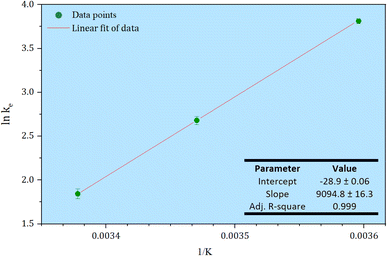 | ||
| Fig. 10 A van't Hoff plot for estimation of the thermodynamic parameters of the arsenic adsorption process. | ||
Table 5 shows the thermodynamic parameters: ΔG°, ΔH°, and ΔS°. The negative value of ΔG° indicates the spontaneity of the process and shows that the adsorption is favourable for arsenic, which proceeds less favourably as the temperature increases with an accompanying decrease in qe. Negative values of the Gibbs free energy (ΔG°) with greater magnitude indicates a greater driving force for the adsorption. Negative values for the change in enthalpy (ΔH°) confirmed that the process is exothermic in nature, which supports that the process is physical adsorption, and provides the main driving force that governs the ΔG° for the process. According to Ohale et al.63 an adsorptive process is physical in nature if the values of ΔH < 80 kJ mol−1. The obtained value is slightly below this threshold (−75 kJ mol−1) that concurs with a physisorption process.64
| Temperature (K) | ΔG° (kJ mol−1) | ΔH° (kJ mol−1) | ΔS° (J K mol−1) |
|---|---|---|---|
| 296.1 | −4.7 | −75.6 | −233.4 |
| 288.1 | −6.6 | ||
| 278.1 | −9.0 |
Interestingly, the negative ΔS° value would indicate that the adsorption process contributes to reduced disorder overall. It is therefore posited, that during the adsorption process, the low hydration energy and subsequent dehydration and association process outweighs any potentially increased disorder through liberated solvent from the solvated anions. In summary, although ΔS° does not favour a spontaneous process, the exothermic nature of the association process results in favourable adsorption overall. The adsorption process becomes non-spontaneous at a temperature above ca. 42 °C.
4. Conclusion
In this study, a pyridinium-modified insoluble chitosan-derivative (Chi-Py) was prepared through an adapted solid-phase synthesis that employs DMSO as the solvent for use in a coagulation–flocculation-based methodology for facile integration within existing water treatment processes. The characterization was performed via spectroscopy (FT-IR, 13C solids NMR, XPS) and TGA. The modified biopolymer was shown to contain both pyridinium chloride (ca. 30%) and di-nitro-containing moieties (ca. 7%) that are covalently bound and remain grafted to the biopolymer structure even after exposure to aqueous media. The coagulation study unveiled that, an arsenic concentration at 5 mg L−1 and at 23 °C, resulted in 70% removal at a Chi-Py dosage of 150 mg L−1, whereas maximum removal of 76% occurred at a dosage of 300 mg L−1. By contrast, chitosan displayed a 4% removal under the same conditions, whereas FeCl3 reached 73% removal, while the binary (FeCl3 + chitosan) system only reached a 69% arsenic removal. The thermodynamics of arsenic removal via Chi-Py are listed: ΔH° = −75.6 kJ mol−1, ΔS° = −233.4 J K−1 mol−1 and ΔG° = −4.7 kJ mol−1 at 23 °C with a kinetic adsorption profile described by the PFO model. Furthermore, the removal efficiency increased to 96% at 5 °C (cf. Table S1; ESI†). The use of Chi-Py obviates greater dosages (gram per L to decagram per L) noted for conventional adsorbents. In contrast to common coagulants, such as FeCl3, that require a far lower dosage (at acidic conditions), where a small error in concentration can result in catastrophic loss of its removal performance, Chi-Py can be used across a broader dosage range (at pH > pHpzc) without incurring detrimental loss in the removal efficiency.This study employed a modified chitosan-based adsorbent with pyridinium moiety for effective arsenate removal at pH 7.5 (unlike pristine chitosan) via a coagulation-based compatible process that is commonly used in WTPs. Future research hereby can be divided in two distinct directions, where reusability and improved separation can be achieved (below 10 μg L−1 for arsenic), and the favourable sustainability of such materials can be studied for the treatment of environmental water samples.
Author contributions
D. J. V.-G.: writing, editing, experimental & data analysis; B. G. K. S.: writing, conceptualisation & materials preparation/characterization, editing; L. D. W.: funding acquisition, writing – review & editing, supervision and funding.Conflicts of interest
The authors declare that they have no known competing financial interests or personal relationships that could have appeared to influence the work reported in this research.Acknowledgements
LDW gratefully acknowledges the funding provided by the Government of Canada through the Natural Sciences and Engineering Research Council of Canada (Discovery Grant Number: RGPIN 04315-2021). The Saskatchewan Structural Science Centre (SSSC) is acknowledged for providing facilities to conduct this research. The authors wish to make a land acknowledgement that this work was carried out in Treaty 6 Territory and the Homeland of the Métis. As such, we pay our respect to the First Nations and Métis ancestors of this place and reaffirm our relationship with one another.References
- J.-Y. Chung, S.-D. Yu and Y.-S. Hong, J. Prev. Med. Public Health, 2014, 47, 253–257 CrossRef PubMed.
- G. V. Sousa, V. L. G. Teles, E. G. Pereira, L. V. Modolo and L. M. Costa, J. Hazard. Mater., 2021, 123565 CrossRef CAS PubMed.
- Z. Babazad, F. Kaveh, M. Ebadi, R. Z. Mehrabian and M. H. Juibari, Heliyon, 2021, 7, e06631 CrossRef CAS PubMed.
- WHO, Guidelines for Drinking-Water Quality Fourth Edition incorporating the first and second addends, https://apps.who.int/iris/rest/bitstreams/1414381/retrieve Search PubMed.
- A. Shah, A. Arjunan, A. Baroutaji and J. Zakharova, Water Sci. Eng. DOI:10.1016/j.wse.2023.04.003 , in press.
- S. Wang and C. N. Mulligan, Sci. Total Environ., 2006, 366, 701–721 CrossRef CAS PubMed.
- B. C. Astles, J. Chételat, M. J. Palmer and J. C. Vermaire, PLoS One, 2022, 17, e0279412 CrossRef CAS PubMed.
- M. S. Reid, K. S. Hoy, J. R. M. Schofield, J. S. Uppal, Y. Lin, X. Lu, H. Peng and X. C. Le, TrAC, Trends Anal. Chem., 2020, 123, 115770 CrossRef CAS.
- Z. Zhang, J. Li, C. Sun, T. F. Marhaba, W. Zhang and Y. Zhang, Water, Air, Soil Pollut., 2016, 227, 309 CrossRef.
- T. A. Kurniawan, W. Lo, X. Liang, H. H. Goh, M. H. D. Othman, K.-K. Chong and K. W. Chew, Sep. Purif. Technol., 2023, 314, 123474 CrossRef CAS.
- R. S. Neisan, N. M. C. Saady, C. Bazan, S. Zendehboudi, A. Al-nayili, B. Abbassi and P. Chatterjee, Clean Technol., 2023, 5, 352–402 CrossRef.
- I. Issahaku, I. K. Tetteh and A. Y. Tetteh, Environ. Adv., 2023, 11, 100351 CrossRef CAS.
- H. Zeng, M. Arashiro and D. E. Giammar, Water Res., 2008, 42, 4629–4636 CrossRef CAS PubMed.
- Y. John, V. E. David and D. Mmereki, Int. J. Chem. Eng., 2018, 2018, 1–21 CrossRef.
- A. Benhamou, J. P. Basly, M. Baudu, Z. Derriche and R. Hamacha, J. Colloid Interface Sci., 2013, 404, 135–139 CrossRef CAS PubMed.
- S. Rawat, M. Chaudhary and A. Maiti, J. Environ. Chem. Eng., 2023, 11, 109431 CrossRef CAS.
- M. T. Motloung, S. I. Magagula, A. Kaleni, T. S. Sikhosana, K. Lebelo and M. J. Mochane, Water, 2023, 15, 793 CrossRef CAS.
- D. J. Venegas-García and L. D. Wilson, Materials, 2022, 15, 8691 CrossRef PubMed.
- S. Ahmed and S. Ikram, Chitosan, John Wiley & Sons, Inc., Hoboken, NJ, USA, 2017 Search PubMed.
- M. Eddya, B. Tbib and K. EL-Hami, Heliyon, 2020, 6, e03486 CrossRef.
- K. C. M. Kwok, L. F. Koong, T. Al Ansari and G. McKay, Environ. Sci. Pollut. Res., 2018, 25, 14734–14742 CrossRef CAS PubMed.
- R. El Kaim Billah, M. Aminul Islam, H. Lgaz, E. C. Lima, Y. Abdellaoui, Y. Rakhila, O. Goudali, H. Majdoubi, A. A. Alrashdi, M. Agunaou and A. Soufiane, Arabian J. Chem., 2022, 15, 104123 CrossRef CAS.
- H. K. Agbovi and L. D. Wilson, in Natural Polymers-Based Green Adsorbents for Water Treatment, Elsevier, 2021, pp. 1–51 Search PubMed.
- M. M. Hassan, M. H. Mohamed, I. A. Udoetok, B. G. K. Steiger and L. D. Wilson, Polymers, 2020, 12, 1502 CrossRef CAS PubMed.
- Q. Z. Wang, X. G. Chen, N. Liu, S. X. Wang, C. S. Liu, X. H. Meng and C. G. Liu, Carbohydr. Polym., 2006, 65, 194–201 CrossRef CAS.
- S. Jiang, X. Wu, S. Du, Q. Wang and D. Han, Water, 2022, 14, 2813 CrossRef CAS.
- A. R. Karbassi, M. Heidari, A. R. Vaezi, A. R. V. Samani, M. Fakhraee and F. Heidari, Environ. Earth Sci., 2014, 72, 457–465 CrossRef CAS.
- R. E. K. Billah, Z. Azoubi, E. A. López-Maldonado, H. Majdoubi, H. Lgaz, E. C. Lima, A. Shekhawat, Y. Tamraoui, M. Agunaou, A. Soufiane and R. Jugade, ACS Omega, 2023, 8, 10051–10061 CrossRef CAS.
- L. Chen, J. Tang, S. Wu, S. Wang and Z. Ren, Carbohydr. Polym., 2022, 286, 119307 CrossRef CAS PubMed.
- J.-Z. Guo, H. Xu, L. Chen and B. Li, Bioresour. Technol., 2022, 365, 128112 CrossRef CAS PubMed.
- F. Gonçalves and R. Freitas, J. Braz. Chem. Soc., 2019, 30(11), 2318–2323 Search PubMed.
- M. Eda, M. J. Kurth and M. H. Nantz, J. Org. Chem., 2000, 65, 5131–5135 CrossRef CAS.
- S. Zhao, X. Xu, L. Zheng and H. Liu, Ultrason. Sonochem., 2010, 17, 685–689 CrossRef CAS PubMed.
- L. N. Pincus, H. E. Rudel, P. V. Petrović, S. Gupta, P. Westerhoff, C. L. Muhich and J. B. Zimmerman, Environ. Sci. Technol., 2020, 54, 9769–9790 CrossRef CAS PubMed.
- P. Ścigalski and P. Kosobucki, Molecules, 2020, 25, 4869 CrossRef.
- N. Wang, N. Wang, L. Tan, R. Zhang, Q. Zhao and H. Wang, Sci. Total Environ., 2020, 726, 138541 CrossRef CAS PubMed.
- B. R. C. Vieira, A. M. A. Pintor, R. A. R. Boaventura, C. M. S. Botelho and S. C. R. Santos, J. Environ. Manage., 2017, 192, 224–233 CrossRef CAS.
- A. Maria, E. Mayasari, U. Irawati and Zulfikurrahman, IOP Conf. Ser.: Mater. Sci. Eng., 2020, 980, 012077 CAS.
- J. Ge, B. Guha, L. Lippincott, S. Cach, J. Wei, T. L. Su and X. Meng, Sci. Total Environ., 2020, 725, 138351 CrossRef CAS PubMed.
- C. C. Osuna-Martínez, M. A. Armienta, M. E. Bergés-Tiznado and F. Páez-Osuna, Sci. Total Environ., 2021, 752 Search PubMed.
- F. Hesami, B. Bina, A. Ebrahimi and M. Amin, Int. J. Environ. Health Eng., 2013, 2, 17 CrossRef.
- B. S. Rathi and P. S. Kumar, J. Hazard. Mater., 2021, 418, 126299 CrossRef CAS.
- N. Fairley, V. Fernandez, M. Richard-Plouet, C. Guillot-Deudon, J. Walton, E. Smith, D. Flahaut, M. Greiner, M. Biesinger, S. Tougaard, D. Morgan and J. Baltrusaitis, Appl. Surf. Sci. Adv., 2021, 5, 100112 CrossRef.
- N. K. Ibnul and C. P. Tripp, Talanta, 2021, 225, 122023 CrossRef CAS PubMed.
- T. Okazaki, H. Kuramitz, N. Hata, S. Taguchi, K. Murai and K. Okauchi, Anal. Methods, 2015, 7, 2794–2799 RSC.
- D. J. Venegas-García and L. D. Wilson, Materials, 2023, 16, 655 CrossRef.
- H. Saito, R. Tabeta and K. Ogawa, Macromolecules, 1987, 20, 2424–2430 CrossRef CAS.
- J. Wang and S. Zhuang, J. Cleaner Prod., 2022, 355, 131825 CrossRef CAS.
- J.-Z. Guo, H. Xu, L. Chen and B. Li, Bioresour. Technol., 2022, 365, 128112 CrossRef CAS PubMed.
- T. S. Jo, J. J. Koh, H. Han and P. K. Bhowmik, Mater. Chem. Phys., 2013, 139, 901–910 CrossRef CAS.
- K. Wieszczycka, K. Filipowiak, A. Lewandowska, A. Marcinkowska and M. Nowicki, Molecules, 2022, 27, 1723 CrossRef CAS PubMed.
- M. Katcka and T. Urbanski, Bull. Acad. Pol. Sci., 1964, 12, 615–621 CAS.
- N. Johar, I. Ahmad and A. Dufresne, Ind. Crops Prod., 2012, 37, 93–99 CrossRef CAS.
- Y. A. Anisimov, D. E. Cree and L. D. Wilson, J. Compos. Sci., 2020, 4, 18 CrossRef CAS.
- C. Peniche-Covas, W. Argüelles-Monal and J. San Román, Polym. Degrad. Stab., 1993, 39, 21–28 CrossRef CAS.
- N. Achalhi, Y. El Ouardi, R. El Yousfi, M. Lamsayah, S. El Barkany, K. Laatikainen and A. El Idrissi, Cellulose, 2023, 30, 1483–1502 CrossRef CAS.
- F. L. Bernard, R. B. Duczinski, M. F. Rojas, M. C. C. Fialho, L. Á. Carreño, V. V. Chaban, F. D. Vecchia and S. Einloft, Fuel, 2018, 211, 76–86 CrossRef CAS.
- J. F. Moulder and J. Chastain, Handbook of X-Ray Photoelectron Spectroscopy: A Reference Book of Standard Spectra for Identification and Interpretation of XPS Data, Physical Electronics Division, Perkin-Elmer Corporation, 1992 Search PubMed.
- C. Chenzhong, J. Chem. Educ., 1993, 70(1), 25 CrossRef.
- M. Mohamed and L. Wilson, Nanomaterials, 2015, 5, 969–980 CrossRef CAS.
- H. K. Agbovi and L. D. Wilson, Carbohydr. Polym., 2018, 189, 360–370 CrossRef CAS PubMed.
- B. S. Yadav and S. Dasgupta, Inorg. Chem. Commun., 2022, 137, 109203 CrossRef CAS.
- P. E. Ohale, C. E. Onu, N. J. Ohale and S. N. Oba, Chem. Eng. J. Adv., 2020, 4, 100036 CrossRef CAS.
- T. A. Saleh, Interface Science and Technology, 2022, vol. 34, pp. 39–64 Search PubMed.
Footnote |
| † Electronic supplementary information (ESI) available: Table S1: Effect of temperature on arsenic removal evaluated through kinetic experiments for Chi-Py. See DOI: https://doi.org/10.1039/d3su00130j |
| This journal is © The Royal Society of Chemistry 2023 |

