Experimental and theoretical investigations on the anti-perovskite nitrides Co3CuN, Ni3CuN and Co3MoN for ammonia synthesis†
Received
10th November 2022
, Accepted 25th November 2022
First published on 28th November 2022
Abstract
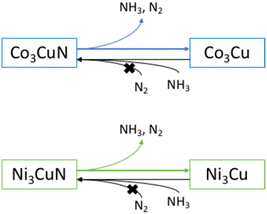
The ammonia synthesis activities of the anti-perovskite nitrides Co3CuN and Ni3CuN have been compared to investigate the possible metal composition–activity relationship. Post-reaction elemental analysis showed that the activity for both nitrides was due to loss of lattice nitrogen rather than a catalytic process. Co3CuN was observed to convert a higher percentage of lattice nitrogen to ammonia than Ni3CuN and was active at a lower temperature. The loss of lattice nitrogen was revealed to be topotactic and Co3Cu and Ni3Cu were formed during the reaction. Therefore, the anti-perovskite nitrides may be of interest as reagents for the formation of ammonia through chemical looping. The regeneration of the nitrides was achieved by ammonolysis of the corresponding metal alloys. However, regeneration using N2 was shown to be challenging. In order to understand the difference in reactivity between the two nitrides, DFT techniques were applied to investigate the thermodynamics of the processes involved in the evolution of lattice nitrogen to the gas phase via conversion to N2 or NH3, revealing key differences in the energetics of bulk conversion of the anti-perovskite to the alloy phase, and in loss of surface N from the stable low-index N-terminated (111) and (100) facets. Computational modelling of the density of states (DOS) at the Fermi level was performed. It was shown that the Ni and Co d states contributed to the density of states and that the Cu d states only contributed to the DOS for Co3CuN. The anti-perovskite Co3MoN has been investigated as comparisons with Co3Mo3N may give an insight into the role structure type plays in the ammonia synthesis activity. The XRD pattern and elemental analysis for the synthesised material revealed that an amorphous phase was present that contained nitrogen. In contrast to Co3CuN and Ni3CuN, the material was shown to have steady state activity at 400 °C with a rate of 92 ± 15 μmol h−1 g−1. Therefore, it appears that metal composition has an influence on the stability and activity of the anti-perovskite nitrides.
1. Introduction
Ammonia is mainly produced industrially via the Haber Bosch Process, which is credited for providing a route to synthetic fertilisers that are estimated to feed 40% of the global population.1 However, there are major drawbacks to this process due to the high energy costs associated with the entirety of the process, including hydrogen gas feed production.2 The hydrogen feed stream is presently produced from either natural gas or coal and results in production of 2.5% of global fossil fuel-based CO2 emissions.1 Therefore, finding an alternative process that is more sustainable and can operate under milder conditions is of great interest. Ideally, the alternative process would use renewable energy and the hydrogen would be produced from a renewable resource. This could then result in ammonia being produced on a small, localised scale. However, in order to achieve this, a more active catalyst than the iron-based catalyst used in the Haber Bosch Process would need to be developed. It has been suggested that the limiting scaling relationship for ammonia synthesis would need to be by-passed for this to occur. One possible solution is by the application of metal nitrides that can operate via a Mars–van Krevelen mechanism, where the lattice nitrogen is reactive and directly takes part in the synthesis of ammonia.3 The lattice nitrogen reactivity of a range of metal nitrides has thus been investigated in the literature.4–7 It has been reported that the lattice nitrogen in Co3Mo3N is highly reactive and the phase Co6Mo6N can be formed from the reduction of the nitride under 3![[thin space (1/6-em)]](https://www.rsc.org/images/entities/char_2009.gif) :1 H2/Ar.8 One route based on the reactivity of lattice nitrogen in metal nitrides is chemical looping, where ammonia is produced from the nitride and then the material is regenerated in a separate reaction step. A similar process has been observed for oxides in a range of reactions and has been established through isotopic labelling studies.9–11 Michalsky et al. have investigated a series of binary metal nitrides for this chemical looping process.12,13 Manganese nitride, Sr3N2 and Ca3N2 have been shown to be potential candidates for this process. More recently, the anti-perovskite nitrides Co3InN, Ni3InN, Co3ZnN and Ni3ZnN have been investigated for their lattice nitrogen reactivity and possible use as a material for synthesis of ammonia via chemical looping.14 A large percentage of the lattice nitrogen removed from the anti-perovskite nitrides was converted to ammonia when hydrogenated at 400 °C and 500 °C. It was observed that the nickel containing nitrides were more active than the corresponding cobalt containing nitrides and the nitrides containing Zn also showed better reactivity. It was suggested that the presence of intermediate phases with lower nitrogen content for Ni3InN and Ni3ZnN, that were not observed for the cobalt containing nitrides, could be one of the reasons for the higher ammonia synthesis activity. The difference in reactivity of the nitrides suggests that there may be a relationship between the metal composition and ammonia synthesis performance. In a similar process to chemical looping, nitrogen permeable membrane reactors operate by activating N2 at one side of the membrane reactor and then the nitrogen ions are transported to the other side where the ions react with H2 to form ammonia. Recently, Ye et al. have shown that a Nb4N5 nitride membrane reactor can yield a high ammonia concentration at ambient pressure.15
:1 H2/Ar.8 One route based on the reactivity of lattice nitrogen in metal nitrides is chemical looping, where ammonia is produced from the nitride and then the material is regenerated in a separate reaction step. A similar process has been observed for oxides in a range of reactions and has been established through isotopic labelling studies.9–11 Michalsky et al. have investigated a series of binary metal nitrides for this chemical looping process.12,13 Manganese nitride, Sr3N2 and Ca3N2 have been shown to be potential candidates for this process. More recently, the anti-perovskite nitrides Co3InN, Ni3InN, Co3ZnN and Ni3ZnN have been investigated for their lattice nitrogen reactivity and possible use as a material for synthesis of ammonia via chemical looping.14 A large percentage of the lattice nitrogen removed from the anti-perovskite nitrides was converted to ammonia when hydrogenated at 400 °C and 500 °C. It was observed that the nickel containing nitrides were more active than the corresponding cobalt containing nitrides and the nitrides containing Zn also showed better reactivity. It was suggested that the presence of intermediate phases with lower nitrogen content for Ni3InN and Ni3ZnN, that were not observed for the cobalt containing nitrides, could be one of the reasons for the higher ammonia synthesis activity. The difference in reactivity of the nitrides suggests that there may be a relationship between the metal composition and ammonia synthesis performance. In a similar process to chemical looping, nitrogen permeable membrane reactors operate by activating N2 at one side of the membrane reactor and then the nitrogen ions are transported to the other side where the ions react with H2 to form ammonia. Recently, Ye et al. have shown that a Nb4N5 nitride membrane reactor can yield a high ammonia concentration at ambient pressure.15
In this work, a further examination of the anti-perovskite nitrides has been performed due to the possibility of being able to alter the metal composition. From this, it may prove possible to investigate the potential relationship between metal composition and activity and tune the regeneration of the anti-perovskite nitrides. These are also well-defined structures that would be of value for the computationally aided design of more active materials. The anti-perovskite nitrides have the formula A3BN and therefore, the metal composition of both the A and B metals can be altered. It has been previously suggested that the lattice nitrogen in the anti-perovskite structure is surrounded by six A species and therefore, the lattice nitrogen reactivity may be influenced by the bonding to the A metal.14 The local environment for the lattice nitrogen in the η-carbide structured or β-Mn structured nitrides is similar with nitrogen coordinated to six metal species in each case.16 It has been previously reported that metal composition appears to have an influence on the lattice nitrogen reactivity of η-carbide structured or β-Mn structured nitrides.17 The possible influence the A metal has on activity has been investigated by comparing the ammonia synthesis activity of Co3CuN and Ni3CuN. Computational analysis has also been performed to provide an insight into the potential differences in reactivity. Co3MoN has also been investigated and compared with the η-carbide structured Co3Mo3N in order to investigate the possible relationship between structure type and activity.
2. Experimental
2.1 Preparation of Co3CuN and Ni3CuN
The oxide precursor was prepared by a modified form of the Pechini method as has been previously applied to synthesise other metal oxides.18 First, the required amounts of copper nitrate trihydrate (Cu(NO3)2·3H2O, Riedel-de Haen, Reag. ACS, 99–102%) and either cobalt nitrate hexahydrate (Co(NO3)2·6H2O, Sigma Aldrich, ACS reagent, ≥98%) or nickel nitrate hexahydrate (Ni(NO3)2·6H2O, Sigma Aldrich, puriss. p.a., ≥98.5% (KT)) were dissolved in a 200 mL solution of 10% nitric acid. This was followed by dissolving the necessary amount of citric acid monohydrate (C6H8O7·H2O, Sigma Aldrich, ACS reagent, ≥99.0%) in the solution. Then, the mixture was heated at 70 °C until a gel had formed. The gel was dried in an oven overnight at 120 °C and subsequently, calcined in air at 500 °C for 2 hours.
Co3CuN and Ni3CuN were synthesised via ammonolysis of their mixed oxide precursors under 95 mL min−1 of NH3 (BOC, 99.98%). For Co3CuN, the material was treated at a temperature of 450 °C and for Ni3CuN, the precursor was heated to 500 °C. The temperature was increased at a ramp rate of 10 °C min−1. The materials were kept at these temperatures for 5 h and then cooled down to room temperature under 95 mL min−1 of NH3. The reactor was flushed with N2 when at room temperature for 30 min and then passivated for 1 h using a mixture of 2% O2/Ar and N2.
2.2 Preparation of Co3MoN
The oxide precursor was prepared by the modified form of the Pechini method as described in Section 2.1 using cobalt nitrate hexahydrate (Co(NO3)2·6H2O, Sigma Aldrich, ACS reagent, ≥98%) and ammonium molybdate tetrahydrate ((NH4)6Mo7O24·4H2O, Fluka Analytical, ACS reagent, ≥99.0%) as the starting materials.
Co3MoN was synthesised via ammonolysis of the mixed oxide precursor at 420 °C for 5 hours under 95 mL min−1 of NH3 (BOC, 99.98%). The ramp rate used for increasing the temperature was 10 °C min−1. The sample was then cooled down to room temperature under 95 mL min−1 of NH3. Once at room temperature, the reactor was flushed with N2 for 30 min and passivated for 1 h using a mixture of 2% O2/Ar at 25 mL min−1 and additionally diluted with N2.
2.3 Ammonia synthesis testing
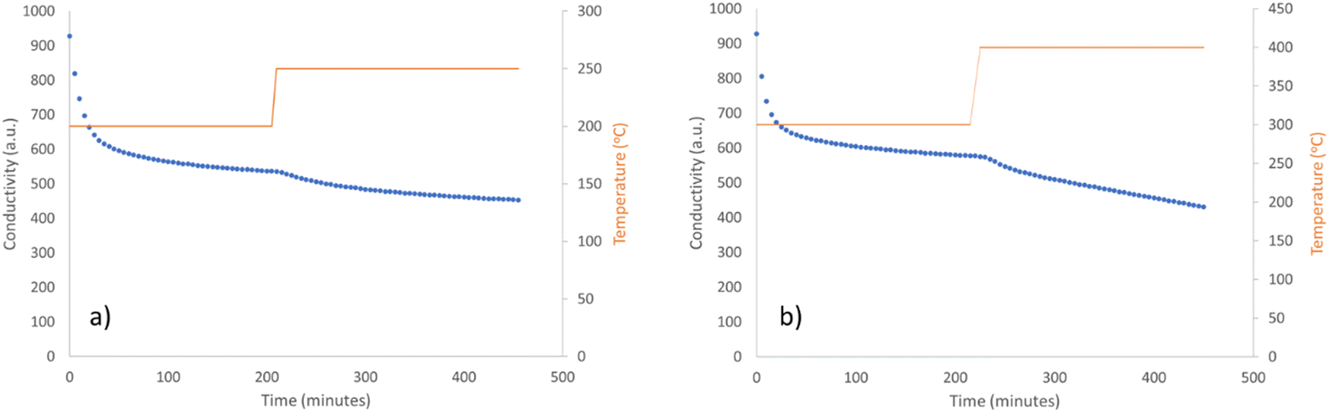
The nitrides were tested for their activity under 60 mL min−1 of 3:1 H2/N2 (BOC, 99.98%) at atmospheric pressure and temperatures of between 200–400 °C. The vent gas was flowed through a 0.00108 M solution of sulfuric acid (200 mL) and the decrease in conductivity was monitored in order to determine the activity.
2.4 Regenerability of Co3CuN and Ni3CuN
The post-reaction material was treated at either 700 °C or 800 °C under 60 mL min−1 of N2. The material was kept at the required temperature for 4 h. After this, the material was cooled down to room temperature under N2.
2.5 Material characterisation
Powder XRD was performed on the pre- and post-reaction samples by using a PANalytical X-Pert Pro Diffractometer (40 kV, 40 mA) with a monochromatised CuKα source (0.154 nm). The data was collected between 5–85° 2θ using a step size of 0.0167° and a total scan time of 51 min.
CHN analysis was obtained by combustion of the materials on an Exeter Analytical Inc. CE-440 elemental analyser.
SEM images were acquired by using a Philips XL30E-Scanning electron microscope. Energy-Dispersive X-ray spectroscopy (EDX) was also undertaken by using the microscope. The samples were coated with a film of gold/palladium before analysis.
2.6 Computational details
To rationalise the experimental observations, density functional theory (DFT) calculations were performed for the bulk Co3CuN and Ni3CuN structures, as well as for the corresponding low-index (111) and (100) surface facets which are typically the most stable for perovskite and anti-perovskite structures. Bulk DFT calculations were also performed for the Co3Cu and Ni3Cu alloy systems to determine the overall thermodynamic feasibility of complete loss of lattice N. All calculations were performed using plane wave DFT as implemented in the VASP code (version 5.4.4).19–22 The revised PBE (RPBE)23 exchange–correlation functional was used throughout, having already been demonstrated to be highly suitable for modelling metal nitride systems in the previous literature.24–26 Inner electrons were replaced by projector-augmented waves (PAW),27,28 and the valence states were expanded in plane-waves with a cut-off energy of 550 eV. Total energies were converged to within 10−5 eV. Forces were converged to within 0.01 eV Å−1 during all geometric relaxations. Bulk optimisation of the anti-perovskite and alloy phases was performed by fitting the lattice parameter and total energy to the Birch–Murnaghan equation of state. The Monkhorst–Pack k-point sampling scheme was used throughout,29 with meshes of appropriate size for the different systems considered; for the bulk anti-perovskites and bulk alloys, a 8 × 8 × 8 k-point sampling mesh was used, whereas for the (111) and (100) surfaces, a 6 × 6 × 1 k-point sampling mesh was used, commensurate with the dimensions of the 1 × 1 surface cell model employed. For the surfaces, stoichiometric asymmetric slab models were employed with identical compositions for the two slabs, consisting of 12 atomistic layers for the (111) surface and 6 atomistic layers for the (100) surface, interleaved by a 20 Å vacuum gap to avoid any spurious interactions between slabs in adjacent periodic images. Optimisation of the slab models was performed by allowing the top (i.e. N-terminated) 6 atomistic layers for the (111) slab, and top 3 atomistic layers for the (100) slab, to relax until the force convergence threshold was met. A dipole correction was applied to eliminate any spurious electrostatic interactions across the slab owing to the asymmetric stoichiometric model used and the asymmetric relaxation of the slabs. To identify transition states for the diffusion of subsurface N to the surface vacancy site in the (111) facet, the climbing image nudged elastic band30 and dimer techniques31 were applied; transition states were confirmed by means of vibrational analysis to identify the unstable mode.
3. Results and discussion
3.1 Co3CuN
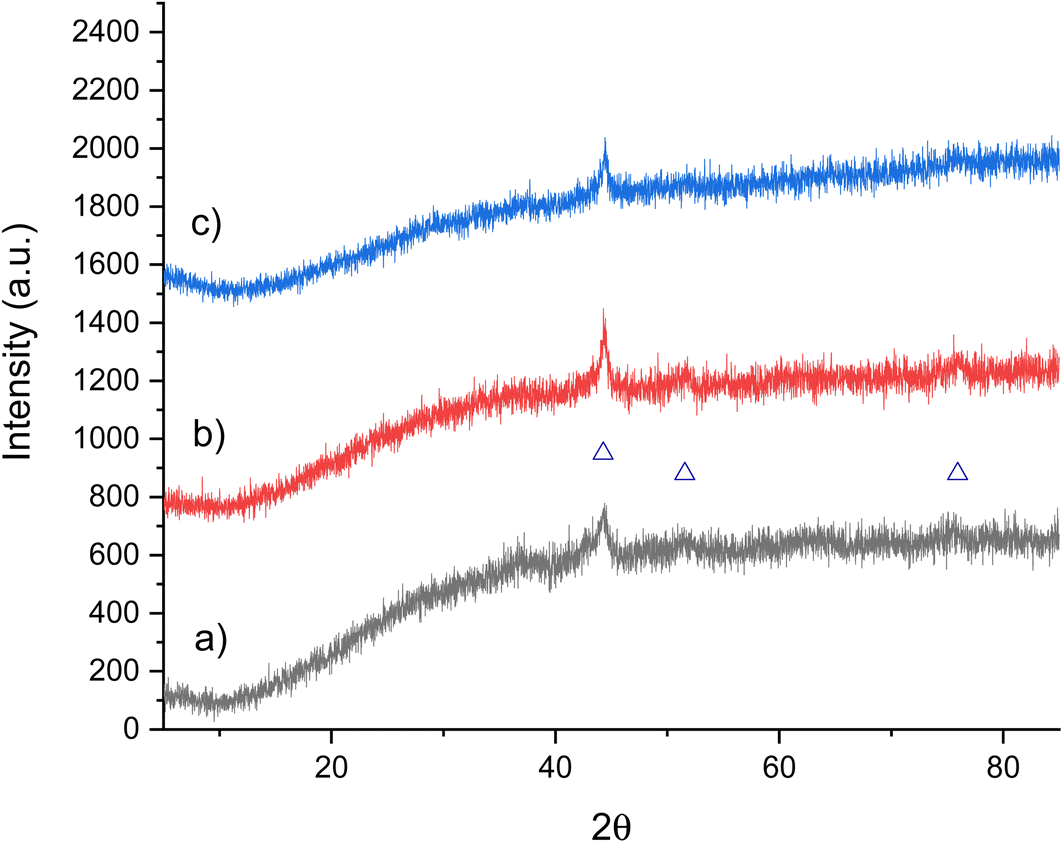
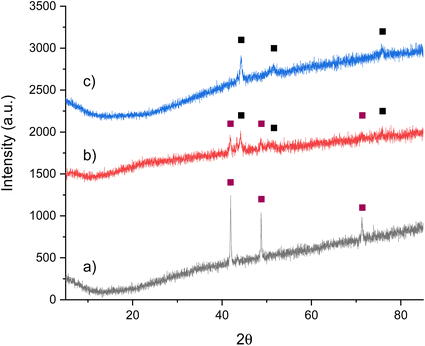
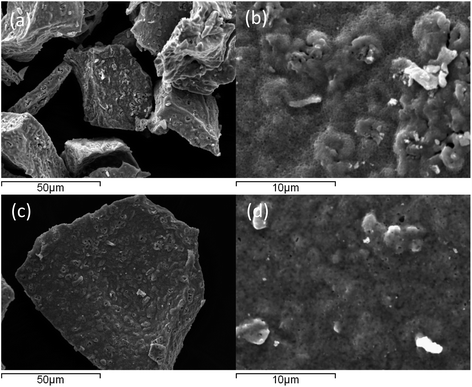
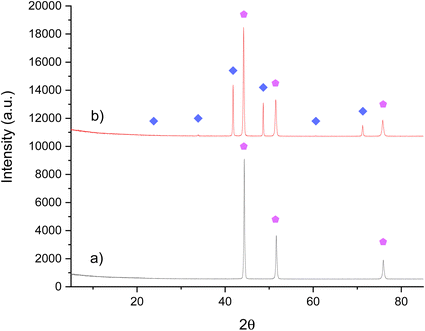
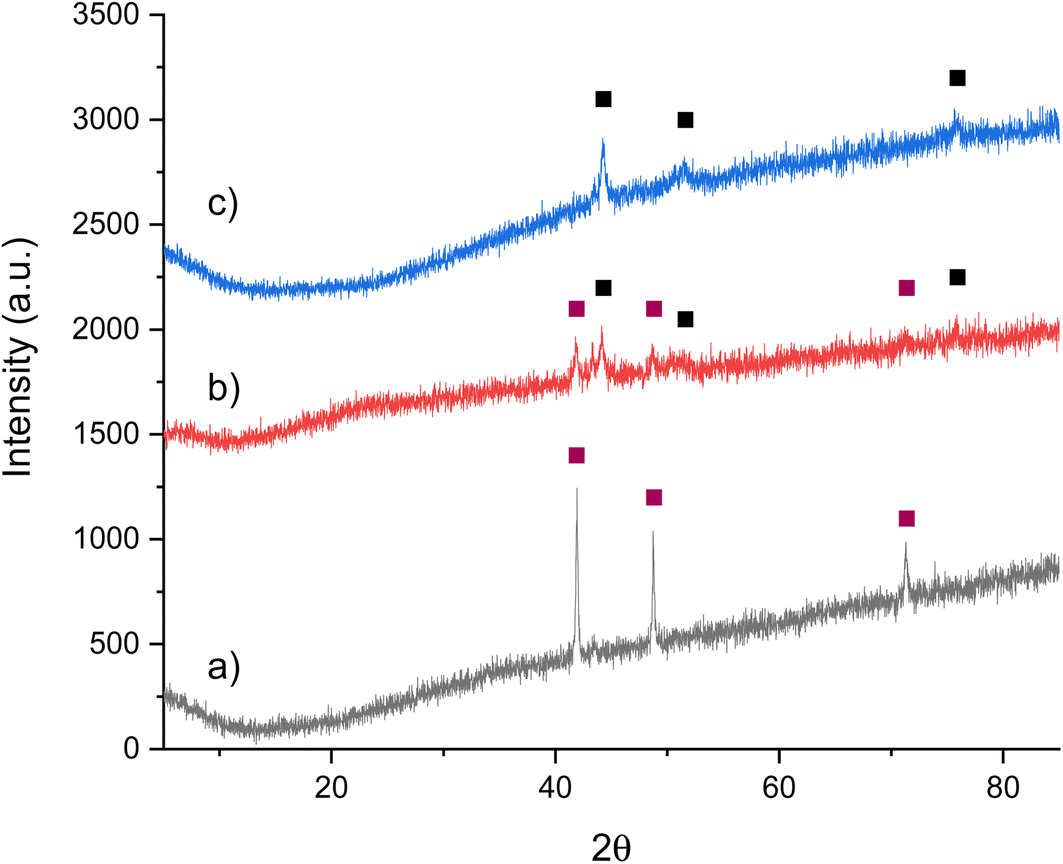
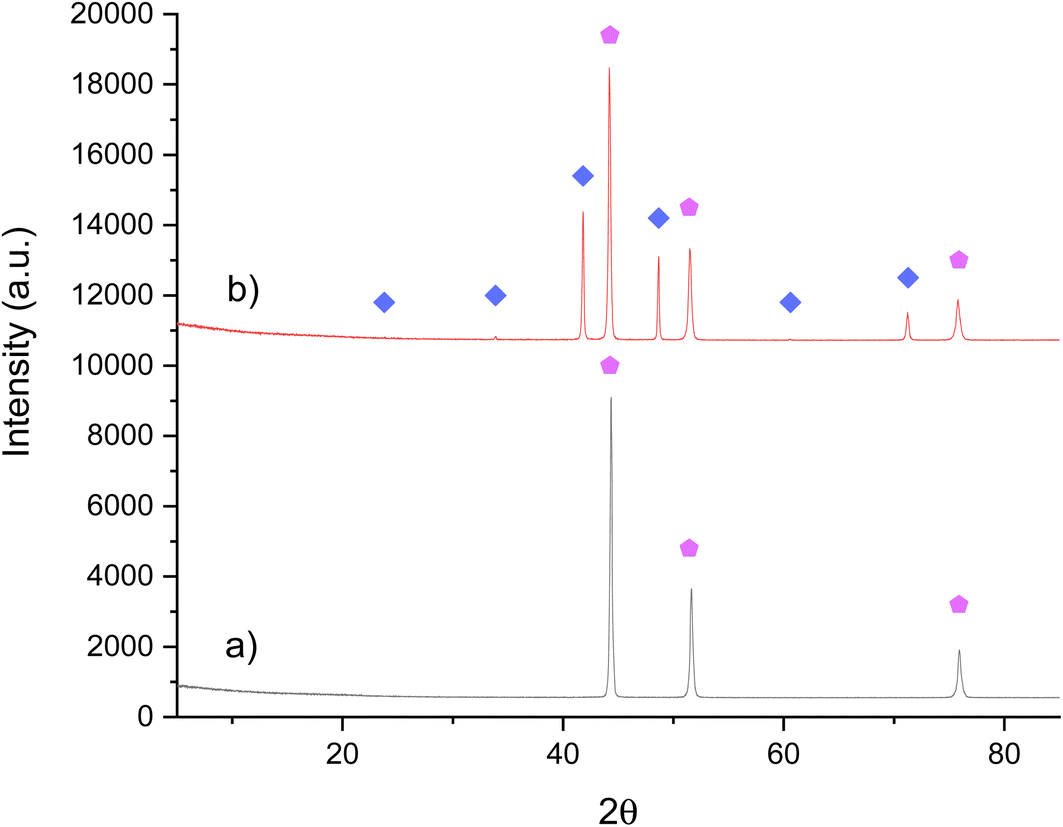
The XRD pattern for the prepared Co3CuN material is provided in Fig. 1a, which indicates that a pure phase material has been synthesised. The oxide precursor was prepared via a modified Pechini method and the nitride was then formed by ammonolysis of the oxide. Co3CuN has been previously prepared in the literature by a hydrothermal method.32 Therefore, this method for preparing Co3CuN has the advantage of not requiring the use of an autoclave. The elemental analysis for the synthesised material is provided in Table 1. The nitrogen content was slightly lower than the expected stoichiometric nitrogen value for Co3CuN which is 5.51 wt%. SEM analysis was also performed on the material and representative SEM images are displayed in Fig. 2a and b. The material was shown to consist of rounded particles and EDX values show that the Co:Cu ratio was 66:30 (expected ratio is 69.5:25.0 for Co3CuN). The difference in composition is of interest as these metals are not volatile. However, due to the limitations of the technique, EDX is semi-quantitative and thus, there may be some differences compared to the expected value. Attempts have been made to prepare Co3CuN via nitridation of the oxide precursor with N2/H2 as this would be of greater relevance for large scale production than ammonolysis. The oxide precursor was treated with N2/H2 at a temperature of 500 °C or 700 °C. However, a mixture of phases was formed containing Co3Cu alloy and phase separation occurred as shown in Fig. 1 in the ESI section.†
 |
| | Fig. 1 XRD patterns of Co3CuN: (a) pre-reaction, (b) post-reaction with 3:1 H2/N2 at 200 °C and 250 °C and (c) post-reaction with 3:1 H2/N2 at 300 °C and 400 °C. ( ) Co3CuN and (■) Co3Cu. ) Co3CuN and (■) Co3Cu. | |
Table 1 Nitrogen analysis pre- and post-reaction for Co3CuN
| Material |
Nitrogen content (wt%) |
| Co3CuN |
4.73 |
| Co3CuN post N2/H2 200 °C and 250 °C |
1.39 |
| Co3CuN post N2/H2 300 °C and 400 °C |
0.05 |
 |
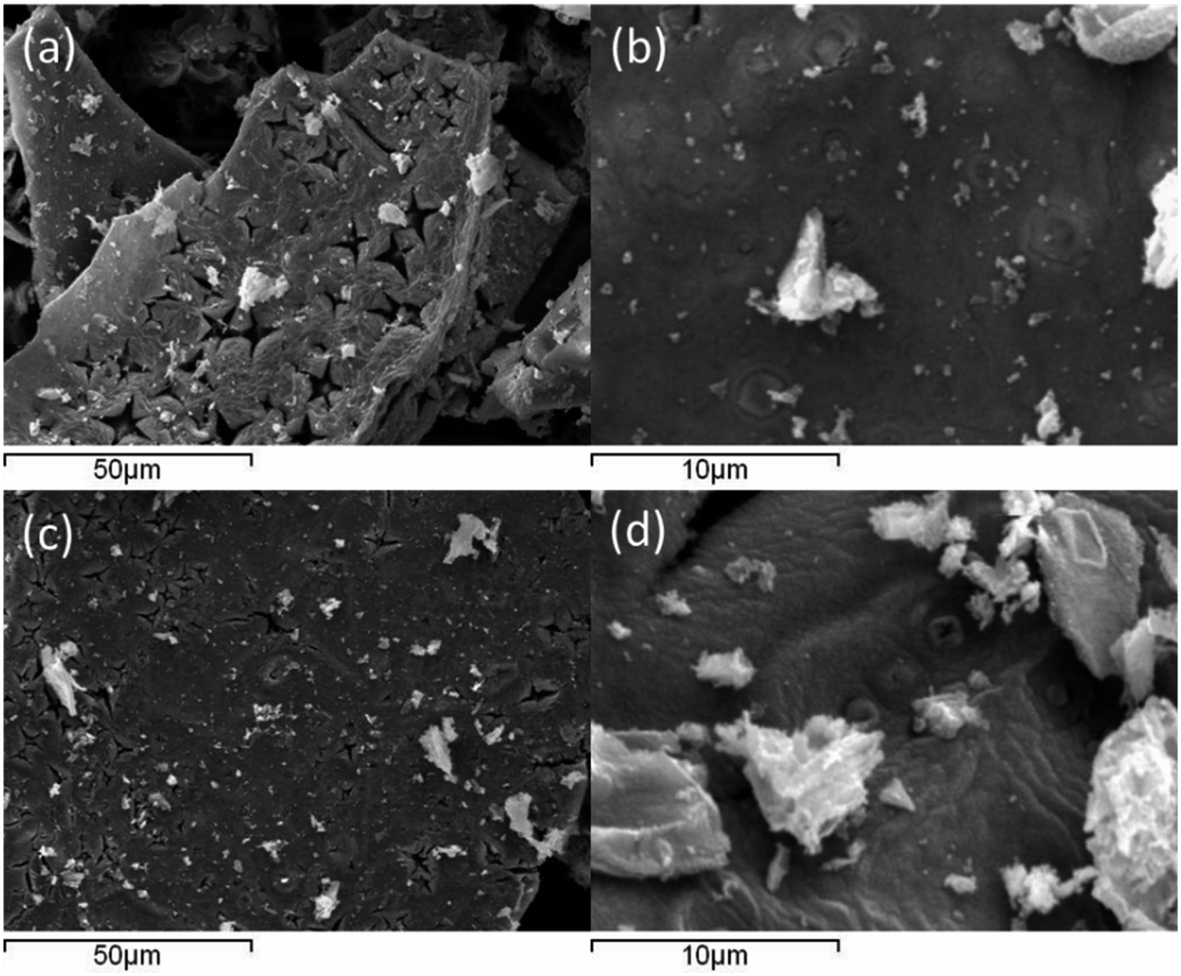
| | Fig. 2 Representative SEM images of Co3CuN: (a and b) pre-reaction and (c and d) post N2/H2 reaction at 300 °C and 400 °C. | |
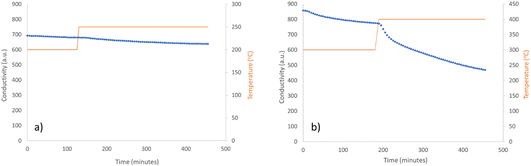
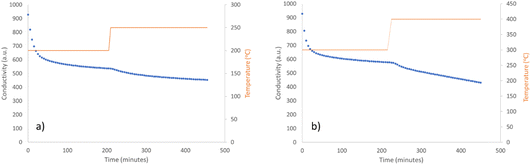
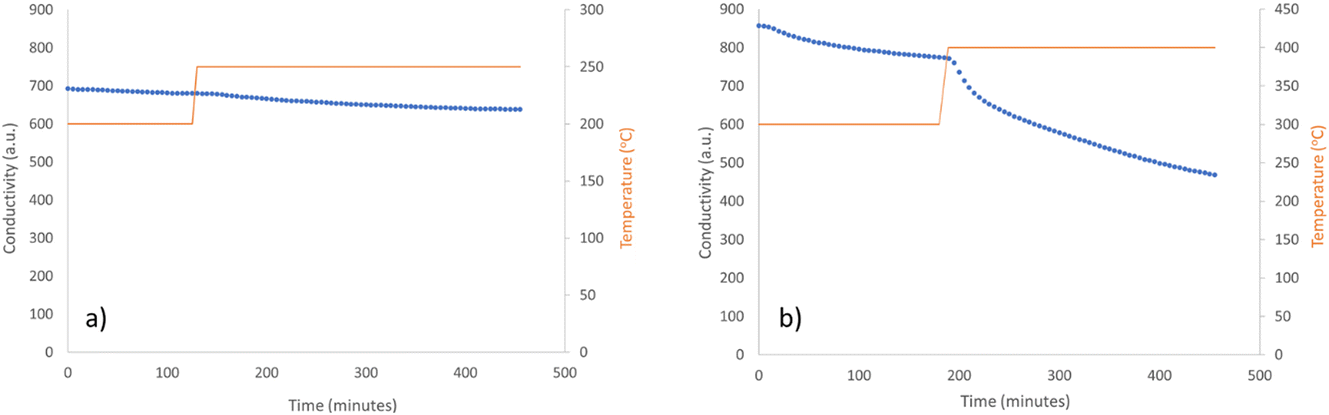
The ammonia synthesis activity of Co3CuN was investigated by firstly reacting the nitride under 3:1 H2/N2 at 200 °C and 250 °C. The conductivity profile shows that the production of ammonia was minimal at 200 °C (Fig. 3a). However, when the temperature was increased to 250 °C, the material appeared to become active, although the rate was observed to be non-steady state. From the post-reaction XRD pattern provided in Fig. 1b, it can be observed that reflections due to Co3Cu are present that were not observed pre-reaction. It is therefore suggested that the production of ammonia may be due to the loss of lattice nitrogen from Co3CuN and is not a catalytic process. This is supported by the post-reaction nitrogen analysis that shows there was a reduction in nitrogen content compared to pre-reaction (Table 1). The percentage of lattice nitrogen removed from the material that was converted to ammonia was 70%. The ammonia synthesis activities of nitrides at lower temperatures have not been widely reported in the literature. However, the activities of a range of Ru/γ-Al2O3 prepared with different Ru metal loadings has been examined at 100 °C and 150 °C under N2/H2 (1/3 vol%) at either 4 bar or 5 bar.33,34 It was stated that a metal loading of 7% Ru provided the highest activity with a rate of 1.42 μmol gcat−1 s−1 at 150 °C and 5 bar.35 Furthermore, oxyhydrides and hydrides of LaH2.5O0.25, CeH1.5O0.75, CeH3 and LaH3 doped with Ru have been shown to have a high activity at 260 °C and 0.1 MPa, with 5% Ru/CeH1.5O0.75 having a rate of approximately 1750 μmol g−1 h−1.36 It was observed that LaH3 partially underwent nitridation during the reaction to form LaN resulting in lower stability and a decrease in activity. This result illustrates the negative effect of nitridation of the hydrides. All of these materials appeared to perform by a catalytic process, unlike Co3CuN that was observed to act as a reagent.
 |
| | Fig. 3 Ammonia production reaction profiles of Co3CuN reacted with 60 mL min−1 of 3:1 H2/N2 (a) for 3 hours at 200 °C and 4 hours 25 minutes at 250 °C and (b) for 4 hours at 300 °C and 3 hours 15 minutes at 400 °C. | |
Co3CuN was further examined for its ammonia synthesis activity by reacting the material under 3:1 H2/N2 at 300 °C and 400 °C. There was a large decrease in conductivity at the start of the reaction as observed in Fig. 3b. After this initial period, the production of ammonia was minimal and remained unchanged upon increasing the temperature to 400 °C. It appears that Co3CuN has fully transformed to Co3Cu during the reaction as shown in the post-reaction XRD pattern in Fig. 1c. The nitrogen analysis in Table 1 also confirms that almost all of the nitrogen has been removed from the material during the reaction. Therefore, it is proposed that the initial large decrease in conductivity is due to the loss of lattice nitrogen from Co3CuN and the production of ammonia significantly decreases once the alloy has been formed. The percentage of lattice nitrogen converted to NH3 was calculated to be 82%. This transformation of Co3CuN to Co3Cu upon loss of lattice nitrogen is in contrast to the previous observations for Co3InN and Co3ZnN,14 where Co3InN and Co3ZnN were observed to decompose to their segregated metal constituents. From Fig. 1, it appears that the reflections due to Co3Cu are broader compared to those for Co3CuN. The broadening of peaks could arise from effects such as a change in morphology, lattice distortion, coherent diffraction domain size or defect generation. Representative SEM images of the material post 300 °C and 400 °C reaction are presented in Fig. 2c and d. Although nitrogen was removed from the material during the reaction, the gross morphology was retained compared to pre-reaction. It has been previously reported that upon loss of nitrogen some metals derived from nitride precursors possess a porous nature.4 However, this was not observed to be the case for these materials as evidenced by comparison of the pre- and post-reaction SEM images (Fig. 2). The ratio of Co:Cu in the post-reaction material was 74:26 as determined from EDX, which is similar to the expected ratio of Co:Cu in Co3Cu.
The lattice nitrogen reactivity of the nitride appears to be more active than that reported for Li–Mn–N, which converted 16.2% of the lattice nitrogen to ammonia at 300 °C and 15.8% at 400 °C when reacted under 3:1 H2/N2.6 Furthermore, Co3ZnN has been stated to convert approximately 93% of the lost lattice nitrogen to ammonia at 400 °C under 3:1 H2/Ar, whereas the lattice nitrogen in Co3InN was much less reactive under the same conditions.14 Therefore, the lattice nitrogen reactivity of Co3CuN is comparable to Co3ZnN and also has the benefit of forming Co3Cu upon loss of lattice nitrogen. This is beneficial as it may potentially facilitate the regeneration of the nitride from the alloy phase. Some of the most active nitrides reported are nanoparticles of Ni/LaN, which have a high rate of 2665 mmol g−1 h−1 at 340 °C and 0.1 MPa.37 Furthermore, Ru/CaH2 and ternary hydrides containing Ru are highly active at 300 °C with Ba2RuH6/MgO stated to have a rate of 9.5 mmol gcat−1 h−1.38,39 Ternary molybdenum nitrides are reported to have steady state activity under 3:1 H2/N2 at 400 °C and 1 atm.18,40 When Co3Mo3N is reacted under 3:1 H2/Ar at 700 °C, the nitride loses half of its lattice nitrogen. However, only 19% of the removed nitrogen is converted to ammonia, which the authors suggest is due to the high temperature required favouring the formation of N2.41 The lattice nitrogen reactivity of nitrides has been of interest in the literature as it may provide information on the possibility of the Mars–van Krevelen mechanism occurring for these materials. The production of ammonia from the hydrogenation of binary nitrides Ni3N, Cu3N, Zn3N2, Ta3N5, Re3N and Co3N under 3:1 H2/Ar was reported to be limited with the maximum conversion being 30% of the nitrogen content for Re3N and Ni3N.4,42 The addition of metal dopants to tantalum nitride has been shown to enhance the conversion to ammonia, with 52% of the lattice nitrogen converted when Co was used as the metal dopant.43,44 Therefore, it appears that the lattice nitrogen of the anti-perovskite nitrides is more readily converted to ammonia than other forms of nitrides. However, there are other factors which may need to be taken into consideration.
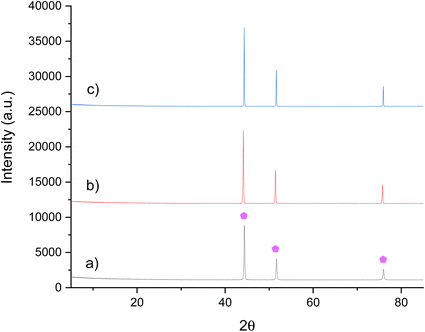
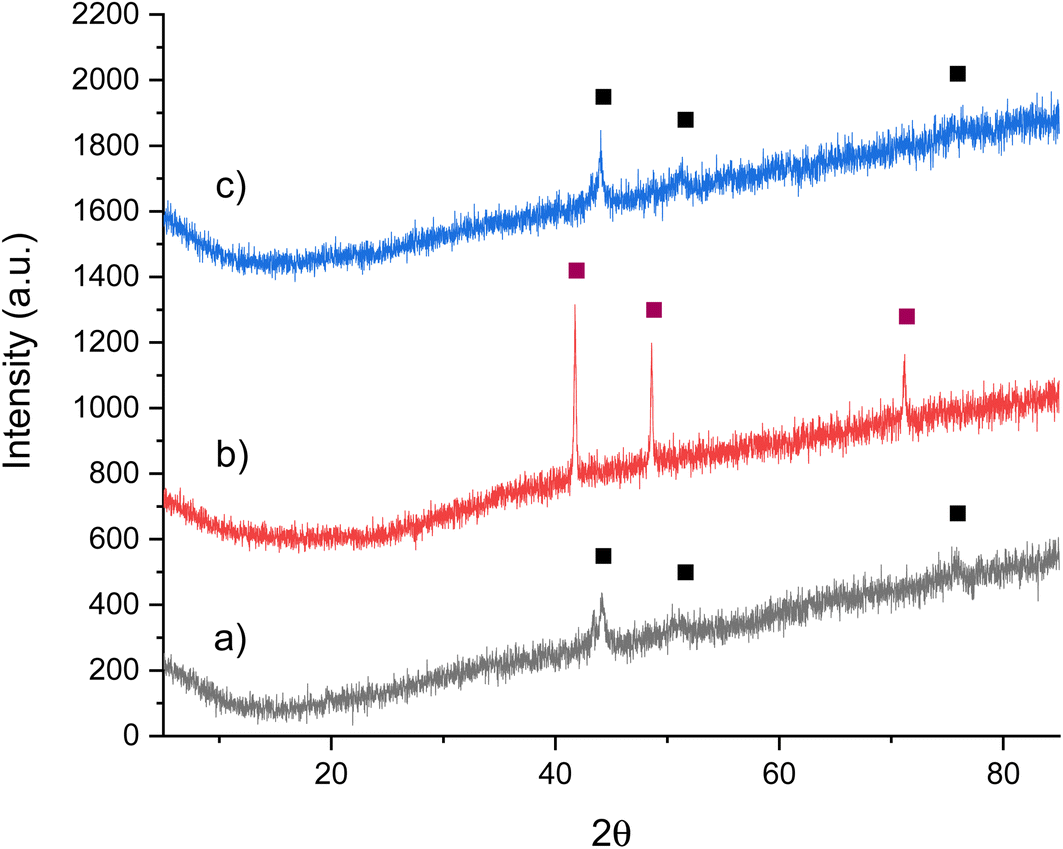
Due to the topotactic loss of lattice nitrogen from Co3CuN to form Co3Cu, it is suggested that it may be possible to regenerate the nitride from the alloy by either ammonolysis or nitridation. The nitride could therefore operate as a reagent for the nitrogen chemical looping process. The lattice nitrogen could be removed from the material in an initial step by reacting the nitride with hydrogen. Then, if possible, the material could be regenerated in a separate step to complete the cycle. The regenerability of Co3CuN from Co3Cu was first examined by ammonolysis of the post-reaction material under NH3 at 450 °C. The conditions were similar to those used to synthesise the material from the oxide precursor. Co3CuN appears to have been fully transformed from the alloy under these conditions as observed in the XRD pattern shown in Fig. 4b. The nitrogen analysis shows that the material had a higher nitrogen content compared to the originally synthesised nitride as shown in Table 2. However, although the nitride is successfully regenerated, the regeneration of the nitride by using ammonolysis is on balance consuming more NH3 than is made and, therefore, is an inefficient process. The material was then tested for a 2nd cycle under 3:1 H2/N2 at 300 °C and the results are presented in Fig. 5. The conductivity profile followed a similar trend compared to the 1st reaction cycle. However, it appears that the production of ammonia was higher (2529 μmol g−1versus 3040 μmol g−1) during the second cycle. It is suggested that this may be due to the material having a higher nitrogen content. The post-reaction XRD pattern in Fig. 4c illustrates that the material has again transformed into Co3Cu as would be expected. As was observed previously, almost all of the lattice nitrogen has been removed from the material during the 2nd cycle. The amount of lattice nitrogen transformed to ammonia was 82%, which was a similar value to the first cycle. These results suggest that Co3CuN has the potential to operate in a nitrogen looping process.
 |
| | Fig. 4 XRD patterns of Co3CuN: (a) post 1st cycle with 3:1 H2/N2 at 300 °C, (b) pre 2nd cycle and (c) post 2nd cycle with 3:1 H2/N2 at 300 °C. ( ) Co3CuN and (■) Co3Cu. ) Co3CuN and (■) Co3Cu. | |
Table 2 Nitrogen analysis pre- and post 1st and 2nd reaction cycles for Co3CuN
| Material |
Nitrogen content (wt%) |
| Co3CuN 1st cycle |
4.54 |
| Co3CuN post 1st cycle |
0.05 |
| Co3CuN 2nd cycle |
5.41 |
| Co3CuN post 2nd cycle |
0.11 |
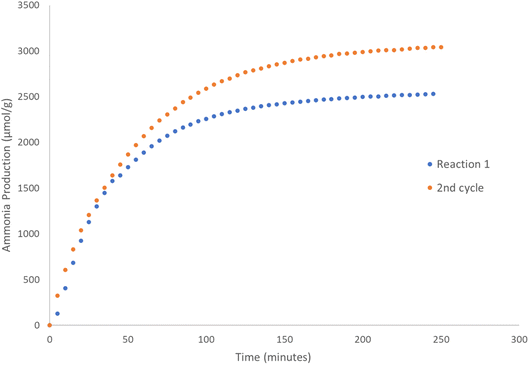 |
| | Fig. 5 Ammonia production reaction profiles of the 1st and 2nd cycles for Co3CuN reacted with 60 mL min−1 of 3:1 H2/N2 at 300 °C for 4 hours. | |
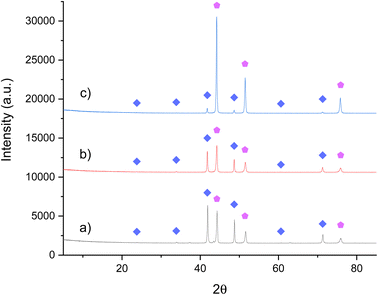
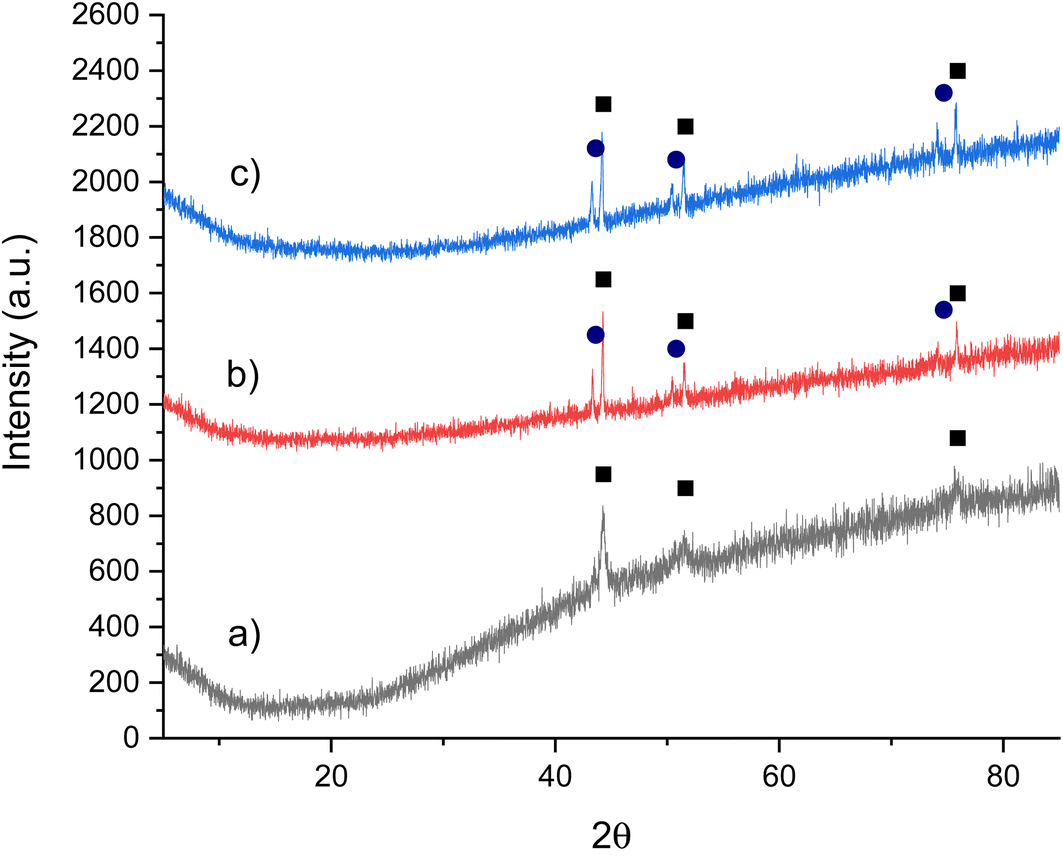
Ideally, the regeneration of Co3CuN would be achieved by using N2 rather than NH3. Furthermore, for the chemical looping process, it is proposed that nitrogen should be used to form the metal nitride for the renitridation step. It has been previously shown that renitridation of Co6Mo6N to form Co3Mo3N can be accomplished by using N2 at 700 °C.45 Therefore, the regenerability of Co3CuN from Co3Cu was investigated by nitridation of the post-reaction material under N2 at 700 °C or 800 °C. The XRD patterns in Fig. 6b and c show that the alloy has not renitrided and it appears that phase separation has occurred with the appearance of reflections due to copper. This is further confirmed by the nitrogen analysis as shown in Table 3. The addition of dopants to β-Mo2N0.78 has been shown to have an influence on the loss of lattice nitrogen from the nitride and a change in the synthesis pathways.46 Hence, doping of the Co3CuN system may provide a route to facilitating the nitridation of the alloy with N2. In view of this, there have been reports in the literature of manganese nitride having been doped with lithium.6,7 Li+ doping facilitated the loss of lattice nitrogen compared to the undoped sample. However, elemental analysis showed a decrease in the lattice nitrogen content after the renitridation step under N2 at 800 °C and the regenerated material had limited ammonia synthesis activity. Therefore, it appears that the regeneration of nitrides using nitrogen is a challenging process.
 |
| | Fig. 6 XRD patterns of Co3Cu: (a) pre N2 treatment, (b) post N2 treatment at 700 °C and (c) post N2 treatment at 800 °C. (■) Co3Cu and ( ) Cu. ) Cu. | |
Table 3 Nitrogen analysis pre- and post N2 treatment for Co3Cu
| Material |
Nitrogen content (wt%) |
| Co3Cu pre N2 |
0.05 |
| Co3Cu post N2 700 °C |
0.00 |
| Co3Cu post N2 800 °C |
0.06 |
3.2 Ni3CuN
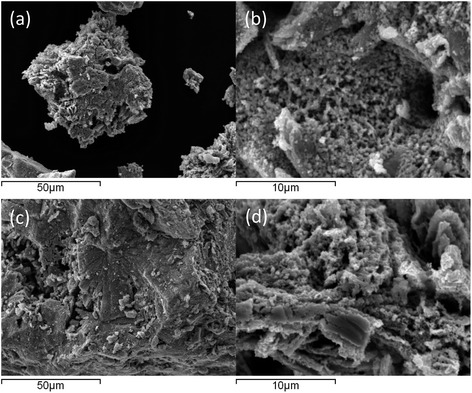
In order to compare the effect of the A metal in the anti-perovskite nitrides (A3BN) on ammonia synthesis activity, attempts have been made to synthesis Ni3CuN. It is suggested that the A metal may have a direct influence on the lattice nitrogen reactivity and regenerability of the material due to the nitrogen being surrounded by six A species. From the XRD pattern provided in Fig. 7a, it can be seen that a mixture of phases has been formed that correspond to Ni3CuN and Ni3Cu. A minor impurity at approximately 43.3° 2θ is also observed in the pre-reaction XRD pattern. This is possibly due to copper and therefore, some phase separation has occurred. The prepared material contained 3.41 wt% nitrogen as shown in Table 4 (the expected stoichiometric nitrogen content is 5.52% for Ni3CuN). Representative SEM images in Fig. 8a and b show that Ni3CuN has a porous surface. Furthermore, it can be seen that the morphology of Ni3CuN is slightly different compared to Co3CuN. The ratio of Ni:Cu from EDX was shown to be 72:24 (expected ratio is 69:25 for Ni3CuN). As with Co3CuN, attempts were made to prepare the nitride by nitriding the oxide precursor with N2/H2. However, Ni3Cu alloy was formed instead as observed in Fig. 2 in the ESI section.†
 |
| | Fig. 7 XRD patterns of Ni3CuN: (a) pre-reaction, (b) post-reaction with 3:1 H2/N2 at 250 °C and (c) post-reaction with 3:1 H2/N2 at 300 °C and 400 °C. ( ) Ni3CuN and ( ) Ni3CuN and ( ) Ni3Cu. ) Ni3Cu. | |
Table 4 Nitrogen analysis pre- and post-reaction for Ni3CuN
| Material |
Nitrogen content (wt%) |
| Ni3CuN |
3.41 |
| Ni3CuN post N2/H2 200 °C and 250 °C |
3.09 |
| Ni3CuN post N2/H2 300 °C and 400 °C |
0.49 |
 |
| | Fig. 8 Representative SEM images of Ni3CuN: (a and b) pre-reaction and (c and d) post N2/H2 reaction at 300 °C and 400 °C. | |
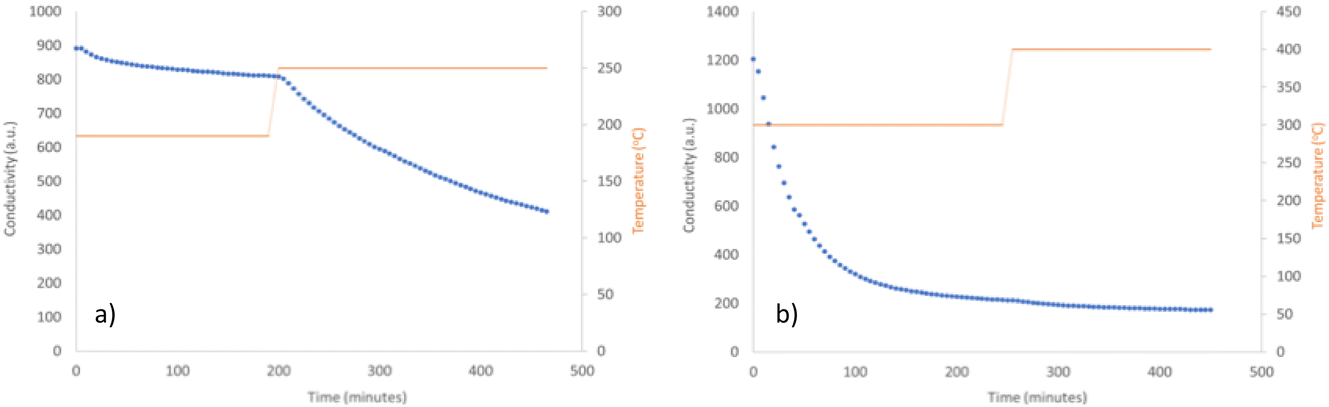
As before, the ammonia production activity was investigated by initially reacting the mixed Ni3CuN and Ni3Cu material under 3:1 H2/N2 at 200 °C and 250 °C. The conductivity profile provided in Fig. 9a indicates that a minimal amount of ammonia was synthesised at these temperatures. This is in contrast to Co3CuN, where an onset of ammonia production was observed at 250 °C. The elemental analysis shows that there was a minimal amount of lattice nitrogen lost during the reaction (Table 4). The XRD pattern in Fig. 7b shows that the ratio of Ni3CuN:Ni3Cu was slightly reduced compared to pre-reaction. This is also in contrast to the results observed for Co3CuN, which show that the nitrogen content significantly decreased under these conditions.
 |
| | Fig. 9 Ammonia production reaction profiles of Ni3CuN reacted with 60 mL min−1 of 3:1 H2/N2 (a) for 2 hours 5 minutes at 200 °C and 5 hours 25 minutes at 250 °C and (b) for 3 hours at 300 °C and 4 hours 25 minutes at 400 °C. | |
The mixed Ni3CuN and Ni3Cu material was then studied for its ammonia synthesis activity by reacting the sample under 3:1 H2/N2 at 300 °C and 400 °C. The production of ammonia was minimal at 300 °C and the activity was non-steady state as shown in Fig. 9b. This contrasts with Co3CuN at the same temperature, where a large production of ammonia was observed at the start of the reaction. Therefore, it appears that Ni3CuN is more stable than Co3CuN at lower temperatures. It was observed from elemental analysis that there was only a 21% decrease in nitrogen content of Ni3CuN at 300 °C. When the temperature was increased to 400 °C, it can be seen in Fig. 9b that there was an increase in the ammonia synthesis activity. However, the profile of ammonia production is different than for Co3CuN, which produced the majority of the ammonia in the first 100 minutes at 300 °C. For Ni3CuN, the production of ammonia was much slower and this suggests that the lattice nitrogen in Ni3CuN is more stable than for Co3CuN. The post-reaction XRD pattern in Fig. 7c suggests that the majority of Ni3CuN has been transformed to Ni3Cu. A similar effect was observed for Ni3ZnN and Ni3InN, which formed Ni3Zn and Ni3In upon reaction.14 However, the two line phases of Ni3CuN and Ni3Cu with no intermediate phase being noted upon loss of lattice nitrogen is contrary to the observation for Ni3ZnN and Ni3InN.14
The elemental analysis also indicates that the majority of the lattice nitrogen has been removed from this material during the reaction. Therefore, this indicates that the production of ammonia from Ni3CuN is due to the loss of lattice nitrogen from the material and is not a catalytic process. The amount of lattice nitrogen lost from the material that was converted to ammonia was 62%. This is lower than for Co3CuN and confirms the difference in activity between the two anti-perovskite nitrides. The difference in activity and stability between Co3CuN and Ni3CuN suggests that the metal composition may have an influence and this could play an important role in the design of active materials for ammonia synthesis. The conversion of lattice nitrogen to ammonia could possibly be improved by doping the nitride. Lithium doping of manganese nitride resulted in an increase in the percentage of lattice nitrogen converted to NH3 compared to the undoped sample.6,7
Ni3ZnN and Ni3InN have been reported to be 2.8–3.6 times more active for ammonia synthesis than the corresponding Co containing nitrides under 3:1 H2/Ar.14 Therefore, this is in contrast to the results for Co3CuN and Ni3CuN. The post 300 °C and 400 °C reaction SEM images are provided in Fig. 8c and d. It was observed that the morphology was similar between pre- and post-reaction and therefore, was unaffected by the loss of lattice nitrogen. EDX of the post-reaction sample showed that the ratio of Ni:Cu was 70:30, with the expected ratio in Ni3Cu as 73.5:26.5. This ratio may be slightly lower due to the minor presence of Ni3CuN within the sample.
As there was a topotactic loss of lattice nitrogen from Ni3CuN, attempts were made to regenerate the nitride from Ni3Cu by ammonolysis or nitridation. Initially, the regenerability of Ni3CuN from Ni3Cu was attempted by ammonolysis of the post-reaction Ni3Cu with NH3 at 500 °C. From the XRD pattern provided in Fig. 10b, it can be observed that there was partial transformation of the alloy to form the nitride. However, the ratio of Ni3CuN to Ni3Cu was lower compared to the amount of nitride formed from ammonolysis of the oxide. As expected, the material had a lower nitrogen content compared to the originally synthesised nitride as shown in Table 5. For Co3CuN, Co3Cu appeared to be completely transformed to the nitride under similar synthesis conditions. Therefore, it appears that the regenerability of Ni3CuN by ammonolysis is more challenging compared to Co3CuN.
 |
| | Fig. 10 XRD patterns of Ni3Cu: (a) pre-ammonolysis and (b) post-ammonolysis with NH3 at 500 °C. ( ) Ni3CuN and ( ) Ni3CuN and ( ) Ni3Cu. ) Ni3Cu. | |
Table 5 Nitrogen analysis pre- and post-ammonolysis for Ni3Cu
| Material |
Nitrogen content (wt%) |
| Ni3Cu pre ammonolysis |
0.00 |
| Ni3Cu(N) post ammonolysis |
2.02 |
The regenerability of Ni3CuN from Ni3Cu was also examined by treating the post-reaction material under N2 at either 700 °C or 800 °C. The XRD patterns in Fig. 11b and c illustrate that nitridation does not appear to have occurred at either temperature. However, there does not appear to have been any phase separation, which was observed for Co3Cu post nitridation. This suggests that the Ni3Cu phase is more stable than Co3Cu. This is possibly somewhat to be expected as Co3CuN has been shown to lose lattice nitrogen at a lower temperature than Ni3CuN. The nitrogen analysis in Table 6 confirms that nitridation did not occur under these conditions. These results suggest that unfortunately the regeneration of the anti-perovskite nitrides in this study are not achievable by nitridation. It appears that ammonia synthesis by Co3CuN and Ni3CuN proceeds via loss of lattice nitrogen from the nitrides and therefore, it could be suggested that the main restricting factor appears to be the regeneration of the nitrides from their alloys. This has been previously suggested for the denitridation–nitridation processes for Li–Mn–N.6
 |
| | Fig. 11 XRD patterns of Ni3Cu: (a) pre N2 treatment, (b) post N2 treatment at 700 °C and (c) post N2 treatment at 800 °C. ( ) Ni3Cu. ) Ni3Cu. | |
Table 6 Nitrogen analysis pre- and post N2 treatment for Ni3Cu
| Material |
Nitrogen content (wt%) |
| Ni3Cu pre N2 |
0.49 |
| Ni3Cu post N2 700 °C |
0.00 |
| Ni3Cu post N2 800 °C |
0.04 |
It is possible that partial denitridation of the anti-perovskite nitrides would facilitate the renitridation process and therefore, would result in a better chemical looping performance. This is a potential avenue that could be explored in the future.
3.3 DFT: bulk conversion of the anti-perovskite phase to the alloy phase
To rationalise the experimental results, calculations were performed to investigate the thermodynamics of complete conversion of the anti-perovskite nitride to the alloy phase under either ambient or hydrogenation conditions, releasing either N2 or NH3 to the gas phase, respectively. The calculations reveal that for both the Co3CuN and Ni3CuN phases, the process is exothermic for either the N2 or NH3 evolution process, with the latter being more exothermic as expected (Table 7). For Co3CuN, the energies are slightly less exothermic (by ∼0.1 eV). The decomposition of Co3CuN to yield 0.5N2 and the Co3Cu alloy phase is barely exothermic and almost thermoneutral, hence the reverse process is barely endothermic and almost thermoneutral. For Ni3CuN, the reverse process to regenerate the anti-perovskite from the alloy under N2 conditions is somewhat more endothermic. Hence, the overall thermodynamics of anti-perovskite decomposition and regeneration suggest both Co3CuN and Ni3CuN are promising N-looping candidate materials. Although the computational results suggest that the nitrides could be regenerated under nitrogen, to date, this has not been achieved experimentally and therefore, it is a possible avenue to be explored further. It must also be considered that, compared to regeneration of the anti-perovskite nitride via ammonolysis, re-nitridation would be expected to be entropically unfavourable due to consumption of gaseous N2 (versus release of gaseous H2 under ammonolysis). Hence, for the Co3CuN system, it appears likely that this entropic contribution to the energetics of the re-nitridation process is sufficient under ammonolysis conditions to overcome the calculated endothermic energy, but not for the Ni3CuN system, for which a more endothermic energy was calculated for regeneration of the nitride under ammonolysis.
Table 7 DFT optimised lattice parameters for the Co3CuN and Ni3CuN bulk structures and their corresponding alloys, with overall decomposition energies with respect to both evolution of N2 and hydrogenation of lattice N to NH3
| Anti-perovskite |
DFT optimised lattice parameter/Å |
Corresponding alloy lattice parameter/Å |
Decomposition energy (w.r.t. N2)/eV |
Decomposition energy (w.r.t. H2/NH3)/eV |
| Co3CuN |
3.772 |
3.599 |
−0.044 |
−0.964 |
| Ni3CuN |
3.782 |
3.591 |
−0.145 |
−1.066 |
3.4 DFT: cleavage energies for the (111) and (100) facets
As the results presented in the previous section illustrate, for both anti-perovskite nitrides, overall conversion of the bulk anti-perovskite, to the bulk nitride, is broadly similar thermodynamically. However, it is clear that evolution of lattice N to the gas phase, either as N2, or as NH3 under hydrogenating conditions, must necessarily take place at the surface, with surface N lost to the gas phase being continually replaced by lattice N diffusing from the subsurface and bulk, before ultimately evolving to the gas phase. Hence, we will also consider the energetics of surface N vacancy formation, and diffusion of subsurface N, to the surface.
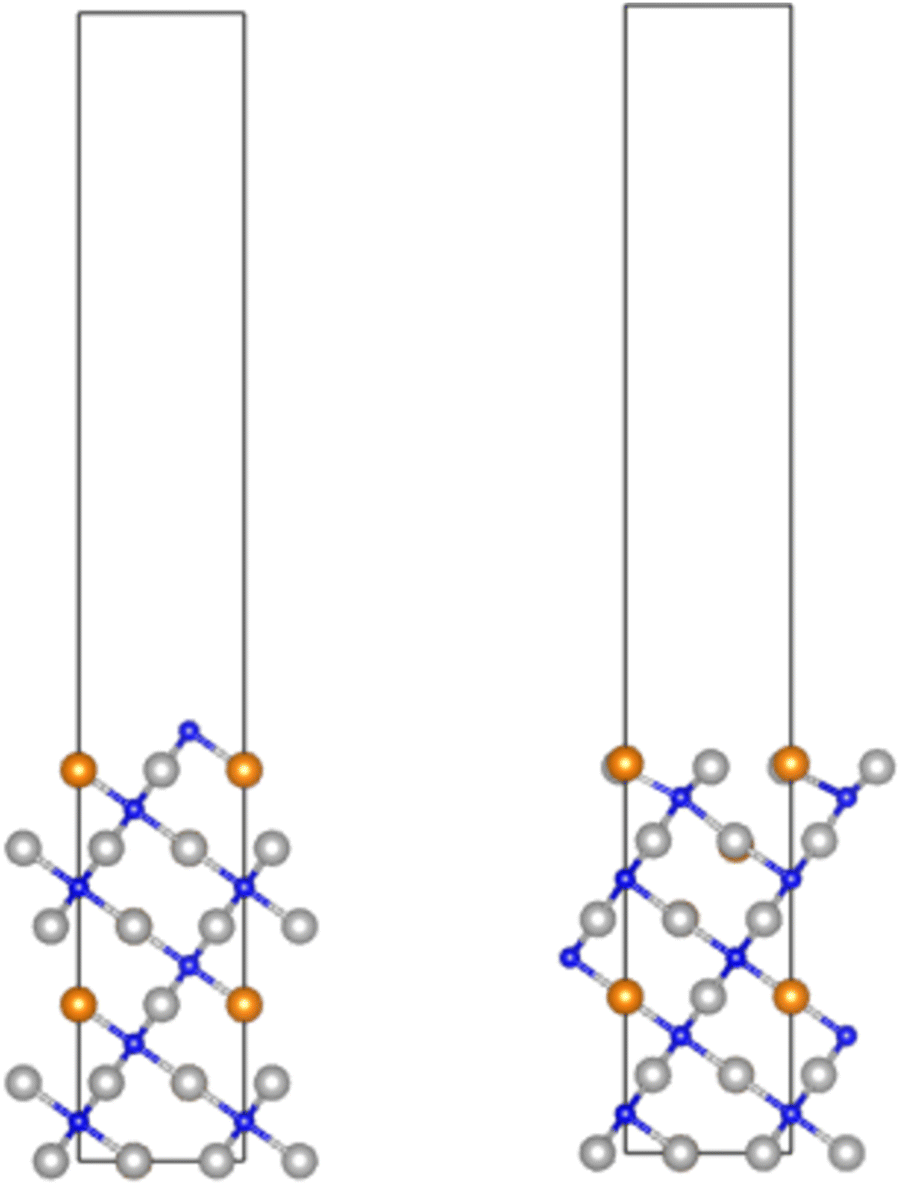
For perovskite and anti-perovskite materials, it is typically the case that the most stable, and therefore most expressed, crystalline facets correspond to the low-index (100) and (111) surfaces, with the (100) facet typically being the most stable.47,48 Hence, in the present work, we will consider these surfaces for further study.
For anti-perovskite slab models, stoichiometric slabs are necessarily asymmetric, and likewise symmetric slabs are necessarily non-stoichiometric. This considerably complicates the convenient determination of surface energies.49 However, the average surface energy for the stoichiometric asymmetric slab, or cleavage energy, may serve as a useful guide to the overall stability of Miller facets. The calculated unrelaxed cleavage energies for the Co3CuN and Ni3CuN (111) and (100) facets (Table 8) reveal that in both cases, the (100) facet is more stable. Whilst the absolute cleavage energies are greater (i.e. more endothermic) for Co3CuN, it is notable that the difference between the cleavage energies for the (111) and (100) facets is far smaller, with the (100) facet being more stable by only 0.03 J m−2, compared to 0.15 J m−2 for Ni3CuN. Hence, for a typical Co3CuN nanoparticle, we would expect a far greater proportion of the total surface area to be attributed to the (100) facets, compared to Ni3CuN. Hence, any differences in surface N vacancy formation, and therefore loss of surface lattice N to the gas phase, between the (111) and (100) facets will be amplified in the Ni3CuN system.
Table 8 DFT-calculated unrelaxed cleavage energies for the Co3CuN and Ni3CuN (111) and (100) surfaces
| Anti-perovskite |
Cleavage energy, γ (111)/J m−2 |
Cleavage energy, γ (100)/J m−2 |
| Co3CuN |
1.62 |
1.59 |
| Ni3CuN |
1.44 |
1.29 |
3.5 DFT: surface N vacancy formation and diffusion of subsurface N on the (111) facet
Considering first the less stable (111) facet, it is immediately clear that the (111) facet presents a more atomistically open surface, with lower coordination environments (Fig. 12), which corresponds with the experimentally and theoretically established tendency for such open surfaces to be less stable. Hence, it might therefore be expected that surface lattice N is more active on these surfaces compared to the more closed, and therefore more stable, (100) facet. The calculations reveal that for both Co3CuN and Ni3CuN, the surface N vacancy formation energy, with respect to formation of NH3 under hydrogenating conditions (which is the more relevant reference for practical N looping), is indeed exothermic, and is more so for Ni3CuN, by ∼0.4 eV, which is significant, but in line with the calculations for bulk decomposition of the anti-perovskite (Table 9).
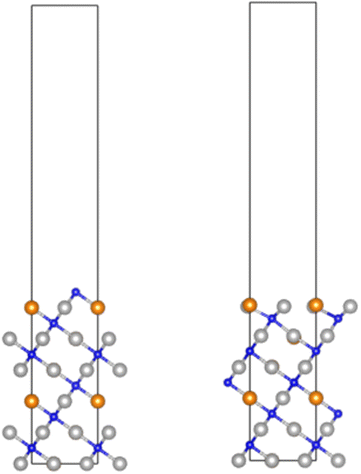 |
| | Fig. 12 Graphics illustrating the pristine (111) slab (left) and with a surface N vacancy (right). | |
Table 9 DFT-calculated surface N vacancy formation for the N-terminated (111) facet with respect to hydrogenation of lattice N to gaseous NH3. The segregation energy for exchanging a subsurface lattice N with a surface N vacancy is also presented (ΔEseg.), with negative values indicating that the segregation of subsurface lattice N to the surface is exothermic. The activation barrier for diffusion of subsurface lattice N to a surface vacancy site is also presented (EA(seg.)), along with the vibrational frequency of the corresponding unstable mode
| Anti-perovskite |
ΔEvac. (w.r.t. H2/NH3)/eV |
ΔEseg./eV |
E
A(seg.)/eV |
ν/cm−1 |
| Co3CuN |
−0.26 |
−0.17 |
0.72 |
354.53 |
| Ni3CuN |
−0.65 |
−0.25 |
0.56 |
406.41 |
To explore diffusion of subsurface N to the surface, additional calculations were performed to determine the segregation energy; for both Co3CuN and Ni3CuN, the segregation energy was found to be exothermic, i.e. it was determined that diffusion of subsurface N to occupy the surface vacancy is thermodynamically feasible. Notably, the segregation energy was slightly more exothermic for Ni3CuN, by ∼0.08 eV. In order to assess the kinetic feasibility of diffusion of subsurface N to the surface vacancy, transition states were identified; for both systems, moderate activation barriers were determined, 0.72 eV for Co3CuN and 0.56 eV for Ni3CuN. Hence, the results show that not only is surface vacancy formation more exothermic for Ni3CuN, but diffusion of subsurface N is both thermodynamically and kinetically more facile compared to Co3CuN. All of these observations are consistent with the calculated decomposition energies, but do not fully explain the experimentally observed greater resistance of Ni3CuN to loss of lattice N compared to Co3CuN. However, it must be remembered that the calculations presented in this section refer to the (111) facet, which is expected to represent only a minority fraction of a typical anti-perovskite nanoparticle surface area, since the cleavage energy was determined to be lower for the (100) facet, and more so for Ni3CuN compared to Co3CuN. Hence, it appears likely that the vacancy formation and segregation behaviour on this surface facet is key to understanding the differences between the behaviours of the Co3CuN and Ni3CuN systems, which we will explore in the next section.
3.6 DFT: surface N vacancy formation and diffusion of subsurface N on the (100) facet
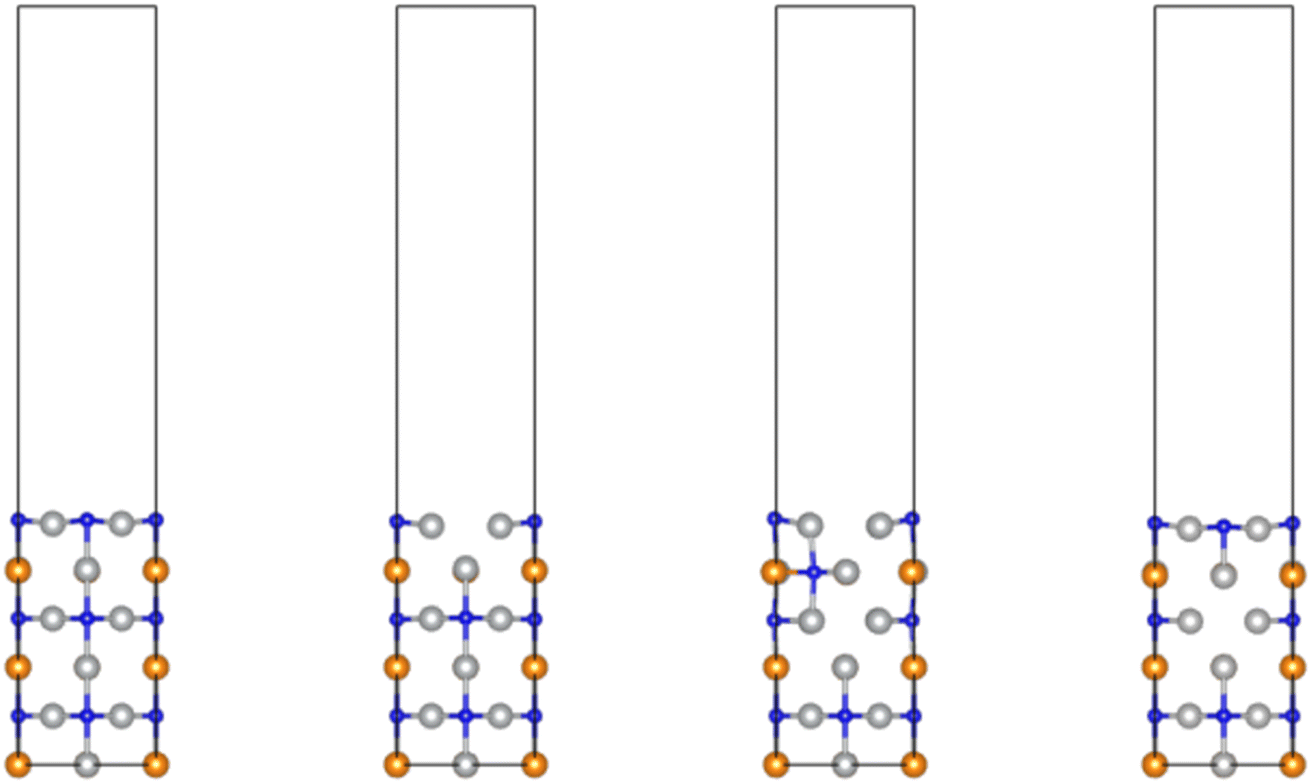
It can be seen immediately that the most stable (100) anti-perovskite facet presents a more closed surface structure (Fig. 13), with higher coordination numbers for surface atoms. This is reflected in the calculated surface N vacancy formation energies, which show that vacancy formation (via hydrogenation of lattice N to evolve NH3) is endothermic, rather than exothermic as is the case for the (111) facet (Table 10). The general trend of surface lattice N being more active in Ni3CuN compared to Co3CuN is preserved, with surface N vacancy formation being less endothermic by slightly less than 0.3 eV. Interestingly, the calculated segregation energy to exchange a subsurface lattice N for a surface N vacancy is exothermic, and considerably more so than for the (111) facet, with segregation energies of −0.98 eV and −1.29 eV for Co3CuN and Ni3CuN, respectively. This is a reflection of the higher stability of the surface lattice N in the (100) facet compared to the (111) facet, which can be attributed to the higher coordination environment.
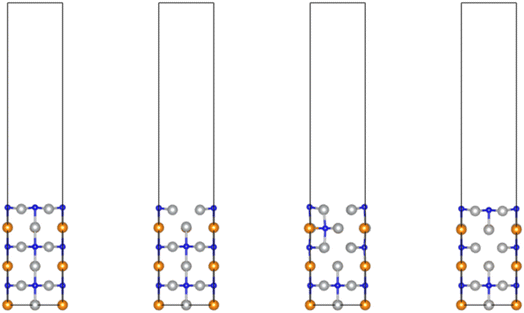 |
| | Fig. 13 Graphics illustrating, from left to right: the pristine (100) slab; with a surface N vacancy; with a subsurface lattice N occupying the interstitial intermediate site; and with a subsurface lattice N having migrated to fill the surface vacancy. | |
Table 10 DFT-calculated surface N vacancy formation for the N-terminated (100) facet with respect to hydrogenation of lattice N to gaseous NH3. The segregation energy for exchanging a subsurface lattice N with a surface N vacancy is also presented (ΔEseg. (surface)), with negative values indicating that the segregation of subsurface lattice N to the surface is exothermic. The segregation energy for moving a subsurface lattice N to the interstitial intermediate site is also presented (ΔEseg. (interstitial)), with positive values indicating that the segregation of subsurface lattice N to the surface is endothermic
| Anti-perovskite |
ΔEvac. (w.r.t. H2/NH3)/eV |
ΔEseg. (surface)/eV |
ΔEseg. (interstitial)/eV |
| Co3CuN |
0.465 |
−0.983 |
1.835 |
| Ni3CuN |
0.197 |
−1.294 |
1.377 |
Whilst the strongly exothermic segregation energy suggests that, despite the endothermic initial surface N vacancy formation, diffusion of subsurface N to surface vacancy sites is thermodynamically favoured, it is important to consider the path taken by the subsurface N to reach the surface. Unlike the (111) facet, the more restrictive coordination environments presented by the (100) facet necessitates subsurface N diffusion to take place via an interstitial octahedral site, since there is no direct pathway linking the subsurface lattice N to the surface vacancy site. It was found that the interstitial intermediate site is considerably less stable compared to the subsurface N remaining at its original lattice site, by 1.84 eV for Co3CuN and 1.38 eV for Ni3CuN. Whilst the interstitial site is relatively more stable for Ni3CuN, the energy difference is still sufficiently large to prevent significant diffusion of the subsurface lattice N to surface vacancy sites, and it is very likely that additional activation barriers for diffusion of the subsurface N to the interstitial would be even greater and therefore further inhibit diffusion.
Hence, from the DFT analysis of surface vacancy formation, and diffusion of subsurface N to reach surface vacancy sites, it is clear that whilst the overall anti-perovskite decomposition process is exothermic under hydrogenation of lattice N to NH3, the process for conversion of surface lattice N to ammonia is only exothermic for the (111) facet, and moreover, diffusion of subsurface lattice N to surface vacancy sites is much less energetically hindered for the (111) surface compared to the (100) surface. Given that the (100) facet is expected to predominate as the largest component of a typical anti-perovskite nanoparticle surface area, and that this is even more the case for Ni3CuN, since the cleavage energy for the (100) surface is proportionately less endothermic than for the (111) surface compared, it is likely that this is an important factor in rationalising the experimentally observed greater resistance of the Ni3CuN phase to decomposition. That is, the bulk anti-perovskite decomposition process can occur more readily for Co3CuN due to the higher expected surface area fraction of the (111) facet, for which both surface vacancy formation and diffusion of subsurface N to surface vacancy sites is much more feasible than for the (100) facet.
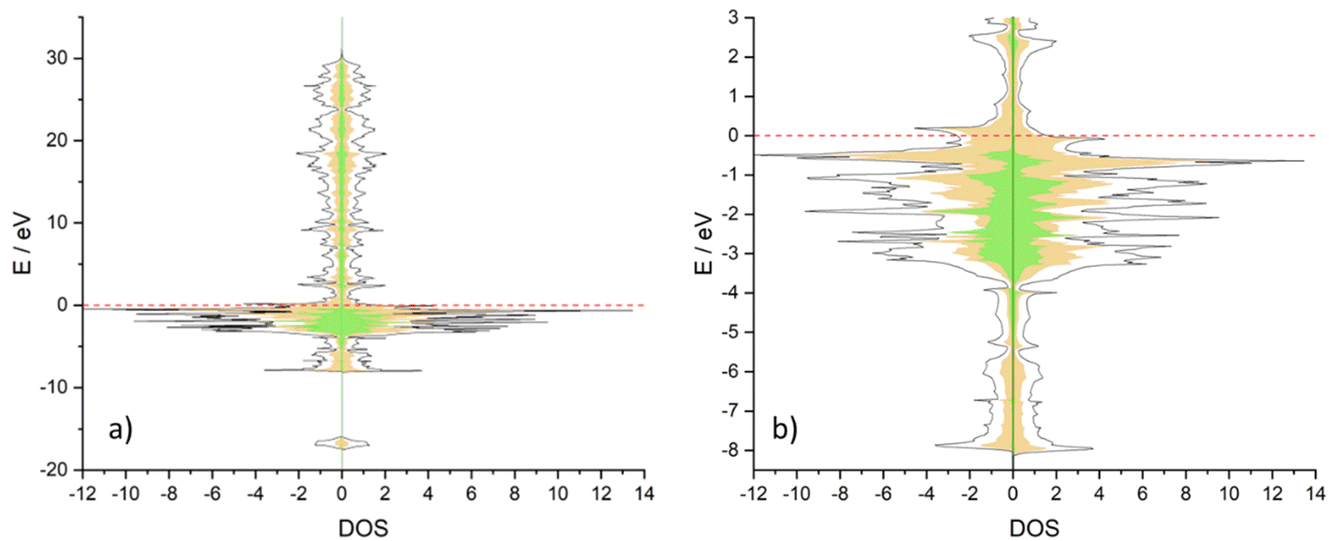
3.7 DFT: projected density of states (PDOS) and Bader charge analysis
To rationalise the different behaviours between Co3CuN and Ni3CuN, projected density of states (PDOS) plots were obtained for both bulk structures, and Bader charge analysis was performed. When comparing Co3CuN and Ni3CuN, it appears that there is a slight difference in the projected density of states (DOS) at the Fermi level. The DOS at the Fermi level for Ni3CuN is almost entirely attributed to the Ni d states as shown in Fig. 14a and b. However, for Co3CuN, while the majority of the DOS is ascribed to Co d states, a small contribution from the Cu d states is predicted as observed in Fig. 15a and b. This is reflected in the Bader charge analysis. For Co3CuN, the changes in Bader charge in comparison to the atomic electron count are approximately −0.04e for Cu, −0.40e for Co and +1.22e for N. While for Ni3CuN, the changes in the Bader charges for N (+1.32e) and Cu (−0.11e) are slightly increased compared to Co3CuN. The change in the Bader charges for Ni is −0.41e and, therefore, this is similar to the value calculated for Co. Hence, it could be suggested that the majority of the electron density from Cu is transferred to nitrogen in Ni3CuN. This small difference in DOS could explain the difference in stability and activity between the two anti-perovskite nitrides.
 |
| | Fig. 14 Plots for the projected density of states (DOS) for Ni3CuN: (a) full DOS and (b) highlighted area for metal d states at the Fermi level. Black lines: total DOS, shaded orange: Ni and shaded green: Cu. | |
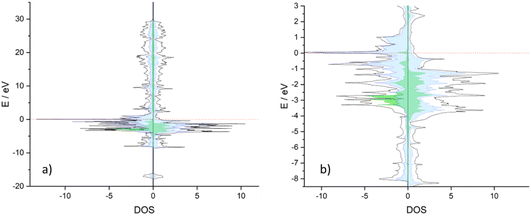 |
| | Fig. 15 Plots for the projected density of states (DOS) for Co3CuN: (a) full DOS and (b) highlighted area for metal d states at the Fermi level. Black lines: total DOS, shaded blue: Co and shaded green: Cu. | |
3.8 Co3MoN
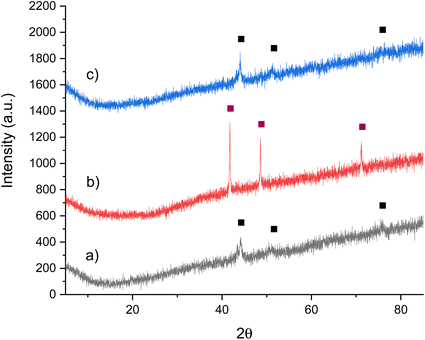
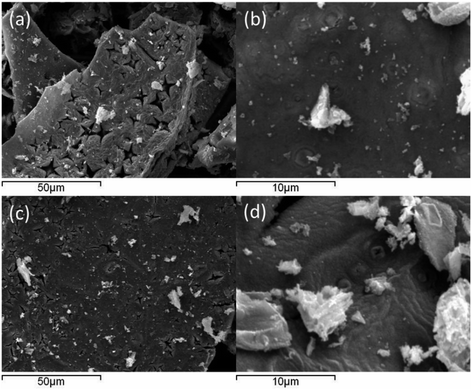
The comparison between the anti-perovskite nitride Co3MoN and the η-carbide structured Co3Mo3N may give an insight into the role structure type plays in the ammonia synthesis activity. In the anti-perovskite structure, the nitrogen is suggested to be surrounded by six A metal species, which in this case would be Co species.50 However, in the η-carbide structure, the nitrogen is bonded to six molybdenum species and, therefore, this difference in bonding may have an influence on the activity. Hence, attempts have been made to synthesise the anti-perovskite Co3MoN by ammonolysis of the oxide precursor. The XRD pattern of the resulting material reveals a broad reflection at approximately 44° 2θ that may be due to Co metal as shown in Fig. 16a. However, the elemental analysis in Table 11 appears to suggest that a nitrogen containing phase was present in the material. The expected stoichiometric nitrogen percentage for Co3MoN is 4.88 wt% and, therefore, the synthesised material has a slightly lower nitrogen content. Interestingly, the material was also observed to contain a significant percentage of hydrogen (0.50%). Representative SEM images displayed in Fig. 17a and b show that the material has a porous and smooth surface. The morphology of Co3Mo3N has been previously reported to consist of small needles.51 The Co:Mo ratio of the material was revealed by EDX to be 53:37, which suggests that the material has a lower cobalt content than expected (ratio of Co:Mo is 62.0:33.5 for Co3MoN). Across the areas examined by EDX, there were no regions that had a higher percentage of cobalt as may be predicted due to the possible presence of cobalt metal in the material as observed from the XRD pattern.
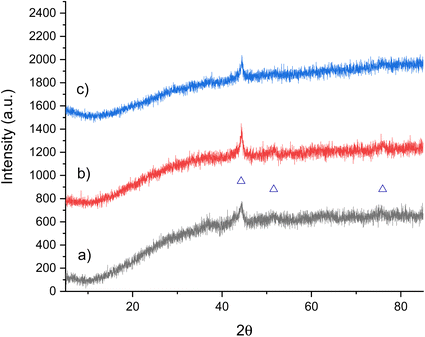 |
| | Fig. 16 XRD patterns of Co3MoN: (a) pre-reaction, (b) post-reaction with 3:1 H2/N2 at 200 °C and 250 °C and (c) post-reaction with 3:1 H2/N2 at 300 °C and 400 °C. (Δ) Co. | |
Table 11 Nitrogen analysis pre- and post-reaction for ‘Co3MoN’
| Material |
Nitrogen content (wt%) |
| ‘Co3MoN’ |
4.08 |
| ‘Co3MoN’ post N2/H2 200 °C and 250 °C |
1.82 |
| ‘Co3MoN’ post N2/H2 300 °C and 400 °C |
1.56 |
 |
| | Fig. 17 Representative SEM images of ‘Co3MoN’: (a and b) pre-reaction and (c and d) post N2/H2 reaction at 400 °C. | |
As for Co3CuN and Ni3CuN, the ammonia production activity was examined by reacting ‘Co3MoN’ under 3:1 H2/N2 at 200 °C and 250 °C. The conductivity profile presented in Fig. 18a suggests that there was an initial large amount of ammonia produced for the first 20 minutes at 200 °C. However, after this time, the production of ammonia was minimal at both 200 °C and 250 °C. This initial decrease is in contrast to Co3CuN and Ni3CuN, which had minimal ammonia synthesis activity at 200 °C. The nitrogen analysis illustrates that a significant amount of lattice nitrogen was lost during the reaction (Table 11) and hence, this could explain the initial activity. However, it appears that the remaining 55% of lattice nitrogen was not as easily removed from the material during the reaction. The percentage of lattice nitrogen that was removed from the material that was converted to ammonia was 80%. There appears to have been no major changes in the post-reaction XRD pattern compared to pre-reaction as shown in Fig. 16b. This suggests that the reflection at approximately 44° 2θ is not due to a nitride phase as it would be expected that there would be a shift in peak position upon reduction in nitrogen content.
 |
| | Fig. 18 Ammonia production reaction profiles of ‘Co3MoN’ reacted with 60 mL min−1 of 3:1 H2/N2 (a) for 3 hours 25 minutes at 200 °C and 4 hours 5 minutes at 250 °C and (b) for 3 hours 35 minutes at 300 °C and 3 hours 45 minutes at 400 °C. | |
The ammonia production activity of ‘Co3MoN’ was investigated under 3:1 H2/N2 at higher temperatures of 300 °C and 400 °C and the results are displayed in Fig. 18b. As before, there was an initial large decrease in conductivity during the first 15 minutes of the reaction. Then, the production of ammonia was minimal at 300 °C and it appears that the activity was non-steady state. However, when the temperature was increased to 400 °C, the material was shown to have steady state activity with a calculated rate of 92 ± 15 μmol h−1 g−1. In contrast to Co3CuN and Ni3CuN, although there was a decrease in nitrogen content, a significant amount of nitrogen was still present in the material post-reaction as presented in Table 11. Therefore, for the anti-perovskite nitrides, the metal composition may have an effect on the stability and activity. It has previously been noted that the nitrogen content of Co3Mo3N remains similar between pre- and post-reaction under 3:1 H2/N2.40 Therefore, the behaviour of the anti-perovskite ‘Co3MoN’ is different compared to the Co3Mo3N phase. The material was run for a longer time of approximately 8 hours at 400 °C to examine the activity further. The conductivity profile in Fig. 3 in the ESI† illustrates that steady state activity was achieved over the reaction. However, the nitrogen analysis in Table 1 of the ESI† shows that a large percentage of nitrogen was removed from this material during the reaction and therefore, a longer run may be required to examine if the activity is due to loss of lattice nitrogen or a catalytic process. Co3Mo3N has been reported to have a rate of 165 μmol h−1 g−1 and as high as 652 μmol h−1 g−1 at 400 °C.40,52 Therefore, the η-carbide structured Co3Mo3N appears to be more active for ammonia synthesis. The XRD pattern in Fig. 16c shows that there was no change in phase compared to pre-reaction. The representative post-reaction SEM images for ‘Co3MoN’ are displayed in Fig. 17c and d and show that there was no difference in morphology between pre- and post-reaction. The Co:Mo ratio of the material post-reaction as shown by EDX was 55:40. These values are similar to the pre-reaction ratio and therefore, this suggests that there has not been a change in metal composition during the reaction.
Li3AlN doped with either Ni or Co has been recently investigated for its ammonia synthesis reactivity.53 The activity was reported to be stable over 80 hours under the ammonia synthesis conditions with a rate of 2410 μmol g−1 h−1 for Ni/La–Al–N and 2735 μmol g−1 h−1 for Co/La–Al–N at 400 °C and 0.1 MPa. Post-reaction analysis showed that the nitrogen content had significantly increased compared to pre-reaction and thus, the authors propose that the anti-perovskite nitride transforms to a distorted La–Al–N rock salt structure. The authors state that the local structure of NLa6 coordination is unaffected by the transformation. However, there is a suggestion that a substantial lattice distortion occurs due to the doping of Al into the lattice. Isotopic labelling studies revealed that the lattice nitrogen of the La–Al–N lattice were involved in the production of ammonia. It was also shown that dissociated D and N reacted on the Co surface, which was not observed for Ni. Therefore, it is proposed that an associative mechanism occurs for Ni/La–Al–N, whereas for Co/La–Al–N, both associative and dissociative mechanisms are anticipated. These results suggest that doping of the anti-perovskite nitrides with metals may be a possible avenue to explore in the future.
4. Conclusion
The anti-perovskite nitrides Co3CuN and Ni3CuN have been investigated for their ammonia synthesis activity at 200–400 °C under 3:1 H2/N2. This was performed to establish the possible relationship between metal composition and activity. For both Co3CuN and Ni3CuN, it was observed that the production of ammonia was due to the loss of lattice nitrogen from the nitrides. It was found that Co3CuN produced ammonia from 250 °C and was highly active at 300 °C. Ni3CuN was observed to require a higher reaction temperature and the release of lattice nitrogen was slower than for Co3CuN. Upon the loss of lattice nitrogen, a topotactic reaction occurred and Co3Cu and Ni3Cu were formed. From computational investigations it was discovered that, whilst overall decomposition of both anti-perovskites is exothermic with respect to hydrogenation of lattice N to yield ammonia, the calculated thermodynamics for this process suggest a greater ease of reversibility on exposure to N2 for Co3CuN, compared to Ni3CuN. Whilst decomposition of bulk Ni3CuN was found to be more thermodynamically feasible for Ni3CuN, it was found that the more stable (100) facet for both nitrides is less active for loss of lattice N compared to the minority (111) facet, and that for the Ni3CuN system, the calculated cleavage energies suggest a larger fraction of the surface area of a typical nanoparticle is accounted for by the less active (100) facet compared to Co3CuN, providing a plausible explanation for the experimentally observed differences in N looping behaviour. The calculated PDOS revealed there was a difference in the density of states at the Fermi level between Co3CuN and Ni3CuN. For Co3CuN, there was a contribution from both Co and Cu d states, whereas for Ni3CuN, only Ni d states contributed to the DOS. Regenerability of the anti-perovskite nitrides from Co3Cu and Ni3Cu was attempted by ammonolysis and N2. Co3CuN and Ni3CuN could be regenerated when NH3 was used as the nitrogen source but when using N2 alone, the renitridation process was unsuccessful. The anti-perovskite nitride Co3MoN was also examined for its ammonia synthesis activity under the same reaction conditions. Although, the resulting nitride showed steady state activity at 400 °C with a rate of 92 ± 15 μmol h−1 g−1, the nitrogen content decreased during the reaction and therefore, the activity may be due to loss of lattice nitrogen and would need to be examined further. A schematic summary of the work on the anti-perovskite nitrides reported herein is provided in Fig. 19.
 |
| | Fig. 19 Transformations of the anti-perovskite nitrides Co3CuN and Ni3CuN. | |
Conflicts of interest
There are no conflicts of interest to declare.
Acknowledgements
The authors wish to acknowledge the EPSRC for the research grants EP/T027851/1 and EP/T028629/1. We are also grateful to Mr Gangi Reddy Ubbara, Dr Giovanni Rossi, Ms Jessica Walker and Mr Jim Gallagher of the University of Glasgow for their assistance with combustion analyses and SEM imaging.
References
- P. H. Pfromm, Towards sustainable agriculture: fossil-free ammonia, J. Renewable Sustainable Energy, 2017, 9, 034702 CrossRef.
- I. Rafiqul, C. Weber, B. Lehmann and A. Voss, Energy efficiency improvements in ammonia production - perspectives and uncertainties, Energy, 2005, 30(13), 2487–2504 CrossRef CAS.
- A. Daisley and J. S. J. Hargreaves, Metal nitrides, the Mars-van Krevelen mechanism and heterogeneously catalysed ammonia synthesis, Catal. Today, 2022 DOI:10.1016/j.cattod.2022.08.016.
- A.-M. Alexander, J. S. J. Hargreaves and C. Mitchell, The Reduction of Various Nitrides under Hydrogen: Ni3N, Cu3N, Zn3N2 and Ta3N2, Top. Catal., 2012, 55, 1046–1053 CrossRef CAS.
- D. McKay, J. S. J. Hargreaves, J. L. Rico, J. L. Rivera and X.-L. Sun, The influence of phase and morphology of molybdenum nitrides on ammonia synthesis activity and reduction characteristics, J. Solid State Chem., 2008, 181(2), 325–333 CrossRef CAS.
- S. Laassiri, C. D. Zeinalipor-Yazdi, C. R. A. Catlow and J. S. J. Hargreaves, The potential of manganese nitride based materials as nitrogen transfer reagents for nitrogen chemical looping, Appl. Catal., B, 2018, 223, 60–66 CrossRef CAS.
- S. Laassiri, C. D. Zeinalipour, N. Bion, C. R. A. Catlow and J. S. J. Hargreaves, Combination of theoretical and in situ experimental investigations of the role of lithium dopant in manganese nitride: a two-stage reagent for ammonia synthesis, Faraday Discuss., 2021, 229, 281–296 RSC.
- D. McKay, D. H. Gregory, J. S. J. Hargreaves, S. M. Hunter and X. Sun, Towards nitrogen transfer catalysis: reactive lattice nitrogen in cobalt molybdenum nitride, Chem. Commun., 2007, 3051–3053 RSC.
- F. R. Garcia-Garcia and I. S. Metcalfe, Chemical looping dry reforming of methane using mixed oxides of iron and cerium: Operation window, Catal. Commun., 2021, 160, 106356 CrossRef CAS.
- C. Doornkamp and V. Ponec, The universal character of the Mars and Van Krevelen mechanism, J. Mol. Catal. A: Chem., 2000, 162(1–2), 19–32 CrossRef CAS.
- E. R. S. Winter, Exchange Reactions of Oxides Part IX, J. Chem. Soc. A, 1968, 2889–2902 RSC.
- R. Michalsky, A. M. Avram, B. A. Peterson, P. H. Pfromm and A. A. Peterson, Chemical looping of metal nitride catalysts: low-pressure ammonia synthesis for energy storage, Chem. Sci., 2015, 6, 3965–3974 RSC.
- R. Michalsky, P. H. Pfromm and A. Steinfeld, Rational design of metal nitride redox materials for solar-driven ammonia synthesis, Interface Focus, 2015, 5, 20140084 CrossRef PubMed.
- Y. Goto, A. Daisley and J. S. J. Hargreaves, Towards anti-perovskite nitrides as potential nitrogen storage materials for chemical looping ammonia production: Reduction of Co3ZnN, Ni3ZnN, Co3InN and Ni3InN under hydrogen, Catal. Today, 2021, 364, 196–201 CrossRef CAS.
- L. Ye, H. Li and K. Xie, Sustainable ammonia production enabled by membrane reactor, Nat. Sustain., 2022, 5, 787–794 CrossRef.
- S. Alconchel, F. Sapina, D. Beltran and A. Beltran, Chemistry of interstital molybdenum ternary nitrides MnMo3N (M = Fe, Co, n = 3; M = Ni, n = 2), J. Mater. Chem., 1998, 8(8), 1901–1909 RSC.
- A. Daisley, L. Costley-Wood and J. S. J. Hargreaves, The Role of Composition and Phase upon the Lattice Nitrogen Reactivity of Ternary Molybdenum Nitrides, Top. Catal., 2021, 64, 1021–1029 CrossRef CAS.
- N. Bion, F. Can, J. Cook, J. S. J. Hargreaves, A. L. Hector, W. Levason, A. R. McFarlane, M. Richard and K. Sardar, The role of preparation route upon the ambient pressure ammonia synthesis activity of Ni2Mo3N, Appl. Catal., A, 2015, 504, 44–50 CrossRef CAS.
- G. Kresse and J. Hafner, Ab initio molecular dynamics for liquid metals, Phys. Rev. B: Condens. Matter Mater. Phys., 1993, 47, 558–561 CrossRef CAS PubMed.
- G. Kresse and J. Hafner, Ab initio molecular-dynamics simulation of the liquid-metal–amorphous-semiconductor transition in germanium, Phys. Rev. B: Condens. Matter Mater. Phys., 1994, 49, 14251–14269 CrossRef CAS PubMed.
- G. Kresse and J. Furthmüller, Efficiency of ab-initio total energy calculations for metals and semiconductors using a plane-wave basis set, Comput. Mater. Sci., 1996, 6, 15–50 CrossRef CAS.
- G. Kresse and J. Furthmüller, Efficient iterative schemes for ab initio total-energy calculations using a plane-wave basis set, Phys. Rev. B: Condens. Matter Mater. Phys., 1996, 54, 11169–11186 CrossRef CAS PubMed.
- B. Hammer, L. B. Hansen and J. K. Nørskov, Improved adsorption energetics within density-functional theory using revised Perdew-Burke-Ernzerhof functionals, Phys. Rev. B: Condens. Matter Mater. Phys., 1999, 59, 7413–7421 CrossRef.
- C. D. Zeinalipour-Yazdi, J. S. J. Hargreaves and C. R. A. Catlow, Nitrogen Activation in a Mars-van Krevelen Mechanism for Ammonia Synthesis on Co3Mo3N, J. Phys. Chem. C, 2015, 119, 28368–28376 CrossRef CAS.
- C. D. Zeinalipour-Yazdi, J. S. J. Hargreaves and C. R. A. Catlow, DFT-D3 Study of Molecular N2 and H2 Activation on Co3Mo3N Surfaces, J. Phys. Chem. C, 2016, 120, 21390–21398 CrossRef CAS.
- C. D. Zeinalipour-Yazdi, J. S. J. Hargreaves and C. R. A. Catlow, Low-T Mechanisms of Ammonia Synthesis on Co3Mo3N, J. Phys. Chem. C, 2018, 122, 6078–6082 CrossRef CAS.
- P. E. Blöchl, Projector augmented-wave method, Phys. Rev. B: Condens. Matter Mater. Phys., 1994, 50, 17953–17979 CrossRef PubMed.
- G. Kresse, From ultrasoft pseudopotentials to the projector augmented-wave method, Phys. Rev. B: Condens. Matter Mater. Phys., 1999, 59, 1758–1775 CrossRef CAS.
- H. J. Monkhorst and J. D. Pack, Special points for Brillouin-zone integrations, Phys. Rev. B: Solid State, 1976, 13, 5188–5192 CrossRef.
- G. Henkelman, B. P. Uberuaga and H. Jónsson, A climbing image nudged elastic band method for finding saddle points and minimum energy paths, J. Chem. Phys., 2000, 113, 9901 CrossRef CAS.
- G. Henkelman and H. Jónsson, A dimer method for finding saddle points on high dimensional potential surfaces using only first derivatives, J. Chem. Phys., 1999, 111, 7010–7022 CrossRef CAS.
- J. Zhang, X. Zhao, L. Du, Y. Li, L. Zhang, S. Liao, J. B. Goodenough and Z. Cui, Antiperovskite Nitrides CuNCo3-xVx: Highly Efficient and Durable Electrocatalysts for the Oxygen-Evolution Reaction, Nano Lett., 2019, 19(10), 7457–7463 CrossRef CAS PubMed.
- C. Fernandez, C. Sassoye, D. R. Debecker, C. Sanchez and P. Ruiz, Effect of the size and distribution of supported Ru nanoparticles on their activity in ammonia synthesis under mild reaction conditions, Appl. Catal., A, 2014, 474, 194–202 CrossRef CAS.
- C. Leterme, C. Fernandez, P. Eloy, E. M. Gaigneaux and P. Ruiz, The inhibitor role of NH3 on its synthesis process at low temperature, over Ru catalytic nanoparticles, Catal. Today, 2017, 286, 85–100 CrossRef CAS.
- C. Fernandez, C. Sassoye, N. Flores, N. Escalona, E. M. Gaigneaux, C. Sanchez and P. Ruiz, Insights in the mechanism of deposition and growth of RuO2 colloidal nanoparticles over alumina. Implications on the activity for ammonia synthesis, Appl. Catal., A, 2015, 502, 48–56 CrossRef CAS.
- K. Ooya, J. Li, K. Fukui, S. Iimura, T. Nakao, K. Ogasawara, M. Sasase, H. Abe, Y. Niwa, M. Kitano and H. Hosono, Ruthenium Catalysts Promoted by Lanthanide Oxyhydrides with High Hydride-Ion Mobility for Low-Temperature Ammonia Synthesis, Adv. Energy Mater., 2021, 11(4), 2003723 CrossRef CAS.
- T.-N. Ye, S.-W. Park, Y. Lu, J. Li, M. Sasase, M. Kitano, T. Tada and H. Hosono, Vacancy-enabled N2 activation for ammonia synthesis on an Ni-loaded catalyst, Nature, 2020, 583, 391–395 CrossRef CAS PubMed.
- M. Kitano, Y. Inoue, H. Ishikawa, K. Yamagata, T. Nakao, T. Tada, S. Matsuishi, T. Yokoyama, M. Hara and H. Hosono, Essential role of hydride ion in ruthenium-based ammonia synthesis catalysts, Chem. Sci., 2016, 7, 4036–4043 RSC.
- Q. Wang, J. Pan, J. Guo, H. A. Hansen, H. Xie, L. Jiang, L. Hua, H. Li, Y. Guan, P. Wang, W. Gao, L. Liu, H. Cao, Z. Xiong, T. Vegge and P. Chen, Ternary ruthenium complex hydrides for ammonia synthesis via the associative mechanism, Nat. Catalysis, 2021, 4, 959–967 CrossRef CAS.
- J. S. J. Hargreaves and D. McKay, A comparison of the reactivity of lattice nitrogen in Co3Mo3N and Ni2Mo3N catalysts, J. Mol. Catal. A: Chem., 2009, 305(1–2), 125–129 CrossRef CAS.
- D. McKay, D. H. Gregory, J. S. J. Hargreaves, S. M. Hunter and X. Sun, Towards nitrogen transfer catalysis: reactive lattice nitrogen in cobalt molybdenum nitride, Chem. Commun., 2007, 3051–3053 RSC.
- A.-M. Alexander, J. S. J. Hargreaves and C. Mitchell, The Denitridation of Nitrides of Iron, Cobalt and Rhenium Under Hydrogen, Top. Catal., 2013, 56, 1963–1969 CrossRef CAS.
- S. Laassiri, C. D. Zeinalipour-Yazdi, C. R. A. Catlow and J. S. J. Hargreaves, Nitrogen transfer properties in tantalum nitride based materials, Catal. Today, 2017, 286, 147–154 CrossRef CAS.
- C. D. Zeinalipour-Yazdi, J. S. J. Hargreaves, S. Laassiri and C. R. A. Catlow, The integration of experiment and computational modelling in heterogeneously catalysed ammonia synthesis over metal nitrides, Phys. Chem. Chem. Phys., 2018, 20, 21803–21808 RSC.
- D. H. Gregory, J. S. J. Hargreaves and S. M. Hunter, On the Regeneration of Co3Mo3N from Co6Mo6N with N2, Catal. Lett., 2011, 141, 22–26 CrossRef CAS.
- A. G. Cairns, J. G. Gallagher, J. S. J. Hargreaves, D. McKay, J. L. Rico and K. Wilson, The effect of low levels of dopants upon the formation of beta-phase molybdenum nitride, J. Solid State Chem., 2010, 183(3), 613–619 CrossRef CAS.
- K. Huang, L. Yuan and S. Feng, Crystal facet tailoring arts in perovskite oxides, Inorg. Chem. Front., 2015, 2, 965–981 RSC.
- C. Ma, M.-C. Kang, S.-H. Lee, S. J. Kwon, H.-W. Cha, C.-W. Yang and N.-G. Park, Photovoltaically top-performing perovskite crystal facets, Joule, 2022, 6, 2626–2643 CrossRef CAS.
- D. Santos-Carballal, A. Roldan, R. Grau-Crespo and N. H. de Leeuw, A DFT study of the structures, stabilities and redox behaviour of the major surfaces of magnetite Fe3O4, Phys. Chem. Chem. Phys., 2014, 16, 21082–21097 RSC.
- Y. Wang, H. Zhang, J. Zhu, X. Lu, S. Li, R. Zou and Y. Zhao, Antiperovskites with Exceptional Functionalities, Adv. Mater., 2020, 32(7), 1905007 CrossRef CAS PubMed.
- I. AlShibane, A. Daisley, J. S. J. Hargreaves, A. L. Hector, S. Laassiri, J. L. Rico and R. I. Smith, The Role of Composition for Cobalt Molybdenum Carbide in Ammonia Synthesis, ACS Sustainable Chem. Eng., 2017, 5, 9214–9222 CrossRef CAS.
- R. Kojima and K.-I. Aika, Cobalt Molybdenum Bimetallic Nitride Catalysts for Ammonia Synthesis Part 1. Preparation and Characterisation, Appl. Catal., A, 2001, 215, 149–160 CrossRef CAS.
- Y. Lu, T.-N. Ye, J. Li, Z. Li, H. Guan, M. Sasase, Y. Niwa, H. Abe, Q. Li, F. Pan, M. Kitano and H. Hosono, Approach to Chemically Durable Nickel and Cobalt Lanthanum-Nitride-Based Catalysts for Ammonia Synthesis, Angew. Chem., Int. Ed., 2022, 61, e202211759 CAS.
|
| This journal is © The Royal Society of Chemistry 2023 |
Click here to see how this site uses Cookies. View our privacy policy here.  Open Access Article
 This Open Access Article is licensed under a
  *a,
Michael
Higham
*a,
Michael
Higham
 ) Co3CuN and (■) Co3Cu.
 ) Co3CuN and (■) Co3Cu.
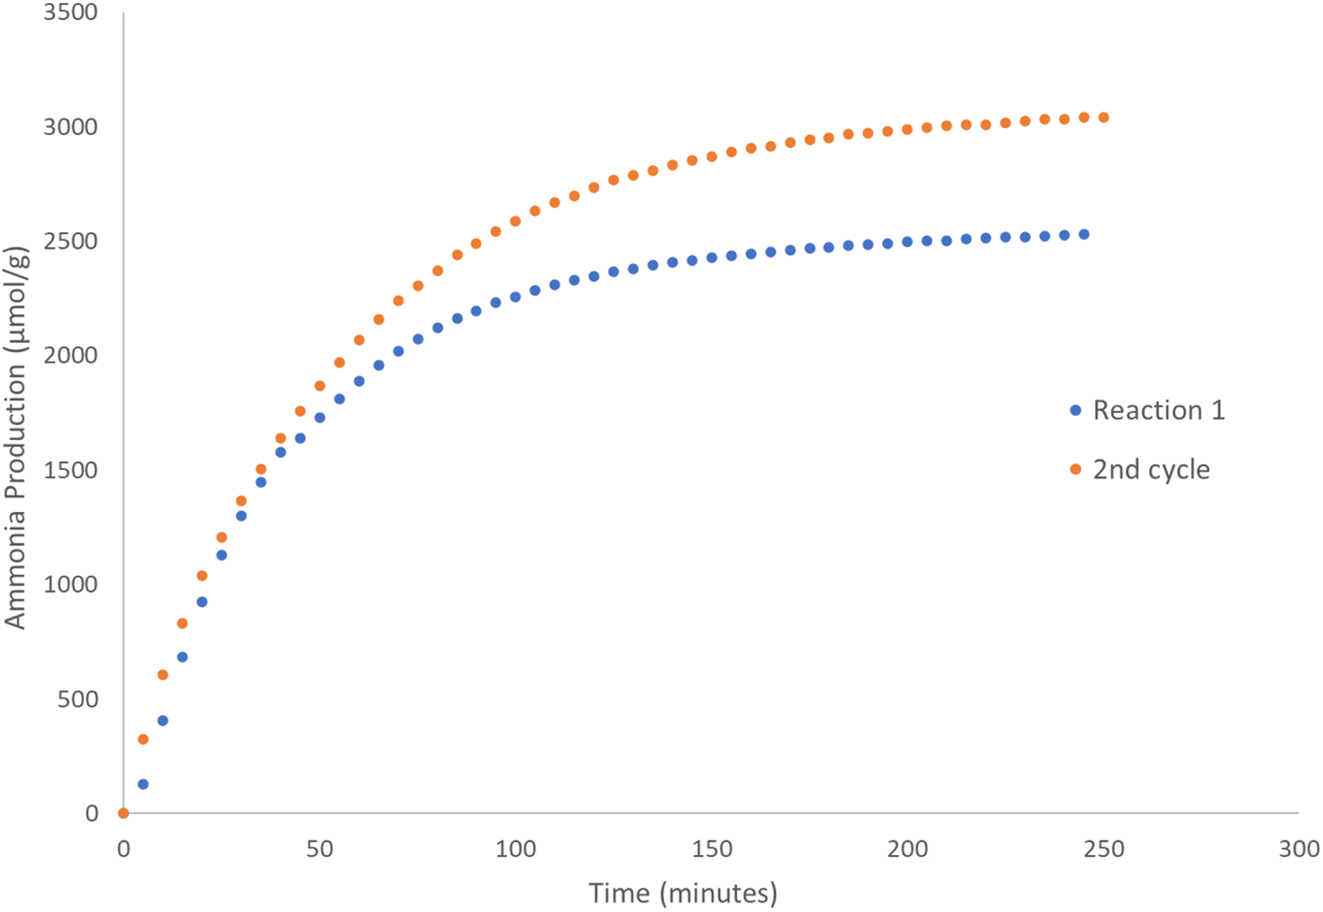
 ) Cu.
) Cu.
 ) Ni3CuN and (
 ) Ni3Cu.
 ) Ni3CuN and (
 ) Ni3Cu.
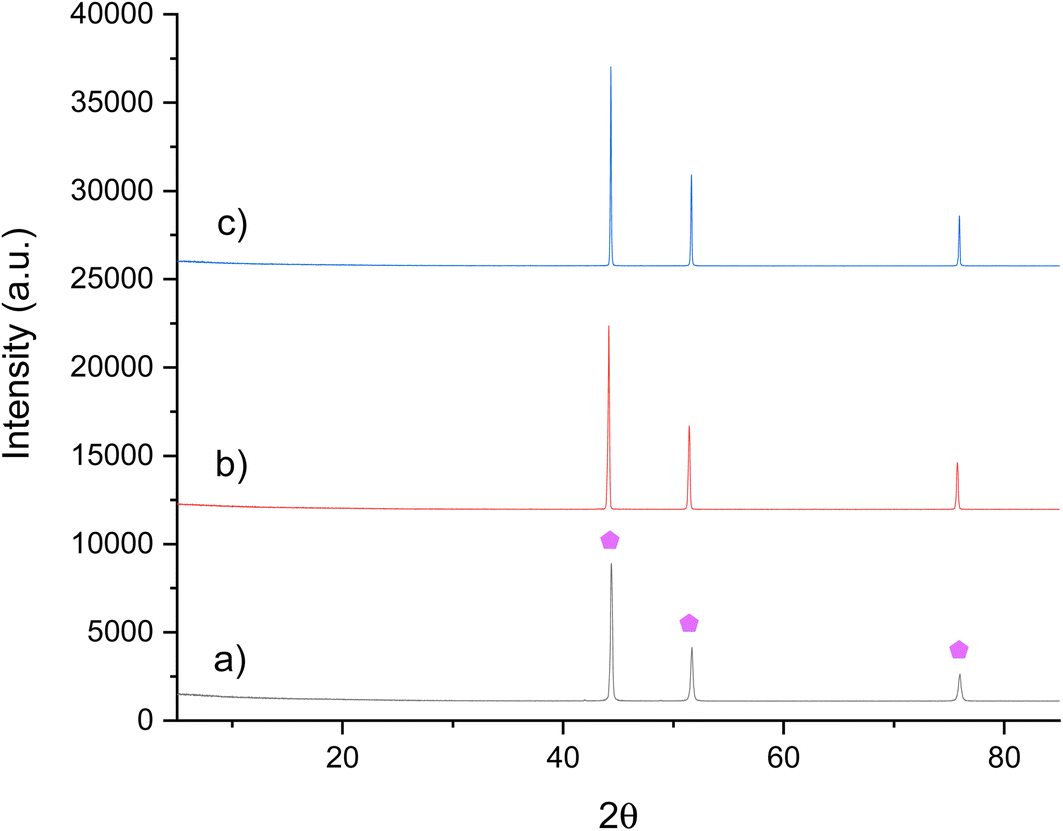
 ) Ni3Cu.