Enhanced oxygen reduction kinetics of IT-SOFC cathode with PrBaCo2O5+δ/Gd0.1Ce1.9O2−δ coherent interface†
Yang
Zhang
 a,
Leyu
Shen
a,
Yuhao
Wang
c,
Zhihong
Du
a,
Leyu
Shen
a,
Yuhao
Wang
c,
Zhihong
Du
 ab,
Binze
Zhang
a,
Francesco
Ciucci
 cd and
Hailei
Zhao
 *ab
*ab
aSchool of Materials Science and Engineering, University of Science and Technology Beijing, Beijing 100083, China. E-mail: hlzhao@ustb.edu.cn; Fax: +86 10 82376837; Tel: +86 10 82376837
bBeijing Municipal Key Lab for Advanced Energy Materials and Technologies, Beijing 100083, China
cDepartment of Mechanical and Aerospace Engineering, The Hong Kong University of Science and Technology, Hong Kong, China
dDepartment of Chemical and Biological Engineering, The Hong Kong University of Science and Technology, Hong Kong, China
First published on 18th January 2022
Abstract
One challenge facing the development of high-performance cathodes for solid oxide fuel cells is the slow oxygen reduction kinetics. Here, we report a dual-phase cathode material, double perovskite structure PrBaCo2O5+δ (PBC) and fluorite structure Gd0.1Ce0.9O2−δ (GDC), successfully synthesized using a one-pot method, with remarkable oxygen reduction reaction activity and low polarization resistance under IT-SOFC service conditions. The coherent interface structure is formed between PBC and GDC particles, which is beneficial to alleviate the lattice thermal expansion. The introduction of the cubic GDC phase can guide the oxygen transport among PBC particles with different orientations. When measured in a symmetrical cell configuration in the air at 600 °C, PBC–10 wt% GDC electrode shows an area-specific resistance of 0.394 Ω cm2, which is about 78% lower than that of bare PBC electrode under the same situations. The charge transfer process on the electrode surface is the rate-limiting step based on the dependence of polarization resistance at different oxygen partial pressures, where the impedance analysis technique, the distribution of relaxation times (DRT), is devoted to describing the complex electrode reaction processes. The GDC introduction significantly decreases the charge transfer resistance of the PBC–GDC composite cathode. The maximum power density of lab-scale electrolyte-supported cell with PBC–10 wt% GDC cathode reaches 1302, 938, 549 and 235 mW cm−2 at 850, 750, 650 and 550 °C, respectively. Our results demonstrate that such dual-phase composites PBC–GDC produced in one step can be considered a promising cathode material for intermediate/low-temperature solid oxide fuel cells.
1 Introduction
A solid oxide fuel cell (SOFC) is an advanced power generation system that converts chemical energy directly to electricity by electrochemical reactions. Because of its high efficiency, low emissions, fuel flexibility, and versatility, SOFC is considered a promising next-generation power technology.1 The traditional SOFC usually operates at high temperatures (>800 °C), which could create various problems, such as chemical reactions, element diffusion between components, material degradation, and sealing failure after a long-term operation, and causing limitation in the material selection for interconnects and electrode.2 Decreasing the operating temperature to the intermediate range of 600–800 °C can mitigate the reaction between cell components, enhance the stack durability and reduce the overall costs.3 However, the cathode polarization resistance (Rp) increases sharply while lowering the operating temperature, which becomes the critical factor limiting cell performance.4To address this issue, considerable efforts have been devoted to designing and exploring new cathode materials. Among variously reported chemistries, A-site cation-ordered perovskites, based on lanthanide barium cobalt oxides (LnBaCo2O5+δ, Ln is lanthanide elements, e.g., Pr, Nd, Sm, Gd, etc., 0 ≤ δ ≤ 1), have attracted extensive attention due to their remarkable electrocatalytic activity to oxygen reduction.5 In LnBaCo2O5+δ series, PrBaCo2O5+δ (PBC) shows the greatest electrochemical performance, which is ranked in the order of Pr > Gd > Nd > Sm > La > Y.6 The Rp of PBC in a symmetrical cell configuration is 0.86 Ω cm2 at 600 °C in air,7 which is much lower than 1.2 Ω cm2 for La0.6Sr0.4Co0.2Fe0.8O3−δ (LSCF)8 and 72.54 Ω cm2 for La0.8Sr0.2MnO3 (LSM)9 under a similar experimental environment.
PrBaCo2O5+δ usually adopts tetragonal lattice, taking the space group P4/mmm, with [PrO] and [BaO] layers arranged alternately along the c-axis on account of a huge difference in the ionic radii between Pr3+ and Ba2+, which impels more oxygen vacancies appearing among [PrO] layers to mitigate the structural stress between two kinds of layers.10,11 Therefore, there is rapid oxygen ion transport in the [PrO] layer of the a–b plane, while much sluggish along c-axis. The anisotropic oxygen ion transport feature sometimes impedes oxygen ion diffusion between particles because of the random orientation distribution of cathode particles in a porous electrode, and, as such, slows down the electrode reaction kinetics. The introduction of a cubic-structured oxygen ion conductor can help to guide the oxygen ion transport between particles with different orientations. Ceria-based fluorite is a good candidate to overcome this obstacle due to its fast 3D oxygen ion conduction feature at intermediate temperatures, as well as its ability to store and release oxygen.12–15
In addition, cobalt-containing A-site cation-ordered perovskites usually have higher thermal expansion coefficients (TECs), for example, 24.0 × 10⁻⁶ K−1 for PBC16 and 23.1 × 10⁻⁶ K−1 for NdBaCo2O5+δ,17 which are not compatible with conventional electrolytes, e.g., gadolinium-doped ceria (GDC, 12.5 × 10⁻⁶ K−1) and strontium and magnesium-doped lanthanum gallate (LSGM, 10.5 × 10⁻⁶ K−1).18 The large difference in TECs will lead to huge thermal stress between SOFC components when the temperature climbs or drops fast, and may cause cell damage induced by fuel explosion. Incorporation of electrolyte phase into cobalt-containing perovskite cathode can decrease the cathode average TEC and therefore improve the mechanical compatibility between cathode and electrolyte.
Accordingly, the ceria electrolyte composited A-site ordered perovskite cathode has attracted much attention in recent years because of the great potential in acquiring enhanced electrode reaction kinetics and improved mechanical compatibility with electrolytes. Several studies have reported that the introduction of ceria-based electrolytes, such as GDC and samarium-doped ceria (SDC), dramatically improves the electrochemical performance of PBC cathode.19–22 After infiltrating PBC into an SDC backbone, the Rp decreased from 0.86 Ω cm2 of PBC to 0.08 Ω cm2 of PBC@SDC at 600 °C.23 Shao and co-workers reported that the PBC–30 wt% SDC composite cathode shows an increased peak power density compared to cells with PBC alone (875 mW cm−2vs. 620 mW cm−2 at 600 °C).24
Various approaches, including infiltration and mechanical mixing, have been used to prepare composite cathodes. Many of the frequently studied cathodes have been used to infiltrate the porous electrolyte framework, or in an inverse way to enhance the oxygen surface exchange kinetics. For instance, LSCF was infiltrated into GDC framework,25,26 La0.4Ce0.6O1.8 with La0.4Sr0.6TiO3 into porous YSZ27 and SDC into LSM scaffold.28 Generally, the infiltration route needs multiple steps to achieve considerable loading, which is time-consuming and requires special care. Similar enhancements have been reported for mechanical mixing, including LnBaCo2O5+δ with SDC,20,21,24,29 LSCF with SDC30,31 and La0.8Sr1.2CoO4+δ with GDC.32 However, direct mechanical mixing is difficult to realize a homogenous distribution of two phases, which will limit the contact interface between two phases. Besides, the risk of chemical incompatibility between the two phases at high temperatures cannot be ignored for the infiltration and mechanical mixing modes.
From the electrode reaction kinetic point of view, a more intimate interface between the two phases is strongly desired for fast electrode reaction. The one-pot method for composite synthesis could generate thermodynamically stable and homogeneously distributed two or more phases in a simple one step. Especially, the one-pot method has great potential to provide plenty of heterostructure interface for composite cathodes, which has been reported to be capable of enhancing the oxygen reduction reaction (ORR) kinetics.33–36
In this work, with the aim of enhancing catalytic activity and reducing the TEC to match with the conventional electrolyte at the same time, the homogeneously distributed PBC–GDC composite cathode material was synthesized by a one-pot method. The GDC with cubic structure and low TEC was introduced to guide the oxygen-ion transport between PBC particles with different orientations, overcoming its anisotropic structure feature, and meanwhile, controlling the overall TEC value of the composite cathode. The possibly in situ formed intimate hetero-interfaces between PBC and GDC particles are expected to boost the charge transfer process and so enhance the ORR kinetics. We present the influence of the GDC content in dual-phase composite on the phase structure, thermal expansion coefficient, electrode reaction kinetics, and single-cell performance. The obtained results demonstrate that the incorporation of GDC reduces the average thermal expansion coefficient, enhances the oxygen surface exchange kinetics, decreases the polarization resistance and significantly improves the single-cell power density. The prepared PBC/GDC composite shows its appreciated potential as competitive cathode material for IT-SOFC.
2 Experimental
2.1 Material synthesis
PrBaCo2O5+δ–Gd0.1Ce0.9O2−δ (PBC–GDC) composite, GDC and La0.4Ce0.6O2−δ (LDC) powders were synthesized by citric–nitrate combustion process, where ethylene diamine tetraacetic acid (EDTA) and citric acid (CA) were used as complexing agents. PBC with different weight percentages of GDC are expressed as PBC–xGDC, x = 0, 10, 20, and 30 wt% (corresponding to respective volume ratios = 0, 9.7, 19.4 and 29.2 vol%). All nitrates came from Aladdin and other chemicals were purchased from Sinopharm Chemical Reagent. All the used lanthanide oxides are 4N and other reagents are AR grades. For the synthesis of PBC–GDC composite by the one-pot route, stoichiometric amounts of Pr6O11, Gd2O3, Ba(NO3)2, Co(NO3)3·6H2O, and Ce(NO3)3·6H2O were dissolved in dilute nitric acid, then EDTA and CA were added according to the molar ratio of 1![[thin space (1/6-em)]](https://www.rsc.org/images/entities/char_2009.gif) :
:![[thin space (1/6-em)]](https://www.rsc.org/images/entities/char_2009.gif) 2
2![[thin space (1/6-em)]](https://www.rsc.org/images/entities/char_2009.gif) :
:![[thin space (1/6-em)]](https://www.rsc.org/images/entities/char_2009.gif) 1 for EDTA, CA and total metal elements. The pH value was adjusted to 7 via ammonium hydroxide in the fume cupboard. After the solution was complexed, it turned into a gel, which was heated up in a drying oven to ensure self-combustion. The obtained black precursors were then ground and calcined in a muffle furnace at 1000 °C for 10 h to obtain PBC–GDC composite powders. With the same process, single-phase GDC and LDC powders were synthesized from the chemical combination of Gd2O3 and Ce(NO3)3·6H2O, and La2O3 and Ce(NO3)3·6H2O, respectively.
1 for EDTA, CA and total metal elements. The pH value was adjusted to 7 via ammonium hydroxide in the fume cupboard. After the solution was complexed, it turned into a gel, which was heated up in a drying oven to ensure self-combustion. The obtained black precursors were then ground and calcined in a muffle furnace at 1000 °C for 10 h to obtain PBC–GDC composite powders. With the same process, single-phase GDC and LDC powders were synthesized from the chemical combination of Gd2O3 and Ce(NO3)3·6H2O, and La2O3 and Ce(NO3)3·6H2O, respectively.
2.2 Structural characterization
The phase crystal structures of PBC–GDC composites were studied by room temperature X-ray diffraction (RT-XRD) technique using a Rigaku D/max-A (Japan) diffractometer with Cu Kα1 radiation. The phases of PBC–GDC composites were identified by software Jade6.5. High-temperature X-ray diffraction (HT-XRD) measurements were performed in the air on a Panalytical Empyrean diffractometer working with Anton Paar 1200N oven-chamber and PIXcel3D detector (United Kingdom). HT-XRD measurements were carried out in the temperature range from RT to 900 °C with a heating and cooling rate of 5 °C min−1. The angle range 2θ for the measurements was 10° to 110°, using a stepping of 0.013°. Rietveld refinement was performed on XRD patterns with GSAS/EXPGUI suite software. The micro-topography of the sample was studied using a scanning electron microscope (SEM, EVO-18, CARL ZEISS, Germany). The atomic-scale structure of the prepared PBC–GDC composite was examined using a high-resolution transmission electron microscope (HR-TEM, FEI/Tecnai G2 F20 S-TWIN TMP, USA).2.3 Electrical measurement
PBC–GDC dense bars were prepared for electrical conductivity measurements. The PBC–xGDC composite powders were mixed with a little 8 wt% polyvinyl alcohol solution as a binder, and cold-pressed under uniaxial pressure of 180 MPa to obtain green bars, which were then sintered at 1100 °C for 4 h to obtain dense bars. Electrical conductivity was measured using a DC four-terminal method in a temperature range of 200–900 °C under ambient atmosphere.The electrical conductivity relaxation (ECR) method was used to study the oxygen surface exchange kinetics. The bar's size for chemical surface exchange coefficient (kchem) measurement was 27.0 × 6.0 × 1.0 mm3. Electrical conductivity was collected with a high-precision digital multimeter (Keithley 2100, Tektronix, Inc., USA) interfaced with a program written using LabVIEW, in the temperature range between 650 °C and 850 °C at intervals of 100 °C. The measurement was carried out under 10 vol% O2/N2 gaseous mixture at a constant flow of 200 mL min−1, which was controlled with two mass flowmeters (MC-Gas Mass Flow Controllers, Alicat Scientific, Inc., USA). The data was collected until the electrical conductivity at each temperature was steady. Then, the atmosphere was switched to 20 vol% O2/N2 gaseous mixture suddenly, the variation of electrical conductivity over time was recorded until reaching equilibration. The kchem was acquired by solving the linear diffusion equation with absorbing boundary conditions based on Fick's second law.37,38
2.4 Cell fabrication and electrochemical characterization
PBC–xGDC/LSGM/PBC–xGDC and NiO–GDC/LDC/LSGM/PBC–xGDC configurations were constructed as symmetrical and single cells, respectively, for electrode polarization and cell power density measurements. La0.8Sr0.2Ga0.8Mg0.2O3−δ electrolyte powder (LSGM, Fuelcellmaterials) was pelletized and sintered at 1450 °C for 8 h. The densified pellets were sanded down to a thickness of 300 μm. The LDC layer was applied between Ni–GDC anode and LSGM electrolyte as a buffer layer to avoid their reactions. The buffer layer slurry was prepared by mixing the as-prepared LDC powder with terpineol solution of 6 wt% ethyl cellulose (6ECTS, Sinopharm Chemical Reagent) with a mass ratio of 1![[thin space (1/6-em)]](https://www.rsc.org/images/entities/char_2009.gif) :
:![[thin space (1/6-em)]](https://www.rsc.org/images/entities/char_2009.gif) 1. The obtained LDC slurry was uniformly screen-printed on one side of the LSGM electrolyte and then sintered at 1400 °C for 2 h. The NiO–GDC composite anode powder was prepared by ball-milling the mixture of NiO (AR, Aladdin), the as-prepared GDC, and polymethyl methacrylate (PMMA, Suzhou Soken Chemical) at a mass ratio of 60
1. The obtained LDC slurry was uniformly screen-printed on one side of the LSGM electrolyte and then sintered at 1400 °C for 2 h. The NiO–GDC composite anode powder was prepared by ball-milling the mixture of NiO (AR, Aladdin), the as-prepared GDC, and polymethyl methacrylate (PMMA, Suzhou Soken Chemical) at a mass ratio of 60![[thin space (1/6-em)]](https://www.rsc.org/images/entities/char_2009.gif) :
:![[thin space (1/6-em)]](https://www.rsc.org/images/entities/char_2009.gif) 40
40![[thin space (1/6-em)]](https://www.rsc.org/images/entities/char_2009.gif) :
:![[thin space (1/6-em)]](https://www.rsc.org/images/entities/char_2009.gif) 6 with alcohol for 12 h and then drying in air. The anode slurry was obtained by mixing anode powders with 6ECTS with a mass ratio of 100
6 with alcohol for 12 h and then drying in air. The anode slurry was obtained by mixing anode powders with 6ECTS with a mass ratio of 100![[thin space (1/6-em)]](https://www.rsc.org/images/entities/char_2009.gif) :
:![[thin space (1/6-em)]](https://www.rsc.org/images/entities/char_2009.gif) 50. The prepared anode slurry was uniformly screen-printed on the middle of the sintered buffer layer and then calcined at 1350 °C for 2 h. The cathode slurry was prepared by mixing PBC–xGDC powder with PMMA and 6ECTS with a mass ratio of 100
50. The prepared anode slurry was uniformly screen-printed on the middle of the sintered buffer layer and then calcined at 1350 °C for 2 h. The cathode slurry was prepared by mixing PBC–xGDC powder with PMMA and 6ECTS with a mass ratio of 100![[thin space (1/6-em)]](https://www.rsc.org/images/entities/char_2009.gif) :
:![[thin space (1/6-em)]](https://www.rsc.org/images/entities/char_2009.gif) 5
5![[thin space (1/6-em)]](https://www.rsc.org/images/entities/char_2009.gif) :
:![[thin space (1/6-em)]](https://www.rsc.org/images/entities/char_2009.gif) 50. The obtained cathode slurry was uniformly screen-printed on the other side of the LSGM electrolyte and then sintered at 1100 °C for 2 h. Silver paste (AG-I, Fuelcellmaterials), used as a current collector, was heated at 750 °C for 1 h after painting on both sides of a single cell.
50. The obtained cathode slurry was uniformly screen-printed on the other side of the LSGM electrolyte and then sintered at 1100 °C for 2 h. Silver paste (AG-I, Fuelcellmaterials), used as a current collector, was heated at 750 °C for 1 h after painting on both sides of a single cell.
The electrochemical impedance spectroscopy (EIS) measurements of the symmetrical cell were performed using a homemade electrochemical measurement platform at different temperatures (650 °C, 750 °C and 850 °C) and different oxygen partial pressures (pO2 = 0.02–1 atm) with a gas flow rate of 50 mL min−1 by Solartron 1260 combining with 1287 (Solartron Analytical, United Kingdom). The impedance was measured within the frequency range of 0.1 Hz to 1 MHz using a 10 mV potential amplitude. The EIS data were fitted with ZView software using equivalent circuit models. The distribution function of relaxation time analysis of impedance spectroscopy was carried out with DRTtools to distinguish involved different reactions processes.39–41
For the NiO–GDC/LDC/LSGM/PBC–xGDC single cell test, it was sealed at one end of alumina tube using high-temperature ceramic adhesives (Ceramabond 552-VFG, Aremco Products, Inc). The single-cell was tested at various temperatures between 650 and 850 °C at intervals of 50 °C. The anode side was swept with humidified hydrogen at a flow rate of 80 mL min−1, while the cathode side blew air with the same flow rate. The water vapor in hydrogen was introduced through a water bottle at room temperature (RT).
3 Results and discussion
3.1 Structure and thermal expansion
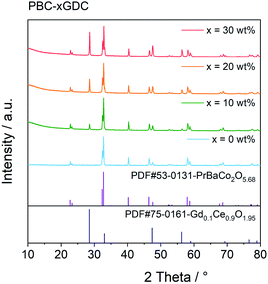
The PBC–GDC dual-phase composite was synthesized successfully using the one-pot method, as indicated from the XRD patterns shown in Fig. 1. The diffraction patterns are consistent with the standard JCPDS card no. 53-0131 (PBC) and no. 75-0161 (GDC). The PBC and GDC phases can be well refined with the tetragonal P4/mmm and cubic Fm![[3 with combining macron]](https://www.rsc.org/images/entities/char_0033_0304.gif) m space groups, respectively (Fig. S1†). Results of the Rietveld refinement data are listed in Table 1. The refined mass fraction of GDC is slightly less (approximate 4%) than the designed value. Considering that lanthanide elements show many similarities in outer electron, valence and ionic radius, etc., there may exist some mixing occupation of Pr and Gd in two phases. The exchange of Pr and Gd in the practical composite will produce a little bit more PBC and fewer GDC phases, due to the heavier atomic weight of Gd than that of Pr.
m space groups, respectively (Fig. S1†). Results of the Rietveld refinement data are listed in Table 1. The refined mass fraction of GDC is slightly less (approximate 4%) than the designed value. Considering that lanthanide elements show many similarities in outer electron, valence and ionic radius, etc., there may exist some mixing occupation of Pr and Gd in two phases. The exchange of Pr and Gd in the practical composite will produce a little bit more PBC and fewer GDC phases, due to the heavier atomic weight of Gd than that of Pr.
![[3 with combining macron]](https://www.rsc.org/images/entities/char_0033_0304.gif) m, respectivelya
m, respectivelya
| x | 0 wt% | 10 wt% | 20 wt% | 30 wt% |
|---|---|---|---|---|
| a Atoms are in the following Wyckoff positions, PBC: Pr, 1b (0, 0, 1/2); Ba, 1a (0, 0, 0); Co, 2h (1/2, 1/2, z); O1, 1c (1/2, 1/2, 0); O2, 4i (1/2, 0, z); O3, 1d (1/2, 1/2, 1/2); GDC: Gd/Ce, 4a (0, 0, 0); O, 8c (1/4, 1/4, 1/4). | ||||
| PBC phase | ||||
| a = b (Å) | 3.90095(5) | 3.89764(3) | 3.89943(3) | 3.89807(3) |
| c (Å) | 7.6453(2) | 7.6433(1) | 7.6360(1) | 7.6330(1) |
| V (Å3) | 116.342(4) | 116.113(2) | 116.110(2) | 115.983(2) |
![[thin space (1/6-em)]](https://www.rsc.org/images/entities/char_2009.gif) |
||||
| GDC phase | ||||
| a = b = c (Å) | — | 5.4075(1) | 5.41005(6) | 5.41238(4) |
| V (Å3) | — | 158.12(1) | 158.344(5) | 158.550(3) |
| χ 2 | 1.350 | 2.201 | 1.768 | 1.742 |
| R p (%) | 1.48 | 1.78 | 1.73 | 1.83 |
| R wp (%) | 1.94 | 2.53 | 2.36 | 2.47 |
| PBC wt% | 100 | 90.4(2) | 80.8(3) | 71.2(4) |
| GDC wt% | — | 9.6(2) | 19.2(3) | 28.8(4) |
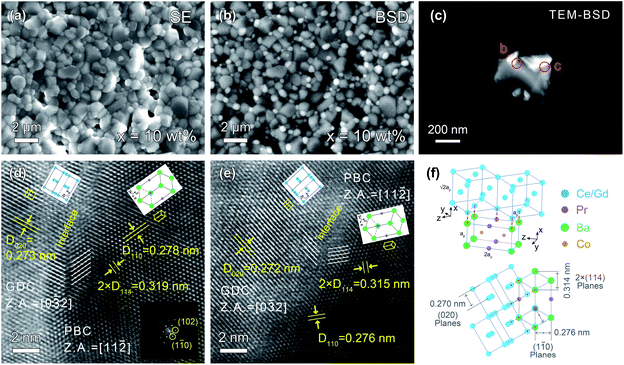
The back-scattering diffraction (BSD) images of SEM and TEM clearly show the existence of two different phases (Fig. 2a–c). The bright particles are the GDC phase since its relatively heavier average atomic mass, while the dark particles represent the PBC phase. The GDC particles are socketed on the surface of PBC substrates, indicating an intimate contact of PBC with GDC phases. To understand the interface structure details between PBC and GDC crystals, HR-TEM observation was performed. The d-spacings of lattice fringes of 0.278 and 0.276 nm were observed, as shown in Fig. 2d and e, respectively, which are close to the (1![[1 with combining macron]](https://www.rsc.org/images/entities/char_0031_0304.gif) 0) plane of P4/mmm symmetry PBC. Meanwhile, the d-spacings of 0.273 and 0.272 nm in the two images are attributable to the (020) plane of Fm
0) plane of P4/mmm symmetry PBC. Meanwhile, the d-spacings of 0.273 and 0.272 nm in the two images are attributable to the (020) plane of Fm![[3 with combining macron]](https://www.rsc.org/images/entities/char_0033_0304.gif) m symmetry GDC. They are consistent with the Rietveld refinements result of 0.276 and 0.270 nm for (1
m symmetry GDC. They are consistent with the Rietveld refinements result of 0.276 and 0.270 nm for (1![[1 with combining macron]](https://www.rsc.org/images/entities/char_0031_0304.gif) 0) plane of PBC perovskite and (020) plane of GDC fluorite, respectively (Table S1†). It is clearly observed that there exists a coherent interface structure between PBC and GDC phases.
0) plane of PBC perovskite and (020) plane of GDC fluorite, respectively (Table S1†). It is clearly observed that there exists a coherent interface structure between PBC and GDC phases.
To accommodate the lattice mismatch, some dislocations or distortion are generated at the interface, which is clearly observed in the blurred fringes (Fig. 2d and e). The corresponding zone axes (Z.A.) of PBC and GDC are aligned to [11![[2 with combining macron]](https://www.rsc.org/images/entities/char_0032_0304.gif) ] and [0
] and [0![[3 with combining macron]](https://www.rsc.org/images/entities/char_0033_0304.gif) 2], respectively. In consideration of the fringe spacing and zone axis, HR-TEM images reveal that the face-centered cubic GDC phase is connected with tetragonal PBC lattice paralleled to the c-axis with a 45° rotation around the y-axis. The schematic arrangements of the lattice cations are shown as an inset. A more detailed illustration of structure orientation and coherent lattice connection at the interface between PBC and GDC phases is given in Fig. 2f. The derived lattice spacing mismatch between PBC and GDC is about 2.2%. The coherent connection of the two independent phases should be beneficial to the transport of oxygen ions through the interface. Thus, an enhanced and stable electrochemical performance of GDC-decorated PBC cathode can be anticipative.
2], respectively. In consideration of the fringe spacing and zone axis, HR-TEM images reveal that the face-centered cubic GDC phase is connected with tetragonal PBC lattice paralleled to the c-axis with a 45° rotation around the y-axis. The schematic arrangements of the lattice cations are shown as an inset. A more detailed illustration of structure orientation and coherent lattice connection at the interface between PBC and GDC phases is given in Fig. 2f. The derived lattice spacing mismatch between PBC and GDC is about 2.2%. The coherent connection of the two independent phases should be beneficial to the transport of oxygen ions through the interface. Thus, an enhanced and stable electrochemical performance of GDC-decorated PBC cathode can be anticipative.
For the sake of understanding the thermal expansion behaviors of the two individual phases PBC and GDC with coherent interface connection in the composite, HT-XRD measurements were performed on four composite samples PBC–xGDC (x = 0, 10, 20, 30 wt%) (Fig. S2–S5†). With Rietveld refinement, the lattice parameters of each phase at different temperatures can be derived and the result revealed that the average lattice parameters of PBC decrease with increasing GDC addition, while the GDC parameter increases with PBC content. These variation trends are strongly related to the coherent connection between PBC and GDC lattice. As illustrated in Fig. 2f, at the connected interface, the lattice space of the (110) plane of PBC is slightly larger than that of the (020) plane of GDC, making the PBC lattice under weak compressive stress while the GDC slight tensive stress.
Bypassing the anisotropic lattice expansion issue of the PBC phase, the linear thermal expansions coefficients of both PBC and GDC phases were calculated from their lattice volume change based on the derived lattice parameters at different temperatures. The thermal expansion behavior of the PBC and GDC phases is severally shown in Fig. 3. Both phases show two-stage thermal expansion behavior. For the PBC phase, below 300 °C GDC addition has almost no influence on the thermal expansion of PBC. After that, the PBC phase exhibits a higher expansion rate and GDC addition suppresses the expansion slightly, which can be attributed to the compressive effect from coherently connected GDC phases. In the same way, for the GDC phase there is little influence of the PBC content on the thermal expansion below 500 °C. In 500–700 °C, the expansion curve of GDC becomes steeper and so shows a high TEC, probably caused by the chemical expansion due to the lattice oxygen release at high temperature. The PBC addition apparently promotes this process, making the expansion of GDC in this temperature range more significant. After that, the GDC in the three samples shows similar thermal expansion behavior. It is worth noting that TEC values (the slope of the curves) of the PBC and GDC phases tend to be very close in high-temperature range (700–900 °C) with GDC addition, suggesting a stable interface structure at high temperature. Based on the fitted slope, the derived linear TEC values of PBC–xGDC (x = 0, 10, 20 and 30 wt%) samples are listed in Table 2. With the increased content of GDC, the thermal expansions of each phase progressively decrease.
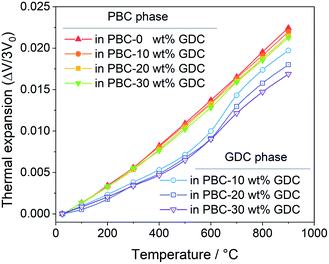 | ||
| Fig. 3 Temperature-dependent linear thermal expansion of PBC–xGDC (x = 0, 10, 20 and 30 wt%) samples obtained from Rietveld refinement results. | ||
| x | TEC × 106 K−1 | |||
|---|---|---|---|---|
| PBC (RT–300 °C) | PBC (300–900 °C) | GDC (RT–500 °C) | GDC (700–900 °C) | |
| 0 wt% | 20.5(6) | 28.1(3) | — | — |
| 10 wt% | 20.1(8) | 27.5(3) | 14.9(4) | 27.0(2) |
| 20 wt% | 19.4(5) | 27.1(2) | 14.4(8) | 25.2(2) |
| 30 wt% | 19.4(8) | 26.7(5) | 13.4(5) | 23.7(1) |
3.2 Electrical conductivity
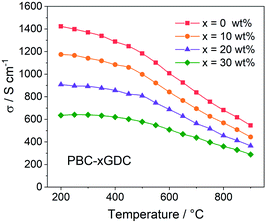
For electrical conductivity measurement, the PBC–xGDC composite bars are prepared by densifying the corresponding powders at 1100 °C for 4 h in air. XRD examination shows that after high temperature treatment, all samples showed good chemical stability without any detectable impurity (Fig. S6†). The relative densities of the bars were calculated to be more than 99% by Archimedes' method. SEM observations revealed that all sintered bars have dense microstructure (Fig. S7 and S8†).Fig. 4 shows the electrical conductivity as a function of temperature of PBC–xGDC (x = 0, 10, 20 and 30 wt%) samples in air. All the samples exhibit a similar tendency that the electrical conductivities of PBC–xGDC composites decrease with the increasing temperature. Concerning the different samples, the electrical conductivity reduces with the rising of GDC contents. The straight Arrhenius plot in the low-temperature range (200–450 °C) manifests that the electrical conduction of the percolated PBC phase is mainly related to the small polaron hopping mechanism (Fig. S9†). The calculated apparent activation energies (Ea) of the composite samples are 0.035, 0.038, 0.040, 0.044 eV for x = 0, 10, 20 and 30 wt%, respectively. The slight increase in Ea suggests that GDC incorporation hinders somewhat the conduction of electrons. Nevertheless, at a typical temperature of 800 °C, the electrical conductivities reach 682, 569, 456 and 360 S cm−1 for x = 0, 10, 20 and 30 wt%, respectively, which is sufficient for the SOFC cathode reaction requirement.
3.3 Electrical conductivity relaxation
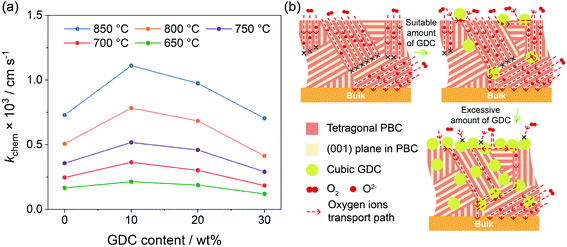
The electrical conductivity relaxation (ECR) technique, recording the transient conductivity with the oxygen partial pressure changing abruptly at a constant temperature, is widely applied to obtain detailed information about the oxygen surface exchange kinetics.42 The sample size and dimension ratio have a great influence on ECR measurement. Thus, we polished all samples to the same geometric shape after sintering. The size of the polished bars used for the ECR test was 27.0 × 6.0 × 1.0 mm3, which was suitable for the measurement of the chemical surface exchange coefficient (kchem).43 With the time dependence curves of the normalized conductivity upon shifting oxygen partial pressure from 0.1 to 0.2 atm (Fig. S10†), the kchem values of each sample at different temperatures can be obtained. As shown in Fig. 5a, the kchem increases with increasing temperature, indicating a thermal activation process of oxygen surface exchange kinetics. With respect to the GDC addition, the kchem values at all investigated temperatures reach the maximum at 10 wt% GDC addition. When more GDC is added, the kchem value gradually falls, even a little bit lower than that of the bare PBC when 30 wt% GDC was added. For instance, kchem values are 7.29 × 10⁻⁴, 1.11 × 10⁻³, 9.75 × 10⁻⁴ and 7.04 × 10⁻⁴ cm s−1 at 850 °C for x = 0, 10, 20 and 30 wt%, respectively.A dense bar with the required size was employed in this work to measure the oxygen surface exchange kinetics of the PBC–xGDC composite in order to get the working surface area easily. The oxygen incorporation process of the pure PBC only takes place on the PBC particle surface, i.e., the PBC-gas two-phase boundary (2PB). Meanwhile, the potential reaction sites of the PBC–xGDC composite can be extended to three different places: PBC-gas 2PB, GDC-gas 2PB and PBC-GDC-gas triple phase boundary. Although the minority GDC particles reduce some effective surface areas of the PBC particles for oxygen incorporation, the enhancement in surface exchange kinetics indicates that the oxygen incorporation reaction across the heterointerface is facile. In addition, the oxygen species formed on the PBC surface can transport to the bulk via cubic GDC lattice easily, due to its ability to isotropically store and release oxygen.
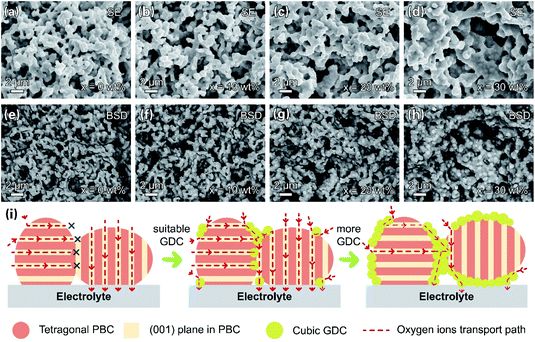
The path for oxygen transport in the PBC–GDC composite is schematically illustrated in Fig. 5b. It applies an extreme position status to explain the lattice oxygen transport path expressly. The lattice oxygen in tetragonal PBC can chiefly transport along the [PrOδ] layers.44 While, with the help of the cubic GDC phase, oxygen ions can travel from previous impossible directions. Furthermore, the heterostructure interface between PBC and GDC phases has great potential to enhance the ORR kinetics. Because the electrolyte phase GDC has a weaker activity to oxygen reduction than electrode PBC,45 when excessive GDC particles are incorporated, the superabundant GDC phase will form the GDC network, which blocks the oxygen surface exchange on the PBC phase.
3.4 Polarization resistance and oxygen reduction mechanism
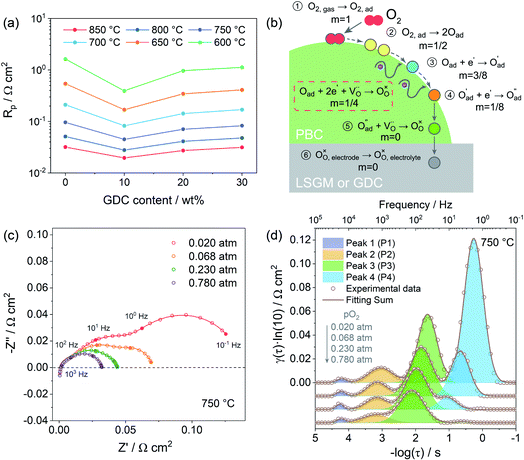
Due to the fast oxygen exchange process, EIS was employed to study the oxygen reaction reduction process of PBC–GDC composite cathode in static air using a symmetrical cell configuration (Fig. S11†). The EIS results of the PBC–xGDC composite cathodes at different temperatures reveal that the Rp is reduced significantly by adding 10 wt% GDC (Fig. 6a and Table S2†). For instance, at 750 °C, Rp is decreased from 0.096 Ω cm2 for the x = 0 wt% sample to 0.045 Ω cm2 for the x = 10 wt%. However, more GDC addition leads to enlarging Rp. With increased GDC, Rp of the x = 30 wt% sample reaches 0.083 Ω cm2 but it is still lower than that of bare PBC. At 600 °C, the PBC–10 wt% GDC electrode shows an Rp of 0.394 Ω cm2, which is about 78% lower than that of the bare PBC electrode under the same situations. With the Rp values at different temperatures and by fitting the linear dependence of the natural logarithm of 1/Rpversus 1000/T, the Ea of cathode reactions can be derived (Fig. S12†). As expected, the sample x = 10 wt% exhibits the lowest Ea value, suggesting accelerated electrode reaction kinetics.To investigate the detailed kinetics of the PBC–GDC composite cathode, the oxygen partial pressure dependence of the electrode AC impedance was investigated on the best performing sample x = 10 wt%. The relationship between the polarization resistance and oxygen partial pressure can be described as Rp = k(pO2)−m, where parameter m is used for differentiating the sub-reaction.46–49 The entire oxygen reduction reaction can be summarized as the following eqn (1),
 | (1) |
 , m = 3/8. The fourth reaction runs on behalf of the process of partially reduced oxygen atoms catching another electron,
  , m = 1/8. The fifth reaction stands for adsorbed oxygen ions combined with oxygen vacancies in the lattice,
  , m = 0. Thus, the m value for the complete reduction of oxygen atoms (charge transfer process) equals 1/4, calculated from the average of the above three processes. The sixth reaction represents oxygen ions transport at the interface between the electrode and electrolyte,
  , m = 0. Generally, not all steps mentioned above will be the rate-determining steps for one type of material, some of which are too fast to be visible. The characteristic frequency of each sub-reaction is different but close at times, resulting in overlapping of the peaks.
The EIS of PBC–10 wt% GDC electrode under various oxygen partial pressures was evaluated at 850, 750, and 650 °C. Only typical data of EIS under different oxygen partial pressures (0.020, 0.068, 0.230, and 0.780 atm) are presented here for convenient observation (Fig. 6c and S13a, b†). The four groups of oxygen partial pressure are equidistant after logarithm. Frankly, vagueness in the choice of the equivalent circuit is one of the shortcomings in fitting Nyquist plots, particularly when the corresponding frequencies of separate reactions are overlapping, such as at low temperature and/or high oxygen partial pressure.
To overcome this drawback, the distribution of relaxation time (DRT) analysis, a notably high-resolution tool for deconvoluting intricate impedance data to segregate pivotal steps, was employed (Fig. S14†). The corresponding DRT spectra under the same four sets of oxygen partial pressure as mentioned above are also given for a clear observation (Fig. 6d and S13c, d†). The DRT spectra show the γ(τ), the DRT function at the relaxation time τ, versus the logarithm for the relaxation time τ, which is calculated as a function of the frequency f, i.e., τ = 1/f. Each peak in DRT spectra represents a sub-reaction in oxygen reduction. The integral area under the peak presents the polarization resistance of the corresponding sub-reaction. The relaxation time τ of the peak signifies the characteristic frequency of the corresponding sub-reaction. The obtained DRT spectra at all temperatures are well fitted with four distinct peaks (denoted as P1, P2, P3 and P4, from high frequency to low frequency in order). The characteristic frequencies of P1, P2, P3 and P4 are about tens of thousands Hz, thousands Hz, hundreds Hz and dozens, even several Hz, respectively. It seems that all peaks get smaller and shift to a higher frequency as the oxygen partial pressure rises, which means less relaxation time and more rapid kinetics.
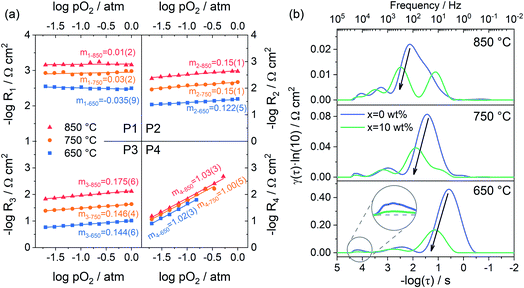
Fig. 7a shows the dependence of integral area under each peak on oxygen partial pressure at 850, 750 and 650 °C. The corresponding reaction orders m are indicated in the inset. The m values of P1 are around 0, which means that P1 is independent of oxygen partial pressure. Considering the characteristic frequency and corresponding m values, P1 should be the process of oxygen ions transport across the interface between the electrode and electrolyte. The reaction order m for P2 and P3 are much closer to 1/8, which reflects that they are similar sub-reactions, relating to the partially-reduced oxygen atoms receiving another one electron. Since the reaction order m of P2 and P3 is slightly higher than 1/8, the process may include the reaction of adsorbed oxygen atoms capturing one electron (corresponding m = 3/8). The reaction order m of P4 is approximately 1, which is probably connected with the adsorption of gaseous oxygen on the electrode surface. Obviously, the resistance corresponding to P1 is very small, at all temperatures and oxygen partial pressures, demonstrating the good contact interface and fast oxygen ion transport between the PBC–GDC electrode and LSGM electrolyte. The oxygen partial pressure has a significant influence on the electrode reaction kinetics. High oxygen partial pressure decreases the electrode reaction resistance and accelerates the electrode reaction speed. When the oxygen partial pressure is close to the air condition (0.230 atm), the medium frequency arcs (P2 + P3) are larger than others for all investigated temperatures (Fig. 6d and S13c, d†), which indicates that the charge transfer process is the rate-determining step for the PBC–10 wt% GDC cathode at the working environment.
With the understanding of the meaning of each peak in DRT spectra, we can identify which reaction step is promoted with the addition of GDC particles for the oxygen reduction reaction at the cathode. Fig. 7b depicts the DRT spectra of PBC–xGDC (x = 0 and 10 wt%) electrodes at different temperatures, which is transformed from EIS data (Fig. S11†). Compared with the peak at low frequencies, the influences of GDC addition on other peaks are very limited. The peak with a characteristic frequency around hundreds of Hz falls sharply, which means 10 wt% GDC boosts the charge transfer reaction remarkably. However, more GDC addition causes an increase in charge transfer resistance. Nevertheless, it is still smaller than pure PBC cathode (Fig. S15†).
The microstructures of the PBC–GDC composite cathode were inspected under SEM. Fig. 8a–h display SEM-secondary electron SE and SEM-BSD images. The two kinds of particles can be readily distinguished. The bright particle is GDC because of the higher relative atomic mass of cerium, while the dark one is PBC. The two phases are uniform distribution, without any abnormal grain growth and/or undesired crack. The GDC particles anchor on the PBC particle surface, forming intimate contact. GDC particles expand appreciably with the increase in GDC content. Fig. 8i depicts the path for the oxygen transport in the PBC–GDC composite cathode schematically. An extreme position state is used to explain the transport path of the lattice oxygen. The cubic GDC phase can guide the oxygen ion transport between the PBC particles with different orientations and so enhance the electrode reaction kinetics. Besides, the coherent PrBaCo2O5+δ/Gd0.1Ce1.9O2−δ heterointerface can boost the oxygen ion transport across. However, excessive GDC addition would prevent the direct contact of highly active PBC with oxygen and thus reduce the active site of the cathode, owing to the poor surface oxygen exchange ability.
3.5 Single-cell performance
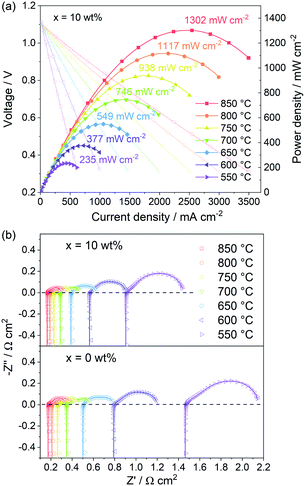
The PBC–10 wt% GDC cathode exhibits a much better output performance compared with the undecorated PBC cathode, due to the fast oxygen surface exchange kinetics and low polarization resistance. Fig. 9a shows the I–V and power density curves of the electrolyte-supported cell with cell configuration of Ni–GDC/LDC/LSGM (300 μm)/PBC–10 wt% GDC in a temperature range of 550–850 °C. The open-circuit voltage is around 1.1 V, close to the theoretical values for wet hydrogen (3 vol% H2O) fuel, which indicates dense electrolytes with good gas tightness and excellent cell sealing. The recorded straight I–V curves show no influence of activation polarization and concentration polarization, hinting at the great catalytic activity and sufficient porosity of both electrodes. The maximum power density (MPD) value of the cell with PBC–10 wt% GDC cathode reaches 1302 mW cm−2 at 850 °C. The addition of GDC presents a more efficient effect on the catalytic activity of PBC–GDC composite cathode at low temperatures. The MPD values increase memorably after adding GDC, even 1.5 times higher than that without GDC at 550 °C (Fig. S16†). The increased oxygen surface exchange coefficient and thus the decreased polarization resistance should be responsible for the remarkably enhanced low-temperature electrochemical performance.EIS data of single cells with PBC–10 wt% GDC and pure PBC as a cathode were recorded under open-circuit conditions (Fig. 9b, Table S3†). It is apparent that the addition of GDC helps reduce the polarization resistance, e.g., 0.550 and 0.698 Ω cm2 at 550 °C for PBC–10 wt% GDC and PBC cathode, respectively. Meanwhile, Ro values of the single-cell for PBC–10 wt% GDC cathode are always smaller than that for the PBC cathode, such as 0.902 and 1.461 Ω cm2 at 550 °C, respectively. In view of the same anode, electrolyte and heating regime, the differences in Rp and Ro are mainly attributed to the cathode side. The enhanced electrochemical catalytic activity and the reduced TEC of PBC–10 wt% GDC composite are responsible for the decreased Rp and Ro, respectively. These results demonstrate that GDC plays a remarkable role in enhancing the electrochemical performance of the single cell with the PBC–GDC composite cathode.
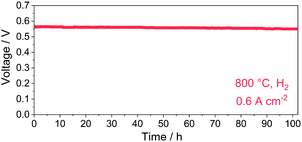
The cell voltage dependency on time in a constant current density mode (0.6 A cm−2, 800 °C) was recorded to evaluate the durability of the PBC–10 wt% GDC cathode (Fig. 10). The cell voltage was stabilized at ∼0.56 V for over 100 h with hydrogen as fuel. No obvious degradation of cell voltage was noted during the operation in hydrogen, indicating good long-term stability of the prepared PBC–10 wt% GDC cathode.
4 Conclusions
The composite PrBaCo2O5+δ–xGd0.1Ce0.9O2−δ (x = 0, 10, 20 and 30 wt%) was successfully synthesized by the one-pot method. The two phases distribute uniformly and there exists a coherent interface structure between PBC and GDC particles, which is beneficial to the TEC modulation of the composite cathode. The introduction of the cubic GDC phase can guide the oxygen transport among PBC particles with different orientations. The oxygen surface exchange coefficient significantly increases to about 1.5 times compared to pure PBC when 10 wt% GDC is used. The EIS data of symmetrical cells manifests that the additional GDC dramatically facilitates the electrochemical catalytic activity for oxygen reduction, even though the GDC content is up to 30 wt%. The best dual-phase cathode, PBC with 10 wt% GDC exhibits polarization resistance as low as 0.394 Ω cm2 at 600 °C, which is about 78% lower than that of the bare PBC electrode under the same situations. The DRT analysis of polarization resistance under different partial oxygen pressures indicated that there are four sub-reactions in the oxygen reduction reaction for this composite cathode, and the adherent GDC mainly boosts the charge transfer sub-reaction. The PBC–10 wt% GDC cathode yields a higher maximum power density of 1302 mW cm−2 at 850 °C for the LSGM electrolyte-supported cell. It even goes so far as to 1.5 times compared to the bare PBC cathode at 550 °C. The excellent electrochemical characteristics of the PBC–GDC composite system originate from the existence of cubic GDC with isotropic oxygen transport feature, heterogeneous interface with a coherent structure, and better thermomechanical compatibility to the electrolyte. Besides, no obvious degradation was observed after the cell underwent a long-term durability test with hydrogen as fuel. These results demonstrate that the PBC–GDC composite with heterostructure can be considered as a candidate cathode material for intermediate/low temperate solid oxide fuel cells.Author contributions
Yang Zhang: Investigation; Methodology and Writing – original draft; Leyu Shen: Investigation and Formal analysis; Yuhao Wang: Software; Zhihong Du: Methodology; Binze Zhang: Validation; Francesco Ciucci: Writing – review & editing; Hailei Zhao: Conceptualization, Funding acquisition and Writing – review & editing.Conflicts of interest
There are no conflicts to declare.Acknowledgements
The authors acknowledge with gratitude the financial support from the National Key R&D Program of China (2018YFB1502202 and 2018YFB0905600) and National Natural Science Foundation of China (51634003 and 52074023).Notes and references
- B. C. H. Steele and A. Heinzel, Nature, 2001, 414, 345–352 CrossRef CAS PubMed
.
- D. J. L. Brett, A. Atkinson, N. P. Brandon and S. J. Skinner, Chem. Soc. Rev., 2008, 37, 1568–1578 RSC
.
- Z. Shao and S. M. Haile, Nature, 2004, 431, 170–173 CrossRef CAS PubMed
.
- E. D. Wachsman and K. T. Lee, Science, 2011, 334, 935–939 CrossRef CAS PubMed
.
- G. Kim, S. Wang, A. J. Jacobson, L. Reimus, P. Brodersen and C. A. Mims, J. Mater. Chem., 2007, 17, 2500–2505 RSC
.
- K. Zhang, L. Ge, R. Ran, Z. Shao and S. Liu, Acta Mater., 2008, 56, 4876–4889 CrossRef CAS
.
- D. Chen, R. Ran, K. Zhang, J. Wang and Z. Shao, J. Power Sources, 2009, 188, 96–105 CrossRef CAS
.
- Y. Leng, S. H. Chan and Q. Liu, Int. J. Hydrogen Energy, 2008, 33, 3808–3817 CrossRef CAS
.
- S. H. Yang, K. H. Kim, H. H. Yoon, W. J. Kim and H. W. Choi, Mol. Cryst. Liq. Cryst., 2011, 539, 50–57 CAS
.
- A. A. Taskin, A. N. Lavrov and Y. Ando, Prog. Solid State Chem., 2007, 35, 481–490 CrossRef CAS
.
- J.-H. Kim and A. Manthiram, J. Mater. Chem. A, 2015, 3, 24195–24210 RSC
.
- C. Leitenburg, Chem. Commun., 1998, 1897–1898 Search PubMed
.
- N. V. Skorodumova, S. I. Simak, B. I. Lundqvist, I. A. Abrikosov and B. Johansson, Phys. Rev. Lett., 2002, 89, 166601 CrossRef CAS PubMed
.
- Z. A. Feng, F. El Gabaly, X. Ye, Z.-X. Shen and W. C. Chueh, Nat. Commun., 2014, 5, 1–9 Search PubMed
.
- M. Mogensen, N. M. Sammes and G. A. Tompsett, Solid State Ionics, 2000, 129, 63–94 CrossRef CAS
.
- Y. Wan, Y. Xing, Y. Li, D. Huan and C. Xia, J. Power Sources, 2018, 402, 363–372 CrossRef CAS
.
- T. V. Aksenova, L. Y. Gavrilova, A. A. Yaremchenko, V. A. Cherepanov and V. V. Kharton, Mater. Res. Bull., 2010, 45, 1288–1292 CrossRef CAS
.
- F. Tietz, Ionics, 1999, 5, 129–139 CrossRef CAS
.
- H. Gu, H. Chen, L. Gao and L. Guo, Electrochim. Acta, 2009, 54, 7094–7098 CrossRef CAS
.
- Q. Zhou, F. Wang, Y. Shen and T. He, J. Power Sources, 2010, 195, 2174–2181 CrossRef CAS
.
- C. Zhu, X. Liu, C. Yi, L. Pei, D. Wang, D. Yan, K. Yao, T. Lü and W. Su, J. Power Sources, 2010, 195, 3504–3507 CrossRef CAS
.
- Y. Wan, B. Hu and C. Xia, Electrochim. Acta, 2017, 252, 171–179 CrossRef CAS
.
- Y. Wang, H. Zhang, F. Chen and C. Xia, J. Power Sources, 2012, 203, 34–41 CrossRef CAS
.
- D. Chen, R. Ran and Z. Shao, J. Power Sources, 2010, 195, 7187–7195 CrossRef CAS
.
- M. Shah and S. A. Barnett, Solid State Ionics, 2008, 179, 2059–2064 CrossRef CAS
.
- Y. Liu, F. Wang, B. Chi, J. Pu and L. Jian, J. Alloys Compd., 2013, 578, 37–43 CrossRef CAS
.
- M. R. Afshar, N. Yan, B. Zahiri, D. Mitlin, K. T. Chuang and J.-L. Luo, J. Power Sources, 2015, 274, 211–218 CrossRef CAS
.
- B. Wei, Z. Lü, X. Huang, M. Liu, K. Chen and W. Su, J. Power Sources, 2007, 167, 58–63 CrossRef CAS
.
- L.-N. Xia, J. You, Z.-P. He, X.-W. Huang and Y. Yu, Int. J. Hydrogen Energy, 2016, 41, 1176–1186 CrossRef CAS
.
- B. Hu, Y. Wang and C. Xia, J. Electrochem. Soc., 2014, 162, F33 CrossRef
.
- B. Hu, Y. Wang and C. Xia, J. Power Sources, 2014, 269, 180–188 CrossRef CAS
.
- J. Zhou, G. Chen, K. Wu and Y. Cheng, J. Power Sources, 2013, 232, 332–337 CrossRef CAS
.
- W. Ma, J. J. Kim, N. Tsvetkov, T. Daio, Y. Kuru, Z. Cai, Y. Chen, K. Sasaki, H. L. Tuller and B. Yildiz, J. Mater. Chem. A, 2015, 3, 207–219 RSC
.
- Y. Zheng, Y. Li, T. Wu, W. Zhang, J. Zhu, Z. Li, J. Chen, B. Yu, J. Wang and J. Zhang, Nano Energy, 2018, 51, 711–720 CrossRef CAS
.
- Z. Yue, L. Jiang, N. Ai, C. Guan, S. P. Jiang, X. Sun, W. D. A. Rickard, X. Wang, Y. Shao and K. Chen, Electrochim. Acta, 2022, 403, 139673 CrossRef CAS
.
- S. He, M. Li, J. Hui and X. Yue, Appl. Catal., B, 2021, 298, 120588 CrossRef CAS
.
- I. Yasuda and T. Hikita, J. Electrochem. Soc., 1994, 141, 1268 CrossRef CAS
.
- J. A. Lane and J. A. Kilner, Solid State Ionics, 2000, 136, 997–1001 CrossRef
.
- T. H. Wan, M. Saccoccio, C. Chen and F. Ciucci, Electrochim. Acta, 2015, 184, 483–499 CrossRef CAS
.
- M. B. Effat and F. Ciucci, Electrochim. Acta, 2017, 247, 1117–1129 CrossRef CAS
.
- F. Ciucci and C. Chen, Electrochim. Acta, 2015, 167, 439–454 CrossRef CAS
.
- Z. Li and R. Haugsrud, Solid State Ionics, 2012, 206, 67–71 CrossRef CAS
.
- C. B. Gopal and S. M. Haile, J. Mater. Chem. A, 2014, 2, 2405–2417 RSC
.
- Y. Gao, D. Chen, C. Chen, Z. Shao and F. Ciucci, J. Power Sources, 2015, 278, 623–629 CrossRef CAS
.
- E. N. Armstrong, K. L. Duncan, D. J. Oh, J. F. Weaver and E. D. Wachsman, J. Electrochem. Soc., 2011, 158, B492 CrossRef CAS
.
- F. H. Van Heuveln and H. J. M. Bouwmeester, J. Electrochem. Soc., 1997, 144, 134 CrossRef CAS
.
- J. D. Kim, G. D. Kim, J. W. Moon, Y. i. Park, W. H. Lee, K. Kobayashi, M. Nagai and C. E. Kim, Solid State Ionics, 2001, 143, 379–389 CrossRef CAS
.
- M. Li, Y. Ren, Z. Zhu, S. Zhu, F. Chen, Y. Zhang and C. Xia, Electrochim. Acta, 2016, 191, 651–660 CrossRef CAS
.
- C. Zhang and K. Huang, J. Power Sources, 2017, 342, 419–426 CrossRef CAS
.
Footnote |
| † Electronic supplementary information (ESI) available. See DOI: 10.1039/d1ta09615j |
| This journal is © The Royal Society of Chemistry 2022 |

