 Open Access Article
Creative Commons Attribution 3.0 Unported Licence
PEDOT percolation networks for reversible chemiresistive sensing of NO2
Merel J. Lefferts *,
Ben I. Armitage
 ,
Krishnan Murugappan†
 and
Martin R. Castell
Department of Materials, University of Oxford, Parks Road, Oxford, OX1 3PH, UK. E-mail: merel.lefferts@materials.ox.ac.uk
First published on 28th June 2021
Abstract
Detection of NO2 plays an important role in various safety applications. However, sensitive and reversible sensing of NO2 remains a challenge. Here we demonstrate the use of poly(3,4-ethylenedioxythiophene) (PEDOT) conducting polymer percolation networks for chemiresistive sensing of NO2. By adjusting the electrochemical polymerisation and doping conditions of the polymer, we show control over the relative contributions of oxidised and over-oxidised PEDOT to the sensing behaviour. Reversible NO2 sensors using only PEDOT as the sensor material are demonstrated. By operating the sensor near the electrical percolation threshold, a higher sensitivity is achieved compared to more traditional thin film based chemiresistive sensors. A limit of detection of 907 ± 102 ppb was achieved.
Introduction
NO2 is a hazardous gas which is present in the atmosphere due to natural sources as well as combustion of fossil fuels and industrial activity. Accurate detection of NO2 is important for various safety applications. The World Health Organization 1 hour guideline of maximum exposure is 100 ppb and their annual average air quality guideline is 20 ppb.1Hand-held NO2 detectors are commercially available at relatively low cost. Typically such hand-held devices operate in the 1–100 ppm range. This makes them suitable for applications in industry where they are used to signal imminent danger. However, for other applications and long term monitoring more sensitive sensing solutions with lower limits of detection are required.
To create highly sensitive small scale sensors, modern small scale materials hold significant potential. For example, one study reported highly sensitive NO2 sensors made using graphene,2 and another study made use of ZnO nanorods modified with SnO2 nanoparticles.3 Conducting polymers are an especially interesting class of nanomaterials for gas sensing because of the large range of materials available. Conducting polymers are relatively cheap and straightforward to process, and can be used in devices where the sensor operates at room temperature.
Conducting polymer based chemiresistive sensors using poly(3,4-ethylenedioxythiophene) (PEDOT) composites or nanomaterials for NO2 detection have been widely studied. Examples include PEDOT-PSS/TiO2 nanofibres,4 a WO3-PEDOT:PSS nanocomposite5 and a PEDOT–graphene composite.6 A study describing a chemiresistive sensor based on only PEDOT reports an irreversible sensor response. Although, as the authors suggest, their sensor can be used as a cumulative sensor, a reversible system would be preferable.7
Here we demonstrate sensitive and reversible sensing behaviour using only PEDOT as the sensor material. By adjusting the electrochemical polymerisation conditions, the relative contributions of oxidised and over-oxidised PEDOT to the sensing behaviour are controlled, and an optimised reversible sensor is created. Furthermore, we demonstrate a significantly improved sensitivity by using percolation networks of PEDOT instead of more traditional PEDOT thin films, as previously demonstrated for polypyrrole (PPy) percolation networks.8,9
Materials and methods
Pt interdigitated electrodes (IDEs) consisting of 180 pairs of 5 μm wide electrodes with a 5 μm electrode separation on glass substrates (Micrux, Spain) were used after cleaning with concentrated nitric acid (90%) followed by sonication in ethanol (99.8%), methanol (99.9%), and acetone (99.8%). All solvents were purchased from Sigma-Aldrich (UK).Poly-(3,4-ethylenedioxythiophene) (PEDOT) was grown on the IDEs using oxidative electrochemical polymerisation from a solution of 0.01 M 3,4-ethylenedioxythiophene (EDOT, Sigma-Aldrich) and 0.1 M lithium perchlorate (LiClO4, Sigma-Aldrich), in acetonitrile (99.8%, Sigma-Aldrich) using an Autolab PGSTAT204 potentiostat (Metrohom, Switzerland) and a PC equipped with Nova 11.1 software.10 The two connection pads of the IDEs were connected and together used as the working electrode. A Pt coil (BASi, USA) was used as the counter electrode and an Ag/AgCl (CH Instruments, USA) reference electrode was used. Using chronoamperometry, the potential between the working electrode and the reference electrode was kept at 1.3 V for 1–10 s.
After PEDOT growth, the samples were p-doped with perchlorate by placing them in a monomerless solution of 0.1 M LiClO4 in acetonitrile. The samples were p-doped for 60 s at 0.1–1.3 V. After doping, the sensors were rinsed with acetonitrile and left to dry in air. The same set-up with a monomerless solution was also used to obtain cyclic voltammograms of the PEDOT layers.
The sensors were tested in a custom made sensing chamber at atmospheric pressure and at room temperature. NO2 (10 ppm in N2) and N2 (for further dilution) cylinders were supplied by BOC (UK). The sensors were placed in the sensing chamber and left under N2 flow for 20 minutes to remove any impurities from the chamber or the sensing layer prior to the experiments. Next, 1–8 ppm NO2 was introduced into the chamber for 5 minutes. The concentrations were calculated from the relative flow rates of the two mass flow controllers (Alicat, USA) and the gas was mixed at a T-joint before entering the sensing chamber. A constant total flow rate of 500 sccm was maintained throughout the experiments using mass flow controllers. After exposure to NO2 the sensor was left under N2 flow for 15 minutes before the next exposure. Electrical connections from the sensor to a multimeter and a PC equipped with BenchVue software outside the sensing chamber allowed for continuous monitoring of the changes in the resistance of the PEDOT layer. During the sensing experiments a potential of 0.6 V was applied across the sensor electrodes and the current was measured, allowing the DC resistance to be determined.
The sensors were imaged using a Zeiss Merlin scanning electron microscope (SEM) at an accelerating voltage of 3 kV.
Results and discussion
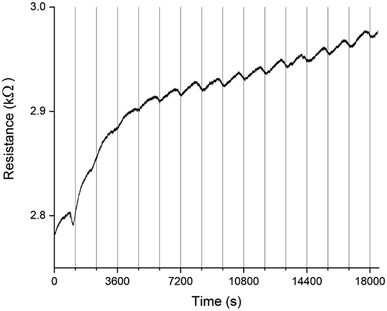
A PEDOT based sensor was created by polymerisation at 1.3 V for 5 s, followed by doping at 1.3 V for 60 s, and had a starting resistance of 2.8 kΩ. The sensor was exposed 15 times to 8 ppm NO2 for 5 minutes, with a 15 minute recovery time under N2 flow between exposures (Fig. 1). The sensor response shown in Fig. 1 is used to define the challenge that will be resolved in the remainder of this paper. The first 3 exposures result in irreversible increases in resistance, but later exposures result in reversible decreases in resistance. These first 3 sensor responses are not what one might at first expect for the interaction of NO2 with PEDOT. One should expect to see a reversible decrease in resistance, rather than an irreversible increase. NO2 is a strong oxidiser and the PEDOT is p-doped.11 Therefore, the adsorption of NO2 should cause an increase in the majority charge carrier density of PEDOT, decreasing the resistance. This effect should be reversed when the NO2 desorbs from the PEDOT. However, our sensors and also those of other researchers7 do not show this behaviour. Instead, an irreversible increase in resistance is described in the literature and observed for the first 3 exposures in Fig. 1, which has been attributed to over-oxidation of PEDOT. Over-oxidation is a process in which the polymer is irreversibly damaged, causing an irreversible increase in resistance. It is thought that over-oxidation leads to a decrease in conjugation length of the delocalised π-electrons or a shortening of the polymer chains themselves.12 PEDOT films also undergo structural changes, such as increased crystallinity, upon over-oxidation.13,14 Because the electrochemical polymerisation potential of PEDOT is close to its over-oxidation potential, part of the polymer layer is over-oxidised during the polymerisation and doping processes. The interaction of the NO2 with the over-oxidised PEDOT causes a disruption in the conjugation of the polymer. Based on the literature, we propose a mechanism for the oxidation and eventual over-oxidation of PEDOT during the polymerisation and doping processes in the presence on LiClO4 (Fig. 2).11,15,16 This mechanism shows multiple over-oxidations steps. First oxygen binds to the sulphur atom in the thiophene ring. This is followed by the formation of lithium sulphate, eliminating the sulphur atom and opening the thiophene ring.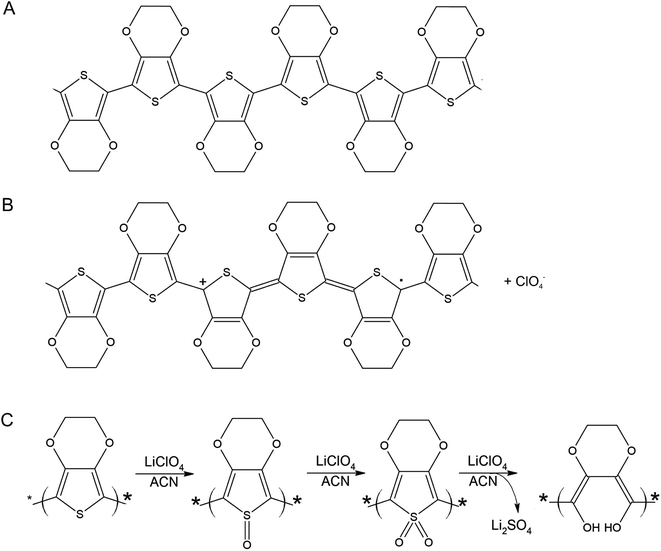 | ||
| Fig. 2 Molecular structure of PEDOT (A), oxidised PEDOT (B), and (C) a schematic of the proposed over-oxidation process of PEDOT with LiClO4 in acetonitrile (ACN) in 3 consecutive steps, adapted from Fan et al.15 An interaction of NO2 with oxidised PEDOT (B) is a reversible adsorption process, resulting in a reversible decrease in resistance. An interaction of NO2 with one of the stages of over-oxidised PEDOT (C) causes the PEDOT to move irreversibly to the next stage of over-oxidation, finally resulting in a disruption of conjugation and an irreversible increase in resistance. | ||
The sensor responses in Fig. 1 suggest that when a PEDOT film or percolation network is used as a chemiresistive gas sensor, even if the NO2 reacts with oxidised and over-oxidised PEDOT simultaneously, at first the reaction with the over-oxidised PEDOT dominates the sensor response. A reaction between over-oxidised PEDOT and NO2 causes the PEDOT to be over-oxidised even further following a similar mechanism as the over-oxidation in the presence of LiClO4 during electrochemical polymerisation (Fig. 2), eventually breaking the conjugation of the polymer chain. Therefore, both the preparation of the PEDOT layer and the exposure of the PEDOT layer to NO2 contribute to its over-oxidation. However, because the reaction between over-oxidised PEDOT and NO2 is an irreversible reaction, the number of potential reaction sites for this reaction decreases over time. On the other hand, the reaction with the oxidised PEDOT is reversible and, while there is a dynamic equilibrium of NO2 adsorbing and desorbing, the total number of potential reaction sites remains the same over time. This means that as time progresses the fraction of the available NO2 molecules that reacts with oxidised PEDOT instead of over-oxidised PEDOT increases and the reversible decrease in resistance becomes the dominant sensor response. This shift towards the reversible response also suggests that NO2 is not a strong enough oxidiser to convert the oxidised PEDOT into over-oxidised PEDOT. The example in Fig. 1 demonstrates that once the over-oxidised PEDOT has reacted with NO2 a stable and reversible sensor with good repeatability is obtained.
Because for sensing applications reversible behaviour is preferred, some research has been directed towards finding ways around the issues associated with over-oxidation. For example the use of composites17 or control over the pH of the system18 is used to protect the PEDOT from over-oxidation. The remainder of this paper is focused on controlling the balance between oxidised and over-oxidised PEDOT through changes to the sensor production processing steps, making it possible to access reversible and irreversible sensor behaviour in a controlled manner and without the use of additional materials.
There are several factors that can contribute to oxidation and over-oxidation of a conductive polymer layer. The electrochemical conditions of both the electrochemical polymerisation and doping processes will be our focus. It is known that polymerisation, p-doping, and over-oxidation can all occur at the same time and that there is significant overlap between the potential range for over-oxidation and the potential range for reversible oxidation and reduction of PEDOT.19,20 It is also known that exposure to light and oxygen in ambient conditions can, by causing over-oxidation, contribute to the aging of the polymer material.21 In this study the aging effects are minimized by using freshly prepared PEDOT sensors at all times.
PEDOT layer thickness and (over-)oxidation
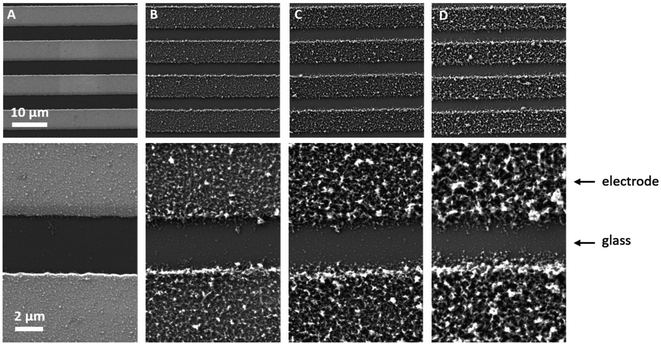
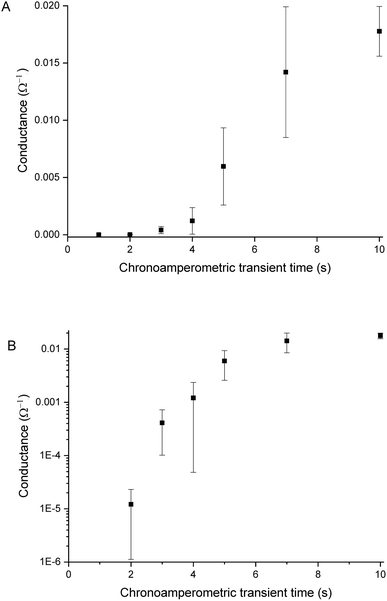
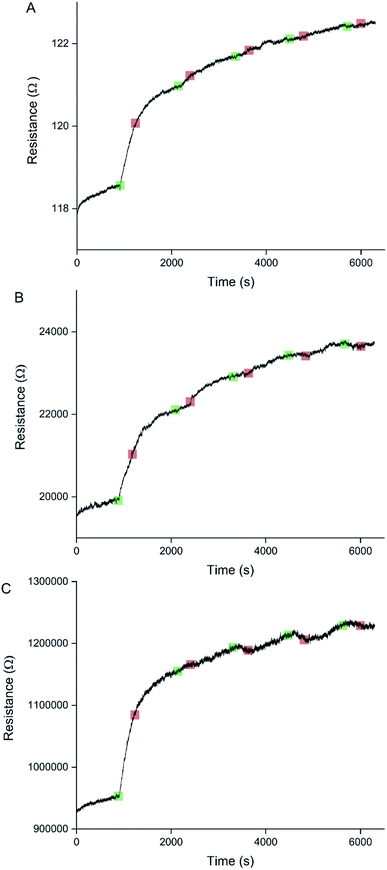
Sensors with various PEDOT coverages were grown on the Pt IDEs using chronoamperometry for 1–10 s. All of these sensors were doped at 1.3 V for 60 s in a monomerless solution. As expected, SEM images show that the longer chronoamperometric transient times resulted in more PEDOT being grown on the sample (Fig. 3). Initially the polymer grows on the Pt electrodes. Then, for longer transient times, more polymer is grown on the electrodes and polymer starts to grow on the insulating glass substrate between the electrodes. Eventually the gaps between the electrodes are bridged and a PEDOT electrical percolation network is formed. Even longer transient times result in PEDOT thin films. This is confirmed by the electrical resistance measured between the two sides of the IDEs. For short transient times there is no electrical connection between the electrodes. For longer transient times connections are formed between the electrodes and the conductance increases. In the phase where there is sharp increase in conductance, the polymer layer acts as a percolation network. For longer transient times the conductance levels off as the polymer layer becomes thin-film-like. This is shown in the percolation data in Fig. 4 where the electrical conductance between the IDEs is plotted against the chronoamperometric transient time, which is equivalent to plotting conductance against amount of polymer deposited. When comparing the information in Fig. 3 and 4 it is interesting to note that the SEM images from 5 s PEDOT growth (Fig. 3b) do not appear to show polymer bridging, however the electrical conduction measurements (Fig. 4) demonstrate that bridging has occurred. This shows that SEM imaging is limited in being able to show the full extent of PEDOT growth. Previous work on PPy based NH3 sensors has shown that sensors operating in the steep part of the percolation curve are significantly more sensitive than those in the thin film regime. This is because near the percolation threshold small local changes in the resistance of the polymer connections due to analyte adsorption have a much bigger impact on the resistance of the network as a whole than in the case of a thin film.8 The large effect on the conductance caused by small variations in the networks is also why, in the percolation region, there is a relatively large variation in conductance for networks grown under the same conditions and for the same chronoamperometric transient time, resulting in the relatively large error bars in Fig. 4.Sensors at different points along the percolation curve, from close to the percolation threshold to thin-film-like sensors, were placed under N2 flow in the sensor testing chamber for 20 minutes. Next the sensors were exposed 4 times to 8 ppm NO2, for 5 minutes per exposure and with a 15 minute recovery time under N2 flow between exposures (Fig. 5). A comparison of the sensor responses of these sensors shows that PEDOT sensors closer to the percolation threshold have a higher sensitivity than thin film sensors. For example, for the first 8 ppm exposure for the sensors in Fig. 3 we observed sensitivities, expressed as ΔR/R0 × 100%, of 0.79%, 5.77%, and 12.9% for sensors with starting resistances of 120 Ω, 20 kΩ, and 950 kΩ, or chronoamperometric transient times of 10 s, 4 s, and 2 s, respectively. This observation, that the sensitivity is greatest for PEDOT polymer percolation networks that are operated in the steepest part of the percolation response curve, is in agreement with previous work on PPy percolation network sensors.8
The first exposure of each of the sensors in Fig. 5 results in an irreversible increase in resistance, in line with the response of PEDOT films to NO2 described in the literature.7 However, none of these sensors have a consistent sensor response for all 4 consecutive exposures to NO2. For the thin-film-like sensor (A) the second, third, and fourth exposures result in irreversible increases in resistance with smaller magnitudes than for the first exposure. For the sensor closest to the percolation threshold (C) later exposures result in a small reversible decrease in resistance. Sensor B is an intermediate case, displaying some smaller reversible decreases in resistance at a later onset than for sensor C.
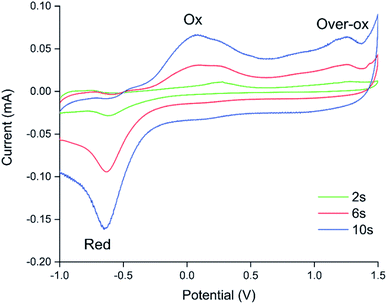
Because electrochemical polymerisation, p-doping, and over-oxidation can all occur at the same time, the PEDOT is already being over-oxidised during the electrochemical polymerisation process. The resulting polymer layer consists of oxidised polymer and polymer in the various over-oxidation stages (Fig. 2). This explains why in Fig. 5 sensor A, with a 10 s deposition time, only displays an irreversible response, whereas sensor B, with a deposition time of 5 s, displays a mixture of irreversible and reversible responses, and sensor C, with a 2 s deposition, has the most pronounced reversible response of the three sensors. The longer the deposition time, the more over-oxidised PEDOT is present. This is supported by cyclic voltammograms of sensors deposited for 2 s, 6 s, and 10 s at 1.3 V, followed by doping at 1.3 V for 60 s (Fig. 6). In cyclic voltammograms over-oxidation is characterized by a second oxidation peak. In agreement with the literature, this second oxidation peak does not have a corresponding reduction peak in the reverse sweep.22,23 The lack of corresponding reduction peak further highlights the irreversible nature of the over-oxidation process. Fig. 6 shows that, as expected longer polymerisation times result in larger oxidation (0.1–0.3 V), over-oxidation (1.2–1.3 V) and reduction (−0.6 V) peaks. The relative magnitudes of the oxidation and over-oxidation peaks are similar for all three samples. Because initially the net sensor response is dominated by the reaction with over-oxidised PEDOT, this means that the irreversible response becomes more dominant at longer deposition times. This also explains why only the irreversible response has been previously reported in the literature. Traditionally chemiresistive sensors consist of a polymer thin film, at relatively long deposition times, and are thus dominated by the irreversible response due to over-oxidation.
Doping potential and (over-)oxidation
It is clear that the duration for which a potential is applied has a large effect on the oxidation state of the resulting PEDOT layer. The polymerisation potential itself cannot be decreased to move away from the potential range at which over-oxidation takes place, because at a lower potential polymerisation does not occur. However, the doping potential can be changed to alter the properties of the resulting polymer layer.To study the effect of the doping potential, 8 sensors were given different doping treatments and their sensing responses were compared. Here, PEDOT thin film sensors were used because they are easier to reproduce than sensors close to the percolation threshold. Sensors close to the percolation threshold display a large amount of variation in their starting resistances, even for sensors created using the same preparation procedures, because close to the percolation threshold small changes to the polymer network have a relatively large impact on the resistance of the network as a whole. Furthermore, using thin-film-like sensors enables better comparison to existing literature, which is mostly on thin-film based devices.
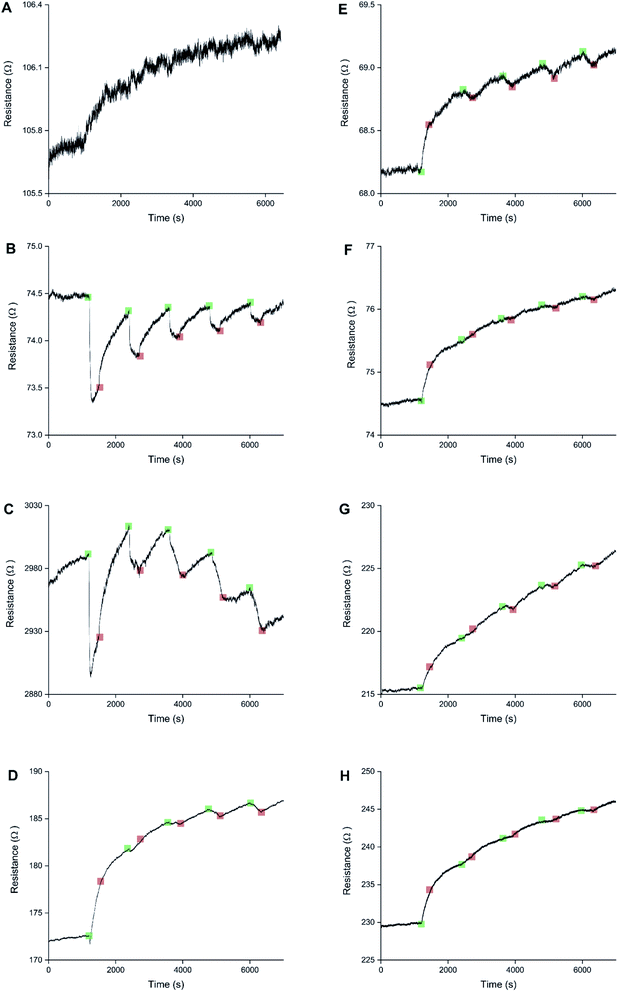
The sensors were created by depositing PEDOT for 10 s at 1.3 V. Next the sensors were either not doped, or doped at 0.1, 0.3, 0.5, 0.7, 0.9, 1.1, or 1.3 V for 60 s (Fig. 7). All 8 sensors underwent 5 cycles of exposure to 8 ppm NO2 for 5 minutes and recovery under N2 for 15 minutes. The un-doped sensor had a very poor signal-to-noise ratio. For the other sensors a clear trend is visible. Low doping potentials result in sensors that have reversible decreases in resistance when exposed to NO2, caused by the oxidised PEDOT. High doping potentials result in irreversible increases in resistance, like previously reported in the literature, caused by the over-oxidised PEDOT. Intermediate doping potentials display crossover behaviour. For intermediate doping potentials the first response or responses are dominated by the irreversible over-oxidised behaviour, while later responses display reversible oxidised behaviour. Sometimes the 2 behaviours can be seen to be competing within the same exposure cycle.
Designing a reversible sensor
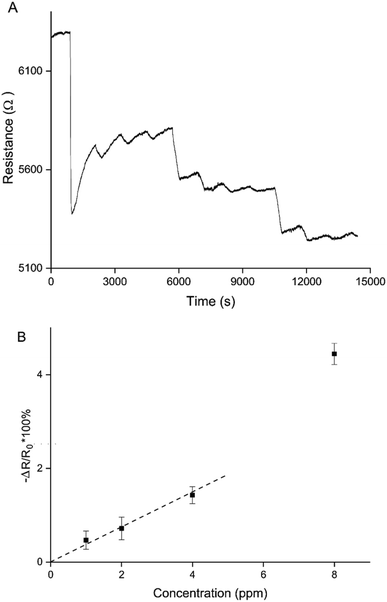
This means that there are 2 ways to control the balance between oxidised and over-oxidised PEDOT, and therefore the (ir)reversible sensing behaviour: the chronoamperometric transient time during polymerisation and the doping potential. Sparser networks, closer to the percolation threshold, and low doping potentials both result in a reversible decrease in resistance, whereas thicker films and higher doping potentials result in irreversible increases in resistance.Making use of both of these control mechanisms, a sensitive and reversible NO2 sensor using only PEDOT was created (Fig. 8). A PEDOT percolation network sensor was created by chronoamperometric polymerisation at 1.3 V for 5 s and doping at 0.1 V for 60 s. This sensor was exposed 3 times to 8 ppm, 4 ppm, 2 ppm and 1 ppm NO2. A sensitive and reversible sensor was created by controlling the PEDOT layer thickness, or polymerisation time, and doping potential (Fig. 8A). Fig. 8B shows the average responses for the 3 exposures per NO2 concentration for this sensor. Using this calibration curve a limit of detection (LOD) can be calculated. The LOD is defined as the gradient of the trend line of the calibration curve divided by 3 times the standard deviation of the baseline noise level before the first exposure. Because the response to 8 ppm was an outlier, resulting in a significantly larger resistance change than expected, it was not included in the trend line. Based on the trend line, the LOD of detection for this particular sensor is 907 ± 102 ppb. This matches the most sensitive commercially available handheld NO2 detectors.
Conclusions
In conclusion, by controlling the polymer coverage and the doping conditions sensitive and reversible PEDOT based chemiresistive NO2 sensors were developed. By operating PEDOT sensors close to the percolation threshold higher sensitivities can be achieved compared to more traditional thin film based sensors. Furthermore, by controlling the polymer coverage and doping potential the oxidised regime can be reliably accessed, resulting in reversible sensors.Although this is an important step towards creating reversible NO2 sensors based on only PEDOT, more work on the effects of for example humidity and other competing vapours in the environment has to be done prior to practical implementation of these sensors.
Finally, it is known that PPy24 and polyindole (PIn)25 can also be over-oxidised, and a similar effect of oxidation and over-oxidation on the sensor response was also observed for PPy sensors responding to NO2 in preliminary studies, but this requires further work.
Conflicts of interest
There are no conflicts to declare.Acknowledgements
We are grateful for support from the EPSRC via the WAFT collaboration (EP/M015173/1) and the Global Challenges Research Fund (GCRF).References
- WHO, Air Quality Guidelines, WHO Regional office for Europe, Denmark, 2000, https://apps.who.int/iris/handle/10665/107335 Search PubMed.
- C. Melios, et al., Detection of ultralow concentration NO2 in complex environment using epitaxial graphene sensors, ACS Sens., 2018, 3, 1666–1674 CrossRef CAS PubMed.
- G. Lu, et al., UV-enhanced room temperature NO2 sensor using ZnO nanorods modified with SnO2 nanoparticles, Sens. Actuators, B, 2012, 162, 82–88 CrossRef CAS.
- E. Zampetti, et al., A high sensitive NO2 gas sensor based on PEDOT–PSS/TiO2 nanofibres, Sens. Actuators, B, 2013, 176, 390–398 CrossRef CAS.
- Y. Lin, et al., Fully gravure-printed NO2 gas sensor on a polyimide foil using WO3-PEDOT: PSS nanocomposites and Ag electrodes, Sens. Actuators, B, 2015, 216, 176–183 CrossRef CAS.
- K. Dunst, D. Jurków and P. Jasiński, Laser patterned platform with PEDOT–graphene composite film for NO2 sensing, Sens. Actuators, B, 2016, 229, 155–165 CrossRef CAS.
- K. Dunst, J. Karczewski and P. Jasiński, Nitrogen dioxide sensing properties of PEDOT polymer films, Sens. Actuators, B, 2017, 247, 108–113 CrossRef CAS.
- B. I. Armitage, K. Murugappan, M. J. Lefferts, A. Cowsik and M. R. Castell, Conducting polymer percolation gas sensor on a flexible substrate, J. Mater. Chem. C, 2020, 8, 12669–12676 RSC.
- M. J. Lefferts, et al., ANFO vapour detection with conducting polymer percolation network sensors and GC/MS, Analyst, 2021, 146, 2186–2193 RSC.
- K. Murugappan and M. R. Castell, Bridging electrode gaps with conducting polymers around the electrical percolation threshold, Electrochem. Commun., 2018, 87, 40–43 CrossRef CAS.
- T. Otero and M. C. Romero, Poly (3, 4-ethylendioxithiophene) (PEDOT) oxidation: activation energy and conformational energy, J. Phys.: Conf. Ser., 2008, 127, 012016 CrossRef.
- A. Zykwinska, W. Domagala, B. Pilawa and M. Lapkowski, Electrochemical overoxidation of poly(3,4-ethylenedioxythiophene)—PEDOT studied by means of in situ ESR spectroelectrochemistry, Electrochim. Acta, 2005, 50, 1625–1633 CrossRef CAS.
- G. Láng, M. Ujvári, S. Vesztergom, V. Kondratiev and J. Gubicza, The electrochemical degradation of poly (3,4-ethylenedioxythiophene) films electrodeposited from aqueous solutions, Z. Phys. Chem., 2016, 230, 1281–1302 CrossRef.
- M. Ujvári, J. Gubicza, V. Kondratiev, K. J. Szekeres and G. Láng, Morphological changes in electrochemically deposited poly (3, 4-ethylenedioxythiophene) films during overoxidation, J. Solid State Electrochem., 2015, 19, 1247–1252 CrossRef.
- J. Fan, et al. Tuning PEDOT: PSS conductivity to obtain complementary organic electrochemical transistor, Org. Electron., 2019, 66, 148–155 CrossRef CAS.
- I. Petsagkourakis, N. Kim, K. Tybrandt, I. Zozoulenko and X. Crispin, Poly(3,4-ethylenedioxythiophene): chemical synthesis, transport properties, and thermoelectric devices, Adv. Electron. Mater., 2019, 5, 1800918 CrossRef CAS.
- K. Dunst, K. Trzciński, B. Scheibe, M. Sawczak and P. Jasiński, Study of the NO2 sensing mechanism of PEDOT-RGO film using in situ Raman spectroscopy, Sens. Actuators, B, 2018, 260, 1025–1033 CrossRef CAS.
- P. Tehrani, et al., The effect of pH on the electrochemical over-oxidation in PEDOT: PSS films, Solid State Ionics, 2007, 177, 3521–3527 CrossRef CAS.
- X. Du and Z. Wang, Effects of polymerization potential on the properties of electrosynthesized PEDOT films, Electrochim. Acta, 2003, 48, 1713–1717 CrossRef CAS.
- U. Barsch and F. Beck, Anodic overoxidation of polythiophenes in wet acetonitrile electrolytes, Electrochim. Acta, 1996, 41, 1761–1771 CrossRef CAS.
- C. M. Hangarter, M. Bangar, A. Mulchandani and N. V. Myung, Conducting polymer nanowires for chemiresistive and FET-based bio/chemical sensors, J. Mater. Chem., 2010, 20, 3131–3140 RSC.
- M. Dietrich, J. Heinze, G. Heywang and F. Jonas, Electrochemical and spectroscopic characterization of polyalkylenedioxythiophenes, J. Electroanal. Chem., 1994, 369, 87–92 CrossRef CAS.
- A. Pud, Stability and degradation of conducting polymers in electrochemical systems, Synth. Met., 1994, 66, 1–18 CrossRef CAS.
- C. Debiemme-Chouvy and T. T. M. Tran, An insight into the overoxidation of polypyrrole materials, Electrochem. Commun., 2008, 10, 947–950 CrossRef CAS.
- M. Ghita and D. W. Arrigan, Electrochemical overoxidation of polyindole and its cation-permselective behavior, Electroanalysis, 2004, 16, 979–987 CrossRef CAS.
Footnote |
| † Present address: Nanotechnology Research Laboratory, Research School of Engineering, Australian National University, Canberra, ACT 2601, Australia. |
| This journal is © The Royal Society of Chemistry 2021 |

