 Open Access Article
Luminescence properties of Ba4Yb3F17:Er3+ nanocrystals embedded in glass ceramics for optical thermometry
Sixing Lia,
Liang Lia,
Wenming Wanga,
Hongmei Chen a,
Yong Li
 *a,
Xianshan Huang*a and
Yan Pan
 *ab
*ab
aSchool of Mathematics and Physics, Anhui University of Technology, Maanshan 243000, China. E-mail: yongli@ahut.edu.cn; huangxs@ahut.edu.cn; yanpan@ahut.edu.cn
bAnalysis and Testing Central Facility, Anhui University of Technology, Maanshan 243000, China
First published on 28th June 2021
Abstract
Transparent glass ceramics (GCs) containing Ba4Yb3F17:Er3+ nanocrystals were successfully fabricated by a traditional melt-quenching method. The formation of Ba4Yb3F17 nanocrystals was confirmed by X-ray diffraction, transmission electron microscopy, and selected area electron diffraction. Compared with the precursor glass, the enhanced emission intensity and lifetime of GCs indicate that the Er3+ ions incorporate into the Ba4Yb3F17 nanocrystals after crystallization. The color tuning properties with doping under 980 nm excitation have been systematically discussed. It was found that the red/green ratio increased with Er3+ ion doping and the corresponding color changed from greenish-yellow to yellow-green. Furthermore, the temperature-dependent luminescence properties were studied in detail by the fluorescence intensity ratio (FIR) technique. The monotonic change of FIR with temperature indicates that this material is suitable for temperature sensing. At a temperature of 450 K, the relative sensitivity of the prepared sample reached its maximal value of 0.20% K−1. The results show that the GCs containing Ba4Yb3F17:Er3+ nanocrystals are candidate materials for temperature sensing.
1. Introduction
Currently, lanthanide (Ln) ion doped upconverting materials with temperature-dependent luminescence properties have attracted noticeable attention due to their potential applications in optical heaters, optical refrigeration, temperature sensors, cancer treatment, and thermal imaging.1–5 The upconverting materials are commonly used in non-contact temperature sensors considering their superior properties in temperature detection, such as fast response, high spatial resolution, excellent precision, and noninvasive operation mode.6,7 Jiang et al.8 reported the thermometry at the nanoscale, which has lifetime-based thermal sensitivities and remarkable fluorescence intensity in the physiological temperature range. Without contacting the measured object, the fluorescence intensity ratio (FIR) technique of optical materials based on non-contact temperature sensors can be used in several particular circumstances, such as biological imaging systems, corrosive circumstances, electrical transformer temperature in power stations, and fire detections. The FIR of two thermally coupled energy levels (TCELs) from Ln ions based on the optical temperature sensor is independent of the variations of test conditions including external disturbance, fluctuations in signal losses, and excitation power.9,10 Thus, the optical thermometer possesses high resolution and accuracy compared to other optical methods, such as amplified spontaneous emission, raise time, and decay time.11,12The separation between TCELs should be in the 200–2000 cm−1 range to avoid the strong overlapping of two emissions and ensure the existence of a sufficient population of the higher level of active optical ions in the interesting temperature range.13,14 A pair of adjacent levels with a narrow energy gap (ΔE) in the 200–2000 cm−1 range can be found in some trivalent Ln ions, such as Dy3+ (4I15/2 and 4F9/2), Nd3+ (4F5/2/2H9/2 and 4F3/2), Ho3+ (5F1/5G6 and 5F2,3/3K8), Tm3+ (3F2,3 and 3H4), and Er3+ (2H11/2 and 4S3/2).15–19 Among these Ln ions, Er3+ is considered an excellent ion for optical thermometry because of its applicable energy gap (∼800 cm−1) and two intense green emissions from 2H11/2 and 4S3/2 TCELs.1 The demand for optical thermometers has greatly stimulated the research of Er3+ doped materials. Yb3+/Er3+ co-doped NaYF4 transparent glass ceramics (GCs) used as an optical-fiber temperature sensor was reported by Jiang et al.11; Yang et al.20 successfully synthesized Yb3+/Er3+ codoped La2O2S phosphor and revealed its promising application in optical thermometry; Zhang et al.21 have reported Er3+ doped SrYbInO4 phosphor used as optical thermometry.
The selection of an appropriate host is essential to obtain excellent temperature detecting performance. The effective luminescence of Ln ions in a suitable host can make spectral acquisition more accurate.22 To improve the properties of an optical thermometer, the temperature-dependent luminescence properties of many materials doped with Ln have been studied, such as glass, ceramics, fluoride nanocrystals (NCs), and organics.1,23–25 There is a big difference in temperature detecting performance among these different materials systems. It is hard to produce effective luminescence in glass, such as alumino-silicate and silica glass host, due to their large number of defects that act as quenching centers and high phonon energy, so they are not suitable for optical temperature measurement. Difficulties such as high preparation costs and complicated synthesis processes are the challenges of transparent ceramics. Fluoride with low phonon energy favors effective luminescence, which makes the emission spectra acquisition more easily, sensitively, and accurately. However, phase transition may occur at high temperatures due to its poor thermal stability, so the repeatability in heating-cooling cycles will be affected. Organics have the advantages of systematically adjusting their sensitivity and being compatible with biological systems, however, their stability at higher temperatures is insufficient, so its operating temperature is limited to the physiological temperature range. Therefore, it is necessary to find novel Er3+ ion doped materials with improved sensitivity, effective luminescence, and good stability to improve the performance of optical thermometers.
So far, many favorable results have been achieved in the research of fluoride and oxide hosts.7,26 Fluoride materials have been drawing widespread attention due to their low phonon energy, for example, Yb3+/Er3+ co-doped hexagonal phase NaYF4 has shown the highest upconversion (UC) luminous efficiency so far.27 In addition, the oxide materials have higher stability than fluoride, which can meet the thermal stability requirements of the temperature sensor for the host.28 For practical applications, it is important to design materials with a wide operating temperature range and excellent luminous intensity. To obtain a host with high physical and chemical stability and meet the requirements of Ln ions for a low phonon energy environment, an ideal host of oxy-fluoride GCs (OXGCs) doped with Ln ions for optical thermometers have been developed. OXGCs are synthesized at suitable temperatures by controlling the crystallization of the fluoride embedded in oxide glass with a specially designed composition. OXGCs not only have the low phonon energy of fluoride but also have the high mechanical stability and durability of oxide. In addition, OXGCs have the advantages of crystal-like optical performance and low-cost synthesis.29 And their ion radius and available valence are suitable for Ln ions doping.30 Therefore, for temperature measurement, OXGCs have the advantages of improved sensitivity, excellent precision, and wide operating temperature range. To produce high-efficiency luminescence in OXGCs, it is necessary to distribute the Ln ions as an optical activator into the fluoride lattice and deposit the required fluoride NCs uniformly. In addition, the transparency of OXGCs needs to be considered. When the size of NCs dispersed in OXGCs is smaller than the wavelength of the light, scattering can be avoided so that the high transparency of OXGCs can be achieved. The optical temperature measurement behavior of OXGCs doped with Ln ions has been extensively studied. Hu et al.31 presented the Sm3+ doped NaGdF4 GC with good stability for optical temperature measurement; the GC containing NCs doped with Yb3+ and Er3+ ions as a temperature sensor was reported by Li et al.32; Jiang et al.11 reported the GC containing NaYF4:Yb3+/Er3+ NCs as an optical thermometer and achieved a high sensitivity of 1.24% K−1 at 300 K.
Yb3+ ions usually act as sensitizers in the UC process since they have a larger absorption cross-section at 980 nm and can effectively transfer energy to other Ln ions.33 Ln ions doped OXGCs are considered as potential candidate probes for optical temperature measurement.34 However, most materials including OXGCs have luminescent thermal quenching behavior, which is the luminescence decreasing phenomenon caused by nonradiative transitions of excited states at high temperatures.35 Fortunately, the introduction of Yb3+ ions can enhance the UC luminous intensity at high temperature.36 In addition, the introduction of Yb3+ ions can prolong the lifetime because the surface quenching mediated by energy transfer (ET) caused by heating is alleviated.37 Therefore, fluoride NCs based on Yb3+ ions such as NaYbF4, LiYbF4, SrYbF5, and BaYbF5 have received widespread attention, and all results indicate that these UC materials are excellent host.18,38–40 For example, the luminous intensity of the Ln doped sensitizer-rich LiYbF4 with intense UC luminescence reported by Zou et al.38 increases with temperature because the 2F5/2 higher levels of Yb3+ ions are thermally excited, which is the cooperative ET process of Yb3+ ions. Moreover, the Ln doped NaYbF4 with the same crystal structure as the LiYbF4 reported by Du et al.18 also exhibited a negative thermal quenching effect and bright visible UC emissions. However, so far there is no research on Ba4Yb3F17:Er3+ NCs embedded GCs used for optical temperature measurement. And the Ba4Y3F17 reported by Grube et al.41 can produce effective luminescence after doping with Ln ions. Therefore, it seems feasible to study the optical thermometry behavior of Ba4Yb3F17:Er3+ NCs embedded GCs with possible effective luminescence.
Here, the transparent aluminum silicate GCs containing Ba4Yb3F17:Er3+ NCs were successfully synthesized by a traditional melt-quenching method and a detailed study on their UC emission behaviors has been performed. The optical temperature measurement performance based on the FIR of Er3+ ions green emissions was systematically explored at low-power laser 980 nm excitation to reduce the heating effect of Yb3+ ions. The results show that the transparent aluminum silicate GCs containing Ba4Yb3F17:Er3+ NCs are promising candidate materials for optical temperature measurement.
2. Experimental
Er3+ doped Ba4Yb3F17 GCs were elaborated through melt-quenching technique with the following constituent: 62SiO2–15Na2CO3–7Al2O3–3NaF–6BaF2–(7 − x)YbF3–xErF3 (x = 0.2, 0.4, 0.8, 1.6 mol%). The raw materials of SiO2 (AR), Na2CO3 (AR), Al2O3 (AR), NaF (AR), BaF2 (AR), and high purity YbF3 (4 N), ErF3 (4 N) were completely mixed in an agate mortar and then fused in alumina cauldron at 1500 °C for 30 min. The melts were dumped onto a warmed (300 °C) copper plate and squeezed rapidly by another plate to produce precursor glass (PG). Afterward, PG was annealed at 450 °C for 3 h to release the internal defect and was cut and polished to a ∼2 mm thickness. The acquired samples were consequently cut into pieces and heat-treated at 600 °C and 650 °C for 2 h to produce GCs (labeled as GC600 and GC650 respectively).The measurements of the X-ray diffraction (XRD) are performed on a diffractometer (Bruker D8 advance) with Cu Kα radiation over the angular range 10° ≤ 2θ ≤ 80°. The optical transmittance of the samples is measured by an ultraviolet-visible (UV-vis) spectrophotometer (Hitachi U-3700). Microstructural characterization of the resultant GCs was conducted by a transmission electron microscope (TEM, JEM-2010) assembled with the selected area electron diffraction (SAED). The temperature-dependent UC luminescence was measured by an Omni-λ5028i monochromator equipped with a temperature controller (Lake Shore Model 335). Decay curves were obtained by Tektronix TDS2024 digital storage oscilloscope equipped with a tunable 980 nm pulse laser as the excitation source (Model Opolette 355 LD OPO system).
3. Result and discussion
3.1 Structure and characterization
Fig. 1(a) is the XRD patterns of PG and GCs samples. PG exhibits a feature of the amorphous phase because it has only one hump peak. The diffraction peaks corresponding to the Ba4Yb3F17 phase (PDF #44-0956) are observed after heat treatment, indicating that NCs are deposited in PG. Fig. 1(b) is the XRD patterns of different ErF3 concentrations doped GCs. The doping of ErF3 does not change the crystal phase because the diffraction peaks are almost unchanged.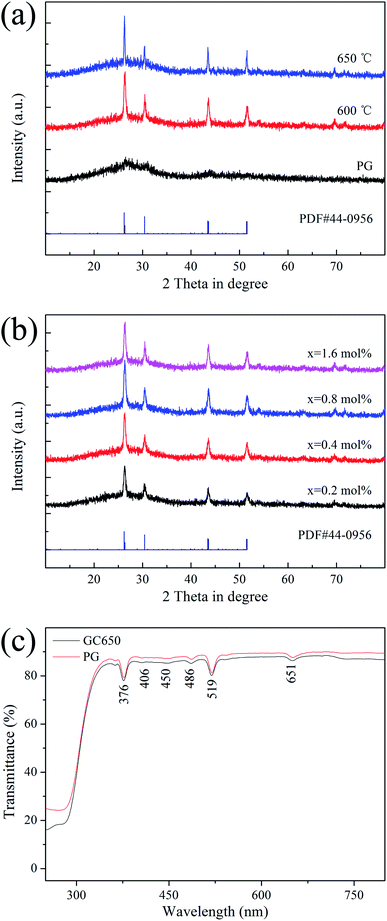 | ||
| Fig. 1 XRD patterns of (a) PG, GC600, GC650 and (b) xErF3 doped GCs (x = 0.2, 0.4, 0.8, 1.6 mol%). (c) Transmittance spectra of PG and GC650. | ||
Fig. 1(c) is the transmittance spectra of PG and GC samples with a ∼2 mm thickness. In the visible range, the transmittance of PG and GC is higher than 80%. And the transmittance of GC is lower than that of PG, which is caused by the scattering and absorption of incident light by the crystal grains and the agglomeration of the crystal grains in the glass caused by the increase of the crystal grain size. Some absorption peaks at 376, 406, 450, 486, 519, 651 nm are observed, which correspond to the transition of Er3+ ion from 4I15/2 ground state to 4G11/2, 2H9/2, 4F5/2, 4F7/2, 2H11/2, 4F9/2 excited states, respectively.
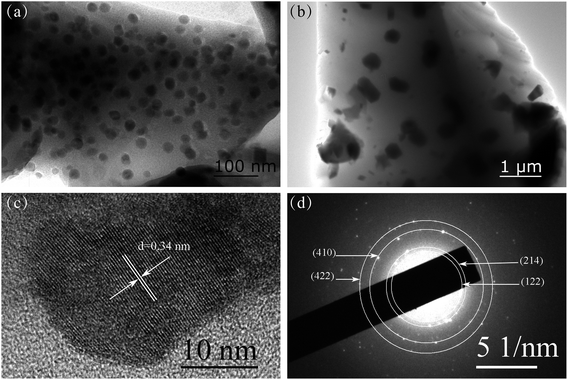
Fig. 2(a) and (b) are TEM images of GC600 and GC650 respectively. For GC600, spherical particles with an average size of 23.0 nm are observed. And the size of NCs increases as the heat treatment temperature increases to 650 °C. Fig. 2(c) is the HRTEM image of GC600. The clear lattice fringe with an interplanar plane distance of 0.34 nm corresponding to the (006) plane of Ba4Yb3F17 is observed. The SAED pattern of GC600 is shown in Fig. 2(d). The diffraction rings from the inside to the outside corresponds to the plane (122), (214), (410), and (422) of Ba4Yb3F17 respectively. It is proved that these NCs are Ba4Yb3F17 phase, which is consistent with the XRD result.
3.2 Upconversion luminescence and excitation mechanism of upconversion
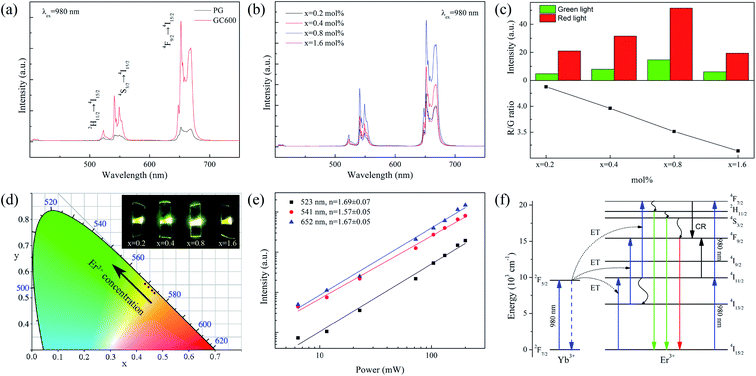
Fig. 3(a) shows the UC spectra of PG and GC600 excited by a 980 nm laser. The characteristic luminescence peaks at 523, 541, and 652 nm are caused by the transitions of Er3+ ions from 2H11/2, 4S3/2, and 4F9/2 to 4I15/2, respectively. The luminescence intensity is significantly enhanced after heat treatment, which is caused by the Er3+ ion doped into Ba4Yb3F17 NCs with lower phonon energy after crystallization. Fig. 3(b) is the UC spectra of the xErF3 doped GCs (x = 0.2, 0.4, 0.8, 1.6 mol%). The luminescence intensity of Er3+ ions increases with the doping of ErF3 and reaches the maximum when the doping concentration is 0.8 mol%. This phenomenon is caused by the increase of activator concentration. The luminescence intensity decreases with the further increase of the doping concentration due to the concentration quenching effect.Fig. 3(c) is the red to green emission ratio of GCs doped with xErF3 (x = 0.2, 0.4, 0.8, 1.6 mol%). The luminescence intensity of both red and green increases with the doping of ErF3 and reaches the maximum when the doping concentration is 0.8 mol%. This phenomenon is caused by the increase of activator concentration. The luminescence intensity of both red and green decreases with the further increase of the doping concentration due to the concentration quenching effect. However, the red to green emission ratio decreases from 4.37 to 3.14 with the doping of ErF3. It starts from the 4F7/2(Er3+) + 4I11/2(Er3+) → 24F9/2(Er3+) cross-relaxation (CR) to explain the phenomenon that the red/green ratio decreases with the doping of Er3+ ions. The promotion of the CR is caused by the absorption of a photon with a wavelength of 980 nm by Er3+ ions or the ET from Yb3+ to Er3+ ions. For the first case, the 4I15/2 → 4I11/2 transition of Er3+ ions occurs by absorbing a 980 nm photon, followed by the 4I11/2 → 4F7/2 transition of Er3+ ions by absorbing the second photon. For the second case, the 2F7/2 → 2F5/2 transition of Yb3+ ions occurs through absorbing a 980 nm photon. The 4I15/2 → 4I11/2 and 4I11/2 → 4F7/2 transition of Er3+ ions occur sequentially by absorbing the energy from Yb3+ ions. Since the absorption of Er3+ ions at 980 nm is weaker than Yb3+ ions, the CR is mainly affected by the ET process described in the second case.42 In this Er3+ doped Yb3+ based system, when the Er3+ ions concentration increases, the Yb3+ ions concentration decreases, and the ET and CR decrease sequentially. Finally, the red (4F9/2 → 4I15/2) emission produced by the CR decreases sharply. The output color changes from greenish-yellow (0.47, 0.52) to yellow-green (0.43, 0.55) with the doping of ErF3 (Fig. 3(d)) and the emitting light is obvious to the naked eyes (inset, Fig. 3(d)). The chromaticity coordinates at different doping concentrations are listed in Table 1.
| Samples | CIE | Fluorescence lifetime (μs) | ||
|---|---|---|---|---|
| 2H11/2 | 4S3/2 | 4F9/2 | ||
| PG | — | 82.85 | 86.85 | 214.77 |
| GC600 | — | 125.07 | 128.58 | 376.65 |
| x = 0.2 mol% | (0.47, 0.52) | 125.07 | 128.58 | 376.65 |
| x = 0.4 mol% | (0.46, 0.53) | 113.19 | 128.56 | 409.50 |
| x = 0.8 mol% | (0.45, 0.54) | 95.17 | 106.78 | 357.68 |
| x = 1.6 mol% | (0.43, 0.55) | 68.22 | 79.85 | 236.08 |
The power-dependent UC emission intensity is studied to interpret the UC mechanism of the ErF3 doped GCs, as Fig. 3(e) shows. Generally, the emission intensity (I) and pump power (P) follow the formula I ∝ Pn, where n is the number of photons absorbed by each high-energy photon emitted. The slope of the linear fit is 1.69 for 2H11/2 → 4I15/2 (523 nm), 1.57 for 4S3/2 → 4I15/2 (541 nm), and 1.67 for 4F9/2 → 4I15/2 (652 nm), respectively. This means that these emissions are two-photon processes. The possible UC mechanism based on ET is shown in Fig. 3(f). By absorbing a 980 nm photon, the 2F7/2 → 2F5/2 transition of Yb3+ ions occurs. The 4I15/2 → 4I11/2 and 4I11/2 → 4F7/2 transition of Er3+ ions occur sequentially by absorbing the energy from Yb3+ ions. The transition from 4F7/2 to 2H11/2/4S3/2 and 4F9/2 of Er3+ ions occurs sequentially through a nonradiative relaxation process. Meanwhile, the 4I13/2 → 4F9/2 transition of Er3+ ions occurs through the nonradiative 4I11/2 → 4I13/2 relaxation. Finally, the green emission (2H11/2 → 4I15/2, 4S3/2 → 4I15/2) and red (4F9/2 → 4I15/2) emission of Er3+ ions take place.
3.3 Decay behaviors
Fig. 4 is the decay curves of all samples at different emissions. All curves can be well fitted with the following single-exponential function,
I(t) = A1![[thin space (1/6-em)]](https://www.rsc.org/images/entities/char_2009.gif) exp(−t/τ1) + A2 exp(−t/τ1) + A2![[thin space (1/6-em)]](https://www.rsc.org/images/entities/char_2009.gif) exp(−t/τ2) exp(−t/τ2)
| (1) |
 | (2) |
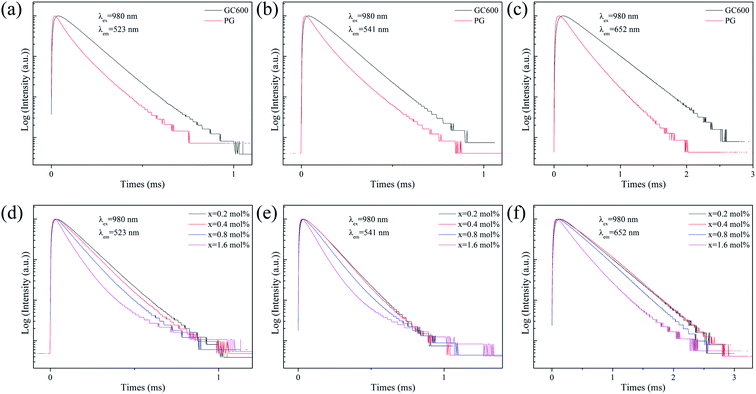 | ||
| Fig. 4 Fluorescence decay curves of Er3+ ion at (a and d) 523 nm, (b and e) 541 nm and (c and f) 652 nm emission in PG, GC600 and xErF3 doped GCs (x = 0.2, 0.4, 0.8, 1.6 mol%). | ||
The fluorescence lifetimes of all samples are summarised in Table 1. For the lifetime of PG and GC600 at different emissions derived from the decay curves shown in Fig. 4(a–c), the lifetime of all emissions in GC600 is longer than that in PG. This phenomenon is caused by the decrease of the nonradiative relaxation rate of Er3+ ions in Ba4Yb3F17 NCs with lower phonon energy.7 The increased lifetime also proves that Er3+ ions incorporate into the Ba4Yb3F17 NCs after crystallization. For the lifetime of GCs at different doping concentrations derived from the decay curves shown in Fig. 4(d–f), almost all emission decreases with the doping of ErF3, which is caused by the concentration quenching effect.
3.4 Optical thermometry behavior
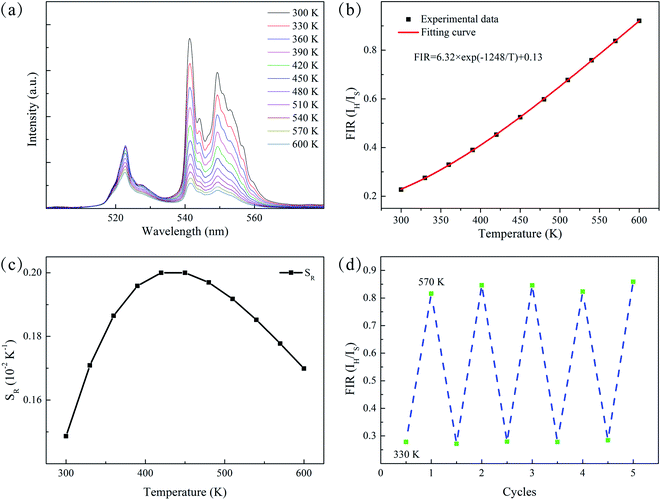
A detailed study on temperature-dependent luminescence behavior has been performed to evaluate the practical application of the thermometers. Fig. 5(a) is the UC luminescence spectra of ErF3 doped GC in the range 300–600 K. Since thermal quenching can cause nonradiative relaxation, it is easy to observe the phenomenon that the luminous intensity decreases with temperature. This material can be used for temperature measurement because the population of the 2H11/2 and 4S3/2 of Er3+ ions follows the Boltzmann distribution. As shown in Fig. 5(b), the FIR of 2H11/2 → 4I15/2 and 4S3/2 → 4I15/2 transition monotonically increases from 0.23 to 0.92 as the temperature increases from 300 to 600 K. The FIR from the TCELs is expressed by,43
 | (3) |
| FIR = 6.23 × exp(−1248/T) + 0.13 | (4) |
The energy gap ΔE obtained is 868 cm−1, which is derived from the well fit of formula (3) to the experimental FIR data. The relative sensitivity (SR) of optical thermometers is an important parameter to evaluate the optical thermometric performance of luminescent materials. The SR is expressed by,
 | (5) |
Fig. 5(c) is the corresponding curve of SR vs. T change. The SR first increases and then decreases as the temperature increases from 300 to 600 K. At the temperature of 450 K, the SR of the prepared sample reached its maximal value of 0.20% K−1. Multiple temperature-recycle experiments show good repeatability and reversibility, as shown in Fig. 5(d). All these results show that the GCs containing Ba4Yb3F17:Er3+ NCs are candidate materials for temperature sensing.
4. Conclusion
In summary, transparent GCs containing Ba4Yb3F17:Er3+ NCs were successfully fabricated by a traditional melt-quenching method. Compared with PG, the enhanced emission intensity and lifetime of GC indicate the successful deposition of Ba4Yb3F17 NCs in the glass host after heat treatment. The green emissions at 523 and 541 nm from the transitions of 2H11/2 and 4S3/2 TCELs to 4I15/2 were observed. The relationship between FIR and T has been explored to evaluate the optical thermometric performance. At the temperature of 450 K, the SR of the prepared sample reached its maximal value of 0.20% K−1, and ΔE is 868 cm−1. This shows that the GCs containing Ba4Yb3F17:Er3+ NCs are candidate materials for temperature sensing.Conflicts of interest
There are no conflicts to declare.References
- P. Du, L. Luo, X. Huang and J. S. Yu, J. Colloid Interface Sci., 2018, 514, 172–181 CrossRef CAS PubMed.
- G. Z. Dong and X. L. Zhang, J. Opt. Soc. Am. B, 2013, 30, 3041–3047 CrossRef CAS.
- J. Zhong, D. Chen, Y. Peng, Y. Lu, X. Chen, X. Li and Z. Ji, J. Alloys Compd., 2018, 763, 34–48 CrossRef CAS.
- X. Zhu, J. Li, X. Qiu, Y. Liu, W. Feng and F. Li, Nat. Commun., 2018, 9, 2176 CrossRef.
- L. Aigouy, G. Tessier, M. Mortier and B. Charlot, Appl. Phys. Lett., 2005, 87, 184105 CrossRef.
- H. Yu, S. Li, Y. S. Qi, W. Lu, X. Yu, X. H. Xu and J. B. Qiu, J. Lumin., 2018, 194, 433–439 CrossRef CAS.
- F. F. Hu, J. K. Cao, X. T. Wei, X. Y. Li, J. J. Cai, H. Guo, Y. H. Chen, C. K. Duan and M. Yin, J. Mater. Chem. C, 2016, 4, 9976–9985 RSC.
- G. C. Jiang, X. T. Wei, Y. H. Chen, C. K. Duan, M. Yin, B. Yang and W. W. Cao, Mater. Lett., 2015, 143, 98–100 CrossRef CAS.
- H. Suo, C. Guo, J. Zheng, B. Zhou, C. Ma, X. Zhao, T. Li, P. Guo and E. M. Goldys, ACS Appl. Mater. Interfaces, 2016, 8, 30312–30319 CrossRef CAS.
- D. Q. Chen, S. Liu, Z. Y. Wan and Z. G. Ji, J. Phys. Chem. C, 2016, 120, 21858–21865 CrossRef CAS.
- S. Jiang, P. Zeng, L. Liao, S. Tian, H. Guo, Y. Chen, C. Duan and M. Yin, J. Alloys Compd., 2014, 617, 538–541 CrossRef CAS.
- M. Dramićanin, in Luminescence Thermometry, ed. M. Dramićanin, Woodhead Publishing, 2018, pp. 63–83, DOI:10.1016/b978-0-08-102029-6.00004-x.
- X. Liu, T. Li, X. Zhao, H. Suo, Z. Zhang, P. Zhao, S. Gao and M. Niu, Dalton Trans., 2018, 47, 6713–6721 RSC.
- D. Manzani, J. F. Petruci, K. Nigoghossian, A. A. Cardoso and S. J. Ribeiro, Sci. Rep., 2017, 7, 1–11 CrossRef PubMed.
- Z. Cao, S. Zhou, G. Jiang, Y. Chen, C. Duan and M. Yin, Curr. Appl. Phys., 2014, 14, 1067–1071 CrossRef.
- W. Xu, H. Zhao, Z. Zhang and W. Cao, Sens. Actuators, B, 2013, 178, 520–524 CrossRef CAS.
- W. Xu, X. Gao, L. Zheng, Z. Zhang and W. Cao, Opt. Express, 2012, 20, 18127–18137 CrossRef CAS PubMed.
- P. Du, L. Luo and J. S. Yu, J. Alloys Compd., 2018, 739, 926–933 CrossRef CAS.
- Y. Li, W. Wang, Y. Pan, H. Chen, Q. Cao and X. Wei, CrystEngComm, 2020, 22, 6302–6309 RSC.
- Y. M. Yang, C. Mi, F. Yu, X. Y. Su, C. F. Guo, G. Li, J. Zhang, L. L. Liu, Y. Z. Liu and X. D. Li, Ceram. Int., 2014, 40, 9875–9880 CrossRef CAS.
- N. Z. Zhang, M. S. Molokeev, Q. L. Liu and Z. G. Xia, J. Mater. Chem. C, 2018, 6, 7361–7366 RSC.
- J. K. Cao, X. M. Li, Z. X. Wang, Y. L. Wei, L. P. Chen and H. Guo, Sens. Actuators, B, 2016, 224, 507–513 CrossRef CAS.
- S. Tabanli and G. Eryurek, Sens. Actuators, A, 2019, 285, 448–455 CrossRef CAS.
- S. Hu, C. H. Lu, X. X. Liu and Z. Z. Xu, Opt. Mater., 2016, 60, 394–397 CrossRef CAS.
- Y. Cui, F. Zhu, B. Chen and G. Qian, Chem. Commun., 2015, 51, 7420–7431 RSC.
- B. Dong, D. P. Liu, X. J. Wang, T. Yang, S. M. Miao and C. R. Li, Appl. Phys. Lett., 2007, 90, 181117 CrossRef.
- S. Wang, J. Lin, Y. He, J. Chen, C. Yang, F. Huang and D. Chen, Chem. Eng. J., 2020, 394, 124889 CrossRef CAS.
- J. Chen, S. Wang, J. Lin and D. Chen, Nanoscale, 2019, 11, 22359–22368 RSC.
- X. Li, D. Chen, F. Huang, G. Chang, J. Zhao, X. Qiao, X. Xu, J. Du and M. Yin, Laser Photonics Rev., 2018, 12, 1800030 CrossRef.
- P. Haro-González, I. Martín, L. Martín, S. F. León-Luis, C. Pérez-Rodríguez and V. Lavín, Opt. Mater., 2011, 33, 742–745 CrossRef.
- F. F. Hu, Y. C. Jiang, Y. H. Chen, R. F. Wei, H. Guo and C. K. Duan, J. Alloys Compd., 2021, 867, 159160 CrossRef CAS.
- X. Li, L. Qiu, Y. Chen, Y. Zhu, H. Yu, J. Zhong, T. Yang and Q. Mao, RSC Adv., 2021, 11, 2066–2073 RSC.
- P. P. Fedorov, A. A. Luginina and A. I. Popov, J. Fluorine Chem., 2015, 172, 22–50 CrossRef CAS.
- F. Hu, S. Lu, Y. Jiang, R. Wei, H. Guo and M. Yin, J. Lumin., 2020, 220, 116971 CrossRef CAS.
- A. M. Pires, O. A. Serra, S. Heer and H. U. Güdel, J. Appl. Phys., 2005, 98, 063529 CrossRef.
- J. Zhou, S. Wen, J. Liao, C. Clarke, S. A. Tawfik, W. Ren, C. Mi, F. Wang and D. Jin, Nat. Photonics, 2018, 12, 154–158 CrossRef CAS.
- Z. L. Ji, Y. Cheng, X. S. Cui, H. Lin, J. Xu and Y. S. Wang, Inorg. Chem. Front., 2019, 6, 110–116 RSC.
- Q. Zou, P. Huang, W. Zheng, W. You, R. Li, D. Tu, J. Xu and X. Chen, Nanoscale, 2017, 9, 6521–6528 RSC.
- L. Gong, J. Yang, Y. Li, M. Ma, C. Xu, G. Ren, J. Lin and Q. Yang, J. Mater. Sci., 2013, 48, 3672–3678 CrossRef CAS.
- Y. Liu, K. Ai, J. Liu, Q. Yuan, Y. He and L. Lu, Adv. Healthcare Mater., 2012, 1, 461–466 CrossRef CAS PubMed.
- J. Grube and G. Krieke, J. Lumin., 2018, 203, 376–384 CrossRef CAS.
- C. F. Xu, Q. B. Yang, G. Z. Ren and Y. X. Liu, J. Alloys Compd., 2010, 503, 82–85 CrossRef CAS.
- P. Du and J. S. Yu, Mikrochim. Acta, 2018, 185, 237 CrossRef PubMed.
| This journal is © The Royal Society of Chemistry 2021 |

